Executive Summary
Education provides the best chance for children to break the cycle of poverty and homelessness. Not only is academic achievement crucial for life outcomes, but the social and emotional development that happens in school is vital as well. The connections created in the classroom are even more critical for any child who has experienced housing instability and homelessness.
More than 140,000 children attending New York City public schools have experienced homelessness within the past six years. Together, these children would form a city larger than White Plains and New Rochelle combined, with roughly the same population size as Syracuse, New York. Given the prevalence of homelessness among school-age students, educators and policymakers need to understand the educational challenges that students experiencing homelessness face, and the opportunities that exist to help students in temporary housing succeed.
Homelessness is more than a lack of housing. For the more than 140,000 students in New York City who have been homeless, the impact of housing instability is all too real. These children are not only struggling with maintaining a place to sleep, but also attending school, succeeding academically, and accessing supports for their additional educational and behavioral needs. Improving student achievement for homeless and formerly homeless students is not as simple as addressing a student’s housing, but knowing more about homeless students’ experiences in school is an important step to addressing their unique support needs.
The 2017 Atlas of Student Homelessness in New York City builds on the 2016 Atlas of Student Homelessness, providing a more in-depth look at the educational outcomes of homeless students. Using a six-year cohort of elementary students, this publication highlights the educational risks faced by the one in seven children who will experience housing instability by the end of elementary school if current trends do not change. This publication also reveals the different educational risks faced by students living in shelters compared to those living doubled up or in other temporary situations, as well as outcomes of formerly homeless students, who experience continued instability in the classroom.
What’s New?
- The number of homeless students in NYC public schools increased by almost 33,000 students—a 50 percent jump— in six years.
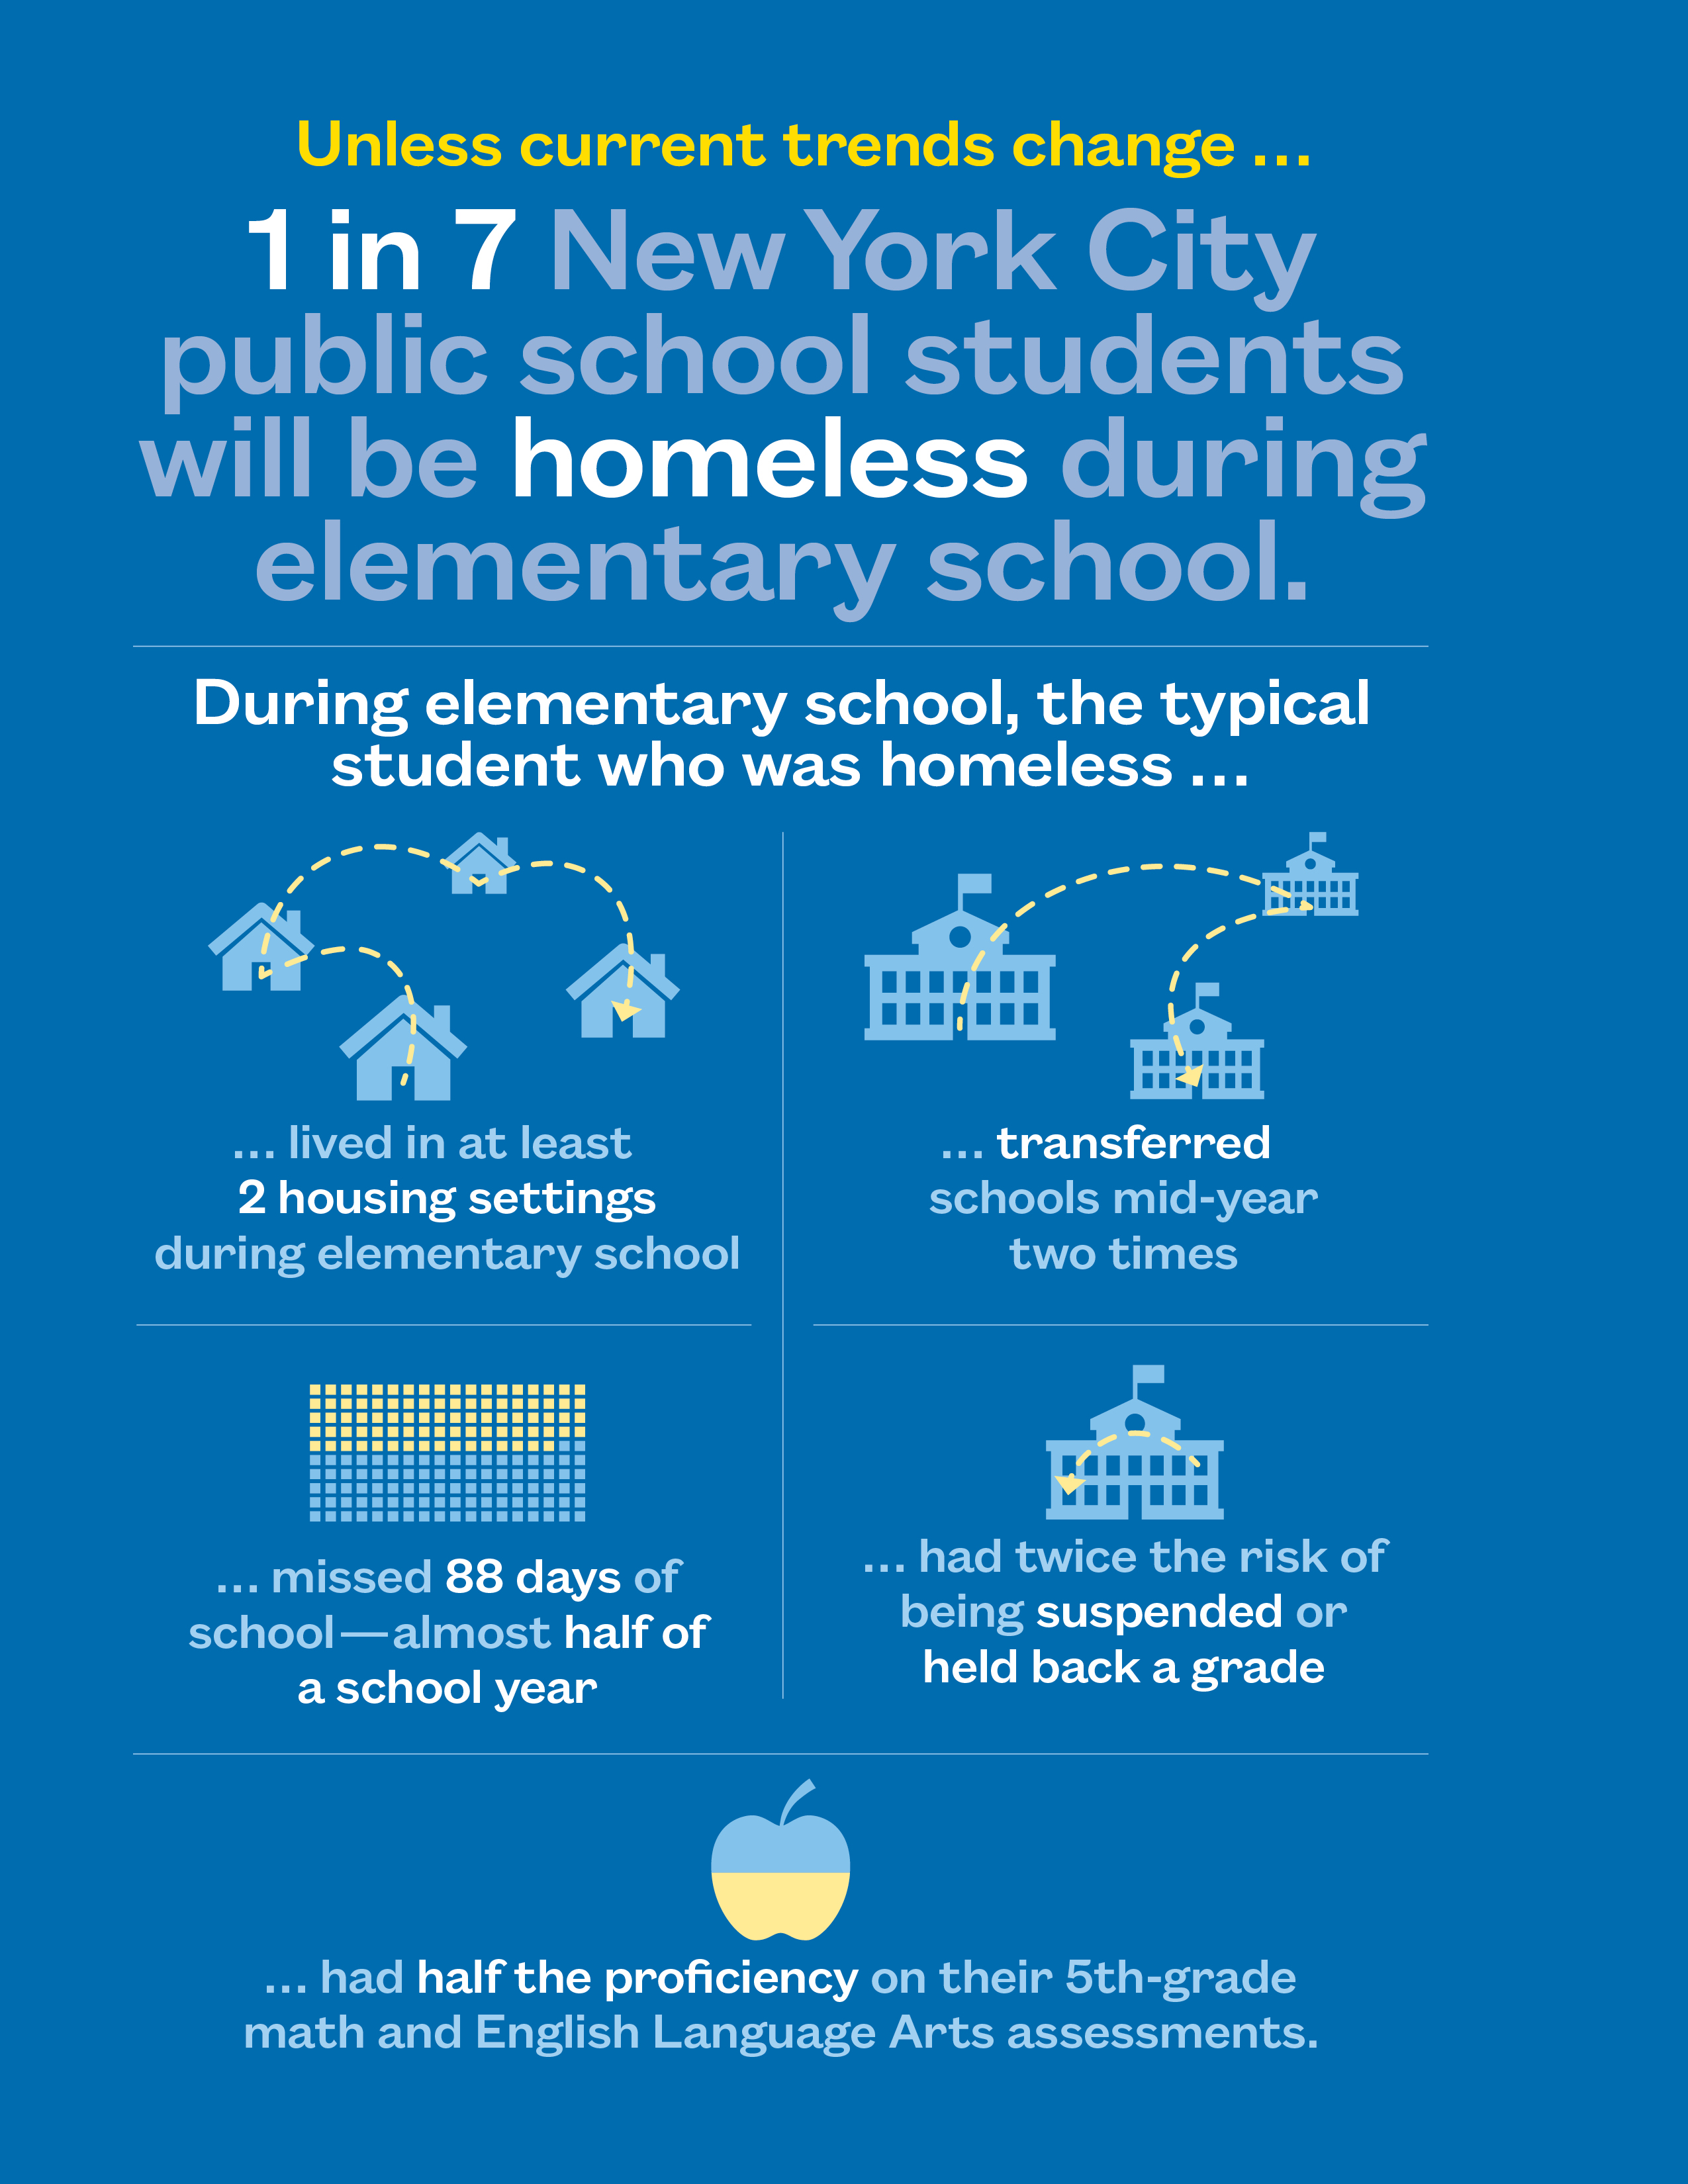
- If current trends continue, more than one out of seven NYC public school students will experience homelessness at least once by the time they reach fifth grade.
- Despite improvement in academic outcomes between SY 2010–11 and SY 2015–16, gaps by housing status and type of homelessness persist. Students in shelter achieve proficiency on 3rd–8th grade math State assessments at just half the rate of homeless students living doubled up.
- Even after moving into stable housing, students with a history of homelessness experience lasting effects of instability, with 1.5 times the chronic absenteeism and mid-year transfer rates of their low-income peers who had always been housed.
Policy Considerations
- The way that available data are used must change in order to effectively improve educational outcomes for homeless students. Schools, service providers, policymakers, and elected officials need to look at the type of homelessness students experience, since gaps between sheltered and other homeless students are persistent.
- Additional supports in schools like IEP and ELL programs must take students’ housing status into consideration when delivering services. Students who have been homeless are more likely to need additional educational and language learning supports, but are less likely to receive those supports in a timely and effective manner. IEP and ELL programs must consider the unstable housing situations that many students are facing and the unique challenges placed on their attendance and school stability.
- It is critical to recognize that the effects of homelessness last beyond the experience itself. Available data that show whether students have a history of homelessness should be made more accessible to teachers and administrators, and can help ensure that supports exist both for students who are currently living in unstable housing as well as those who have been homeless in the past.
- A student’s record of homelessness is only captured roughly once per year. This fails to account for students who experienced homelessness later in the year, and also does not provide a full picture of the students’ history of homelessness to teachers and school administrators.
Key Citywide Findings
- The number of homeless students in NYC public schools jumped by 20% in just one year, reaching close to 100,000 in SY 2015–16.
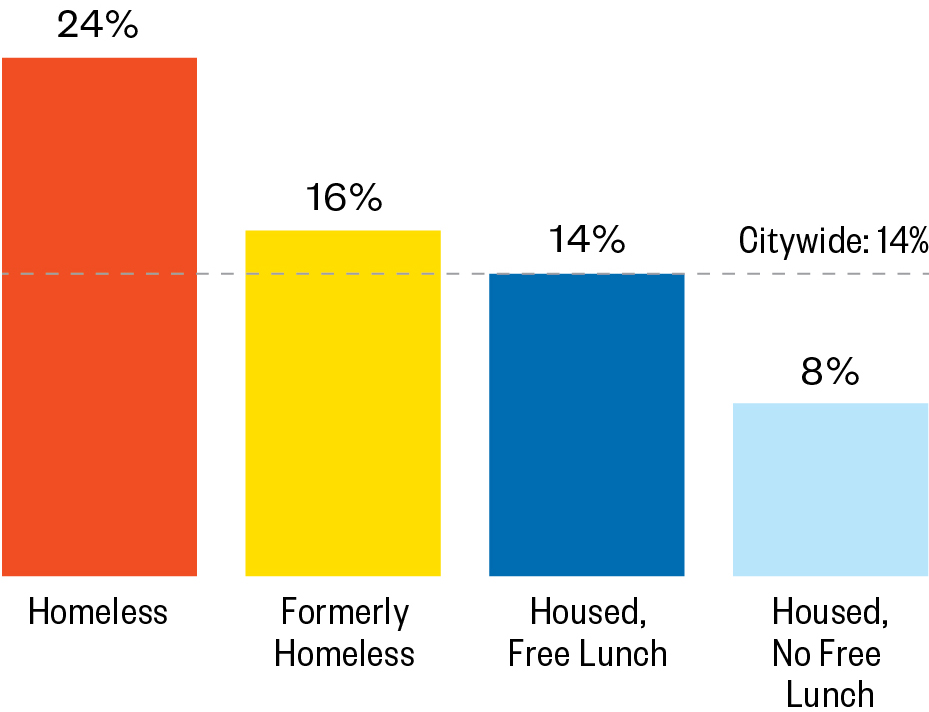
- An average of nine percent of New York City public school students were homeless in one year (SY 2015–16).
- In addition to the nine percent of students homeless in SY 2015–16, another four percent were currently housed but had experienced homelessness at some point since SY 2010–11 (formerly homeless).
- The City has succeeded in increasing pre-K enrollment among homeless children, with a 17% increase from SY 2014–15 to SY 2015–16.
- On average, 6.6% of students in New York City charter schools were homeless in SY 2015–16—three points lower than the rate of students experiencing homelessness in public schools (9.3%).
- Students who had a history of homelessness but were housed in SY 2015–16 (formerly homeless) were still facing instability at school. Almost a third were chronically absent and 13% transferred schools mid-year compared to 19% and 7% among housed students citywide.
- Absenteeism places students at risk of not only falling behind academically, but also having their additional support needs be identified later. Homeless students who were absent 40 or more days in Kindergarten had a 12-point higher rate of late IEP identification compared to their homeless peers with 0–4 absences.
- One in every six English Language Learner (ELL) students was homeless in SY 2015–16. The majority (82%) of homeless students with ELL needs were living doubled up.
- Homeless students were not only more likely to have ELL needs, but they were also more likely to be designated as ELL for longer than their housed peers who were both low income and not low income. More than 40% of homeless ELL students still had ELL needs after six years compared to one-third of low-income housed students and only 4% of non-low-income housed students.
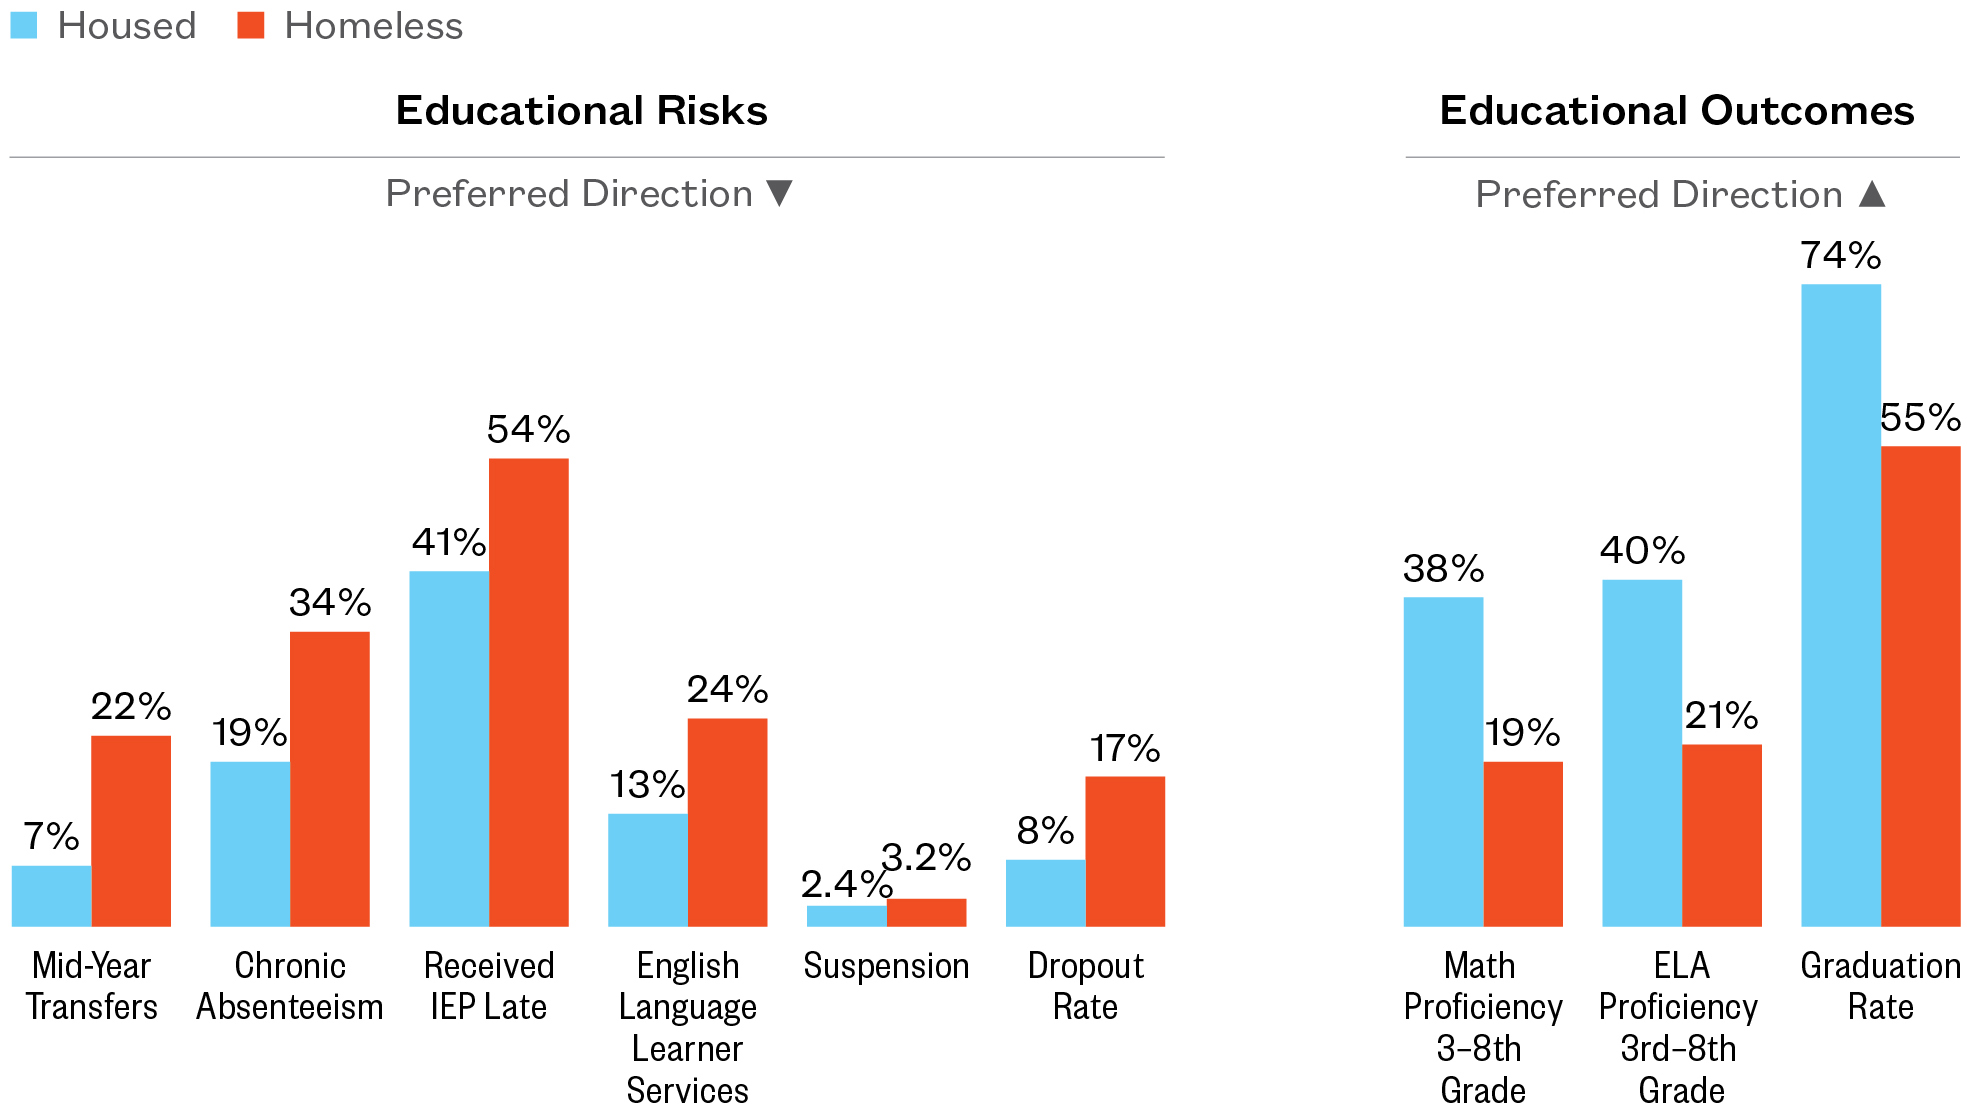
- Amidst citywide policy and curricula changes over time, achievement gaps by housing status persisted. Homeless students scored proficient at roughly half the rate of housed students overall on State English Language Arts (ELA) assessments (21% to 40% in SY 2015–16).
- Middle school proficiency is a strong predictor of dropping out of high school: overall, 16.5% of those who were not proficient ended up dropping out compared to 3.6% of students who did score proficient. For homeless students, this is an even stronger predictor. One in four (24.5%) homeless students who did not score proficient in middle school dropped out of high school.
How Are Homeless Students Faring?
SY 2015–16
Key District-Level Findings
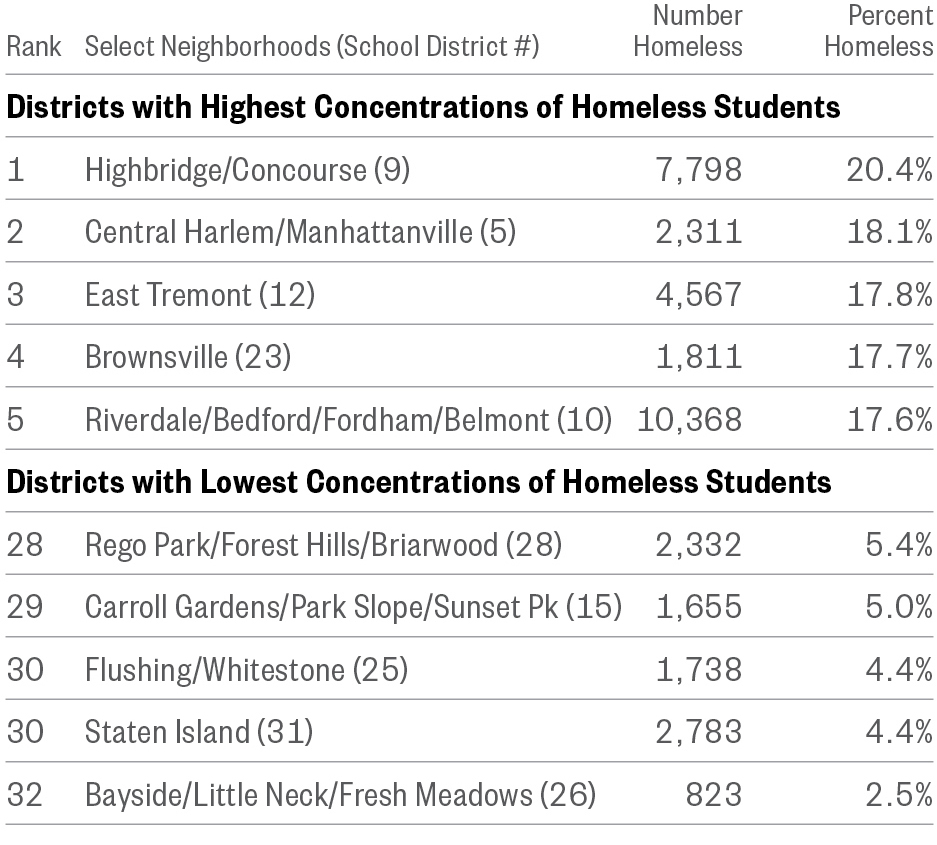
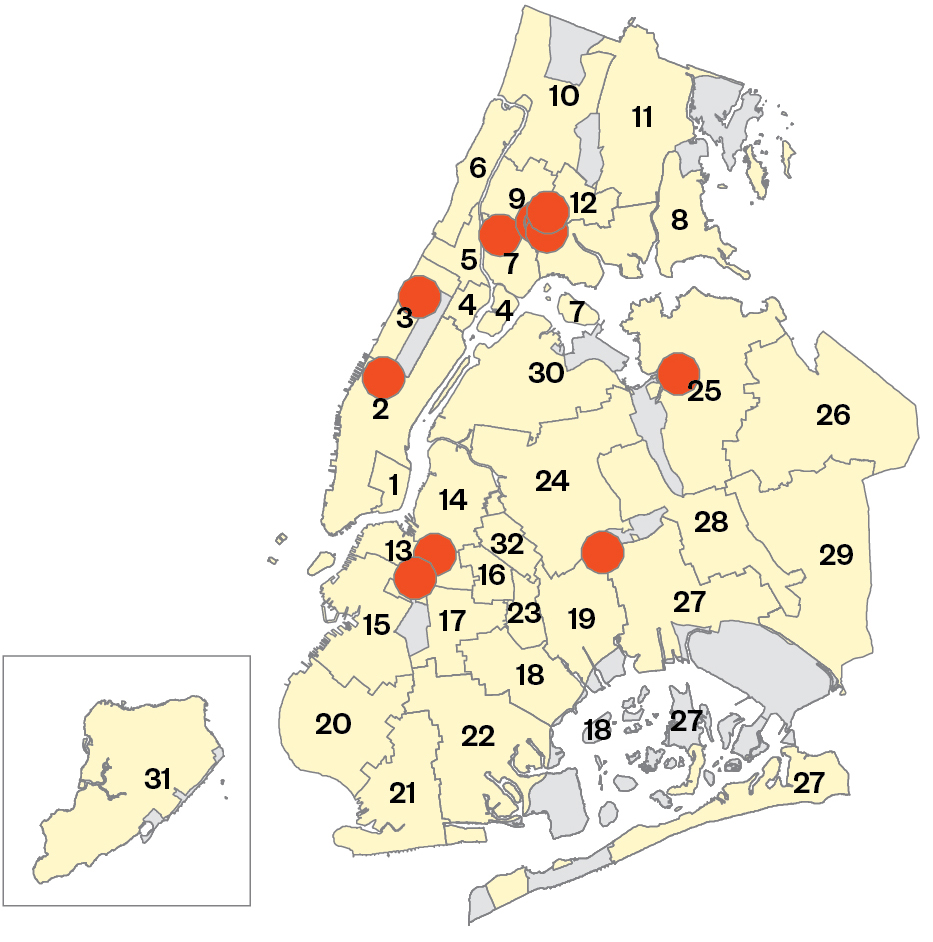
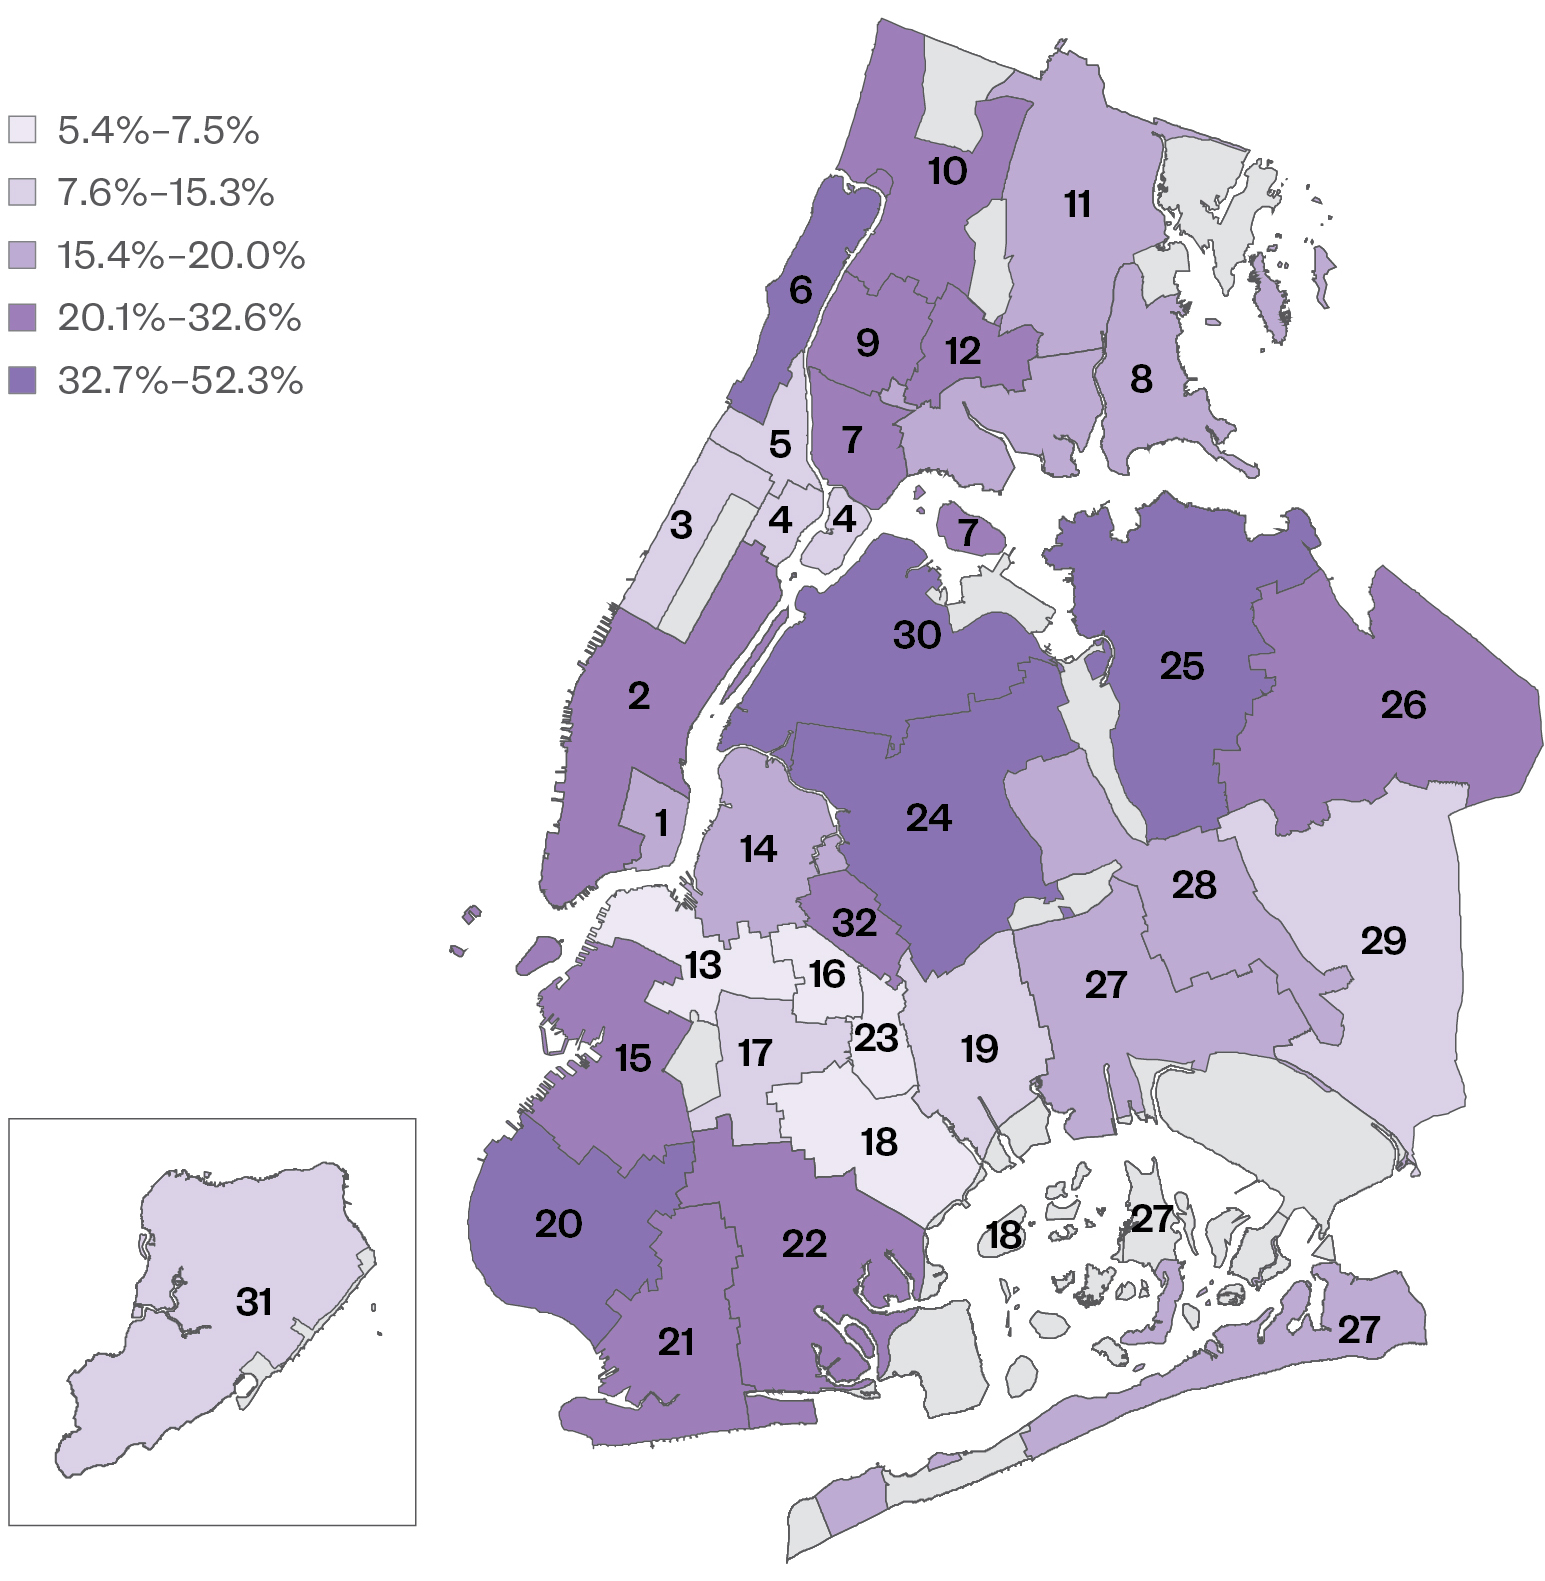
- The rate of student homelessness ranged from a low of 2.5% in Bayside, Queens to a high of 20% in the Bronx’s Highbridge/ Concourse. (Districts 26 and 9)
- Riverdale/Bedford in the Bronx continues to have the largest number of homeless students citywide (over 10,000). (District 10)
- Homelessness increased in every school district in New York City between SY 2014–15 and SY 2015–16.
- Both Flushing in Queens and Staten Island saw substantial growth in homelessness from the prior year, with increases of at least 520 homeless students each. This represented a 39% growth or more in the numbers of homeless students in those districts. (Districts 25 and 31)
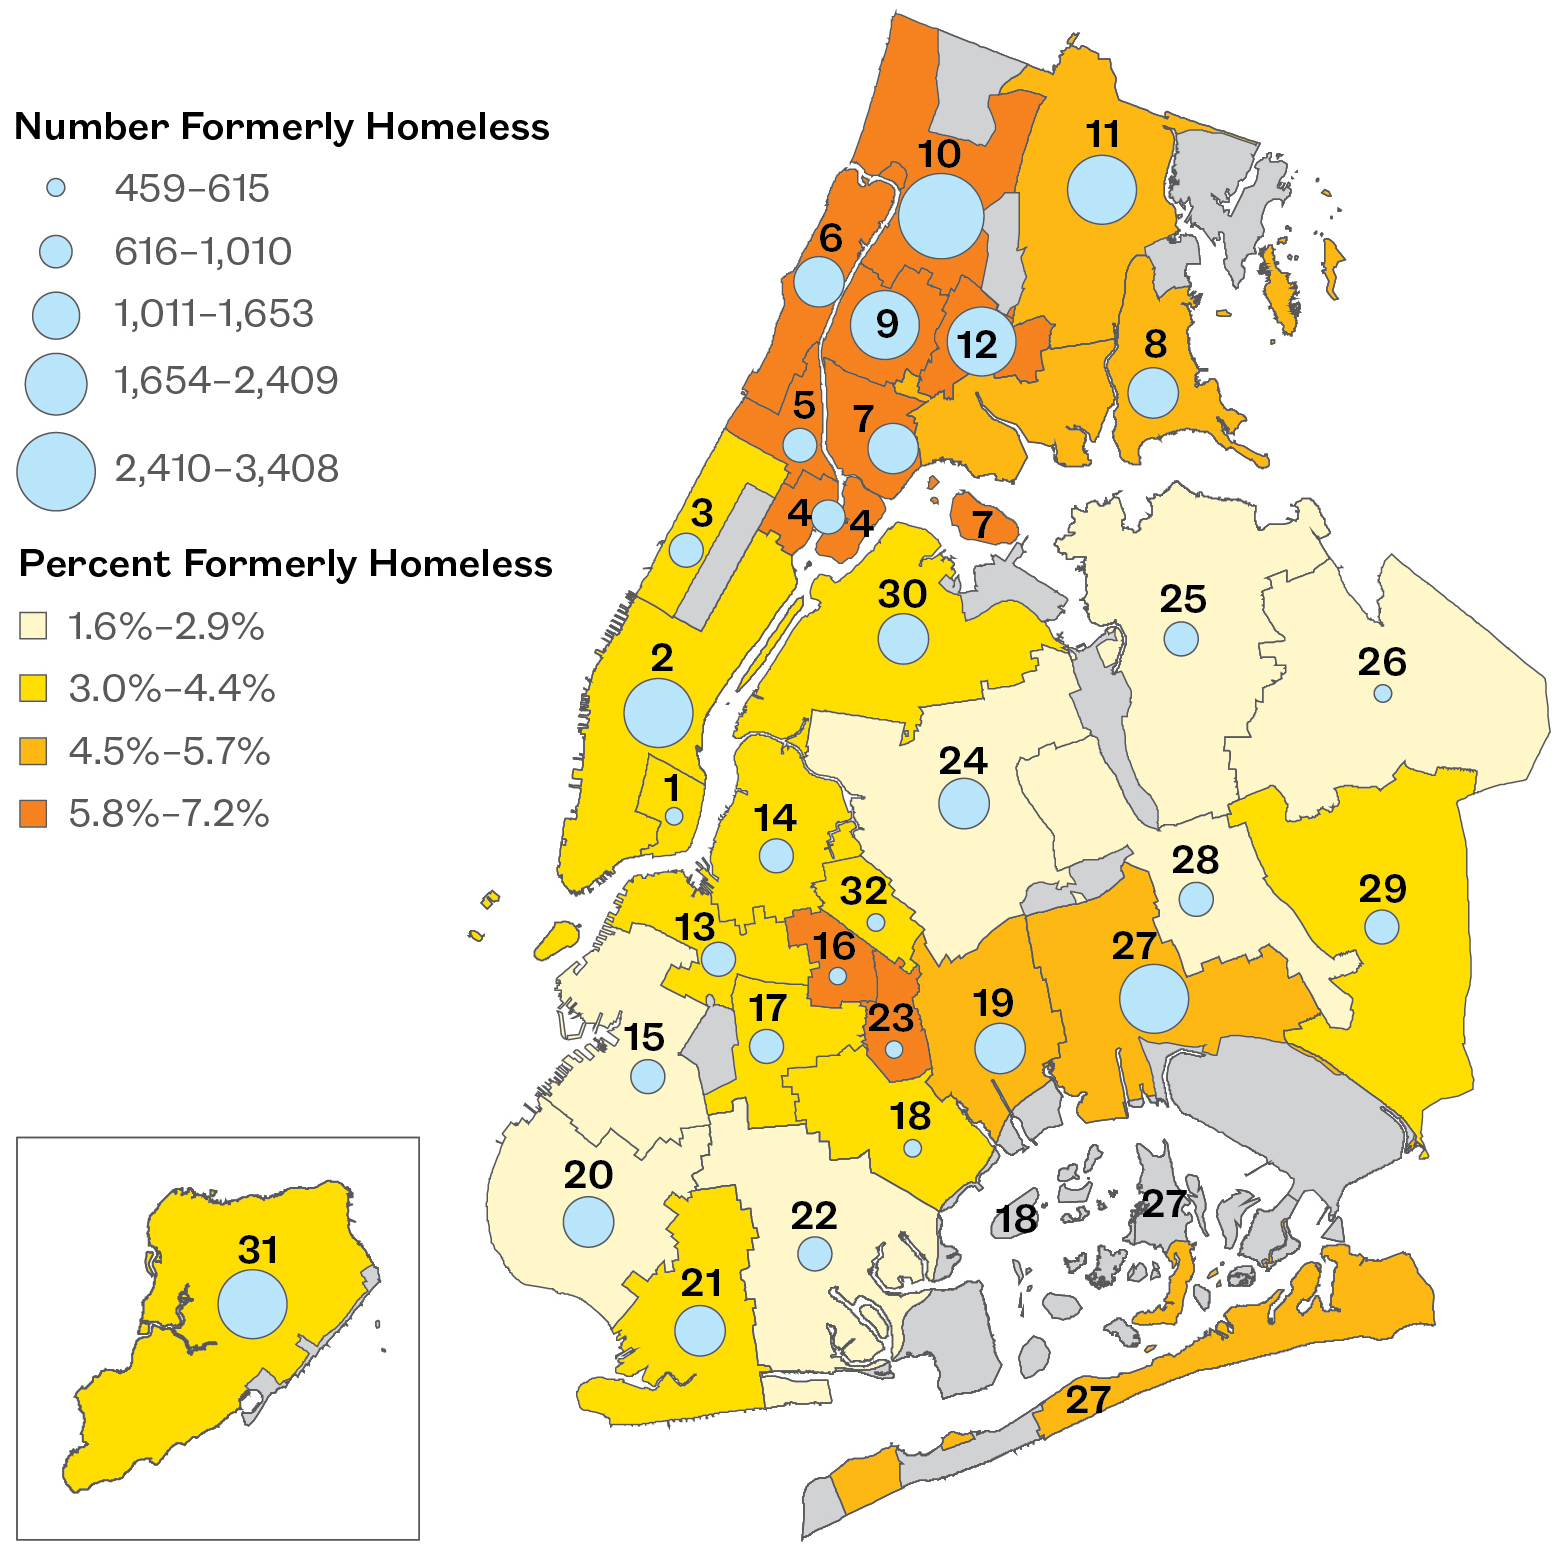
- School districts located in areas of the Bronx, northern Manhattan, and central Brooklyn not only had large numbers of students who are currently experiencing homelessness, but also had an additional 6%–7% of students who were formerly homeless. (Districts 4, 5, 6, 7, 9, 10, 12, 16, and 23)
- By district, the share of homeless students with ELL needs ranged from just 5% of homeless students in Bedford-Stuyvesant to over half (52%) of homeless students in Bay Ridge. (Districts 16 and 20)
- Students in shelter were left behind academically compared to their classmates, in some districts scoring proficient at just one-half the rate or less of their housed and other homeless peers. This was true in the districts with the highest rates of math proficiency for homeless students, including the Financial District, Midtown, and Upper East Side in Manhattan, Bay Ridge/Dyker Heights in Brooklyn, and Bayside/Little Neck in Queens. (Districts 2, 20, and 26)
- In virtually every City school district, students in shelter were suspended at a higher rate than both their housed and doubled-up peers. The suspension rate for students living in shelter was the highest at 10.8% in Flushing, Queens— over four times the citywide average (2.5%). (District 25)
- Homeless students attending school in Manhattan’s East Harlem and Bayside in Queens had the highest graduation rates for homeless students citywide, and even exceeded the overall graduation rate for the class of 2016 (82% in District 4 and 79% in District 26; 73% overall). Meanwhile, in four districts located in the Bronx and Brooklyn, less than 46% of homeless students graduated, a rate nearly 30 points lower than the citywide average (73%). (Districts 8, 12, 16, and 23)
Key School-Level Findings
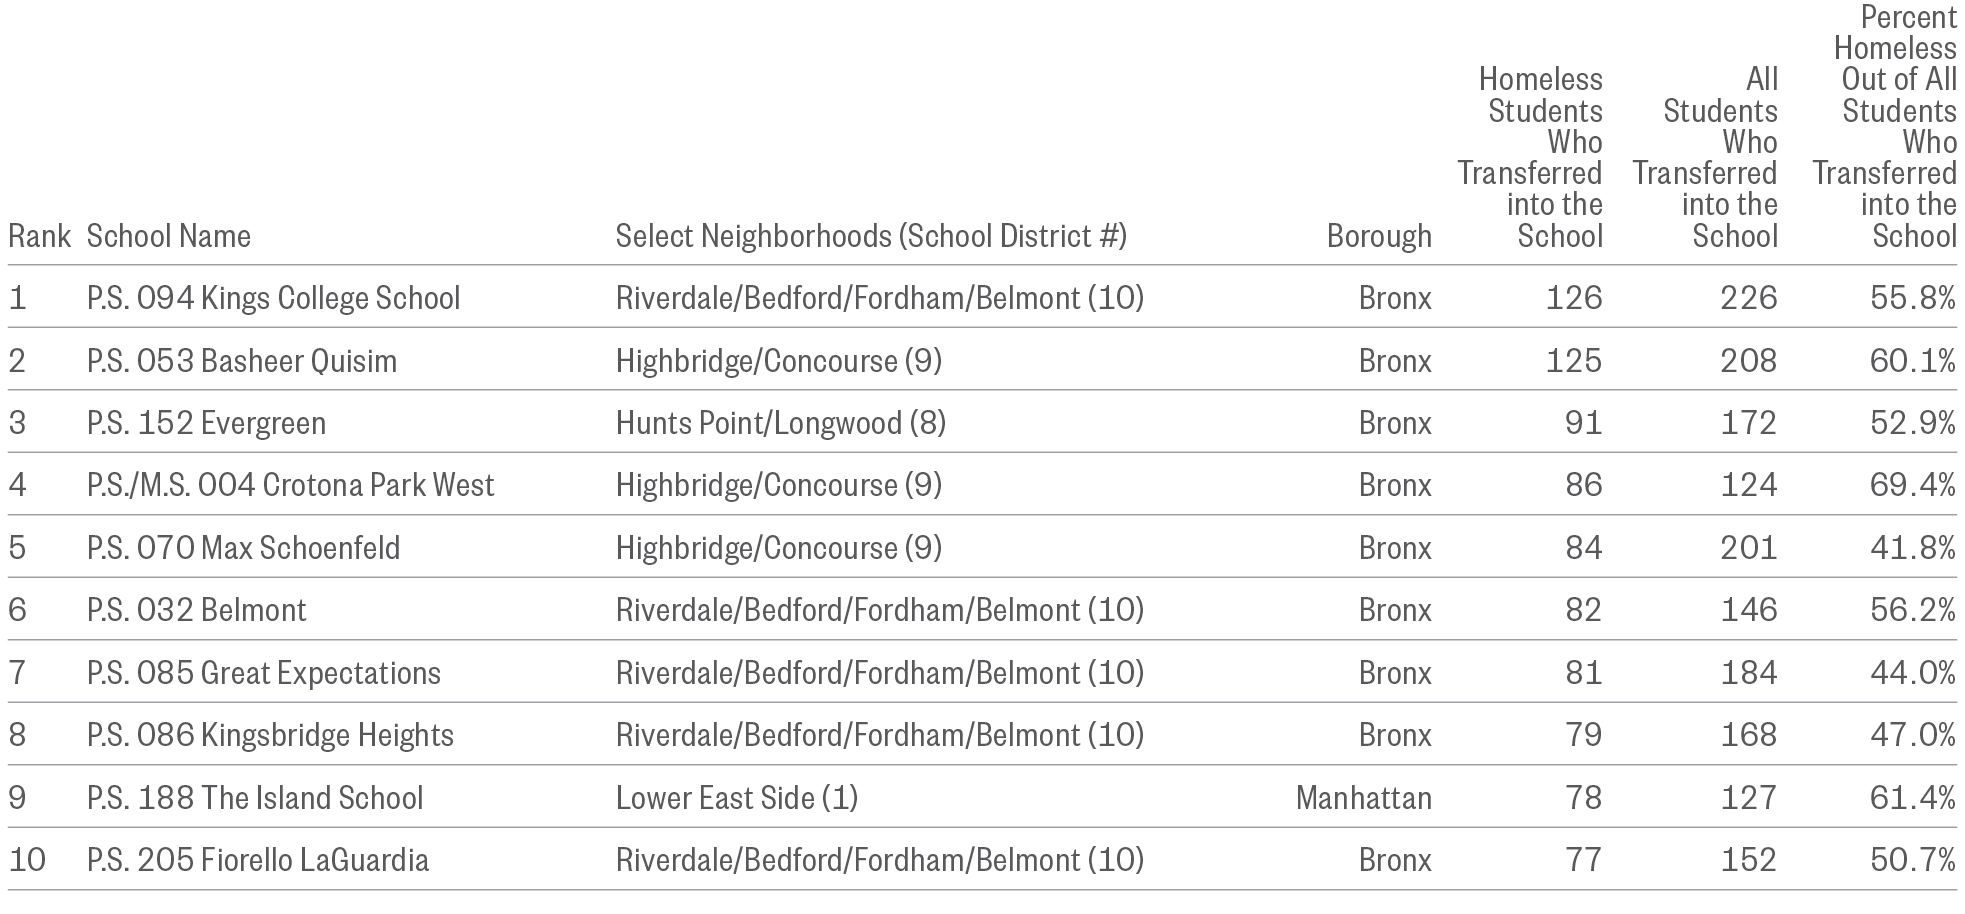
- Two schools located in Norwood and Highbridge/Concourse had the most homeless students transferring into the school mid-year (126 and 125 students each). In these schools, homeless students represented more than half of all students who transferred in mid-year, while citywide, homeless students represented 24% of students who transferred mid-year. (Districts 10 and 9)
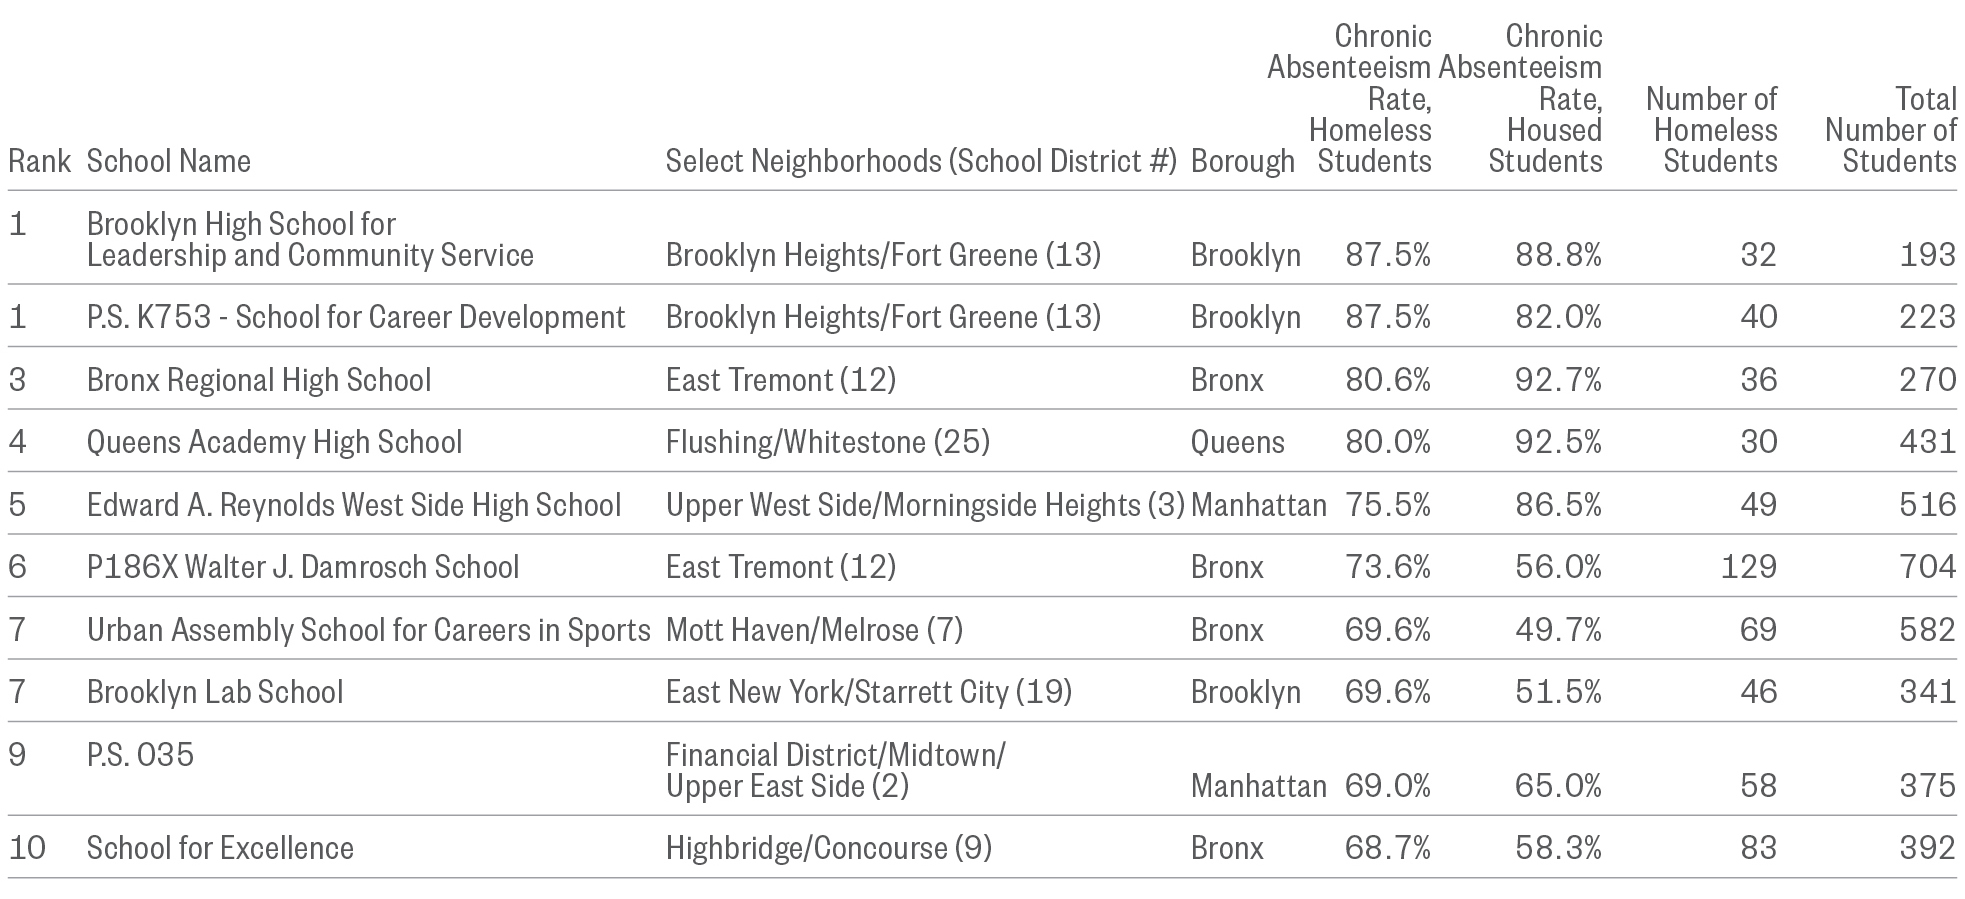
- Schools with the highest rates of absenteeism for homeless students were likely to be schools where housed students struggled as well. Close to 90% of homeless students were chronically absent at two high schools in Clinton Hill, while over 80% of their housed classmates were chronically absent. (District 13)
- ELA proficiency rates for homeless students ranged from 0% in two schools citywide to a high of 66% in one school located in Crown Heights, Brooklyn. (District 17) Citywide, 21% of homeless students scored proficient in ELA.
- At the school level, proficiency rates were similar between housed and homeless students: among schools in the top for highest math proficiency rate of homeless students, the proficiency rate for housed students exceeded the overall citywide average. Similarly, in most of the 13 schools where no homeless students scored proficient, the housed student rate was 10% or less.
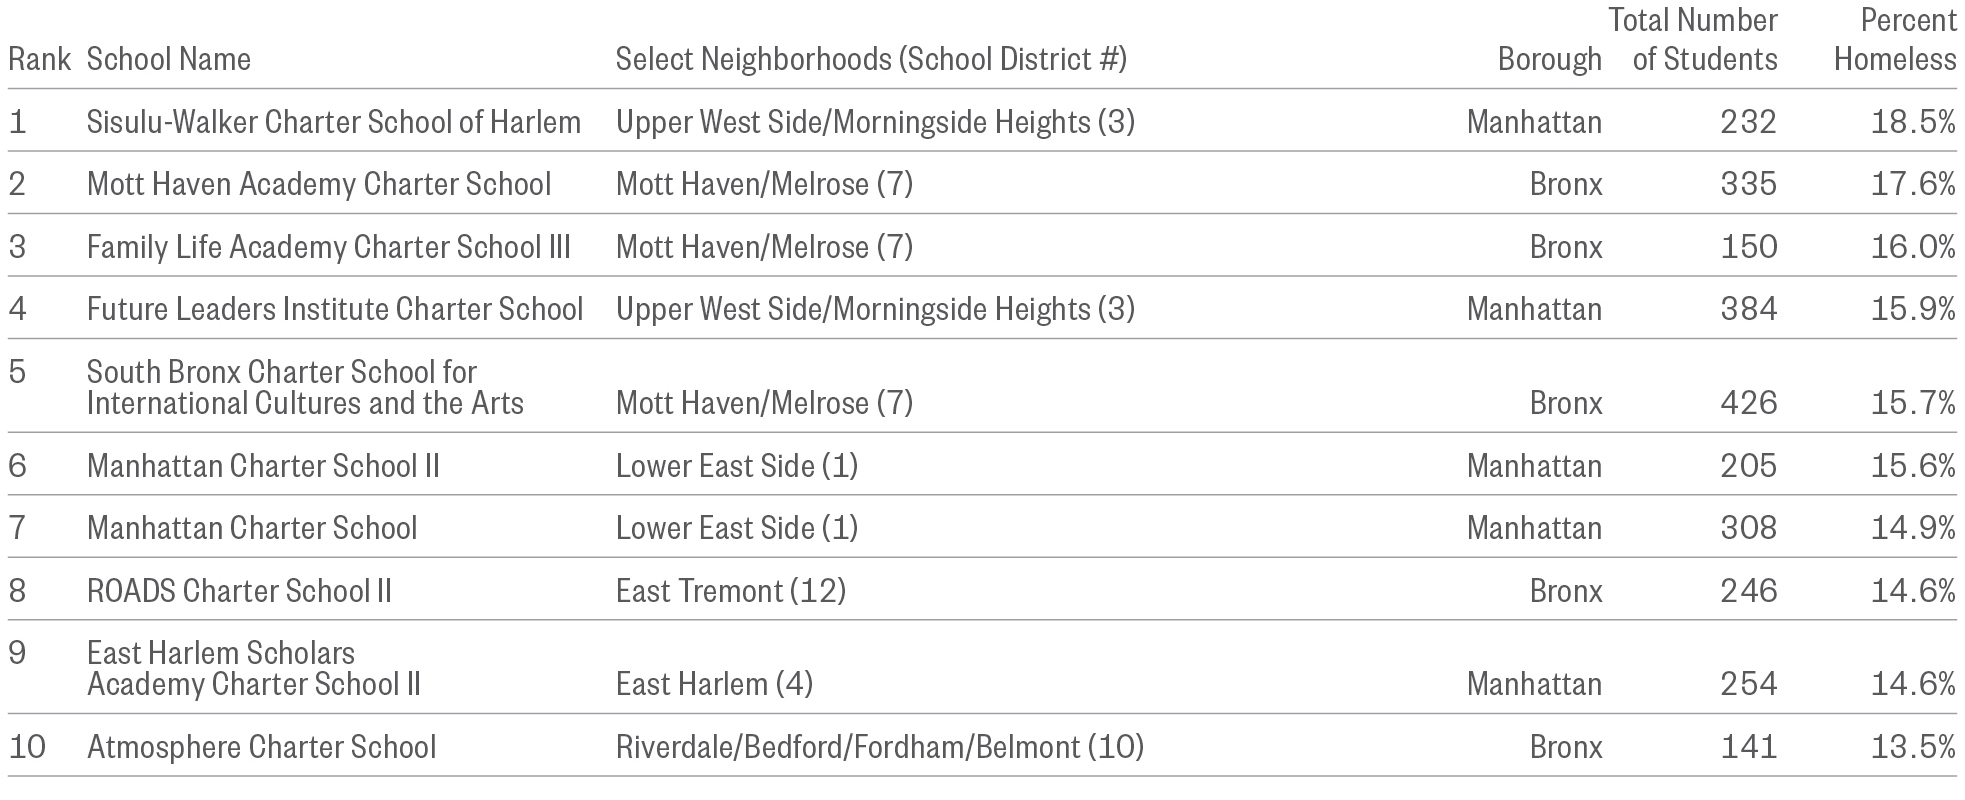
- Charter schools with the highest rates of student homelessness (9%–18.5%) were clustered in the districts where the most homeless students attend public schools. By contrast, in public schools in those districts, up to 48% of students were homeless.
- School suspensions disproportionately affect homeless students, but also some schools overall. At the ten schools with the highest suspension rates for homeless students, an average of 29% of homeless students and 18% of housed students were suspended, compared to a citywide average of 2.5%.
Download the Executive Summary.
To explore homelessness in New York City schools, try our interactive map.
To learn more about the educational outcomes of homeless New York city students, try our Student Atlas app.
Return to top.
Section 1
Growth of Student Homelessness in New York City
“Every six months, it’s like you’re in a new family. It’s so destabilizing. One of the biggest problems is that the next housing assignment is not in the same community. If the housing assignment is anywhere near where they were, you could stabilize those kids in schools. But if you’re going from Rockaway to Staten Island to the Bronx, any kid would really lose it. We would lose it if our home moved every six months and the people we know and trust weren’t available to us. … It takes several months to gain the trust of a student and to figure out what kind of learning support they need, to put a program in place. By January you’re feeling the flow and have figured out what triggers a tantrum or causes the child to run away. Just as you start to figure it all out, the kids are gone.”
—Former Principal, Community School in Brooklyn
“We work with a fourth-grade student who was placed in a shelter in Manhattan and he misses a lot of school. If the bus is late, or if he misses the bus, or if he sleeps in for five minutes, there’s no way for him to get to school. He’s very delayed. He’s made a lot of progress this year, but he feels like he doesn’t have many friends. He doesn’t know a lot of the kids because they live close to the school in the neighborhood, and they have been going to the same school since pre-K.”
—Social Work Director, Partnership with Children, working in Brooklyn public schools
More than 140,000 New York City public school students have been homeless at some point between SY 2010–11 and SY 2015–16. One in seven New York City children will be homeless before they finish elementary school unless current trends change. Looking at this cohort over six years, children who were homeless in elementary school faced heightened school instability and educational challenges. This section explores where students experiencing homelessness are attending school, building off of the 2016 Atlas of Student Homelessness to examine the patterns of formerly homeless students in public schools and homeless students attending charter schools in SY 2015–16.
What’s New?
- The number of homeless students in NYC public schools jumped by 20% in just one year, reaching close to 100,000 students in SY 2015–16.
- In addition to the nine percent of students homeless in SY 2015–16, another four percent were currently housed but had experienced homelessness at some point since SY 2010–11 (formerly homeless).
- On average, 6.6% of students in New York City charter schools were homeless in SY 2015–16—lower than the rate among students in public schools (9.3%).
Policy Considerations
- Every type of unstable housing setting is not the same. Living in a shelter, living doubled up, or having a history of housing instability can impact children’s lives differently. Identifying students by their specific experience is one critical tool that can help educators and policymakers further target interventions to children who are most vulnerable.
- Children are most likely to experience housing instability and homelessness when they are young. Identifying barriers and supporting young homeless students and their families is crucial to helping them access early education programs.
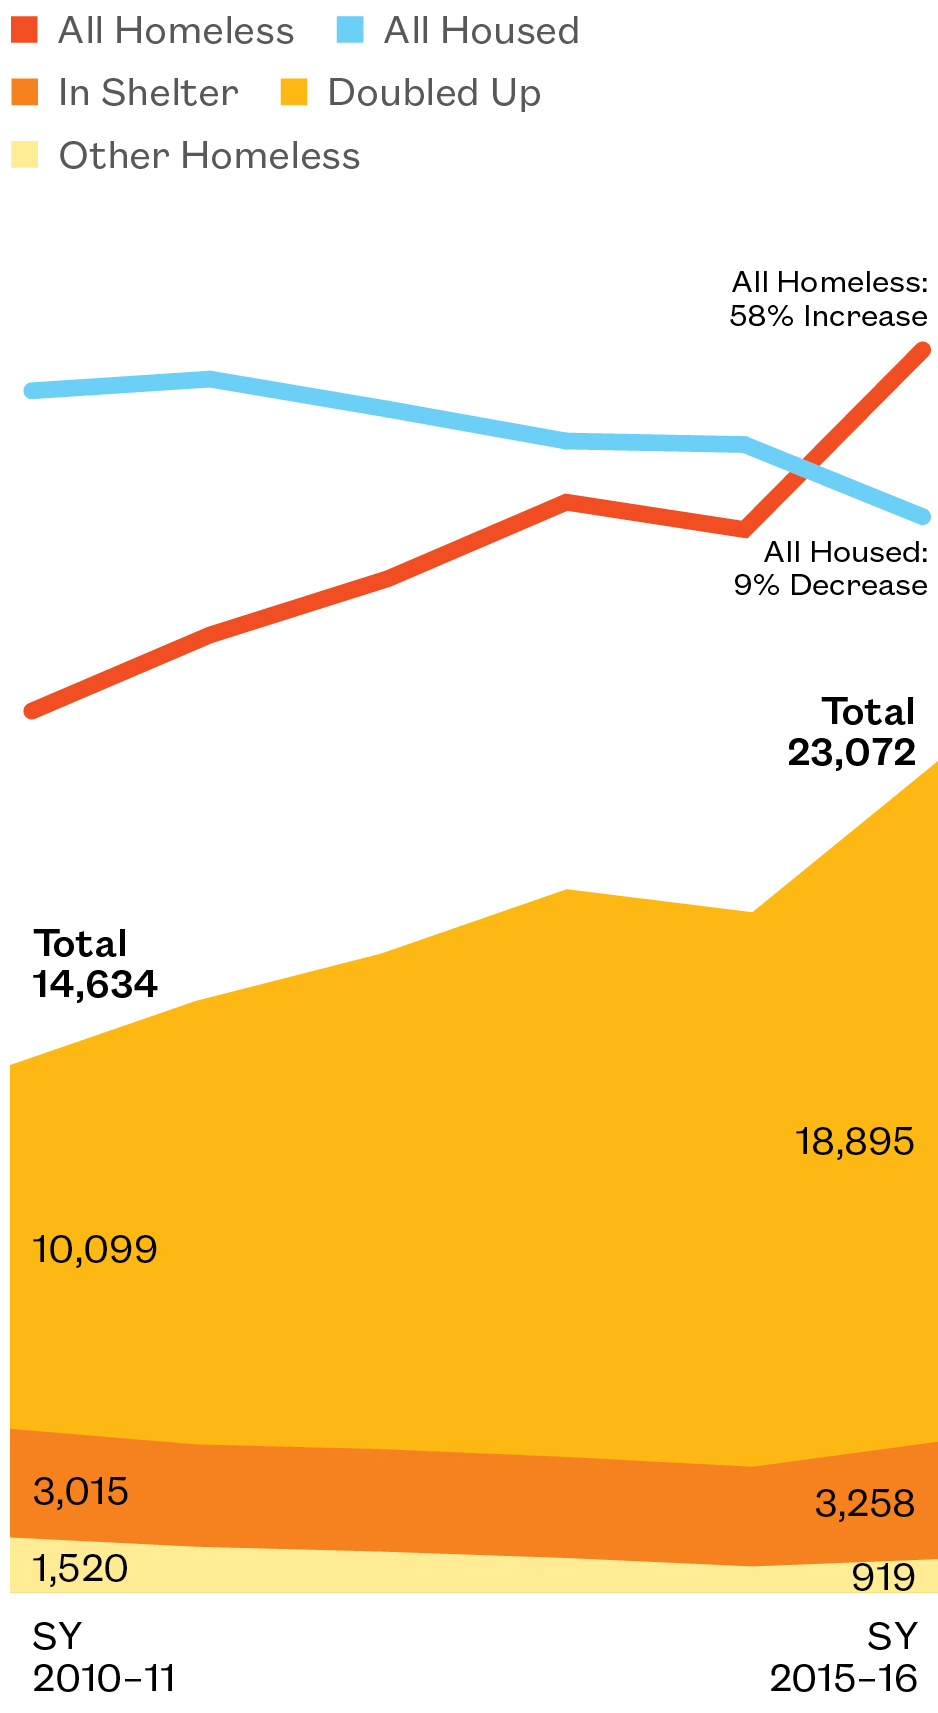
Student Homelessness Is Growing
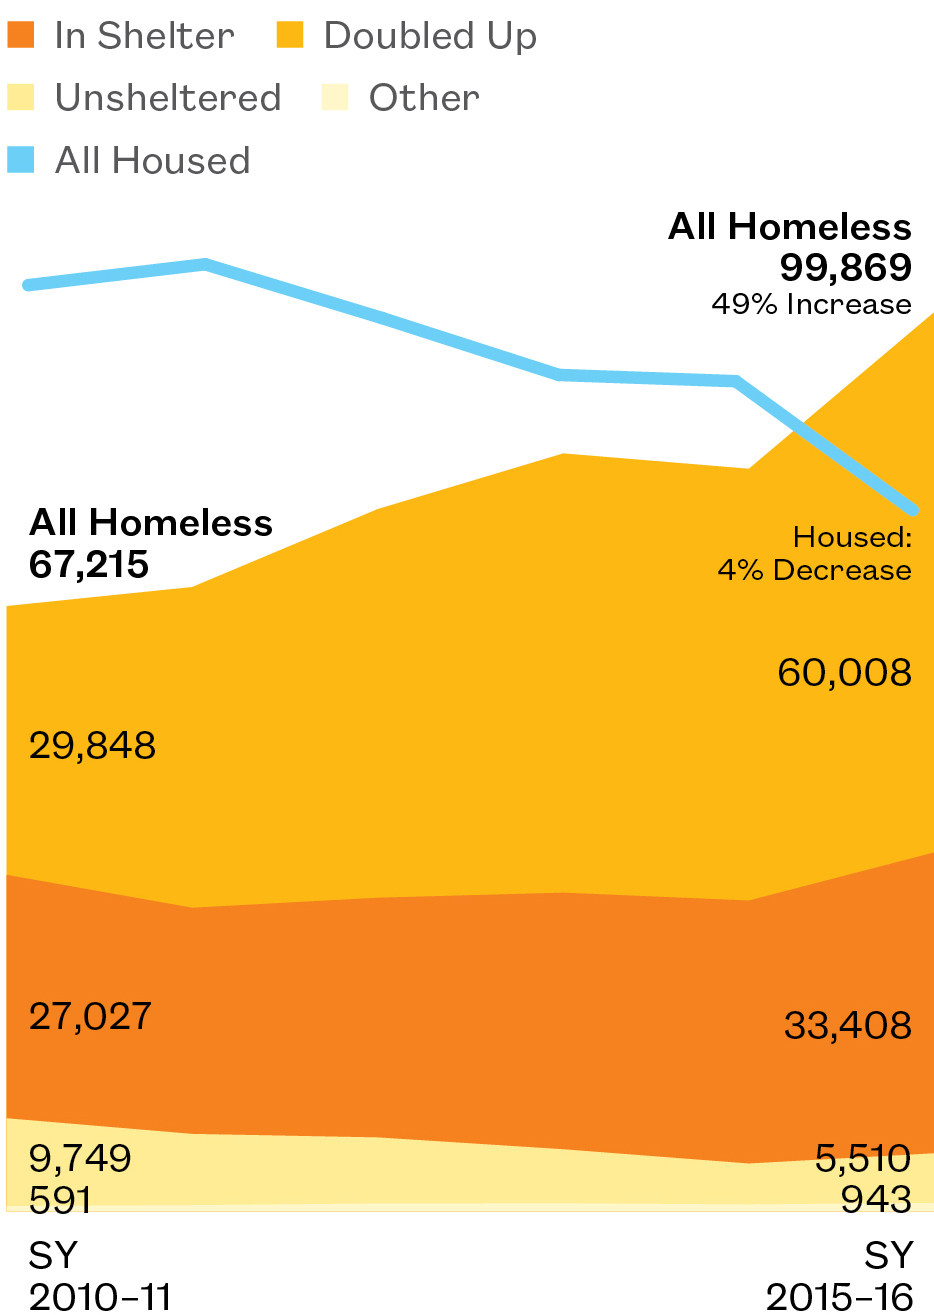
- Close to 100,000 homeless students attended New York City public schools in SY 2015–16. This was a 49% increase in six years. Over the same period, the overall enrollment among housed students declined.
- This increase was seen across housing statuses, with doubled-up students driving the growth. The number of doubled-up students grew to over 60,000 in SY 2015–16, a 25% increase from the prior year.
- For every homeless student living in shelter, roughly two more are homeless living in some other temporary location, such as doubled up with another family.
With little growth in City family shelter capacity, more and more families are doubling up. Ensuring that the varied social and educational needs of the close to 100,000 homeless students are met will be critical for New York City’s future.
Homeless Students in New York City Public Schools
SY 2010–11 to SY 2015–16
Note: In earlier years, the total number of “unsheltered” students may be less reliable than other categories.
Where Are Homeless Students?
Number and Percent of Students Homeless, by School District
SY 2015–16
Explore Districts at bit.ly/StudentAtlasApp.
Districts with Highest and Lowest Concentrations of Homeless Students
SY 2015–16
Note: Data are by school district and do not include schools in non-geographic districts.
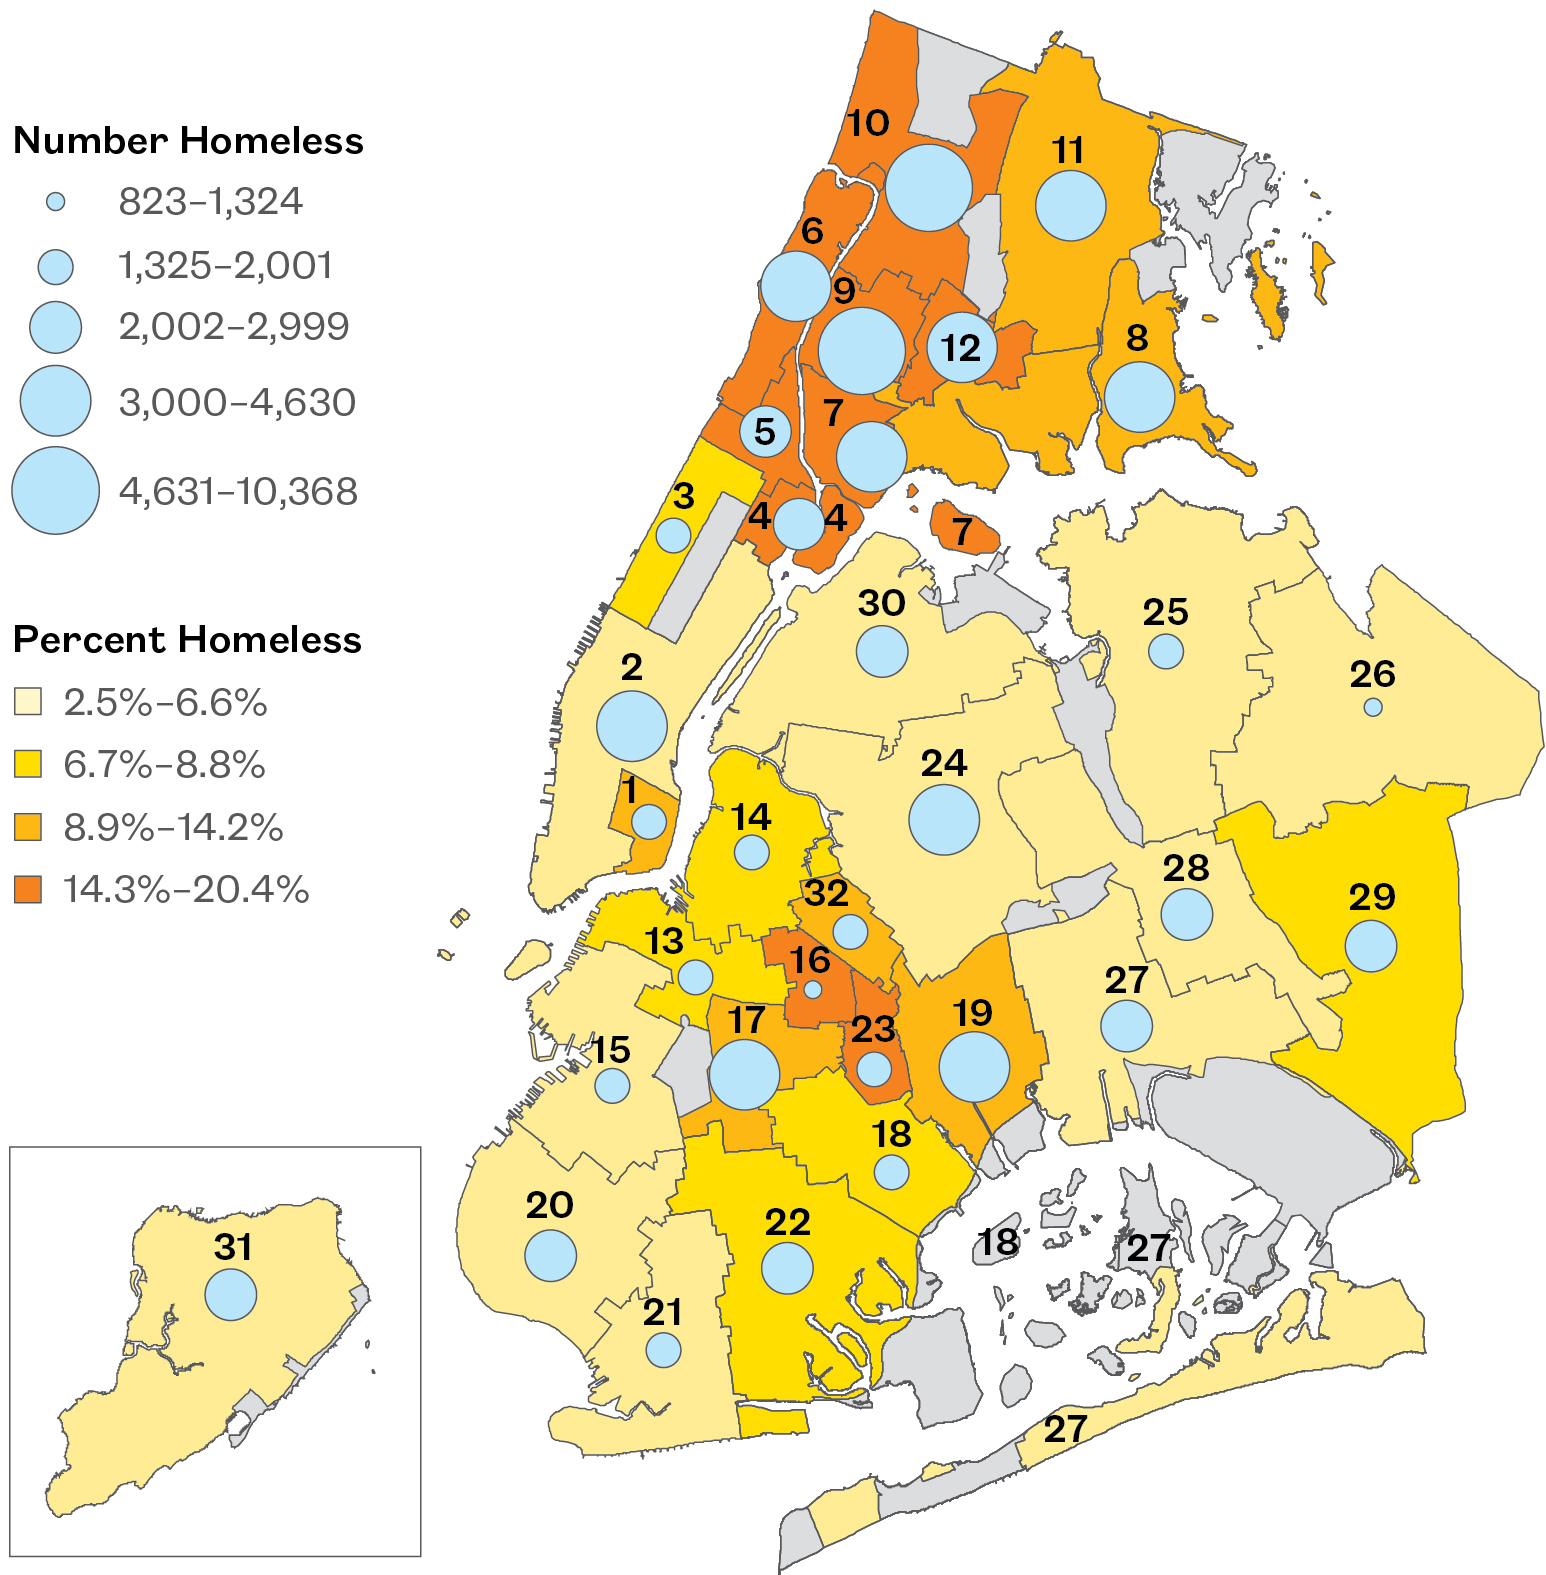
- An average of nine percent of New York City public school students were homeless in one year. This ranged from a low of 2.5% in Queens’ Bayside to a high of 20% in the Bronx’s Highbridge/ Concourse. (Districts 26 and 9)
- Riverdale/Bedford in the Bronx continues to have the largest number of homeless students citywide (over 10,000). (District 10)
- Bayside in Queens ranks lowest citywide for both the percent of students homeless and the overall number of homeless students (823).
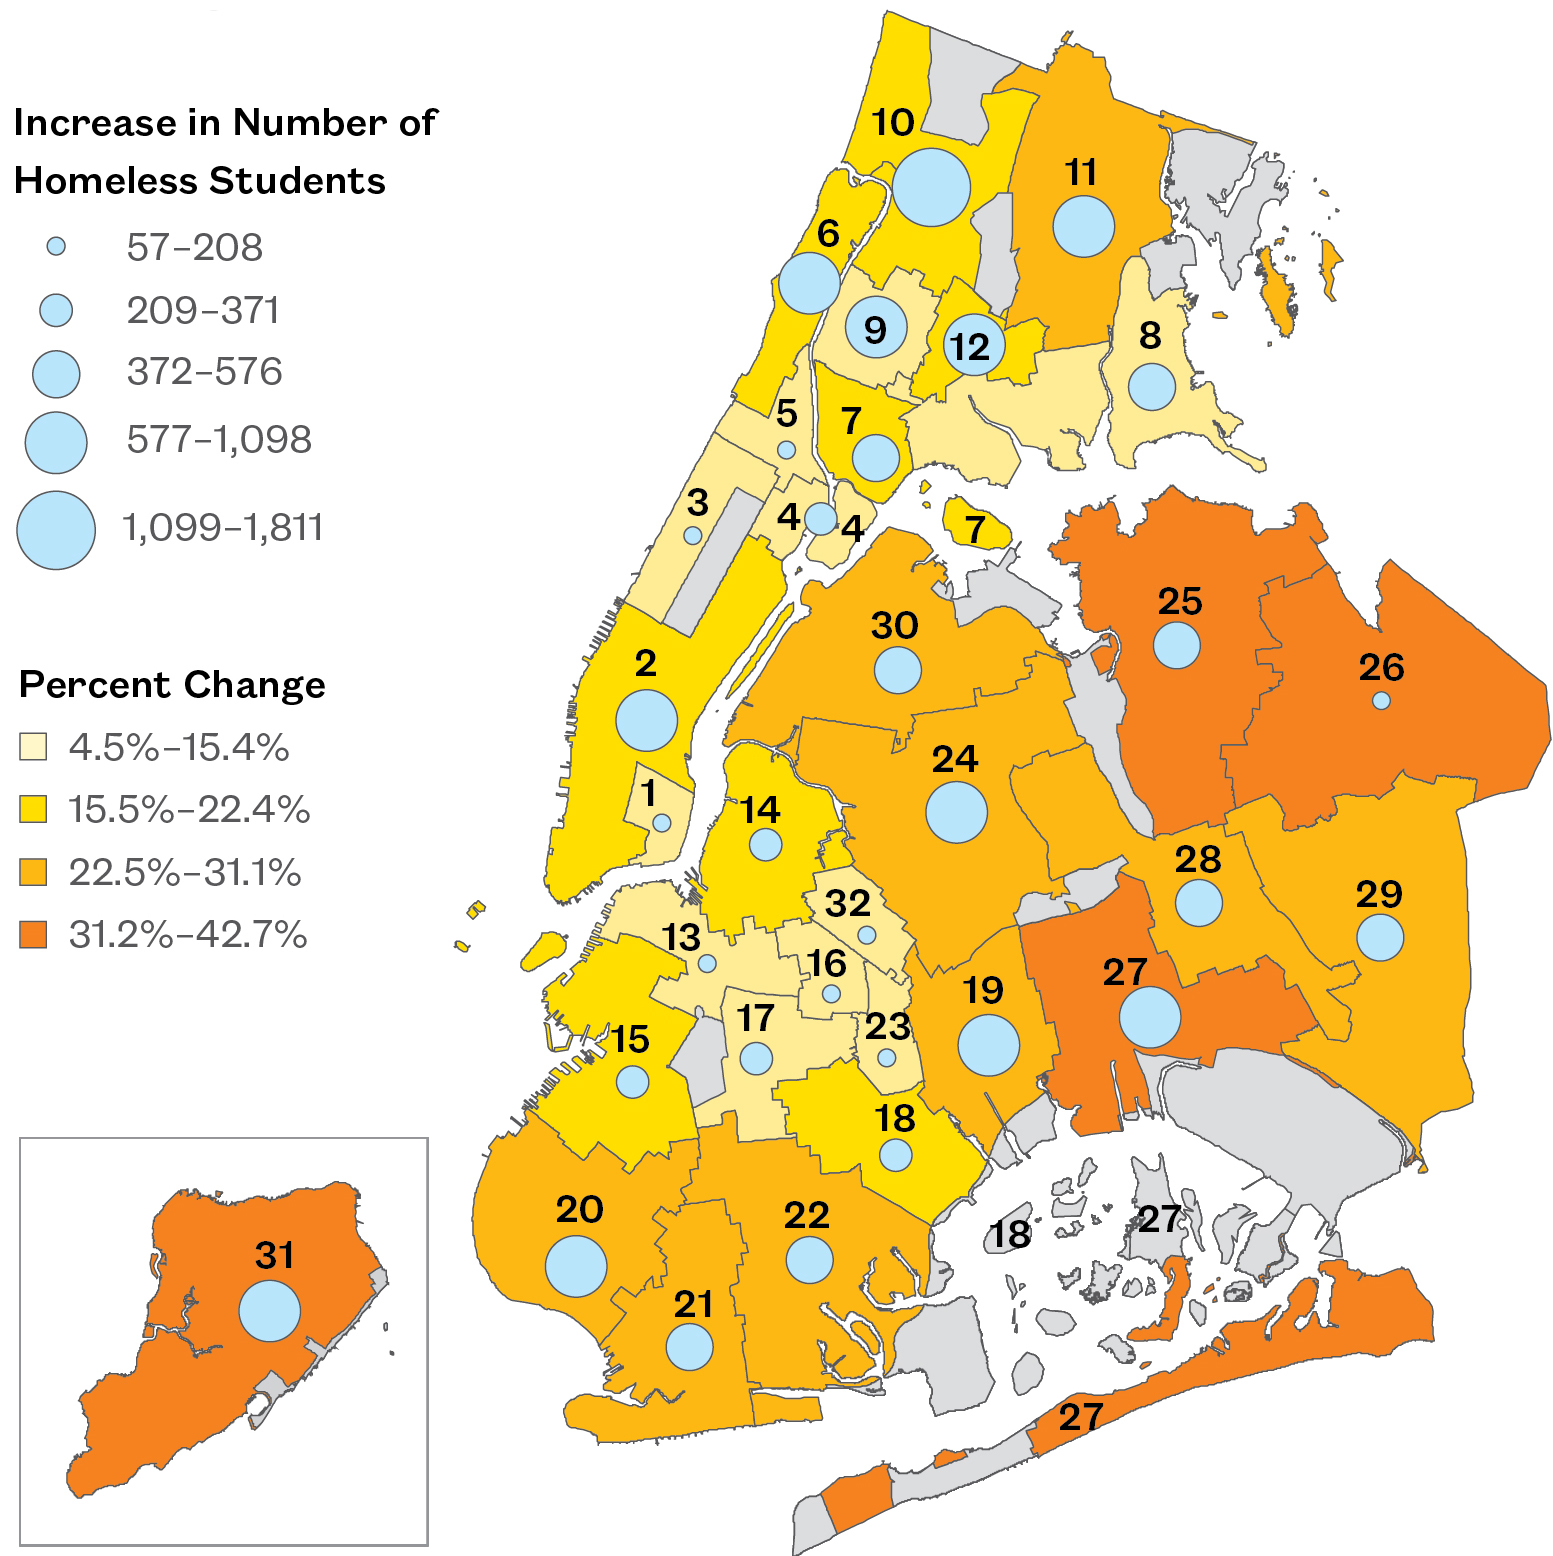
Where Is Homelessness Growing?
Percent Increase in Student Homelessness, by School District
SY 2014–15 to SY 2015–16
Note: Data are by school district and do not include schools in non-geographic districts.
Explore Districts at bit.ly/StudentAtlasApp.
Growth of Student Homelessness
SY 2014–15 to SY 2015–16
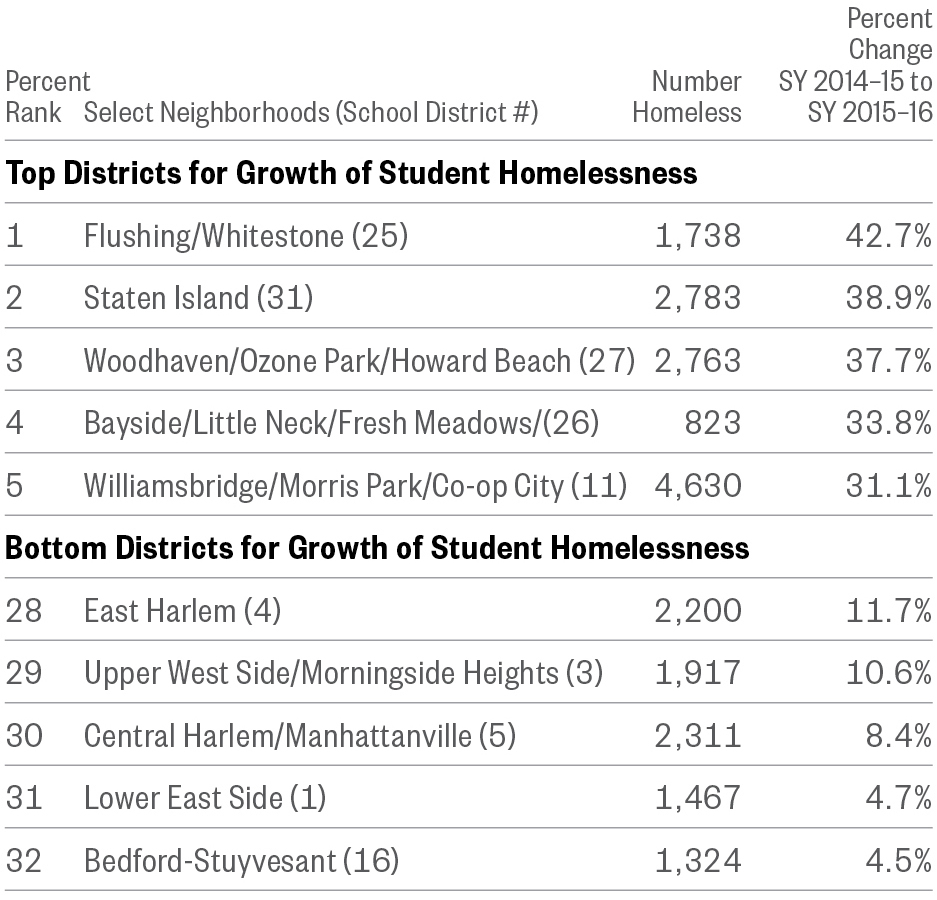
- Homelessness increased in every school district in New York City between SY 2014–15 and SY 2015–16.
- Riverdale/Bedford in the Bronx saw the largest number increase in student homelessness, with an increase of more than 1,800 students in one year. (District 10)
- Both Flushing in Queens and Staten Island saw substantial growth in homelessness from the prior year, with increases of at least 520 homeless students each. This represented a 39% growth or more in the numbers of homeless students in those districts. (Districts 25 and 31)
Where Are Formerly Homeless Students?
Number and Percent of Students Formerly Homeless, by School District
SY 2015–16
Note: Data are by school district and do not include schools in non-geographic districts. “Formerly Homeless” includes students who were housed during SY 2015–16 but were homeless at any point during SY 2010–11, SY 2011–12, SY 2012–13, SY 2013–14, and/or SY 2014–15.
Explore Districts at bit.ly/StudentAtlasApp.
Formerly Homeless Students
SY 2015–16
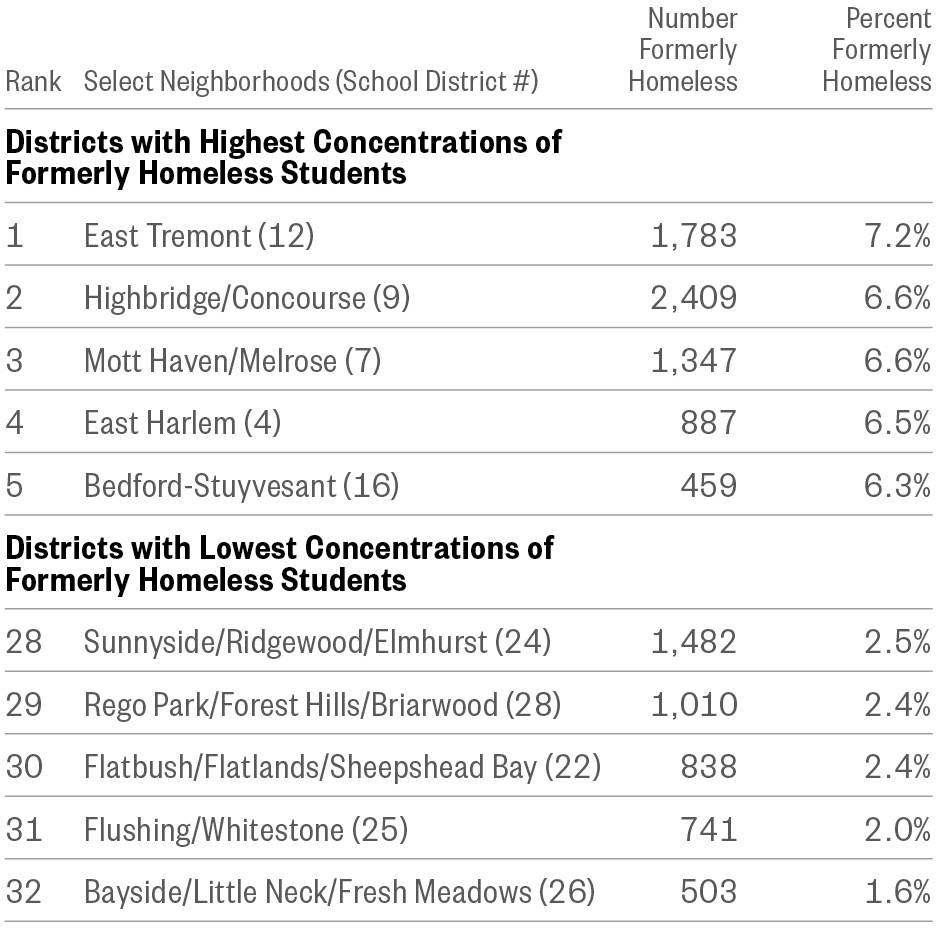
- In addition to the nine percent of students homeless in SY 2015–16, another four percent were currently housed but had experienced homelessness at some point since SY 2010–11 (formerly homeless).
- In half of the City’s school districts, more than 1,000 students were formerly homeless. The districts with the most formerly homeless students—over 1,650—were located across boroughs, including Manhattan’s Financial District/ Upper East Side; Highbridge, Riverdale, Williamsbridge, and East Tremont in the Bronx; Woodhaven in Queens; and Staten Island. (Districts 2, 9–12, 27, and 31)
See schools at bit.ly/MapNYCHomelessStudents
- Students living doubled up attended school in every district, including many areas with no family shelters.
- P.S. 503 The School of Discovery, an elementary school in Bay Ridge, had the largest number (over 415) of doubled-up students enrolled out of all NYC public schools. (District 20)
- More than 250 students living doubled up attended each of the top ten schools for the largest number of doubled-up students in SY 2015–16. These ten schools saw an average 14% growth in the number of students living doubled up from the prior year.
Where Students Living Doubled Up Go to School
Number of Doubled-up Students by School
SY 2015–16
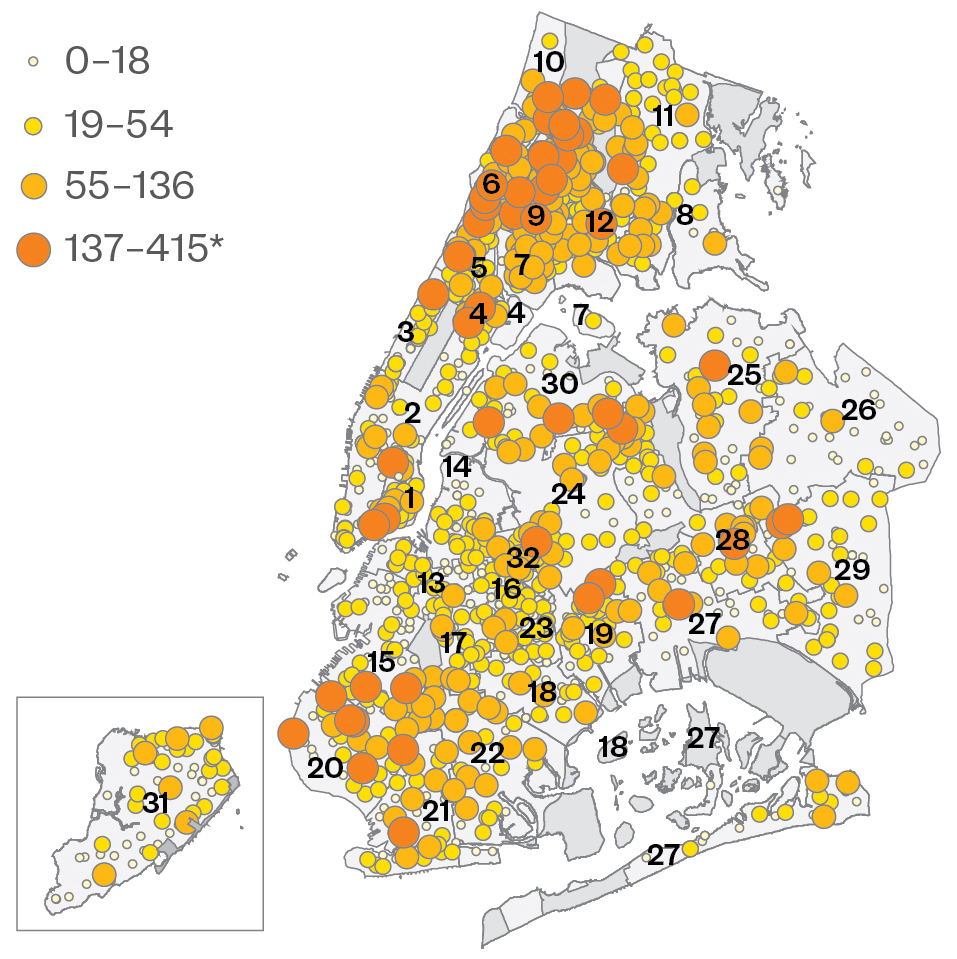
See schools at bit.ly/MapNYCHomelessStudents
Top 10 Schools for Students Living Doubled Up
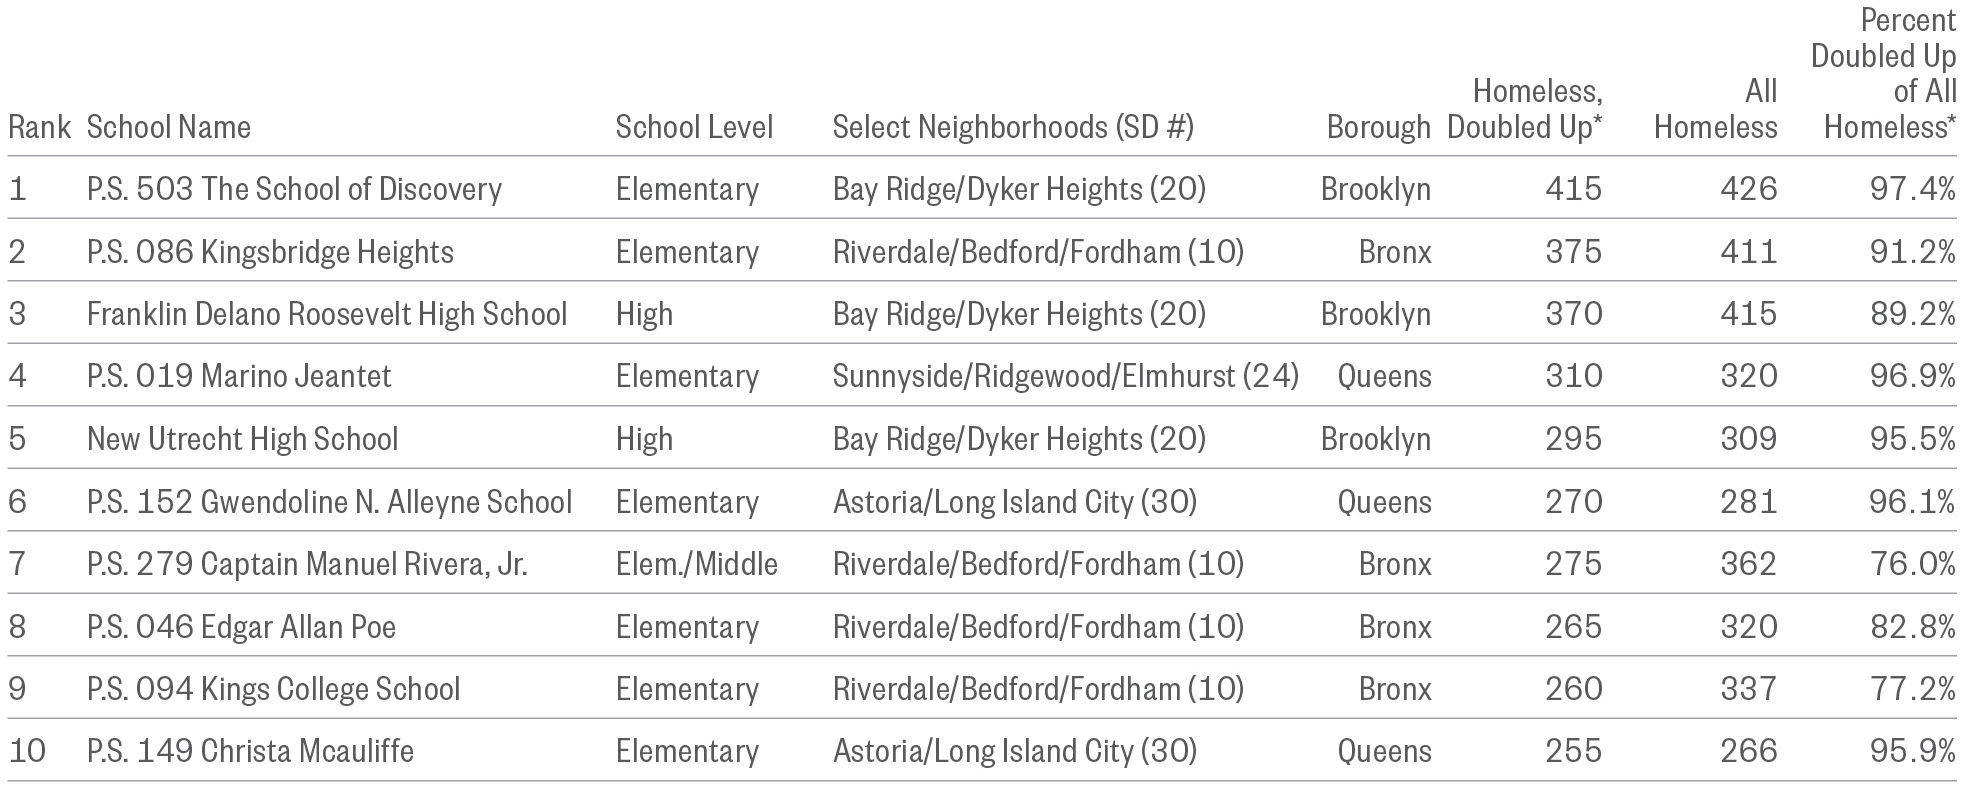
*Numbers of doubled-up students are rounded down in order to protect student privacy and adhere to the Family Education Rights and Privacy Act.
Note: Data include schools in both geographic and non-geographic districts. Data groupings for the map of doubled-up students by school and the map of sheltered students by school are matched for the purpose of comparison. For comparison and readability, number breaks are manually classified to match the 2016 Atlas of Student Homelessness.
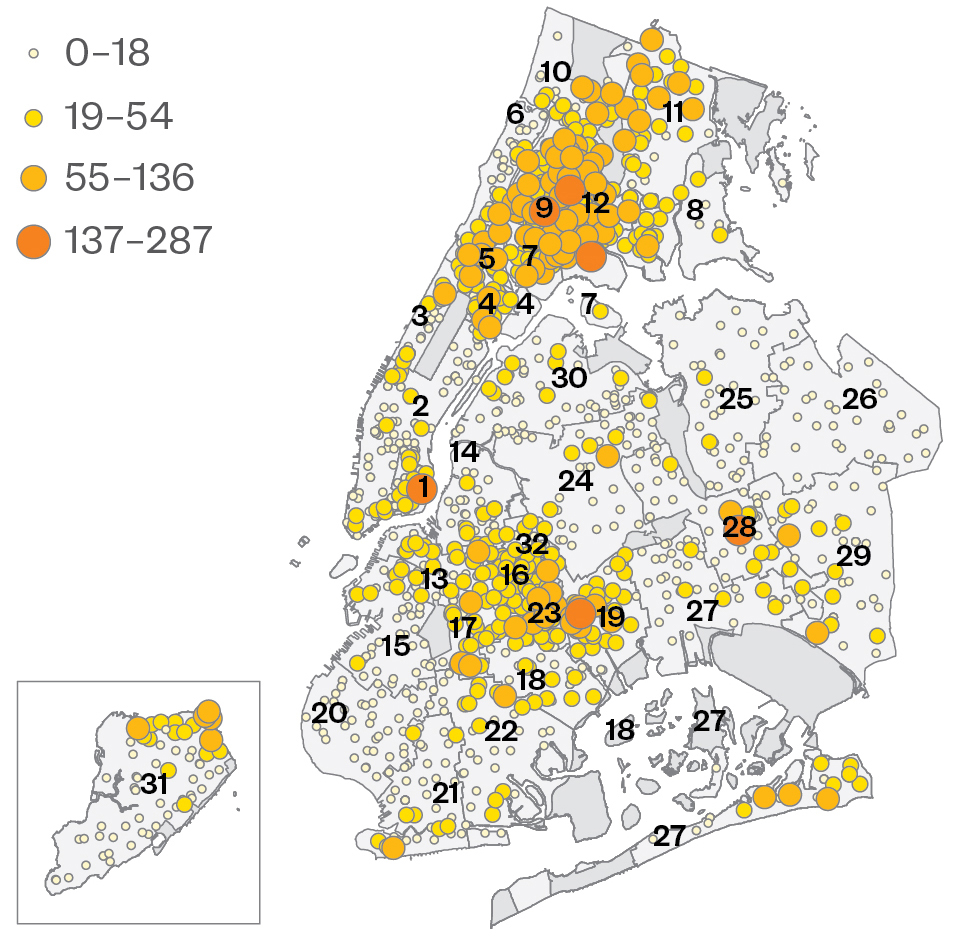
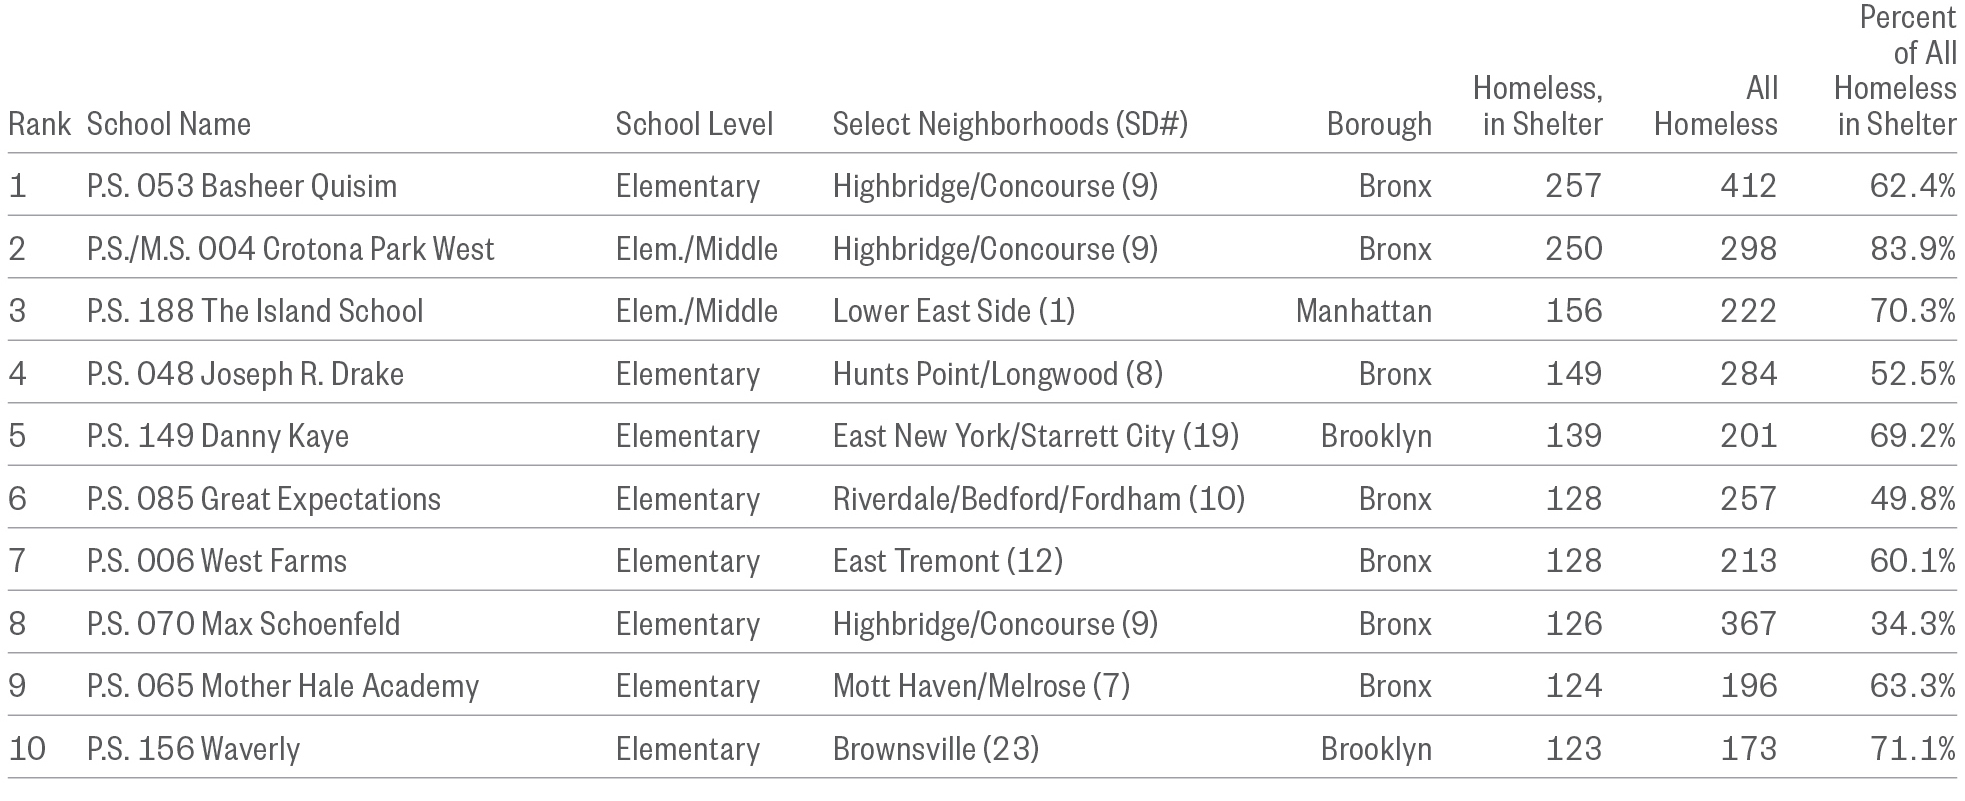
- Homeless students living in shelter attended schools in every district, but were clustered in northern Manhattan, the south and west Bronx, and central Brooklyn. This pattern mirrors the locations of City shelters, suggesting that homeless students in shelter often transfer to schools closer to their shelter placement.
- The top three schools for the largest number of students in shelter are the same as last year. P.S. 053 Basheer Quisim Elementary School in Highbridge/Concourse had the largest number of students living in shelter for the third consecutive year. (District 9)
Where Students Living in Shelter Go to School
Number of Students in Shelter by School
SY 2015–16
See schools at bit.ly/MapNYCHomelessStudents
Top 10 Schools for Students Living in Shelter
Note: Data include schools in both geographic and non-geographic districts. Data groupings for the map of doubled-up students by school and the map of sheltered students by school are matched for the purpose of comparison. For comparison and readability, number breaks are manually classified to match the 2016 Atlas of Student Homelessness.
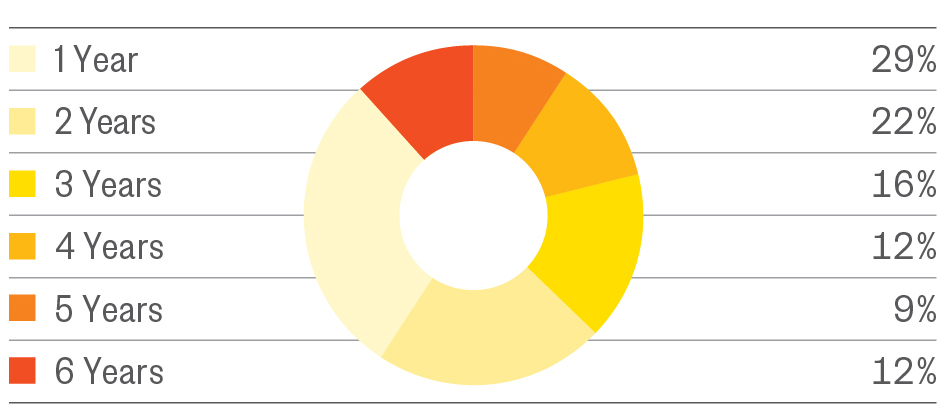
Most Children Are Homeless for More Than One School Year
- Housing instability is a recurring experience for homeless students in New York City. Two-thirds of homeless children in NYC were identified as homeless in more than one school year.
- One-third of homeless students were identified as homeless in at least four of the last six years. Of these students who were repeatedly or continuously homeless, roughly half transitioned housing statuses, living in multiple homeless settings or transitioning into or out of permanent housing at some point.
Housing transitions and repeated experiences of homelessness place students at risk for instability at school.
Number of Years in which Students Have Been Homeless
SY 2015–16
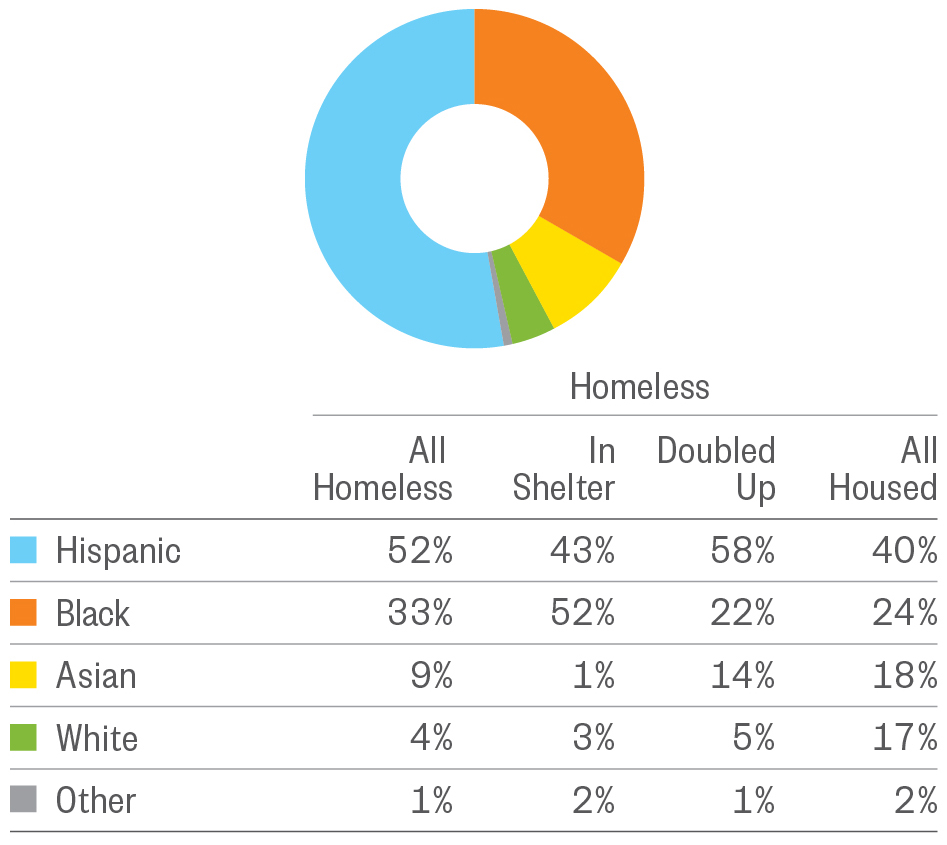
Hispanics and Blacks Are Over-Represented
- One-half of all homeless students in NYC are Hispanic, 25 percent higher than housed students (52% to 40%). Among all Hispanic students enrolled in public schools, 12% were homeless in SY 2015–16.
- One-third of homeless students in NYC were black in SY 2015–16, almost 50 percent higher than housed students (33% to 24%). Among all black students enrolled in public schools, 12% were homeless.
- Students’ race and ethnicity varied by type of homelessness. The majority (52%) of students in shelter were black, while 58% of students living doubled up were Hispanic.
Race and Ethnicity of Homeless Students
SY 2015–16
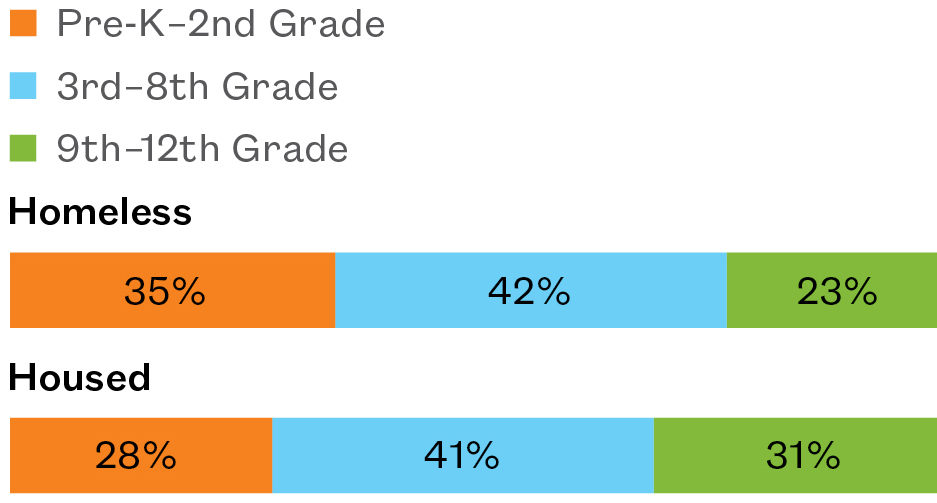
Young Students Are Most At Risk for Homelessness
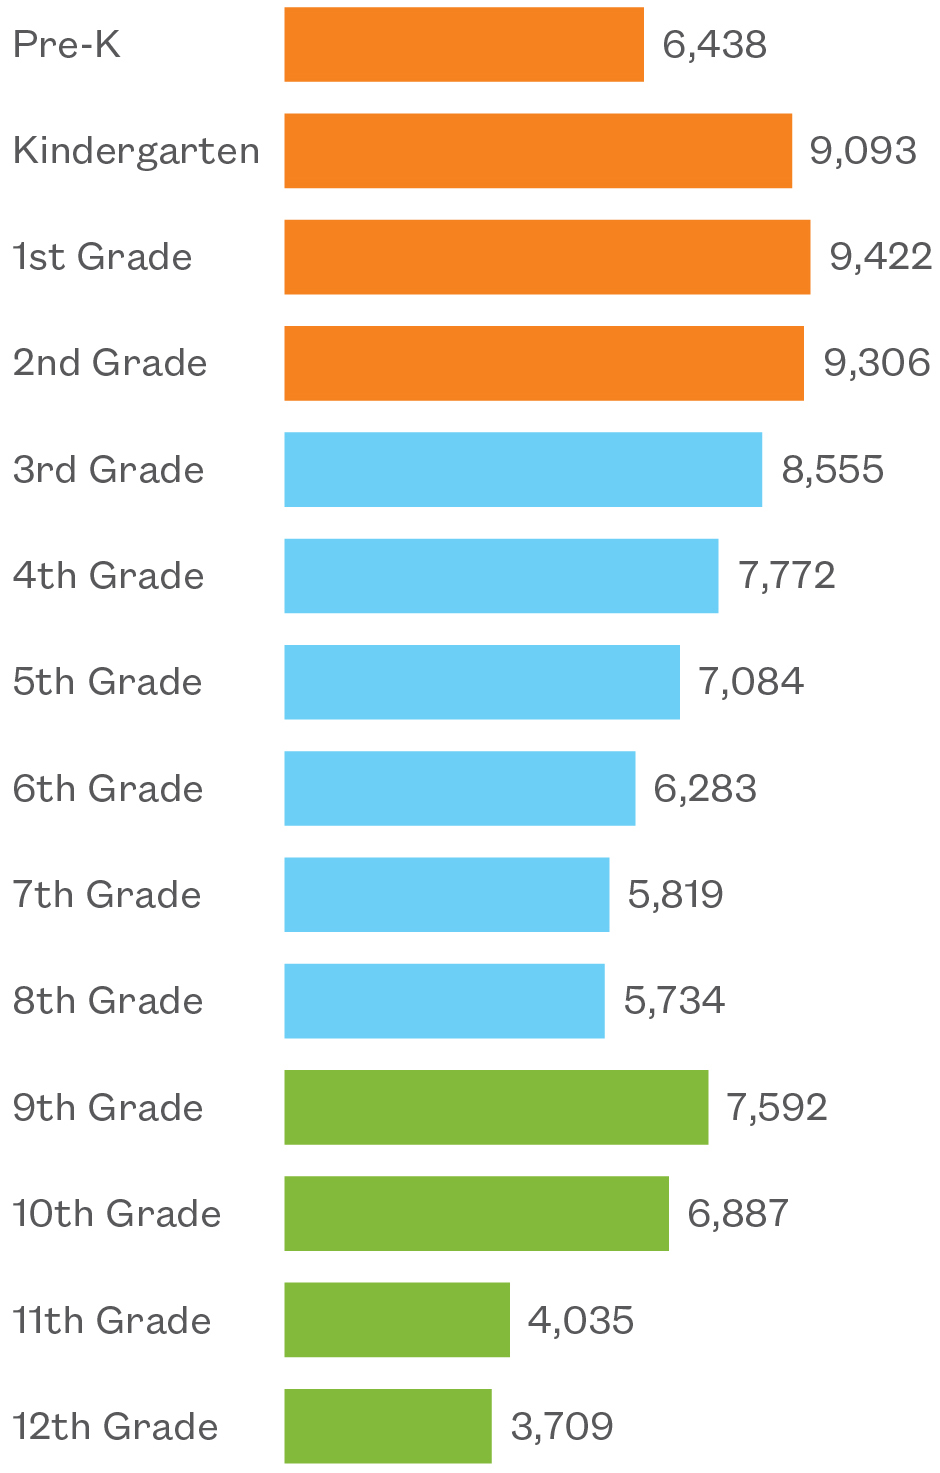
- More than 9,000 homeless children were enrolled in each grade from Kindergarten through second, making these the most common grades by far for homeless students to attend. Housed students follow a different pattern, however, with ninth and tenth grades representing the most common age. The different patterns of enrollment may point to under-identification of homeless students in high school, but also the increased vulnerability and housing instability faced by young families and children.
- Amidst the expansion of Universal Pre-K programs in New York City, pre-K enrollment among homeless students in SY 2015–16 increased by 17% over the prior year. However, the enrollment gap between pre-K and Kindergarten students suggests that over 2,500 homeless children eligible for pre-K were not reached by New York City’s public pre-K programs in SY 2015–16.
As the City prepares to introduce pre-K for all three-year-olds, how can the enrollment gap between housed and homeless students be eliminated in early childhood classrooms?
Homeless Students by Grade Level
SY 2015–16
Number of Homeless Students by Grade Level
SY 2015–16
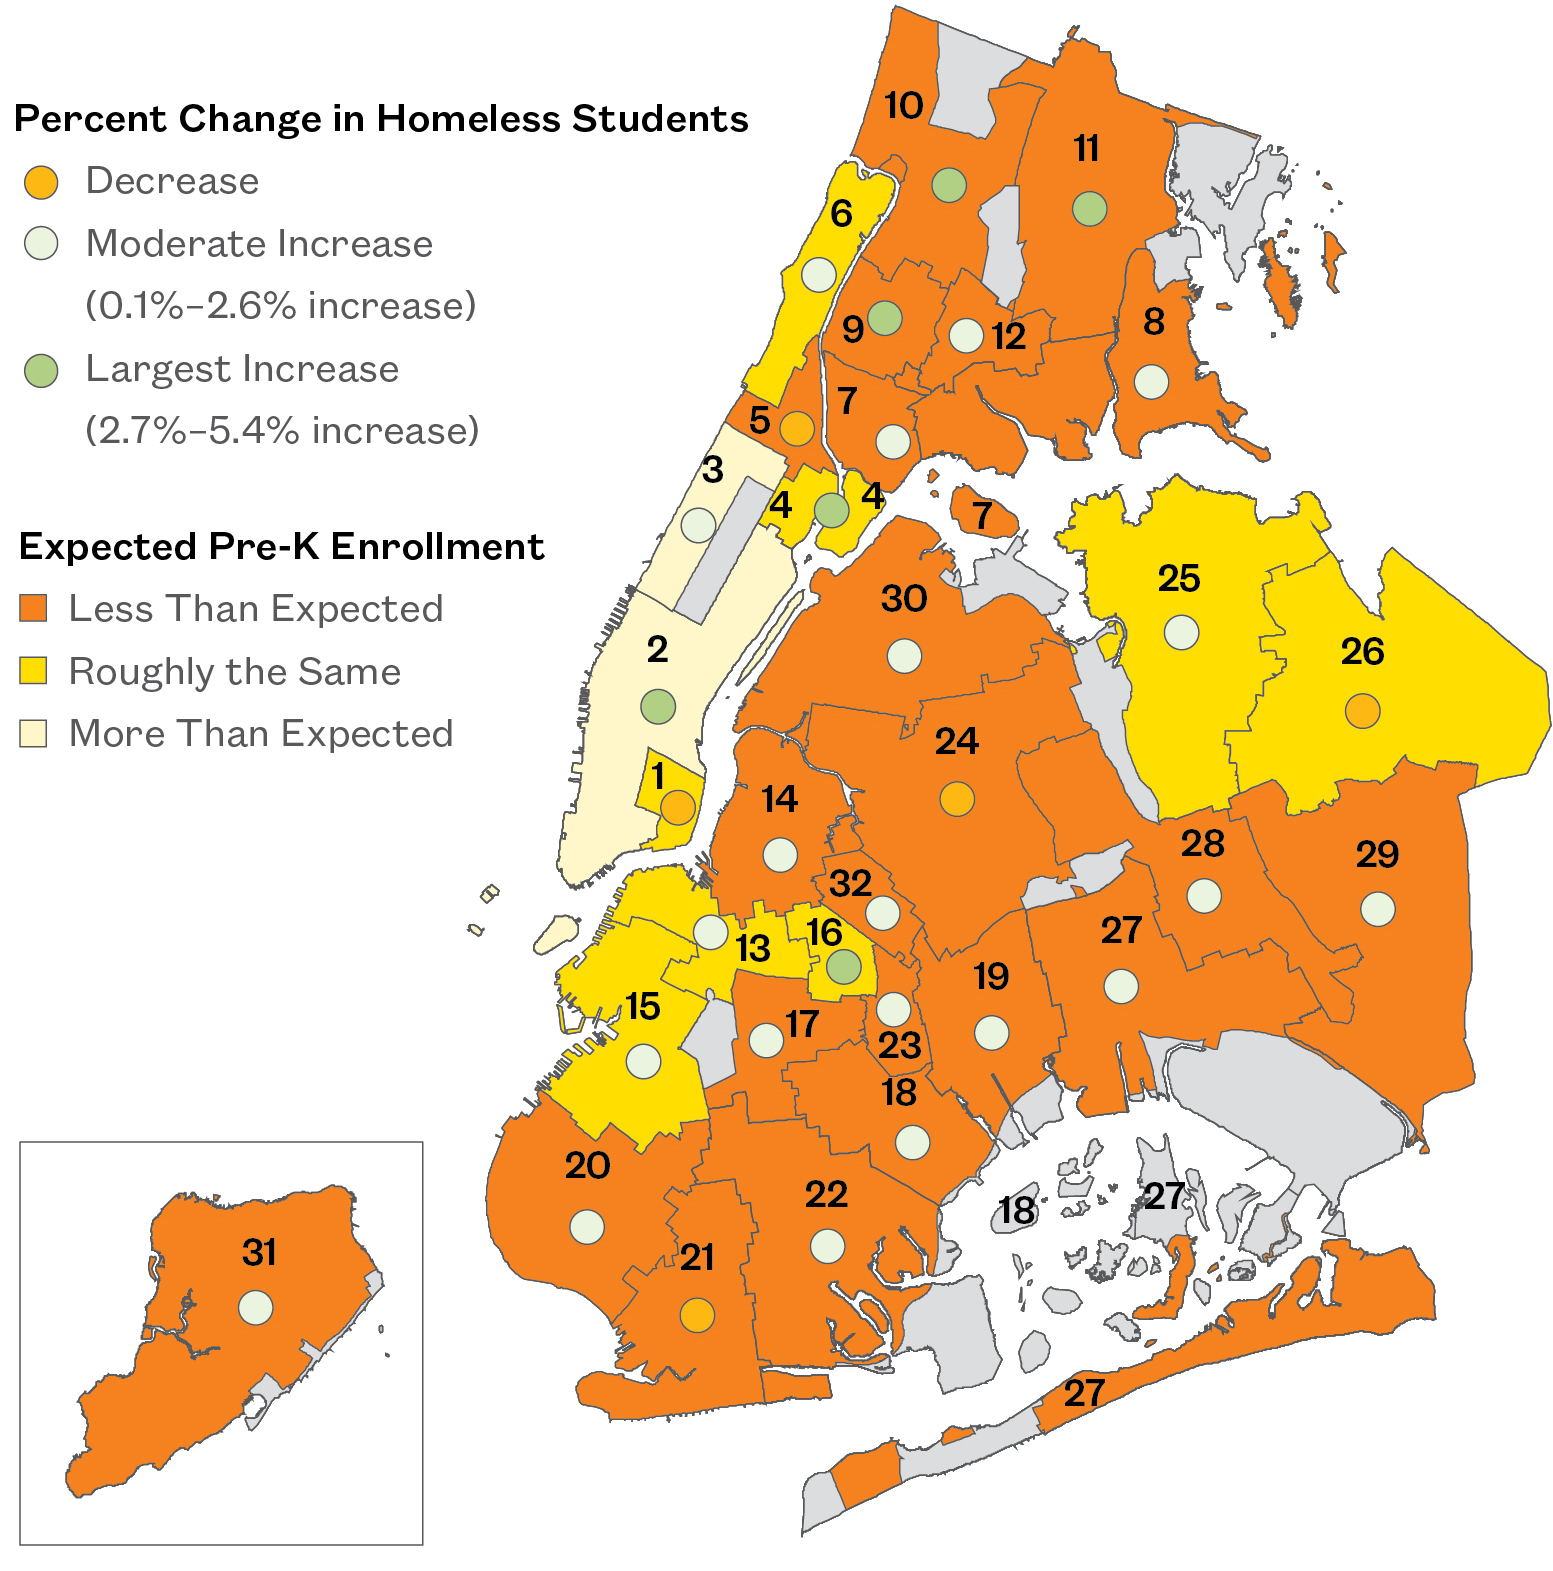
Where Do Students Who Are Homeless Enroll in Pre-K?
Percent of Pre-K Students Who Are Homeless, by School District
SY 2014–15 to SY 2015–16
Explore Districts at bit.ly/StudentAtlasApp.
Pre-K Student Homelessness
SY 2015–16
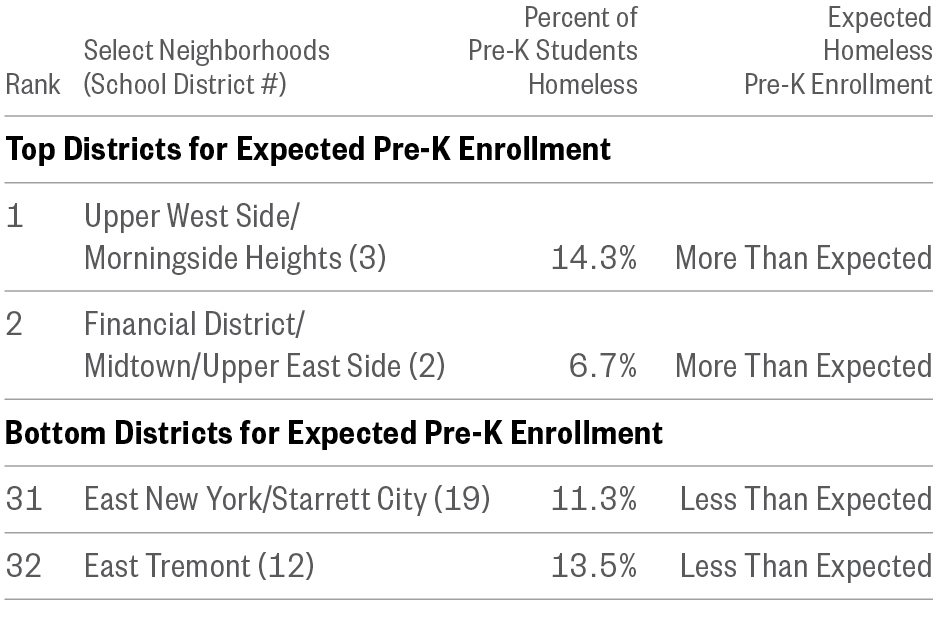
Note: Data are by school district for SY 2015–16 and do not include schools in non-geographic districts. Percentage groupings for the map of homeless students by district and the map of homeless pre-K students by district are matched for the purpose of comparison. Expected pre-K enrollment refers to the comparison between the percentage of pre-K students homeless and the percentage of Kindergarteners and first graders who were homeless. Districts that enrolled roughly the same had enrollment of the two groups within two percentage points of each other; those that enrolled more or less than expected saw at least a two percentage-point enrollment difference.
- The City has succeeded in increasing pre-K enrollment among children who have been homeless, with a 17% increase from SY 2014–15 to SY 2015–16.
- Central Harlem in Manhattan, Coney Island in Brooklyn and Sunnyside in Queens saw a decrease in pre-K enrollment of homeless students, yet enrolled a lower rate of pre-Kindergarteners than would be expected based on the percentage of other young homeless students. (Districts 5, 21, and 24)
Homeless Students in Charter Schools
- On average, 6.6% of students in New York City charter schools were homeless in SY 2015–16—three points lower than the rate among students in public schools (9.3%).
- This ranged from fewer than five homeless students in 10 charter schools citywide to a high of 19% of students in Sisulu-Walker Charter School of Harlem.
- Charter schools with the highest rates of student homelessness (9%–18.5%) were clustered in the districts where the most homeless students attend public schools. By contrast, in public schools in those districts, up to 48% of students were homeless.
The lower enrollment rate of homeless students in charter schools raises questions about enrollment opportunities for students who are experiencing housing instability.
What Charter Schools Do Homeless Students Attend?
Percent of Homeless Students by Charter School
SY 2015–16
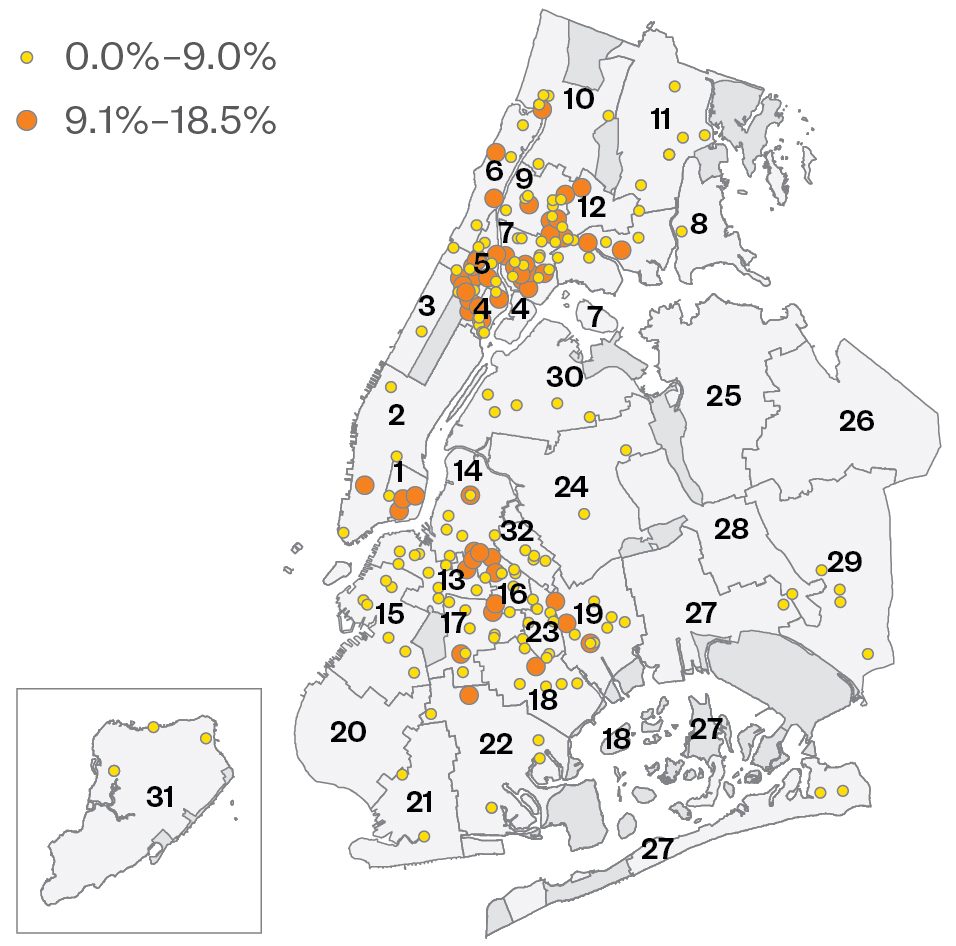
See schools at bit.ly/MapNYCHomelessStudents
Top 10 Charter Schools for Homeless Students
Note: While the total number of homeless charter school students is reported to the State annually, more detailed information on the outcomes of homeless students attending charter schools is not publicly available. School districts represent where charter schools are physically located and do not relate to the school’s administration.
Download Section 1 PDF
To explore homelessness in New York City schools, try our interactive map.
To learn more about the educational outcomes of homeless New York city students, try our Student Atlas app.
Return to top.
Section 2
Housing Instability Undermines School Stability: Mid-Year Transfers and Chronic Absenteeism
We have a really high population of students that are in temporary housing. I think a lot of students in temporary housing get lost in the cracks, because they are not always seen as homeless—but they are. They are doubled up or constantly moving around from home to home. They might not have adequate furniture or a desk where they are living. Or if Mom gets in a fight with her cousin, they could be out. It’s a lot of anxiety and stress for the kids. That comes out in all sorts of ways, behaviorally and academically.
—Social Work Director, Partnership with Children,working in Brooklyn public schools
Obviously there’s a relationship between chronic absenteeism and homelessness. … The students are underperforming. … They’re working on trying to reduce the absenteeism, but you know there are a lot of variables in terms of homelessness that are impacting the kids getting to school.
—Former Principal, Community School in Brooklyn
The New York City Department of Education has placed great emphasis on improving attendance and school stability for all students, including those living in homeless shelters and other temporary housing. These efforts are much needed, as students who experience housing instability are at a far greater risk for transferring schools and being absent. Mid-year school transfers destabilize students’ educations, disrupting their learning and removing them from teachers, classmates, and other school connections. Furthermore, transferring school mid-year heightens students’ risk for chronic absenteeism—one of the strongest predictors of educational achievement and graduation outcomes. Identifying students who are most vulnerable to school instability is critical to ensuring that homeless students are able to attend school and succeed at the same rates as their classmates.
What’s New?
- Overall, 22% of homeless students transferred out of their school mid-year in SY 2015–16, over two times the citywide rate.
- Disparities in transfer rates and chronic absenteeism persist even after homeless students become re-housed.
- Nine of the ten schools with the most homeless students transferring in mid-year were located in Hunts Point, Highbridge/Concourse, and Riverdale in the Bronx—areas of the city with the most family shelters. (Districts 8, 9, and 10)
Policy Considerations
- Continued gaps in school stability and attendance for formerly homeless students highlight the lasting impact of homelessness on a family’s life—and the need for continued supports that do not end once a student becomes housed.
- Schools and shelters should use available data to further coordinate supportive services between schools and shelters, creating more opportunities for effective attendance, transportation, and other school supports.
Mid-Year School Transfers
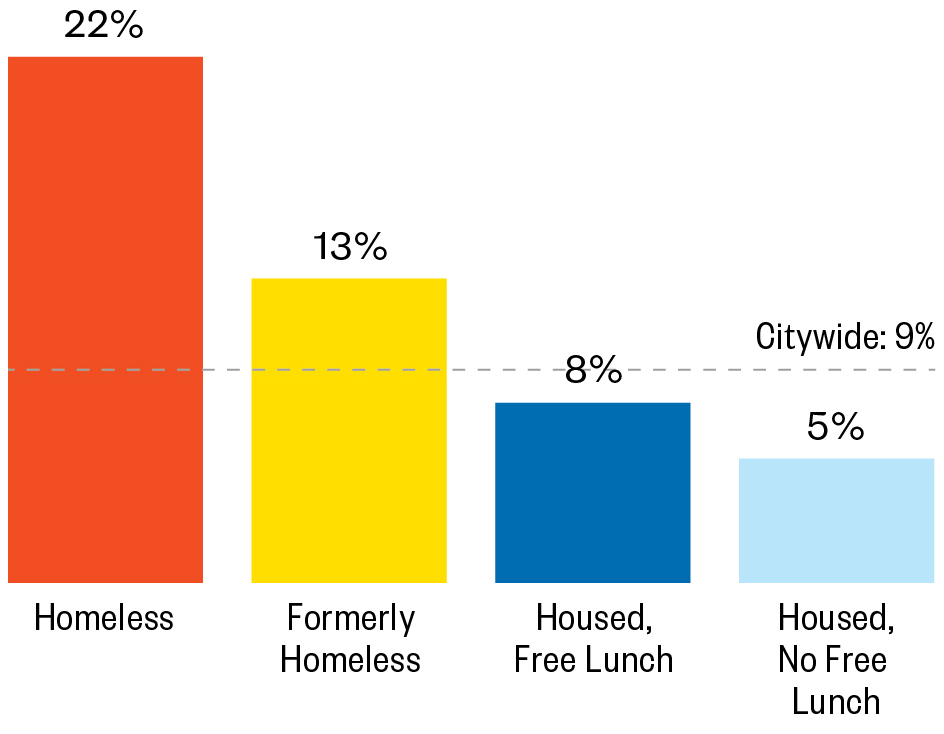
- More than one in every five (22%) homeless students transferred schools mid-year in SY 2015–16—nearly three times the rate of low-income housed students (8%) and four times that of housed students who were not (5%).
- Formerly homeless students transferred mid-year at a nearly 50 percent higher rate than their low-income housed classmates and close to three times the rate of their non-low-income housed classmates (13%, 8%, and 5%).
Mid-Year School Transfer Rate
SY 2015–16
 Note: “Formerly Homeless” includes students who were housed during SY 2015–16 but were homeless at any point during SY 2010–11, SY 2011–12, SY 2012–13, SY 2013–14, and/or SY 2014–15.
- Not only did homeless and formerly homeless students transfer schools mid-year at a higher rate, but they experienced more extreme levels of school instability as well. Four percent of homeless students and two percent of formerly homeless students—3,900 and 600 students respectively—transferred two or more times in the middle of SY 2015–16, compared to 1% of housed, low-income students and 0.4% of housed students who were not.
Disparities in transfer rates persisted even after homeless students became housed. This highlights the lasting impact of homelessness on a family’s life and the need for continued supports that do not end once a student becomes housed.
Number of Mid-Year Transfers, by Housing Status
SY 2015–16
![]()
Note: Mid-year transfers refer to when students transferred into or within their school district during the 2015–16 school year. “Formerly Homeless” includes students who were housed during SY 2015–16 but were homeless at any point during SY 2010–11, SY 2011–12, SY 2012–13, SY 2013–14, and/or SY 2014–15.
- While the citywide transfer rates for both homeless and housed students have declined since SY 2010–11, a significant gap persists (22% to 7%).
- The mid-year transfer rate declined across housing statuses, with decreases in the rates for both doubled-up and sheltered students (20%–16% and 39%–33%).
- Students living in shelter had the highest mid-year transfer rates of any housing status across all years from SY 2010–11 to SY 2015–16 (39% in SY 2010–11 and 33% in SY 2015–16). These students transferred mid-year at roughly four times the overall housed and citywide rates (33%, 7%, and 9%).
Every mid-year school transfer is estimated by the U.S. Department of Education to set a student back academically by up to six months.
Changes in Citywide Transfer Rates
Percent of Students Who Transferred Mid-Year, by Housing Status and Year
SY 2010–11 to SY 2015–16
![]()
Note: “All Homeless” includes all categories of homelessness.
- Homeless elementary students had the highest mid-year transfer rate (26%) of any age group—roughly 50 percent higher than homeless students in middle and high school and over three times the rate of their housed elementary school peers. Among those living in shelter, this rate was even higher (41%).
- Across all grade levels, students living in shelter had the highest mid-year transfer rates followed by those in other homeless situations. While their rates were lower than sheltered and other homeless students, those living doubled up were still more likely to transfer mid-year than housed students (19% to 8% in elementary school).
- Students in other homeless settings who were not living doubled up or in shelter were also at a high risk of transferring schools mid-year (28% in elementary school).
Mid-Year Transfer Rates
Percent of Students Who Transferred
SY 2015–16
By Housing Status and Grade Level
![]()
Note: “Other Homeless” includes students who were awaiting foster care, paying for a hotel/motel outside of the shelter system, unsheltered, or living in another temporary and/or unsuitable housing situation. Students are categorized according to whether they experienced homelessness, lived in a shelter, or lived doubled up at any point during SY 2015-16.
Geographic Patterns of Mid-Year Transfers
School Instability Across Districts
Mid-Year Transfer Rate: Percent of Homeless Students Who Transferred Into or Within the District
SY 2015–16
![]()
Note: Transfer rate shows the percentage of homeless students who transferred into or within the district at some point during the school year. Data are by school district for SY 2015–16 and do not include schools in non-geographic districts.
Explore Districts at bit.ly/StudentAtlasApp.
- In every City school district, more than one in every ten homeless students transferred mid-year. This ranged from a low of 10% in Bay Ridge, Brooklyn to a high of one in three (34%) homeless students in Staten Island. (Districts 20 and 31)
- By borough, students living in shelter were most at risk for mid-year transfers in Staten Island and Queens (62% and 41%), while students living doubled up saw the highest rates in Staten Island and the Bronx (21% and 17%).
- Homeless students in Brooklyn’s East New York and Brownsville, Woodhaven in Queens, and Staten Island were at the greatest risk for school instability, with more than one in every four (26%–34%) homeless students transferring into the district mid-year. (Districts 19, 23, 27, and 31)
Many school districts face the dual challenges of high homelessness and mid-year transfers into schools, creating additional strain on limited school funding.
Mid-Year Transfer Rates
SY 2015–16
![]()
Note: Mid-year transfer rate shows the percentage of homeless students who transferred into or within the district at some point during SY 2015–16. Data by school district do not include schools in non-geographic districts, so borough and district total percentages may differ. Ns of fewer than 30 students were redacted.
- Nine of the ten schools with the most homeless students transferring in mid-year were located in Hunts Point, Highbridge/Concourse, and Riverdale in the Bronx—areas of the city with the most family shelters. (Districts 8, 9, and 10)
- P.S. 094 Kings College School in Riverdale and P.S. 053 Basheer Quisim in Claremont Village had the most homeless students transferring into the school mid-year (126 and 125 students). (Districts 10 and 9, respectively) In these schools, homeless students represented more than half of all students who transferred into the school mid-year (56% and 60%).
Top 10 Schools for Homeless Student Transfers
Top 10 Schools for the Number of Homeless Students Who Transferred Into the School Mid-Year
SY 2015–16
![]()
See schools at bit.ly/MapNYCHomelessStudents
Top 10 Schools for Homeless Student Transfers
SY 2015–16
 Note: Mid-year transfers represent homeless students who transferred into the school at some point during the school year. Schools with specialized service offerings were excluded from the ranking.
Homeless Students Transferring Out of School
Percent of Homeless Students Who Transferred Mid-Year Out of the School They Attended at the Start of the Year, by District
SY 2015–16
![]()
Note: Data are by school district for SY 2015–16 and do not include schools in non-geographic districts. Transfers include mid-year transfers only. Students who transferred more than once mid-year during SY 2015–16 were counted at their second-to-last school. School and district refer to the school attended at the start of the school year (on October 31st).
See schools at bit.ly/MapNYCHomelessStudents
- Overall, 22% of homeless students transferred out of their school mid-year in SY 2015–16.
- Homeless students attending school in Bedford-Stuyvesant and Brownsville in central Brooklyn were at the greatest risk of transferring out of the school they attended at the start of the year. Between 30% and 38% of homeless students who started the school year in those districts transferred out of their school mid-year. (Districts 16 and 23)
When students become homeless, exit homelessness to permanent housing, or undergo other housing transitions, their teacher and classmates are often the only stabilizing connections. Keeping students who are undergoing housing instability in the same school for the full year is critical.
Empty Seats: Chronic Absenteeism
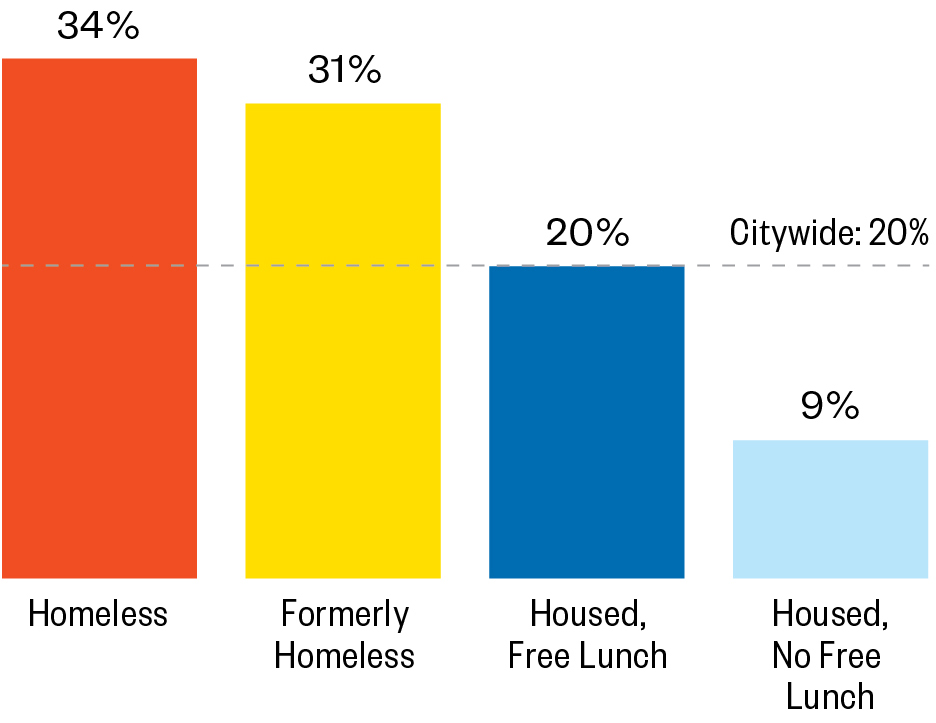
- On average, one-third of homeless students are chronically absent, missing 20 or more school days in one year— the equivalent of one month of school. This rate is 50 percent higher than the citywide average of low-income students who are housed (34% and 20%).
- One-third of homeless students (34%) were chronically absent, close to four times the rate of housed students who were not low income (9%).
- Students who had a history of homelessness but were housed in SY 2015–16 (formerly homeless) were still facing instability at school. Almost a third (31%) were chronically absent, just three points lower than students who experienced homelessness during SY 2015–16 (31% and 34%).
Formerly homeless students represent a distinct group of children who are still experiencing lingering destabilizing effects on their educations. This highlights the need for ongoing academic and social supports for students even after students are no longer homeless.
Chronic Absenteeism Rate
Percent of Students Missing 20 or More School Days in One Year
SY 2015–16
Note: “Formerly Homeless” includes students who were housed during SY 2015–16 but were homeless at any point during SY 2010–11, SY 2011–12, SY 2012–13, SY 2013–14, and/or SY 2014–15.
- Formerly homeless students experienced almost the same risk of absenteeism as their currently homeless classmates, highlighting the lingering destabilizing effects of homelessness on students’ educations.
- Roughly one-third of homeless and formerly homeless students missed 20 or more days of school in SY 2015–16, making them chronically absent (34% and 31%).
- One in eight homeless and formerly homeless students missed 40 or more school days in SY 2015–16—roughly 20% of the school year.
Number of Days Absent, by Housing Status
SY 2015–16
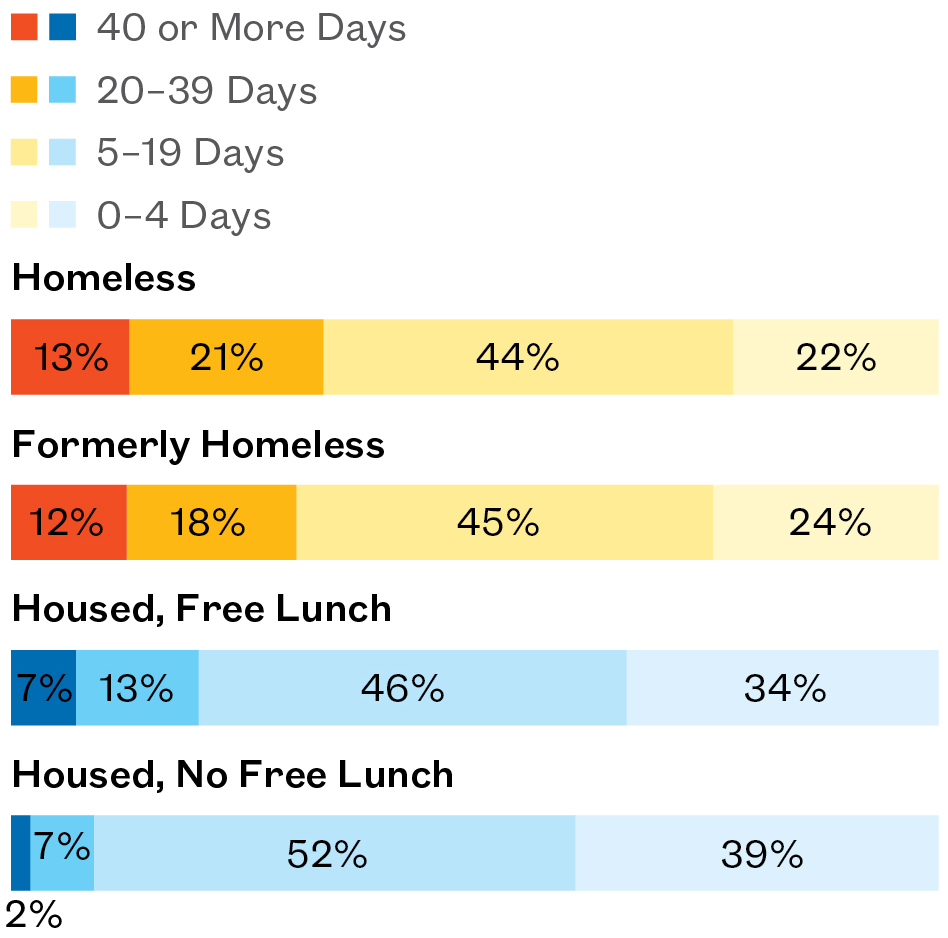
Note: “Formerly Homeless” includes students who were housed during SY 2015–16 but were homeless at any point during SY 2010–11, SY 2011–12, SY 2012–13, SY 2013–14, and/or SY 2014–15. Percentages may not add to 100% due to rounding.
- As New York City has sought to improve attendance for students citywide, homeless students overall saw a 20 percent rate decline in their chronic absenteeism rate in six years—from 41% to 34% (SY 2010–11 to SY 2015–16).
- However, the declines in the overall citywide and homeless student chronic absenteeism rates exaggerate the degree of improvement. When rates are broken out by type of housing setting, both sheltered and doubled-up students saw small declines in their chronic absenteeism rates compared to housed students. Much of the overall improvement among homeless students was due to the increase in the number of doubled-up students in the city.
Examining trends over time by the type of homelessness experienced is critical to assessing the impacts of policies and programs.
Changes in Citywide Chronic Absenteeism Rates
Percent of Students Chronically Absent, by Housing Status and Year
SY 2010–11 to SY 2015–16
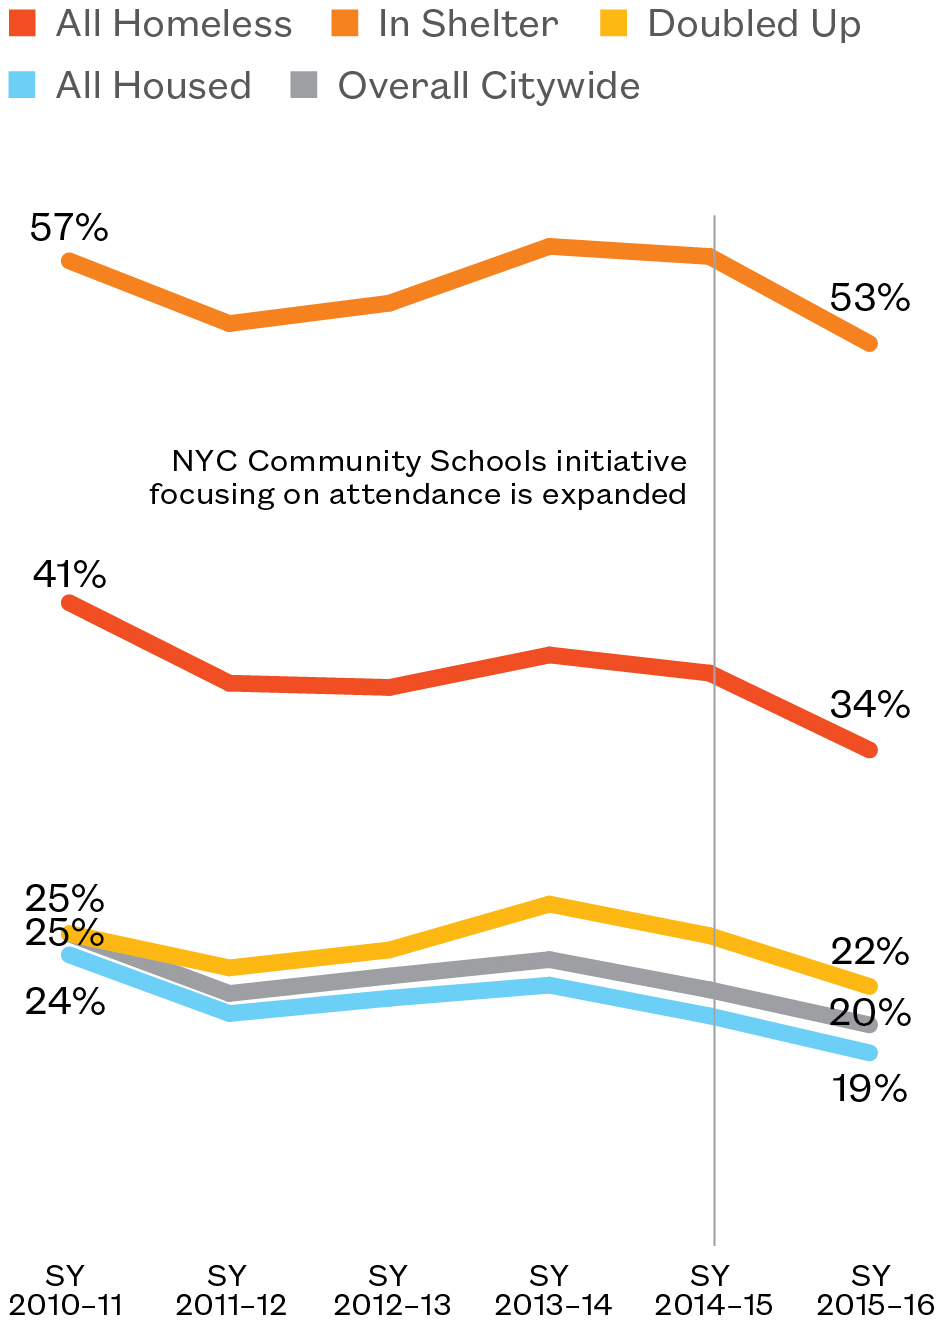
Note: New York City has been making strong commitments to improve attendance among students. Most recently, the de Blasio administration announced its expansion of the community schools initiative in June 2014. The first phase was planned to target 45 Attendance Improvement and Dropout Prevention (AIDP) schools. In the following years, more than 100 schools were served by the Community Schools model. “All Homeless” includes all categories of homelessness.
- Homeless students of all ages were at a greater risk for chronic absenteeism than their housed peers. The gap was greatest in elementary school, when 31% of homeless students missed 20 or more school days—more than twice the rate of housed students (14%).
- Students living in homeless and housed settings alike were at a heightened risk for absenteeism in both pre-K and high school, with homeless students in those grades chronically absent at 50 percent higher rates than their peers in elementary and middle school.
- Across grade levels, homeless students living in shelter had higher chronic absenteeism rates than their homeless peers living doubled up.
Chronic Absenteeism Rates
Percent of Students Chronically Absent
SY 2015–16
By Housing Status and Grade Level
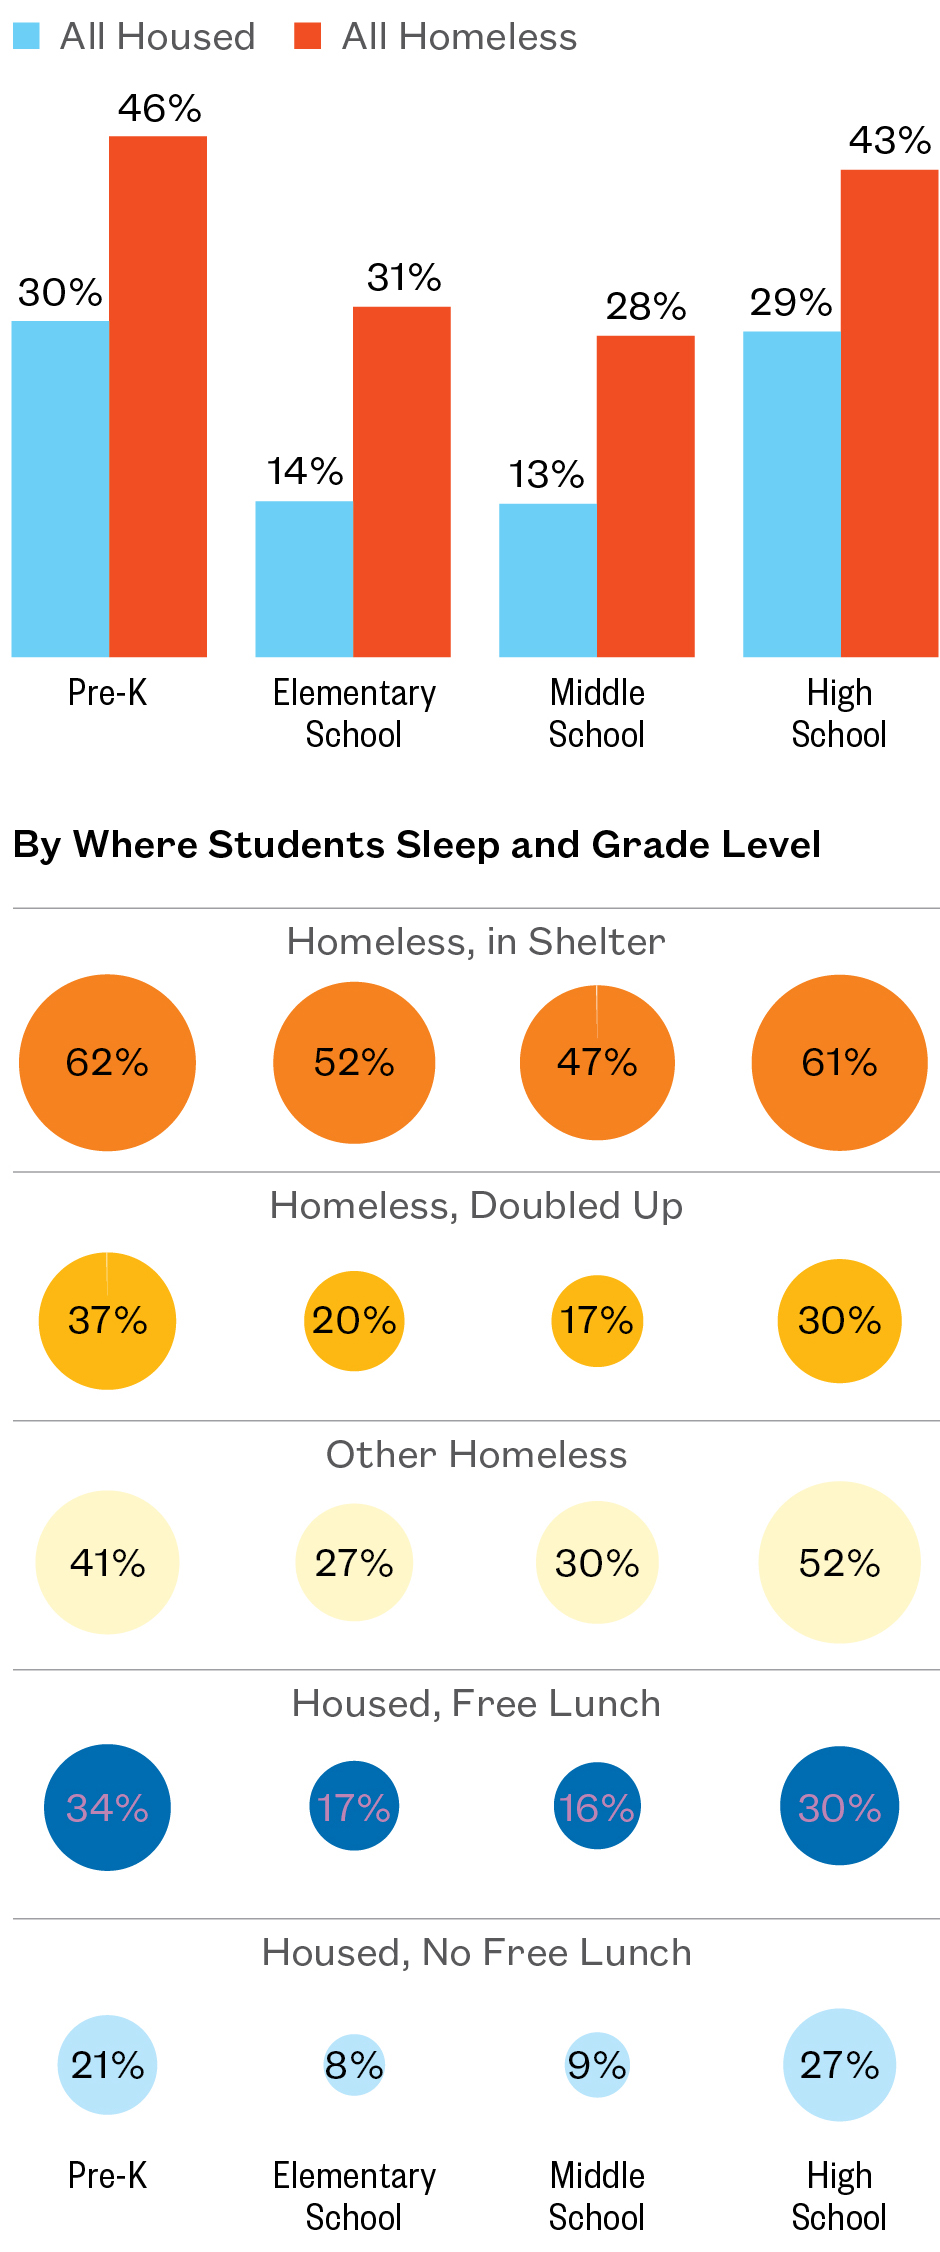
Note: “Other Homeless” includes students who were awaiting foster care, paying for a hotel/motel outside of the shelter system, or living in another temporary and/or unsuitable housing situation.
Geographic Patterns of Absenteeism
Chronic Absenteeism Among Homeless Students
SY 2015–16
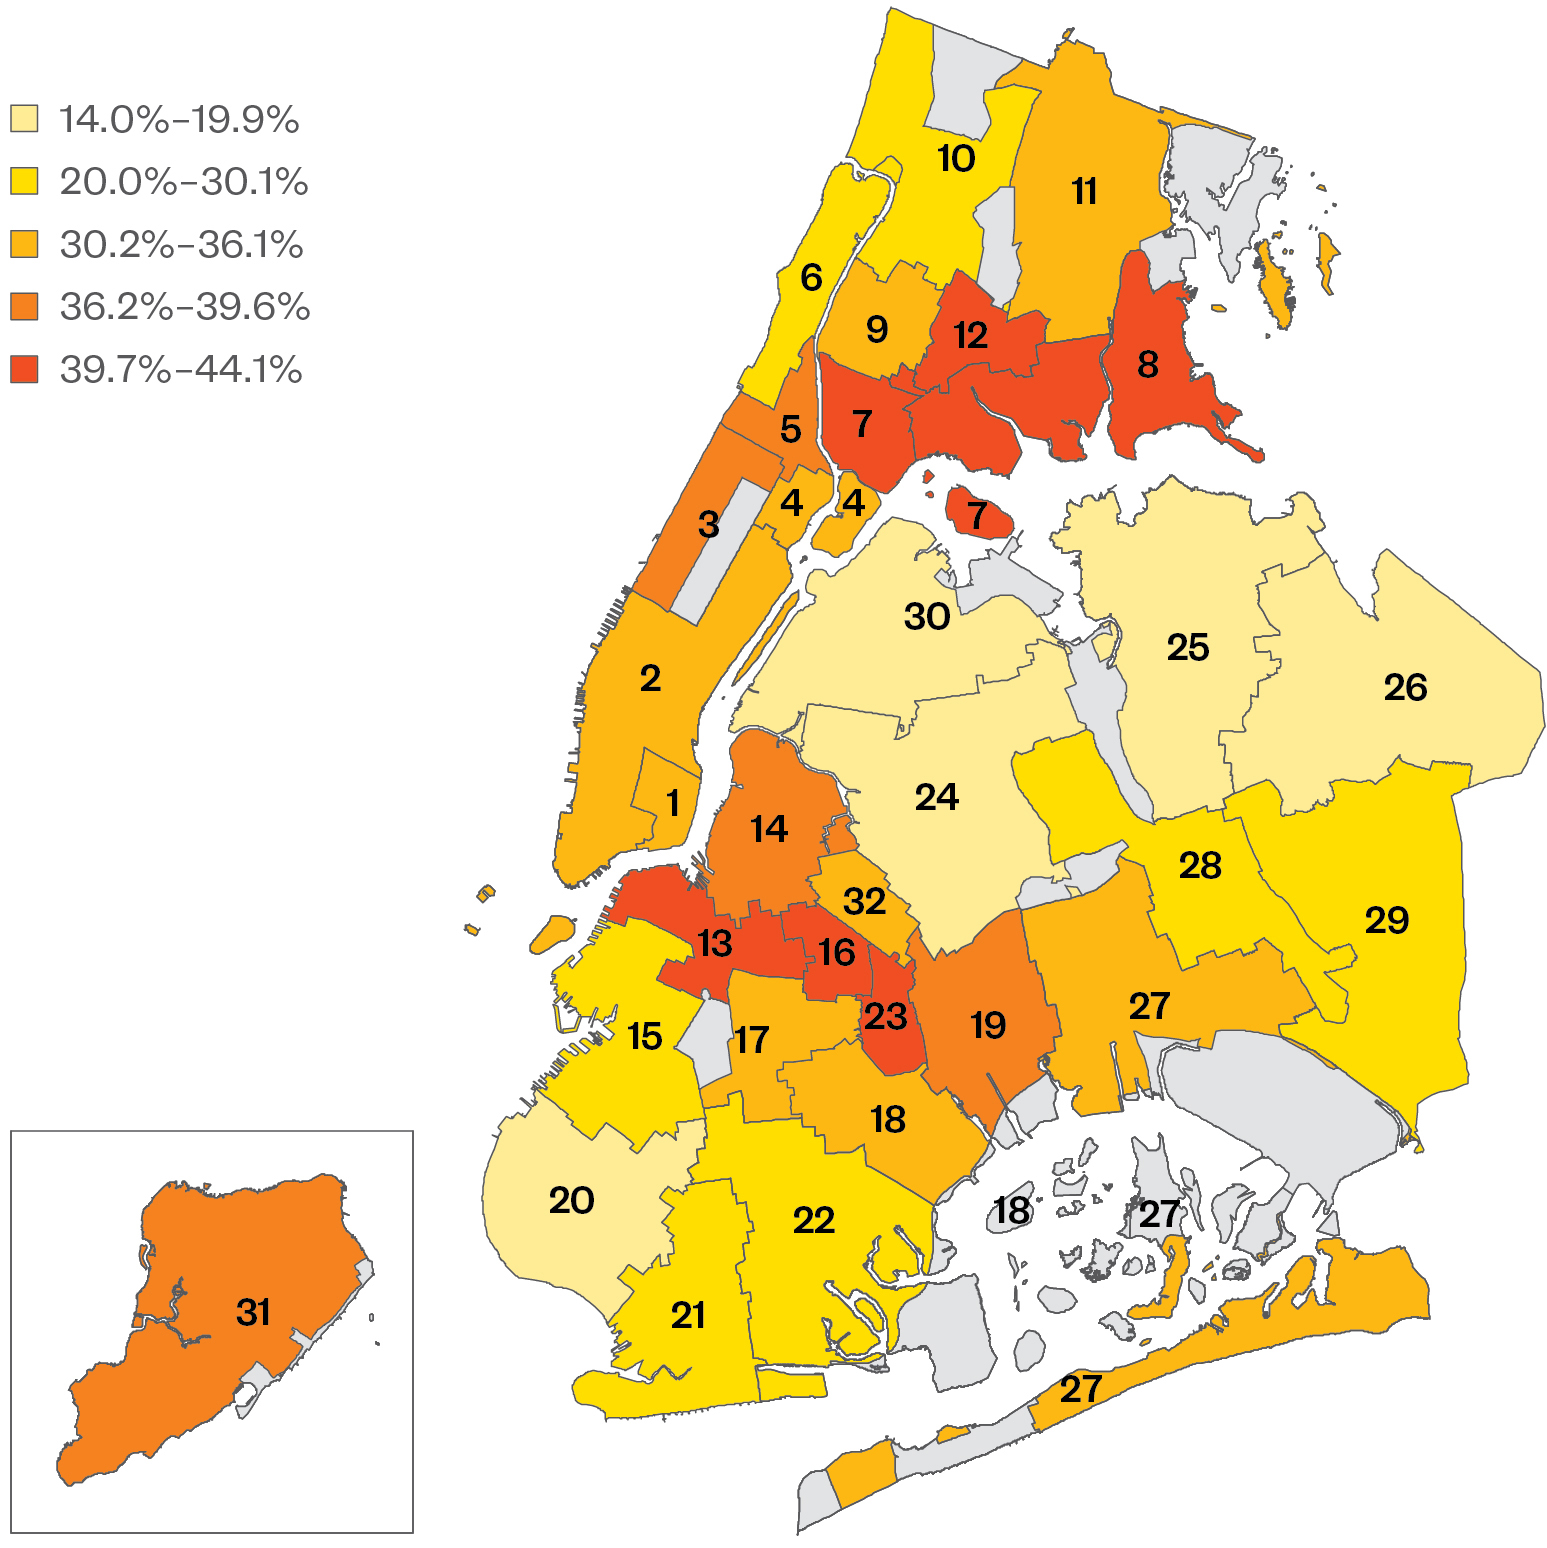
Note: Data are by school district for SY 2015–16 and do not include schools in non-geographic districts.
Explore Districts at bit.ly/StudentAtlasApp.
- On average, 34% of homeless students were chronically absent. This ranged from a low of 14% in Bay Ridge, Brooklyn to a high of 44% of homeless students in nearby Brownsville. (Districts 20 and 23)
- By borough, chronic absenteeism rates were highest for students living in shelter in Staten Island and in Queens (66% and 54%), while students living doubled up were most at risk for chronic absenteeism in Staten Island and the Bronx (25% and 24%).
- Across all school districts, homeless students living in shelter had the highest rates of chronic absenteeism when compared to all other housing and income groups.
Chronic Absenteeism Rate
SY 2015–16

Note: Mid-year transfer rate shows the percentage of homeless students who transferred into or within the district at some point during SY 2015–16. Data by school district do not include schools in non-geographic districts, so borough and district total percentages may differ. Ns of fewer than 30 students were redacted.
- Schools with the highest rates of absenteeism for homeless students were likely to be schools where housed students struggled as well. Close to 90% of homeless students were chronically absent at two schools in Clinton Hill, while over 80% of their housed classmates were chronically absent. (District 13)
The New York City Department of Education is supporting schools with high absenteeism by hiring additional attendance teachers and bolstering communication between shelters and schools. Continuing to develop targeted supports that combat absenteeism for both homeless and housed students is critical.
Top 10 Schools for Homeless Student Chronic Absenteeism
SY 2015–16
See schools at bit.ly/MapNYCHomelessStudents
Top 10 Schools for Homeless Student Chronic Absenteeism
SY 2015–16
 Note: Schools with specialized service offerings were excluded from the ranking.
Download Section 2 PDF
To explore homelessness in New York City schools, try our interactive map.
To learn more about the educational outcomes of homeless New York city students, try our Student Atlas app.
Return to top.
Section 3
Additional Support Needs of Homeless Students: Individualized Education Plans (IEPs) and English Language Learning (ELL) Services
“You can really see from the younger grades the impact [missing a lot of school] can have. When a student is in 4th or 5th grade, you see how they are in a totally different track than they would have been if they had stable housing and had access to all the resources that they need.”
—Social Work Director, Partnership with Children,working in Brooklyn public schools
“For most of the time [living in shelter], I would have to come early from school to be able to help [my Spanish-speaking grandmother/guardian] attend her appointments with the case worker or housing specialist. It definitely impacted my school but there was nothing I could do about it. I had to just handle it.”
—High school graduate, former participant in NYC Department of Education Students in Temporary Housing (STH) Unit supportive program
Over 55,000 students with additional educational needs experienced homelessness between SY 2010–11 and SY 2015–16, including students who were English Language Learners and those with special education support needs. However, homeless students are often unable to access the additional supports that they need, making it harder to keep pace with their age-and grade-level peers. Addressing the disparity in the receipt of supportive educational services will require multifaceted solutions, from programs that strengthen school engagement and stability to a focus on early screening and intervention. Ensuring that identification services are taking into account the individual needs of homeless students is key to ensuring that all students have an equal chance at receiving educational supports.
What’s New?
Not only were homeless students more likely to require English Language Learning (ELL) services when compared to their housed classmates, but they were also more likely to be designated as ELL for longer than their low-income and non-low-income housed peers. More than 40% of homeless ELL students still required ELL services after six years compared to one-third of low-income housed students and only 4% of non-low-income housed students.
Policy Considerations
When students are identified as needing ELL or IEP services, their school stability becomes paramount. Children who are frequently absent or who transfer mid-year struggle to receive the same consistent support for their special education or English language learning needs, and face additional challenges catching up to their classmates. Unless needed school stability and attendance supports are provided, schools’ ability to meet homeless students’ additional support needs will be in jeopardy.
Overlooked: Who Receives Late IEPs?
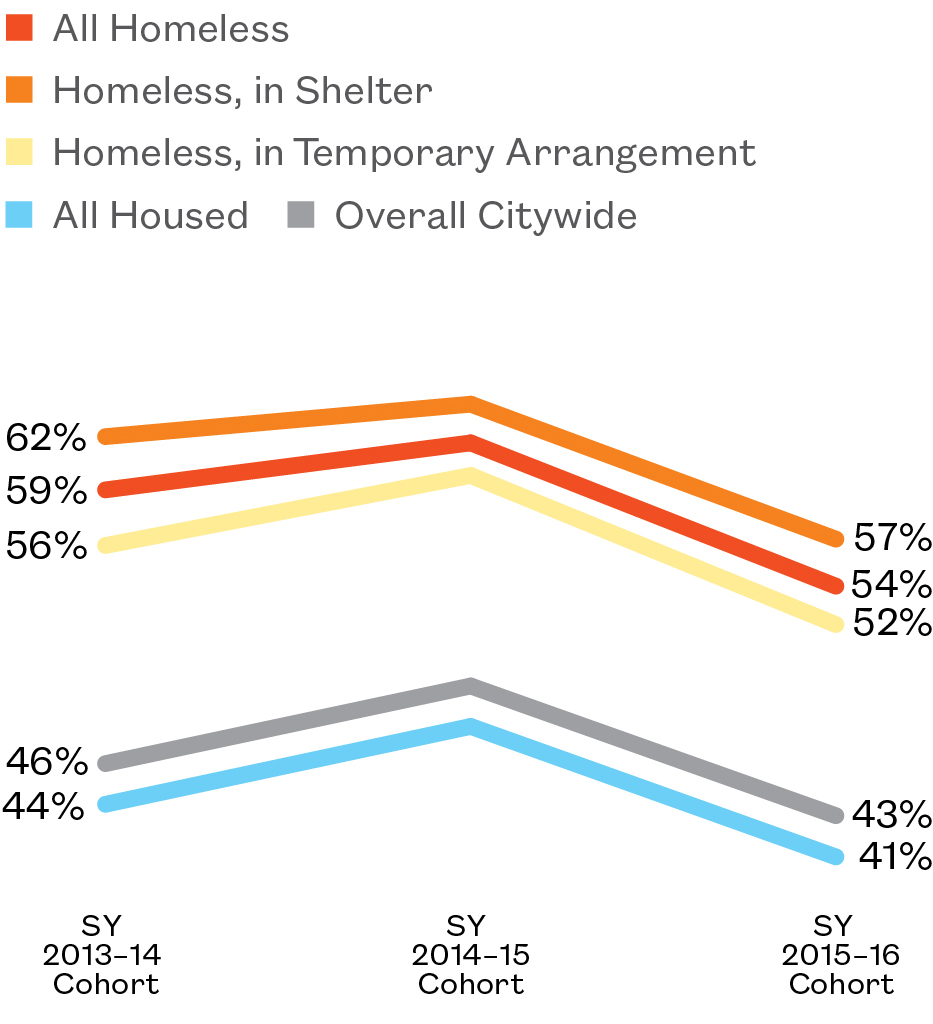
- Homeless students were more likely than their housed peers to have their IEP needs identified late. Less than half (46%) of homeless students with IEPs were identified by the end of Kindergarten compared to 59% of housed students.
- The disparity in late identification of special education needs exists beyond poverty. Less than half (46%) of homeless students who had been homeless at some point received their IEP by the end of Kindergarten, compared to 58% among low-income housed students and almost two-thirds (64%) of non-low-income housed students.
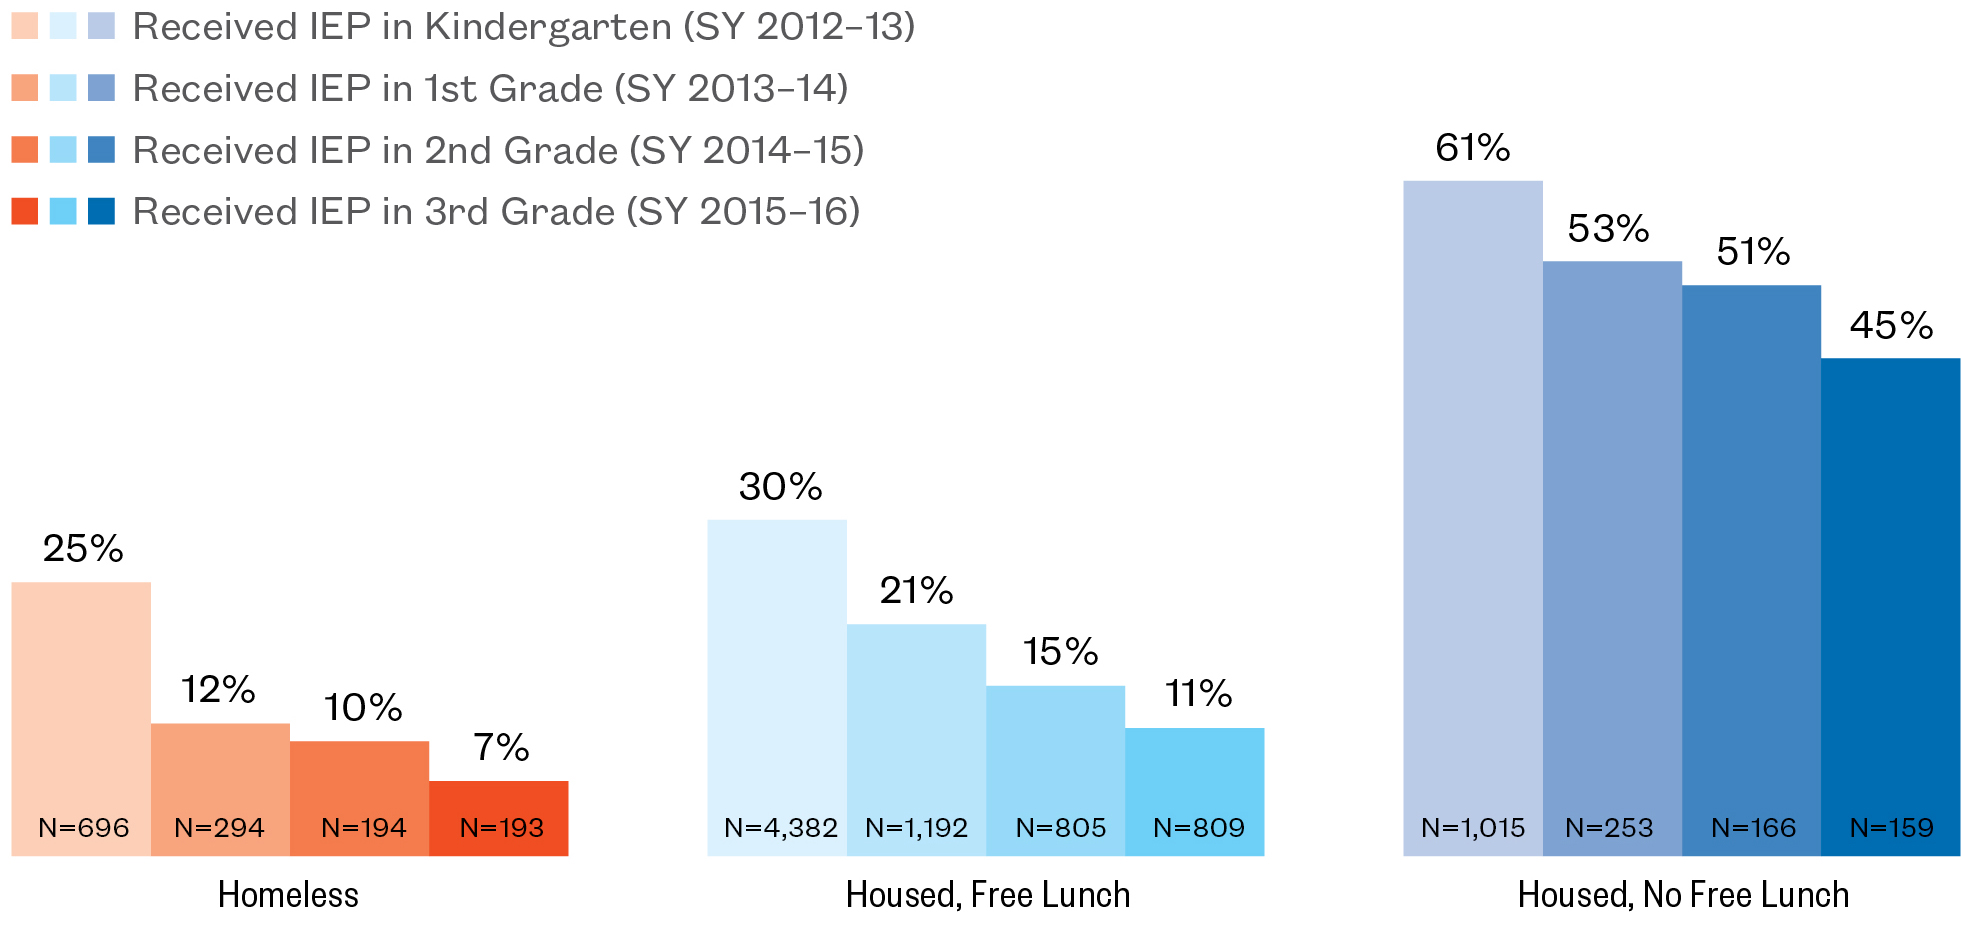
- One in seven (14%) students who had ever been homeless received their IEP in SY 2015–16—their third-grade year, compared to 11% of low-income housed students and 9% for housed students who were not low income.
The Individualized Education Plan (IEP) outlines the special education services a student will receive to support their learning. Districts are legally required to identify and evaluate all children facing challenges within one of 13 disability categories such as speech or language impairment and learning disabilities.
Year Received an IEP
SY 2012–13 to SY 2015–16
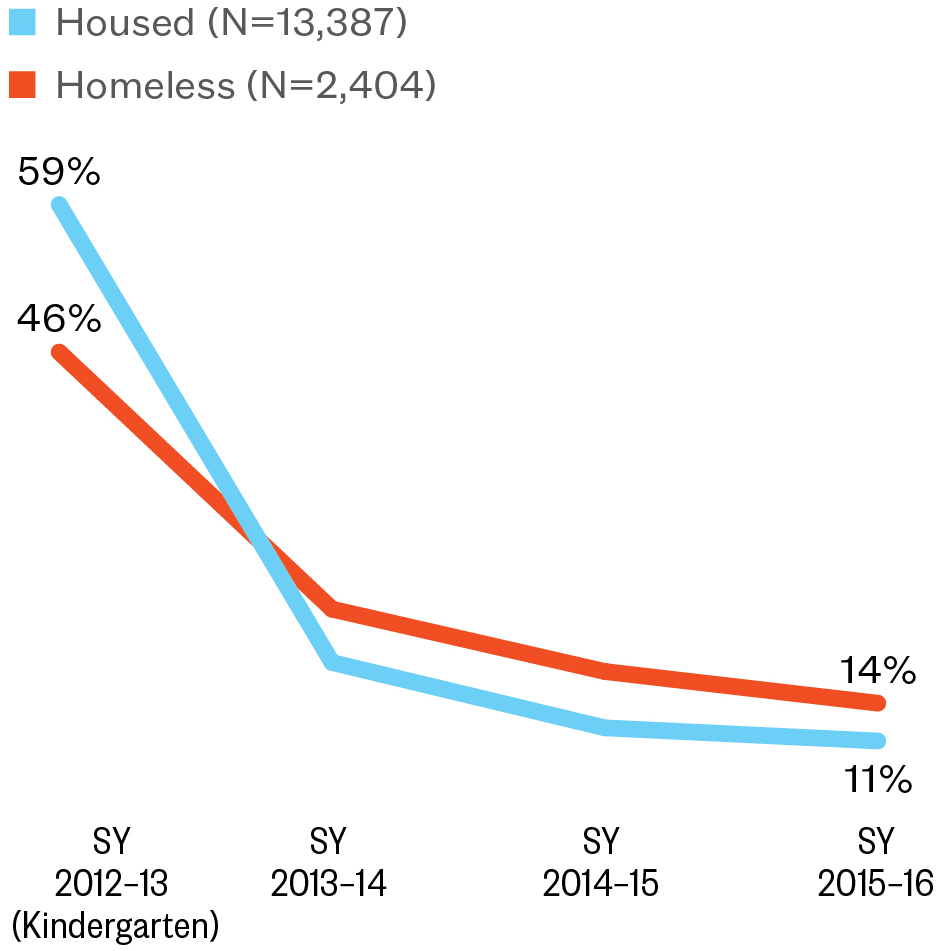
Note: Housing status is over four years. “Housed” indicates that the student never experienced homelessness. “Homeless” indicates that the student was homeless at some point in the four-year period. These data represent a cohort of students who entered Kindergarten in SY 2012–13 and received an IEP at some point during the next four years.
Year Received an IEP, by Housing Status
SY 2012–13 to SY 2015–16
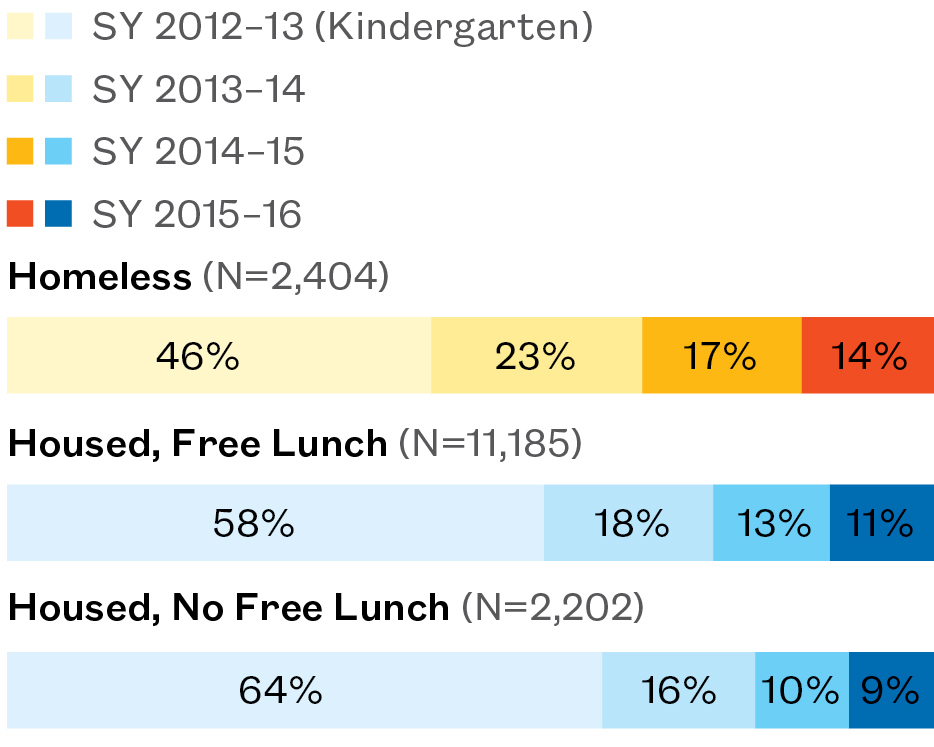
Note: Students are categorized according to whether they experienced homelessness or received free lunch at any point during the four-year period. These data represent a cohort of students who entered Kindergarten in SY 2012–13 and received an IEP at some point during the next four years. Percentages may not add to 100% due to rounding.
- Amidst citywide policy changes bringing special education students back into general education classrooms and their neighborhood schools, City public schools have succeeded in identifying students earlier for IEPs. Among special education students citywide, those in the SY 2015–16 cohort were less likely to be identified late (after Kindergarten) than students in the SY 2013–14 cohort (43% to 46% overall).
- Homeless students also saw a decline in the percentage receiving their IEP late (after Kindergarten) from 59% in the SY 2013–14 cohort to 54% in the SY 2015–16 cohort. Still, these rates of late identification over time were higher than housed students, placing young homeless children at greater risk for having unidentified special education needs.
- The rates of late IEP identification for students who had been in shelter were higher than homeless students who lived in other non-shelter temporary arrangements (57% to 52% in the SY 2015–16 cohort)
Going without needed supports for the first three years of a child’s education makes it harder to keep pace with their age- and grade-level peers, especially when the child is also undergoing other challenges associated with housing instability. How can City shelters and schools further support young students and parents to navigate the IEP process?
Changes in Citywide Late IEP Rates
Percent of Students with Special Education Needs Who Received IEP Late (After Kindergarten), by Housing Status and Year
SY 2010–11 to SY 2015–16
Note: Cohorts represent groups of students who attended New York City Public Schools for four years ending in the cohort year (SY 2013–14, SY 2014–15, or SY 2015–16) and received an IEP at some point during the four years. Students are categorized according to whether they experienced homelessness or lived in a shelter at any point during the four-year cohort periods.
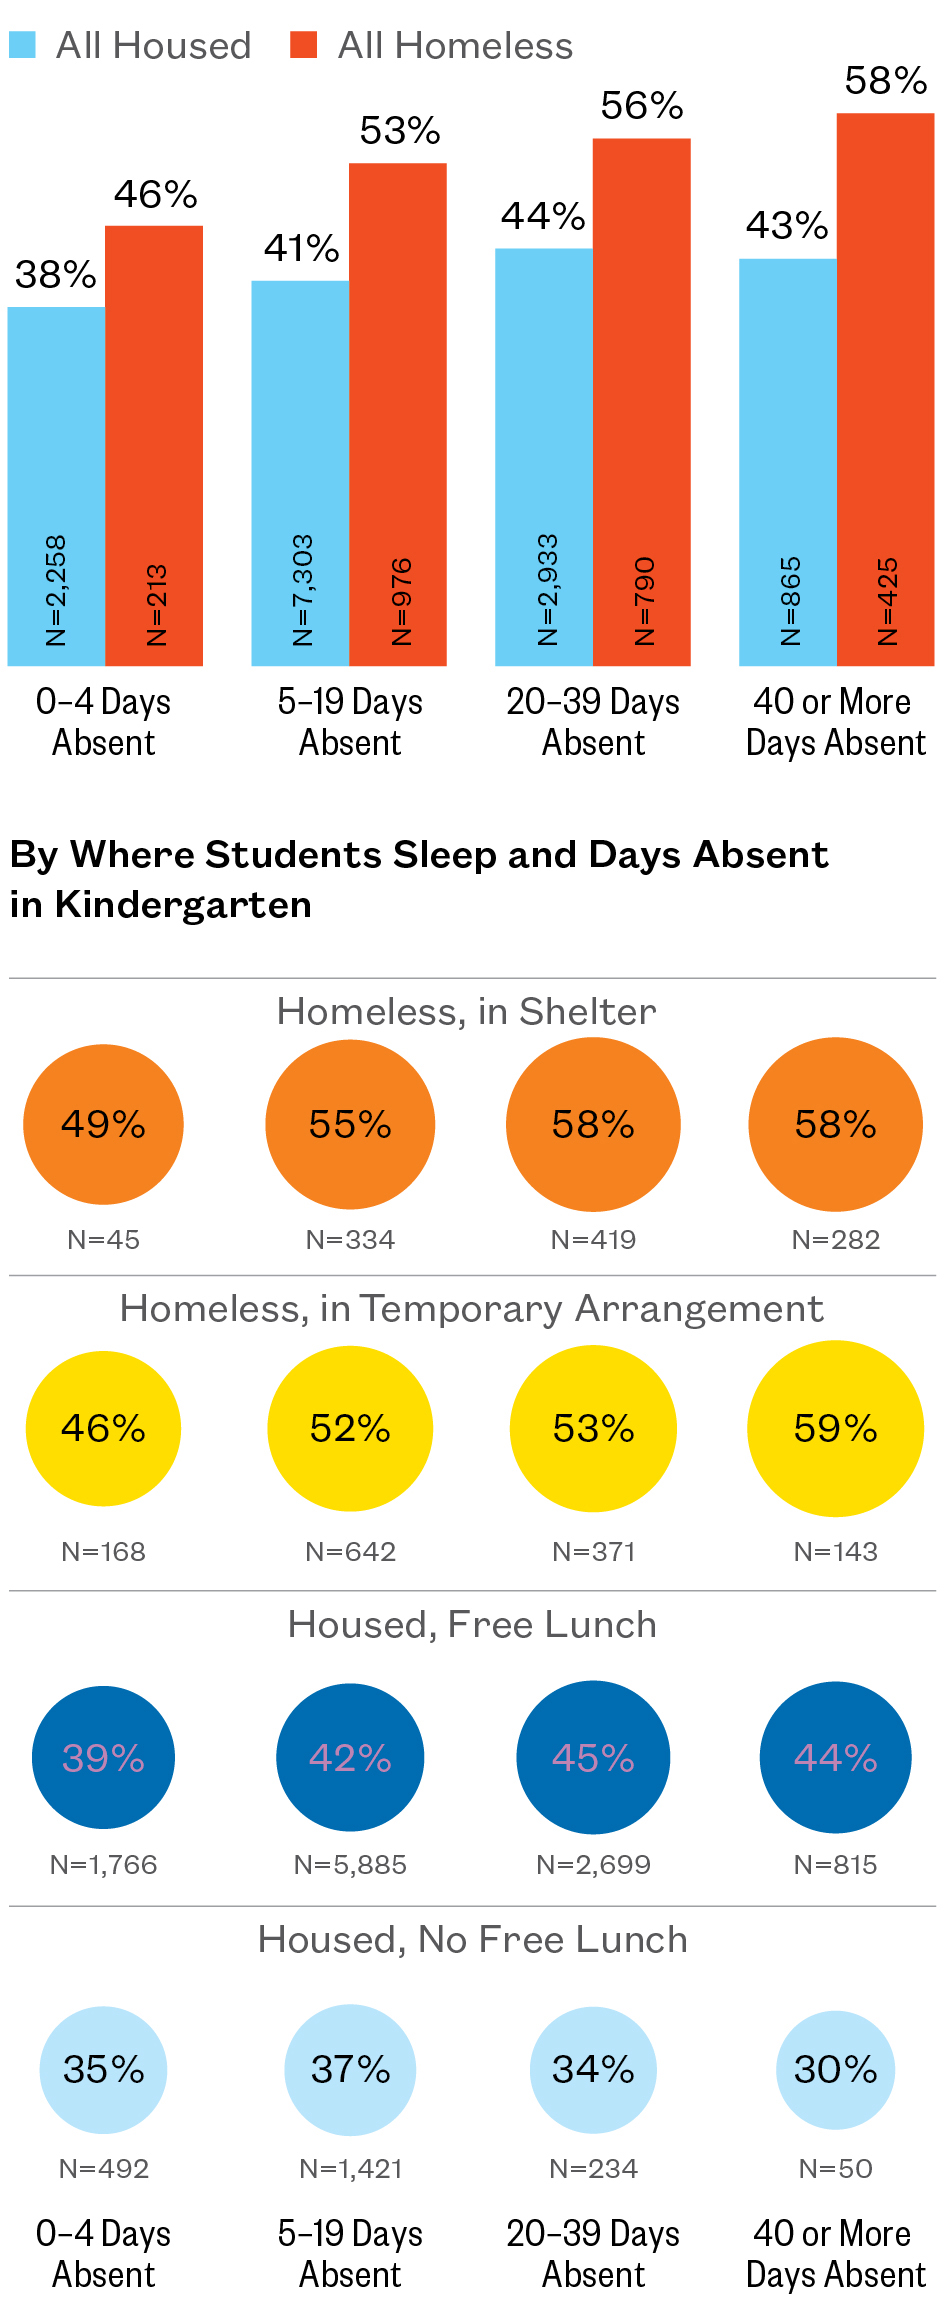
- School absences increase the risk of late IEP identification. This effect is even more pronounced for homeless students: those with 40 or more absences in one school year had a 12-point higher rate of late IEP identification compared to their homeless peers with only 0–4 absences, while housed students saw a roughly five-point gap driven by absences.
- Among students who missed just four or fewer school days in Kindergarten, less than half of homeless students received their IEP late. This was just eight points higher than the rate for housed students (46% to 38%).
Absenteeism places students at risk of not only falling behind academically, but also slipping through the cracks when it comes to identification of additional support needs.
Late IEP Rates by Absenteeism
Percent of Students with Special Education Needs Who Received IEP Late (After Kindergarten)
SY 2012–13 to SY 2015–16
By Housing Status and Days Absent in Kindergarten
Note: Absenteeism reflects days absent in Kindergarten. These data represent a cohort of students who entered Kindergarten in SY 2012–13 and received an IEP at some point during the next four years. Students are categorized according to whether they experienced homelessness, lived in a shelter, or received free lunch at any point during the four-year period.
Early Identification Matters
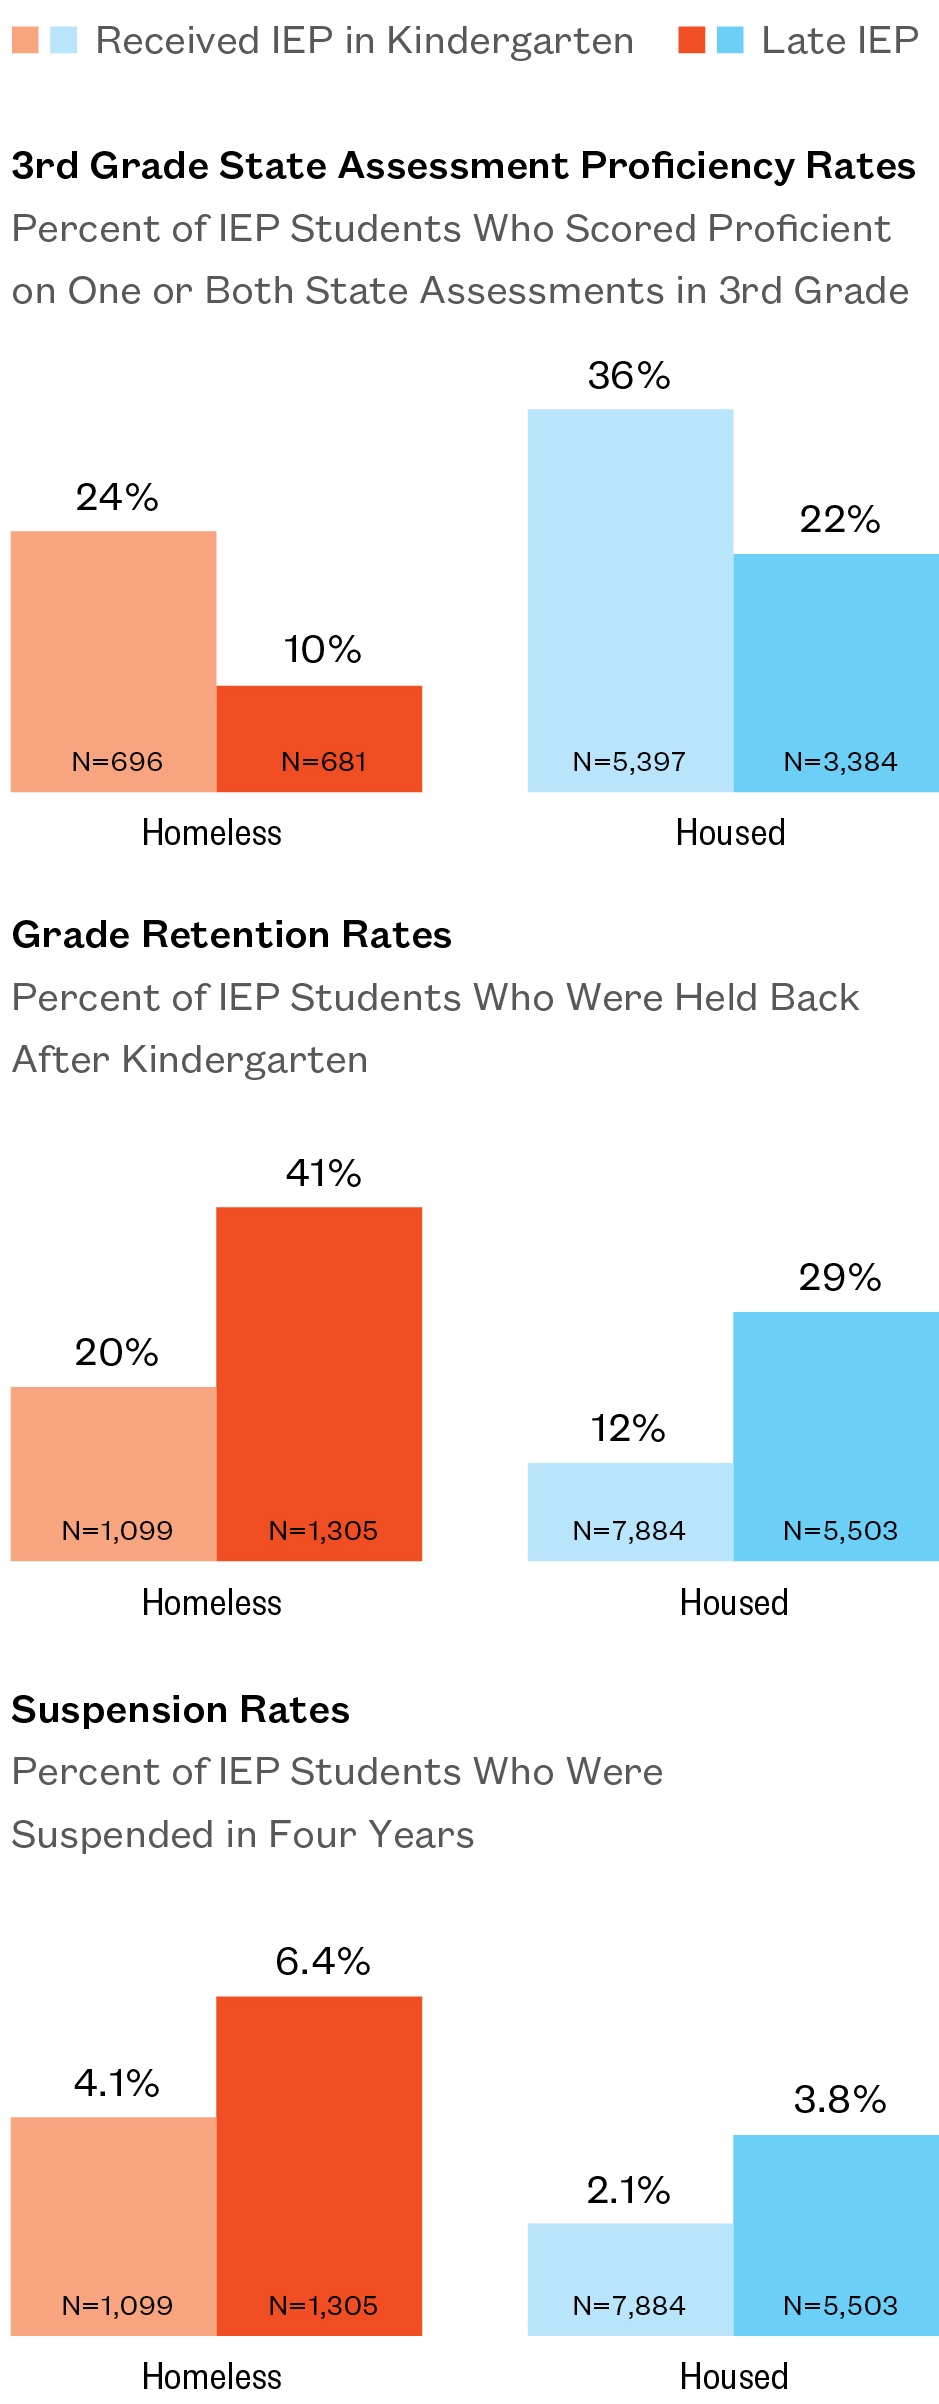
- One-quarter (24%) of homeless students who received their IEP by the end of Kindergarten scored proficient on their 3rd grade State assessments. Meanwhile, only one in 10 homeless students with late IEPs were proficient. This gap was similar for housed students, although housed proficiency rates were higher.
- Forty-one percent (41%) of homeless students with late IEPs were held back at some point. Homeless peers with early IEPs saw half that rate, however—20% repeated a grade. While early identification helped, grade retention was higher for homeless students than their housed peers (20% to 12%).
- Homeless special education students were at a greater risk of suspension if they received their IEP late (after Kindergarten). Four percent of homeless students who received their IEP in Kindergarten were suspended at some point, while six percent of those who went unidentified for special education services were suspended. A similar pattern existed among housed students, though homeless students had roughly twice the suspension rates of housed students.
Ensuring that homeless students with additional support needs are connected with services at an early age can increase educational success.
Educational Outcomes by Late IEPs
SY 2012–13 to SY 2015–16
Note: These data represent a cohort of students who entered Kindergarten in SY 2012–13 and received an IEP at some point during the next four years. IEP students who were held back or followed a nontraditional path for another reason were excluded from the 3rd Grade State Assessment Proficiency Rates calculation. This publication uses the words “retention” and “held back” interchangeably. Housing status is over four years. “Housed” indicates that the student never experienced homelessness. “Homeless” indicates that the student was homeless at some point in the four-year period.
3rd Grade State Assessment Proficiency Rates, by Year Received an IEP
Percent of IEP Students Who Scored Proficient on One or Both State Assessments in 3rd Grade
SY 2012–13 to SY 2015–16
Suspension Rate Among Students Who Received IEPs by the End of Kindergarten
SY 2012–13 to SY 2015–16
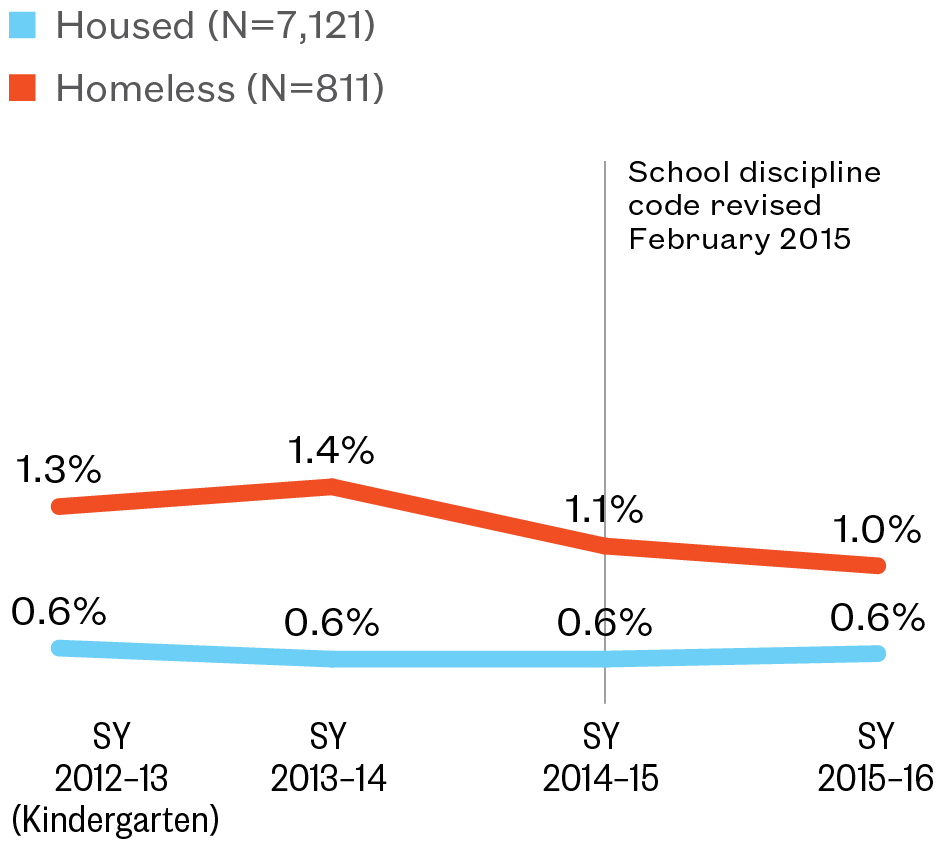
Suspension Rate Among Students Who Received IEPs Late (After Kindergarten)
SY 2012–13 to SY 2015–16
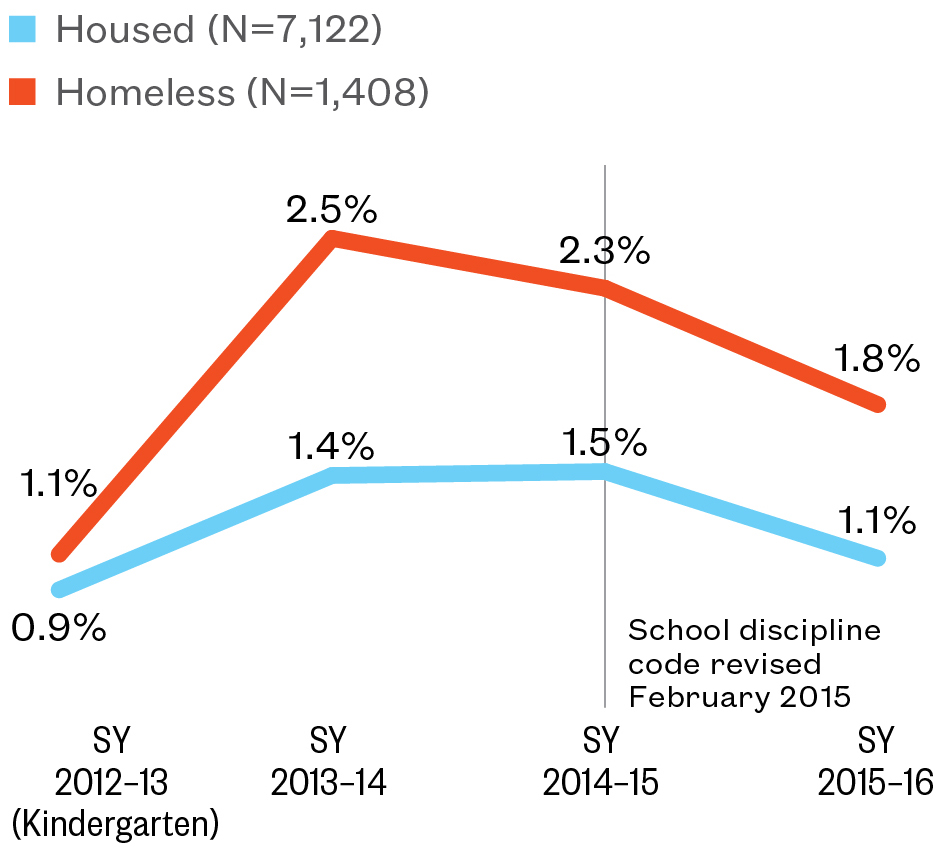
Note: State assessments include English Language Arts and math assessments. IEP group students who were held back or followed a nontraditional path for another reason were excluded from the State Assessment chart. Housing status is over four years. Students are categorized according to whether they experienced homelessness or received free lunch at any point during the four-year period. These data represent a cohort of students who entered Kindergarten in SY 2012–13 and received an IEP at some point during the next four years. School discipline code reforms in February 2015 include approval required for principals to give out-of-school suspensions, and the reasons for out-of-school suspensions were restricted.
Geographic Patterns of Late IEPs
Share of Homeless Students with Special Needs Who Received IEP Late, by Kindergarten School District
SY 2012–13 to SY 2015–16
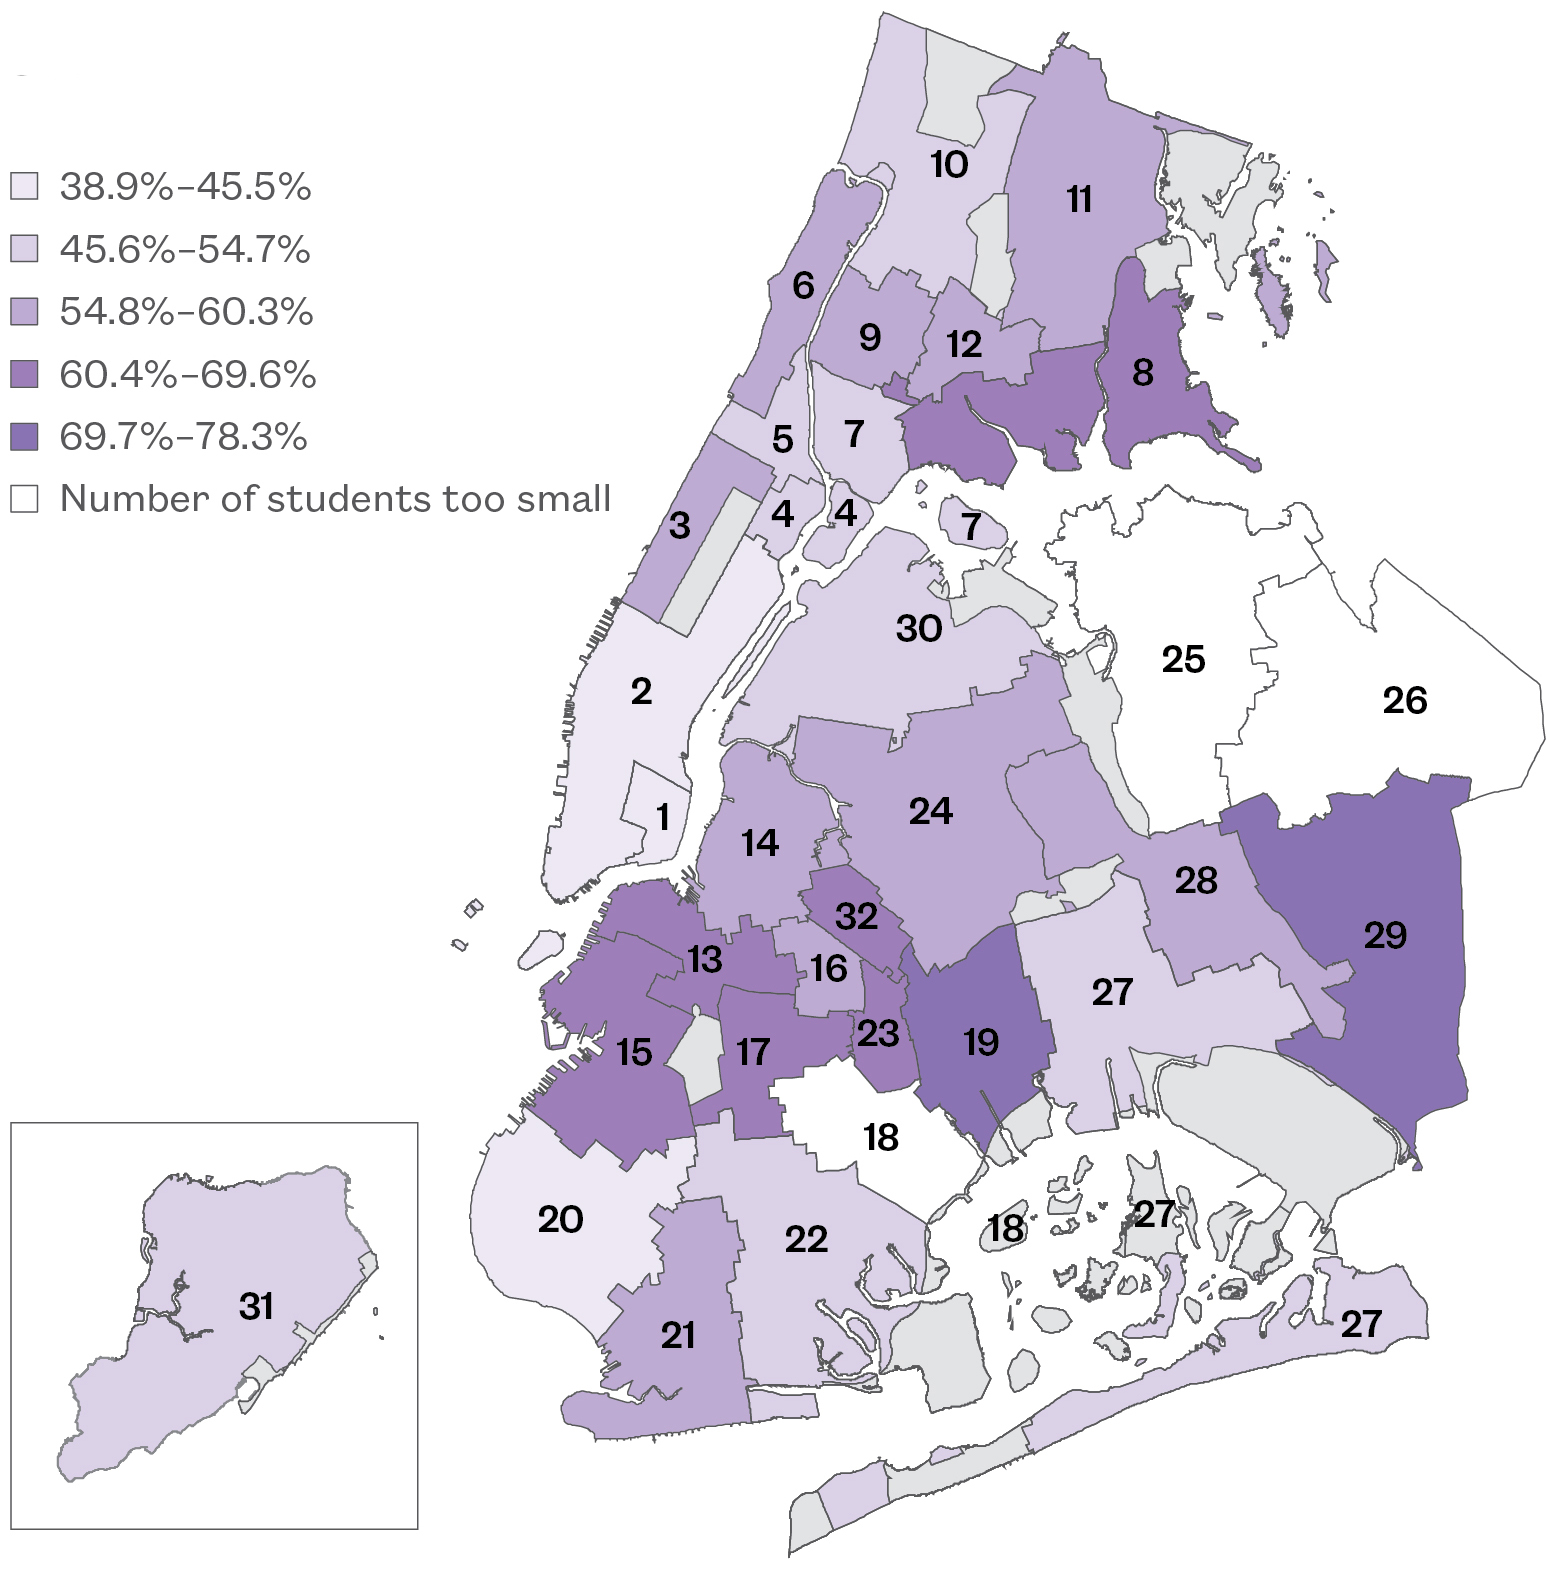
Note: Late is defined as after Kindergarten. Data represent a cohort of students who entered Kindergarten in SY 2012–13 and received an IEP at some point during the next four years. Students are categorized according to whether they experienced homelessness at any point during the four-year period. Data are by school district and do not include schools in non-geographic districts. Ns of fewer than 30 students were redacted.
Explore Districts at bit.ly/StudentAtlasApp.
- Citywide, 43% of all students and 54% of homeless students received their IEP late (after Kindergarten). This ranged from 39% of homeless students in Manhattan’s Lower East Side to more than three-fourths (78%) of homeless students in Brooklyn’s East New York/Starrett City. (Districts 1 and 19)
- Queens Village saw the greatest disparity in the late IEP identification rates between homeless and low-income housed students of any school district, with a 50 percent higher rate. (District 29)
- By borough, students with special education needs who experienced homelessness were at the greatest risk for receiving a late IEP in Brooklyn, while those in Staten Island schools had the lowest risk (60% and 46%).
Early identification and support of special education needs is critical to students’ success in school. Learning from identification supports in districts where homeless students are identified earlier and sharing best practices to benefit homeless students in every City school district is critical.
Late IEP Identification
SY 2012–13 to SY 2015–16
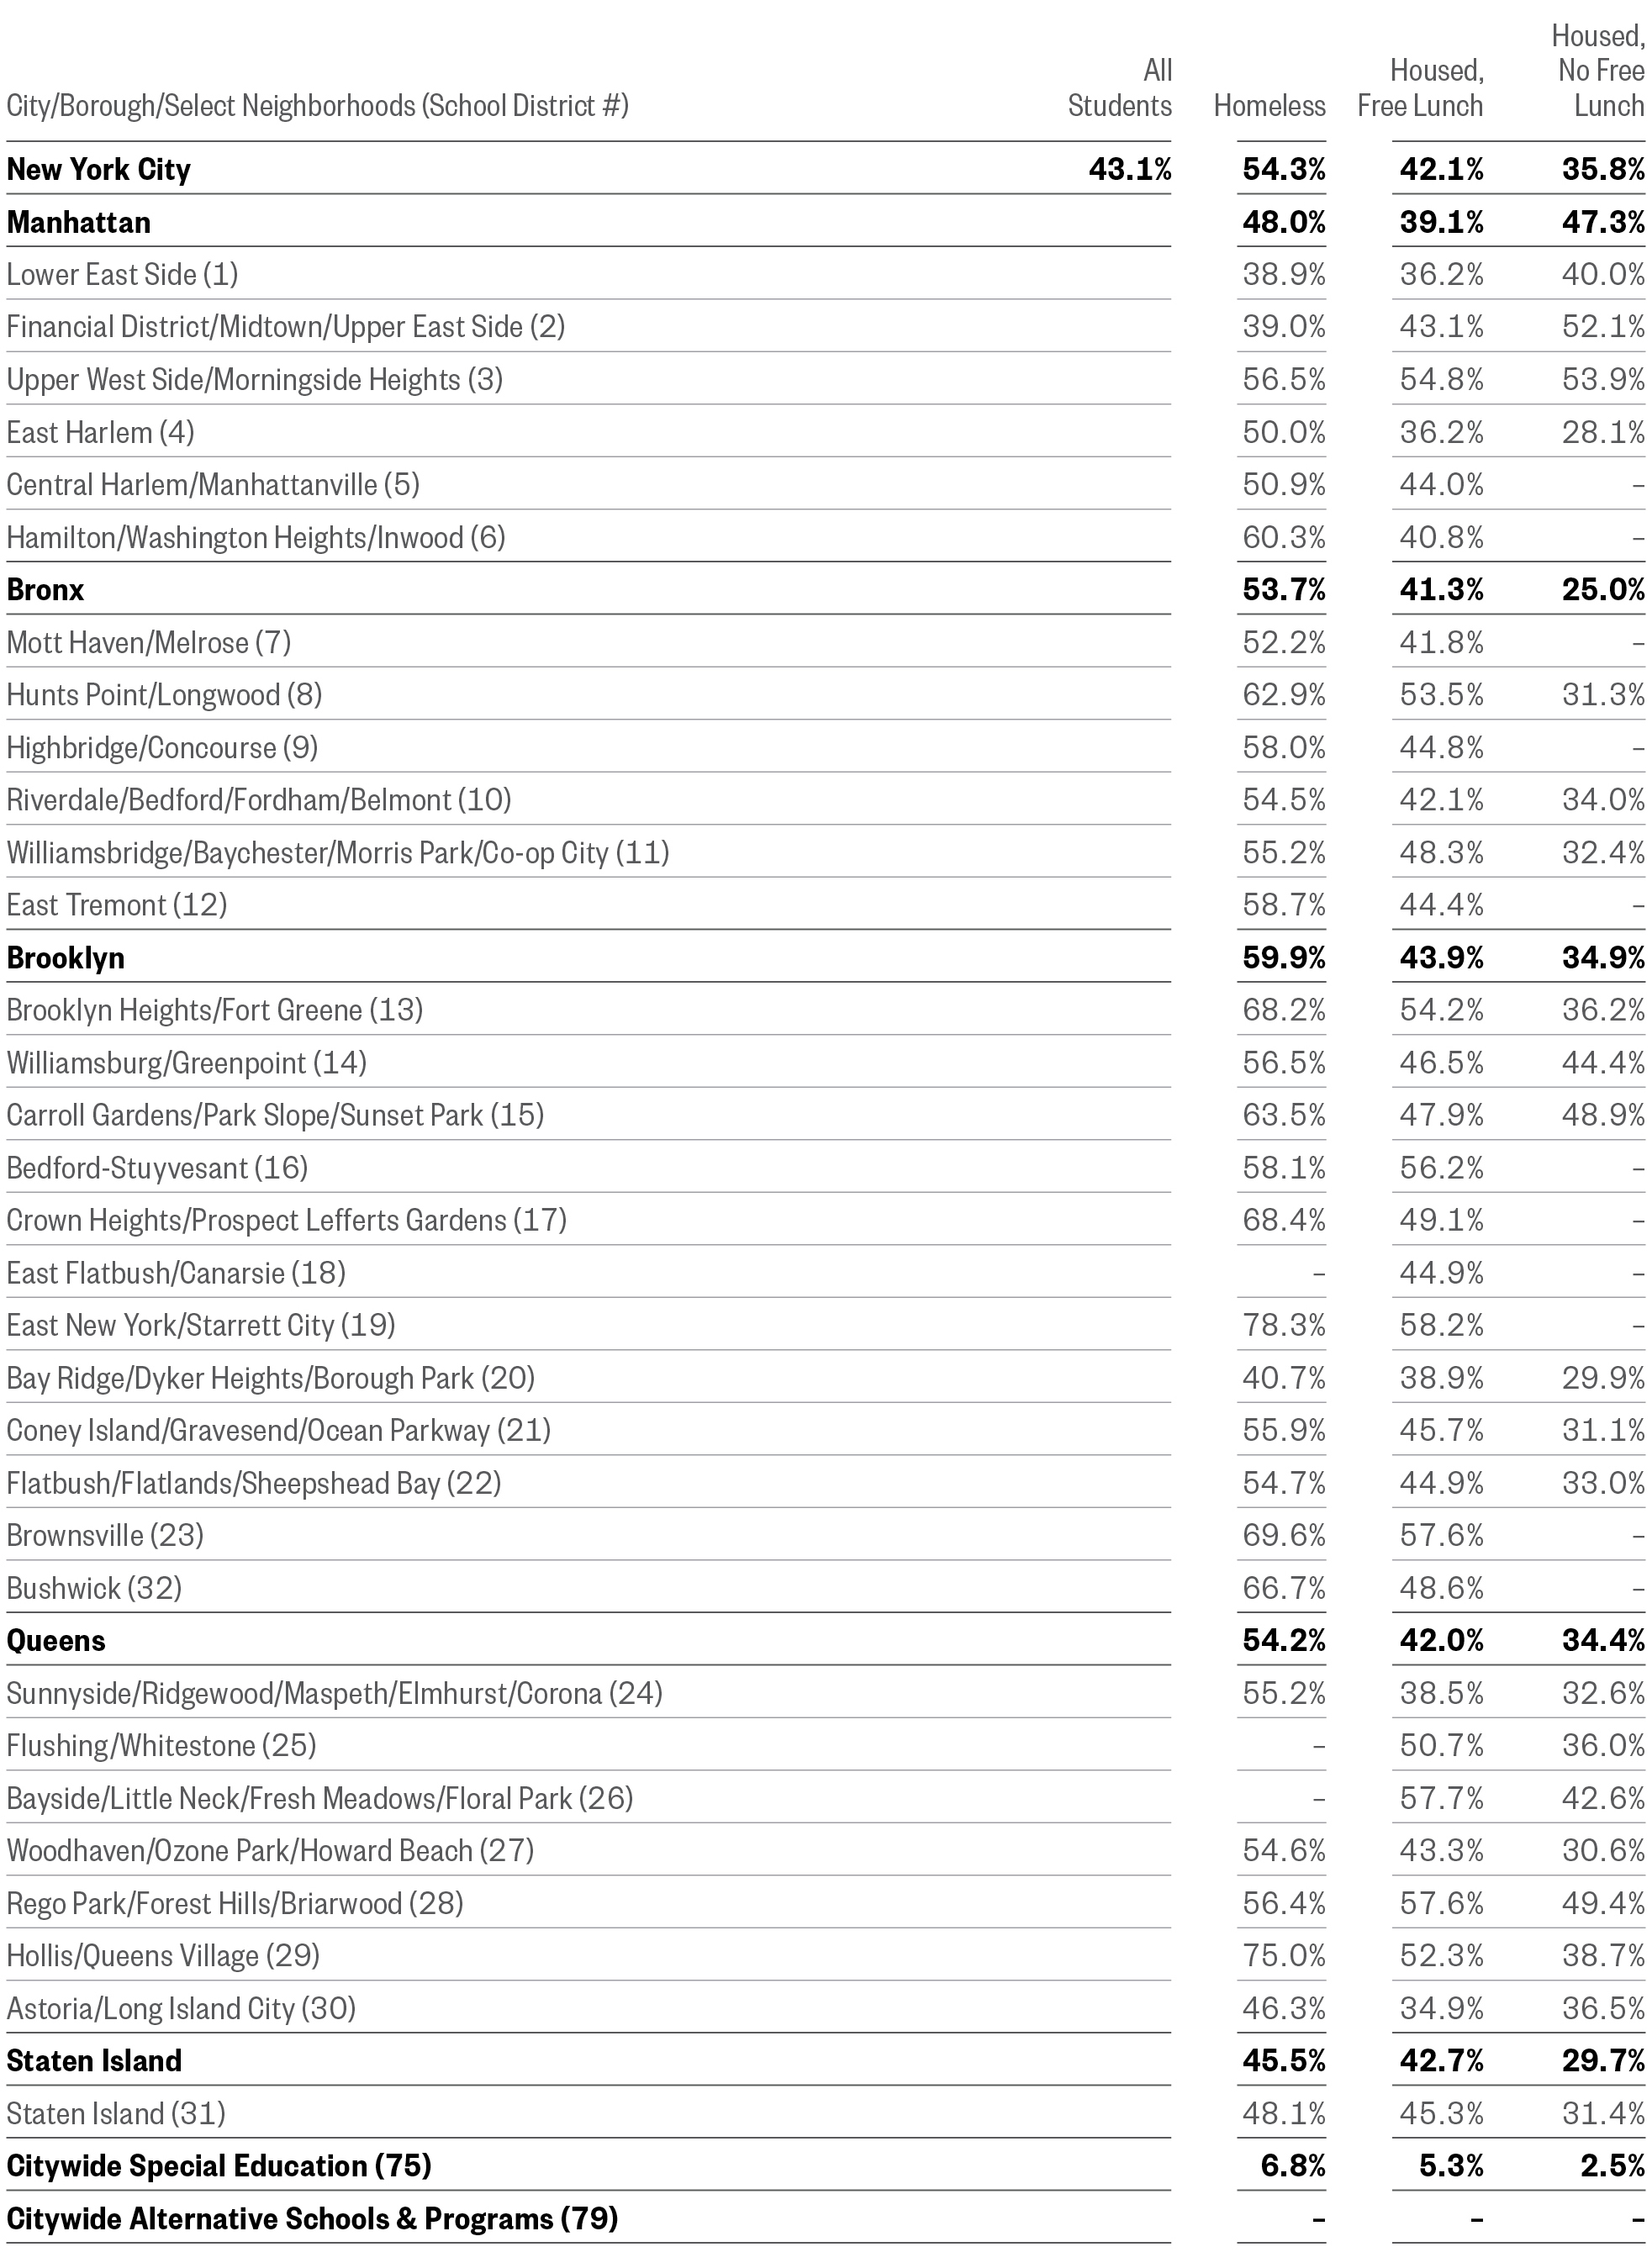
Note: Late is defined as after Kindergarten. Data represent a cohort of students who entered Kindergarten in SY 2012–13 and received an IEP at some point during the next four years. Students are categorized according to whether they experienced homelessness or were eligible for free lunch at any point during the four-year period. Data by school district do not include schools in non-geographic districts, so borough and district total percentages may differ. Ns of fewer than 30 students were redacted. Homeless, doubled up and homeless, in shelter categories are not included due to small sample size.
The Intersection of Homelessness and English Language Learners
- Close to one in four (24%) homeless students in New York City were English language learners (ELL) in SY 2015–16. By comparison, just 14% of all students citywide were identified as having ELL needs.
- More than 23,000 NYC public school students who were English language learners had been homeless. The majority of these ELL students who were homeless spoke Spanish as the primary language with their families (72%).
- Spanish was the primary language for 16,500 students experiencing homelessness, while over 1,100 students each spoke Bengali and Mandarin. Other common languages for ELL students who were homeless included Arabic, Chinese (Miscellaneous), Haitian Creole, Cantonese, French, Urdu, Russian, and Uzbek, each of which had more than 100 speakers.
The New York City Department of Education provides educational services to students who speak a language other than English at home. Students who are not proficient in English may receive instruction in a bilingual or dual language setting, or English instruction with additional support in their home language.
English Language Learners
SY 2015–16
Note: “Formerly Homeless” includes students who were housed during SY 2015–16 but were homeless at any point during SY 2010–11, SY 2011–12, SY 2012–13, SY 2013–14, and/or SY 2014–15.
- As homelessness increases citywide, the number of homeless students with English language learning needs has grown by 58%. For housed students, the number decreased by 9%.
- One in every six ELL students was homeless in SY 2015–16. The majority (82%) of homeless students with ELL needs were living doubled up.
Homeless English Language Learners in New York City Public Schools
Number of ELL Students in New York City Public Schools
SY 2010–11 to SY 2015–16
Note: In earlier school years, the total number of “unsheltered” students may be less reliable than other categories. “All homeless” includes all categories of homelessness.
Homeless Students Remain in ELL for Longer
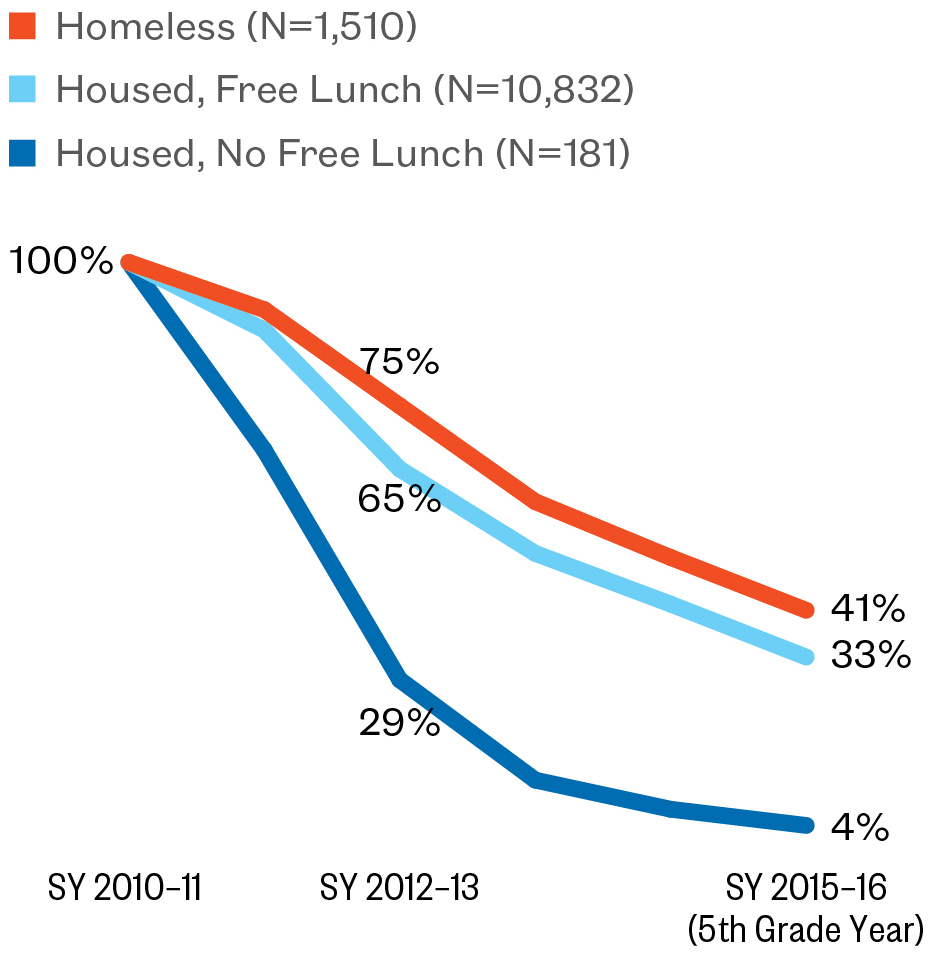
- Not only were homeless students more likely to have ELL needs, but they were also more likely to be identified as ELL for longer than their housed peers who were both low income and non-low income.
- Of students who were identified as having ELL needs in Kindergarten, 75% of homeless students still had ELL needs after two years compared to 65% of low-income housed students and just 29% of non-low-income housed students.
- More than 40% of homeless ELL students still had ELL needs after six years compared to one-third of low-income housed students and only 4% of non-low-income housed students.
Students identified as English language learners take an English proficiency test every year to determine whether they still require additional services.
English Language Learners
Percent of Students Identified with ELL Needs in Kindergarten Who Were Still Identified as ELL in Subsequent Years, by Year
SY 2010–11 to SY 2015–16
Note: Data represent a cohort of students who entered Kindergarten in SY 2010–11 and received ELL services that year. Students are categorized according to whether they experienced homelessness at any point during the five-year period.
Homeless Students Who Exit ELL Score Proficient More Often
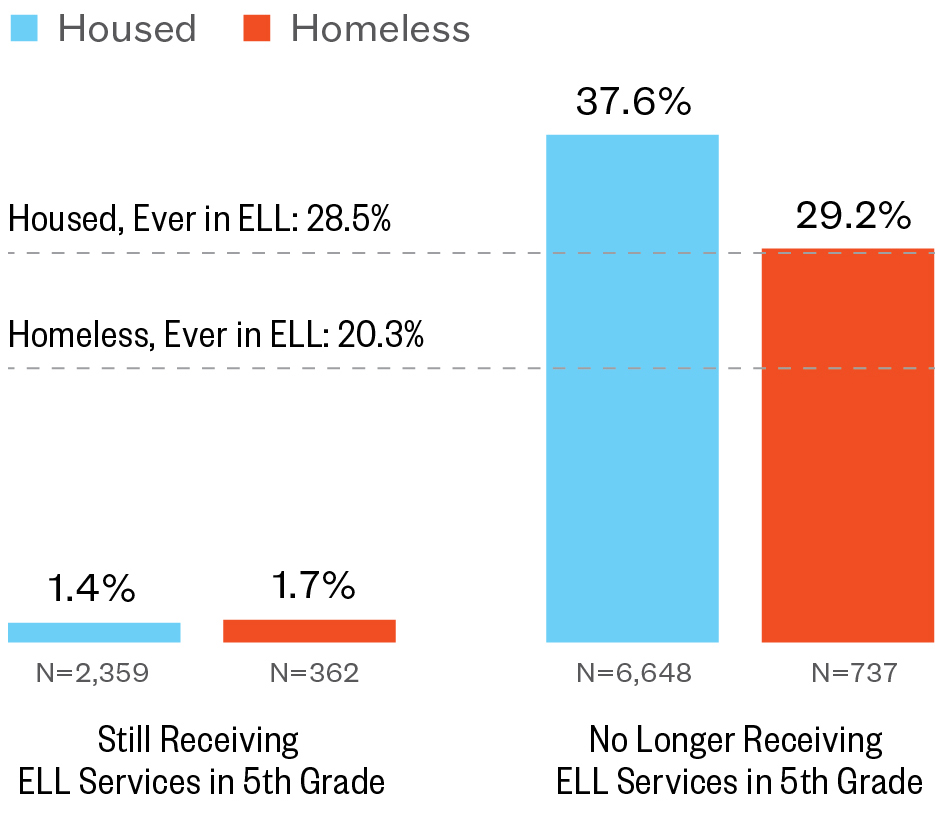
- Overall, English language learners struggle more with academic achievement, scoring proficient on their State assessments at lower rates than students without ELL needs. Just 1.4% of all housed English language learners scored proficient on their 5th grade English Language Arts State assessment in SY 2015–16 compared to 38% of housed students no longer receiving ELL services.
- Homeless students who had English language learning needs in Kindergarten and were able to exit ELL programs by the end of elementary school passed their 5th grade English Language Arts State assessment at approximately the same rate as the overall citywide housed average. (29%)
- Meanwhile, homeless students who were still identified as ELL six years later scored proficient at a rate of just 1.7%.
Considering the high degree of overlap between students with ELL needs and those experiencing housing instability, it is critical to ensure that ELL programs take into account the attendance challenges and high mid-year transfer rates faced by homeless students.
5th Grade State Assessment Proficiency Rate for Students Still in ELL
Percent of Students Who Scored Proficient on State English Language Arts Assessment Among English Language Learners Identified in Kindergarten, by Whether They Still Were Identified as ELL
SY 2015–16
Note: Data represent a cohort of students who entered Kindergarten in SY 2010–11 and received ELL services that year. Students are categorized according to whether they experienced homelessness at any point during the six-year period. The housed, ever ELL and homeless, ever in ELL average include students who were ever identified as ELLs over the six-year period.
Geographic Patterns of English Language Learners
Percent of Homeless Students Who Are English Language Learners, by School District
SY 2015–16
Note: Data are by school district for SY 2015–16 and do not include schools in non-geographic districts.
Explore Districts at bit.ly/StudentAtlasApp.
- One in four (24%) homeless students overall had English language learning needs in SY 2015–16.
- By district, the share of homeless students with ELL needs ranged from just 5% of homeless students in Bedford-Stuyvesant to over half (52%) of homeless students in Bay Ridge. (Districts 16 and 20)
- ELL needs differed by housing status as well. Bay Ridge, Brooklyn had the widest disparity, with 55% of doubled-up students having ELL needs compared to just 18% of students living in shelter. (District 20)
- By borough, students living doubled-up had the highest ELL rates in the Bronx and Queens at 34% and 35%. Meanwhile, Staten Island students living doubled up had the lowest rate at 15%.
Percent of Students Who Are English Language Learners
SY 2015–16

Note: Data by school district do not include schools in non-geographic districts, so borough and district total percentages may differ. Ns of fewer than 30 students were redacted.
English Language Learners by Ethnicity
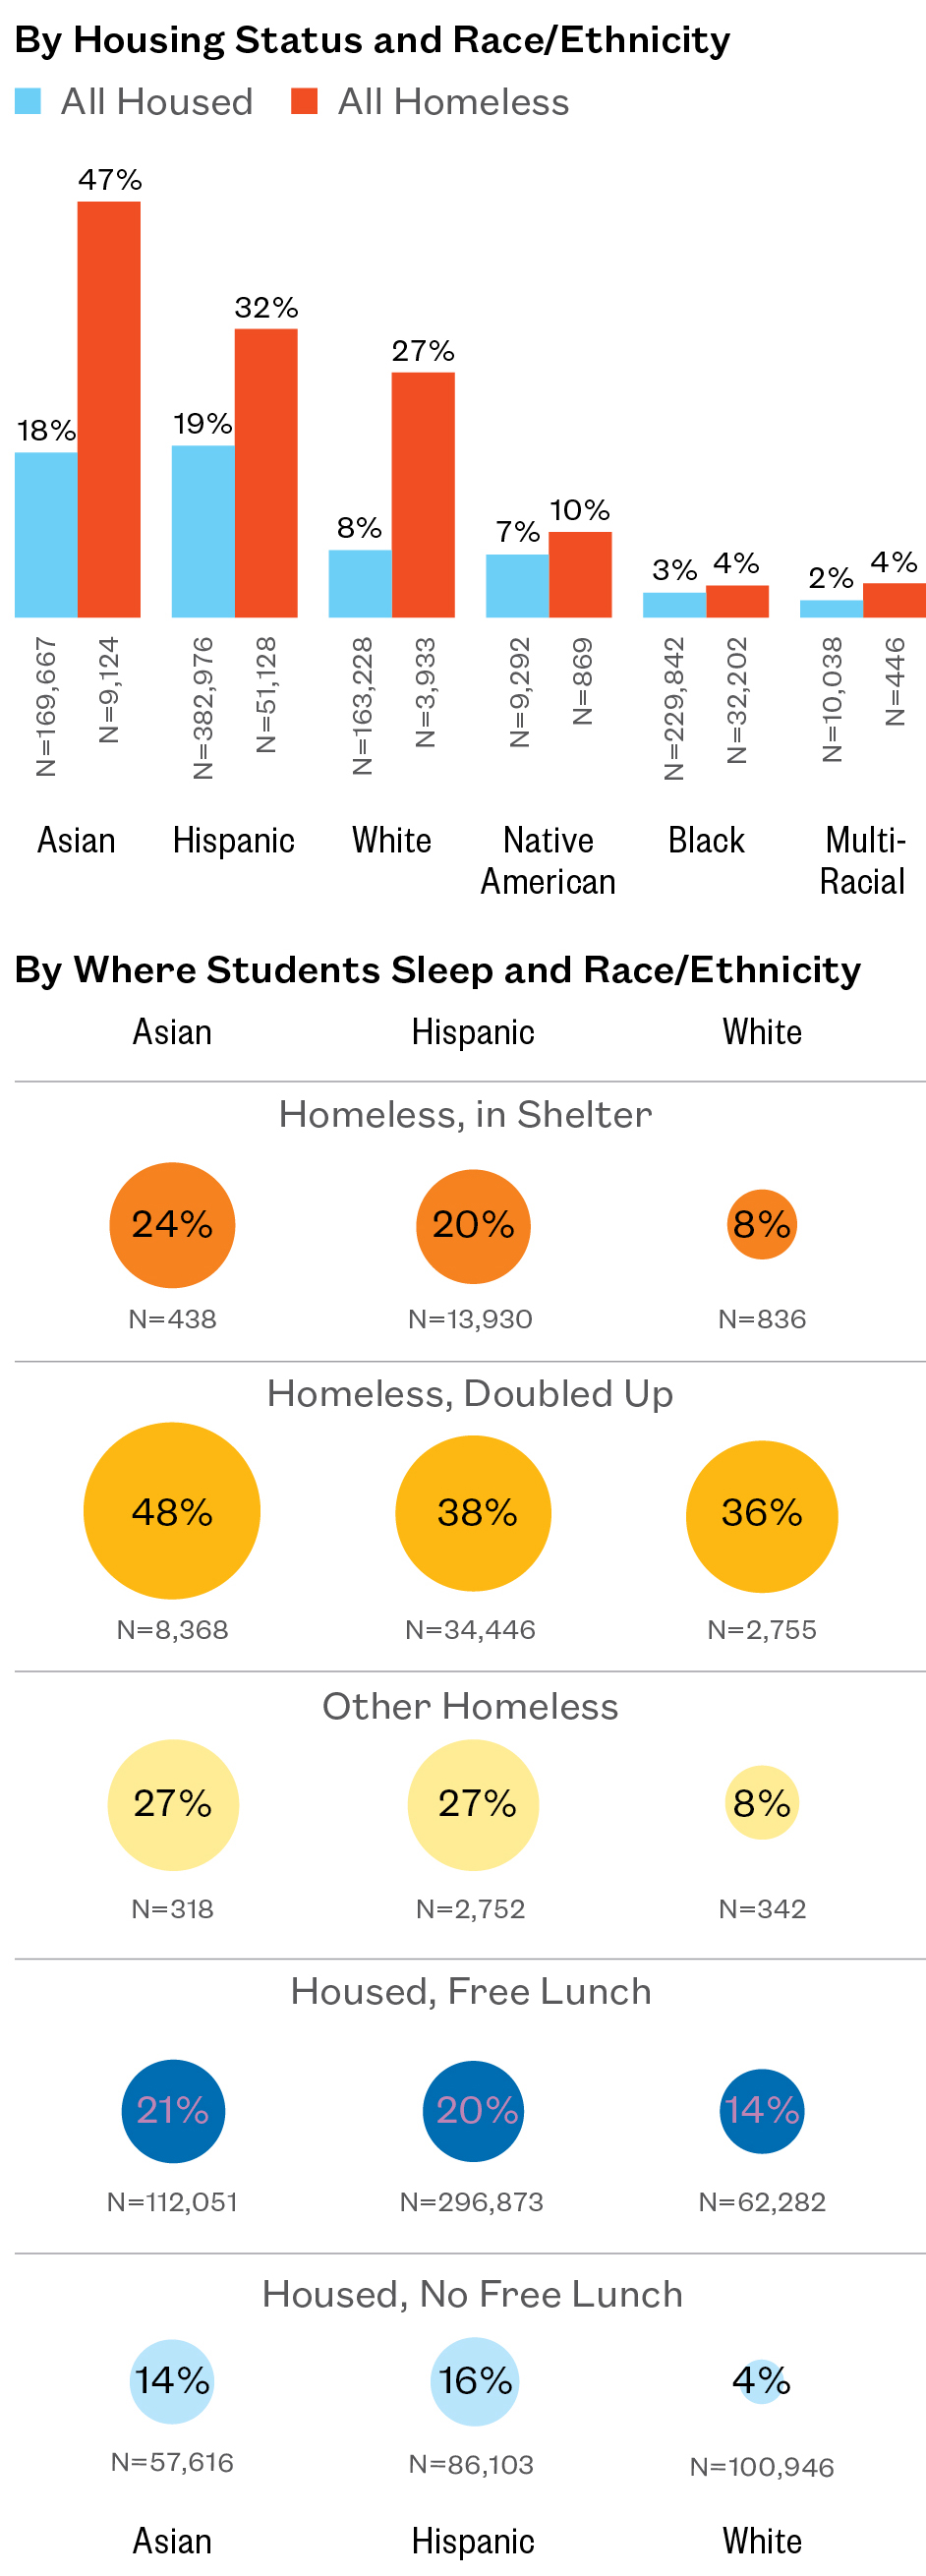
- English language learner rates varied greatly by students’ ethnicity, with Asian, Hispanic, and white homeless students seeing the highest rates of ELL needs. Close to half (47%) of Asian students who were homeless had English language learning needs in SY 2015–16—over twice the rate of housed Asian students (18%).
- Across ethnicities, doubled-up students had the highest ELL rate of all housing groups.
- Almost one-third of both Hispanic and white students who were homeless (32% and 27%) had ELL needs, compared to 19% of housed Hispanic students and 8% of housed white students.
ELL Rates by Race and Ethnicity
Percent of Students Who Were English Language Learners, by Race/Ethnicity and Grade Level
SY 2015–16
Note: “Other Homeless” includes students who were awaiting foster care, paying for a hotel/motel outside of the shelter system, or living in another temporary and/or unsuitable housing situation.
Where are Homeless English Language Learners by Ethnicity?
Density of English Language Learners by Ethnicity, with Top Languages Spoken
SY 2015–16
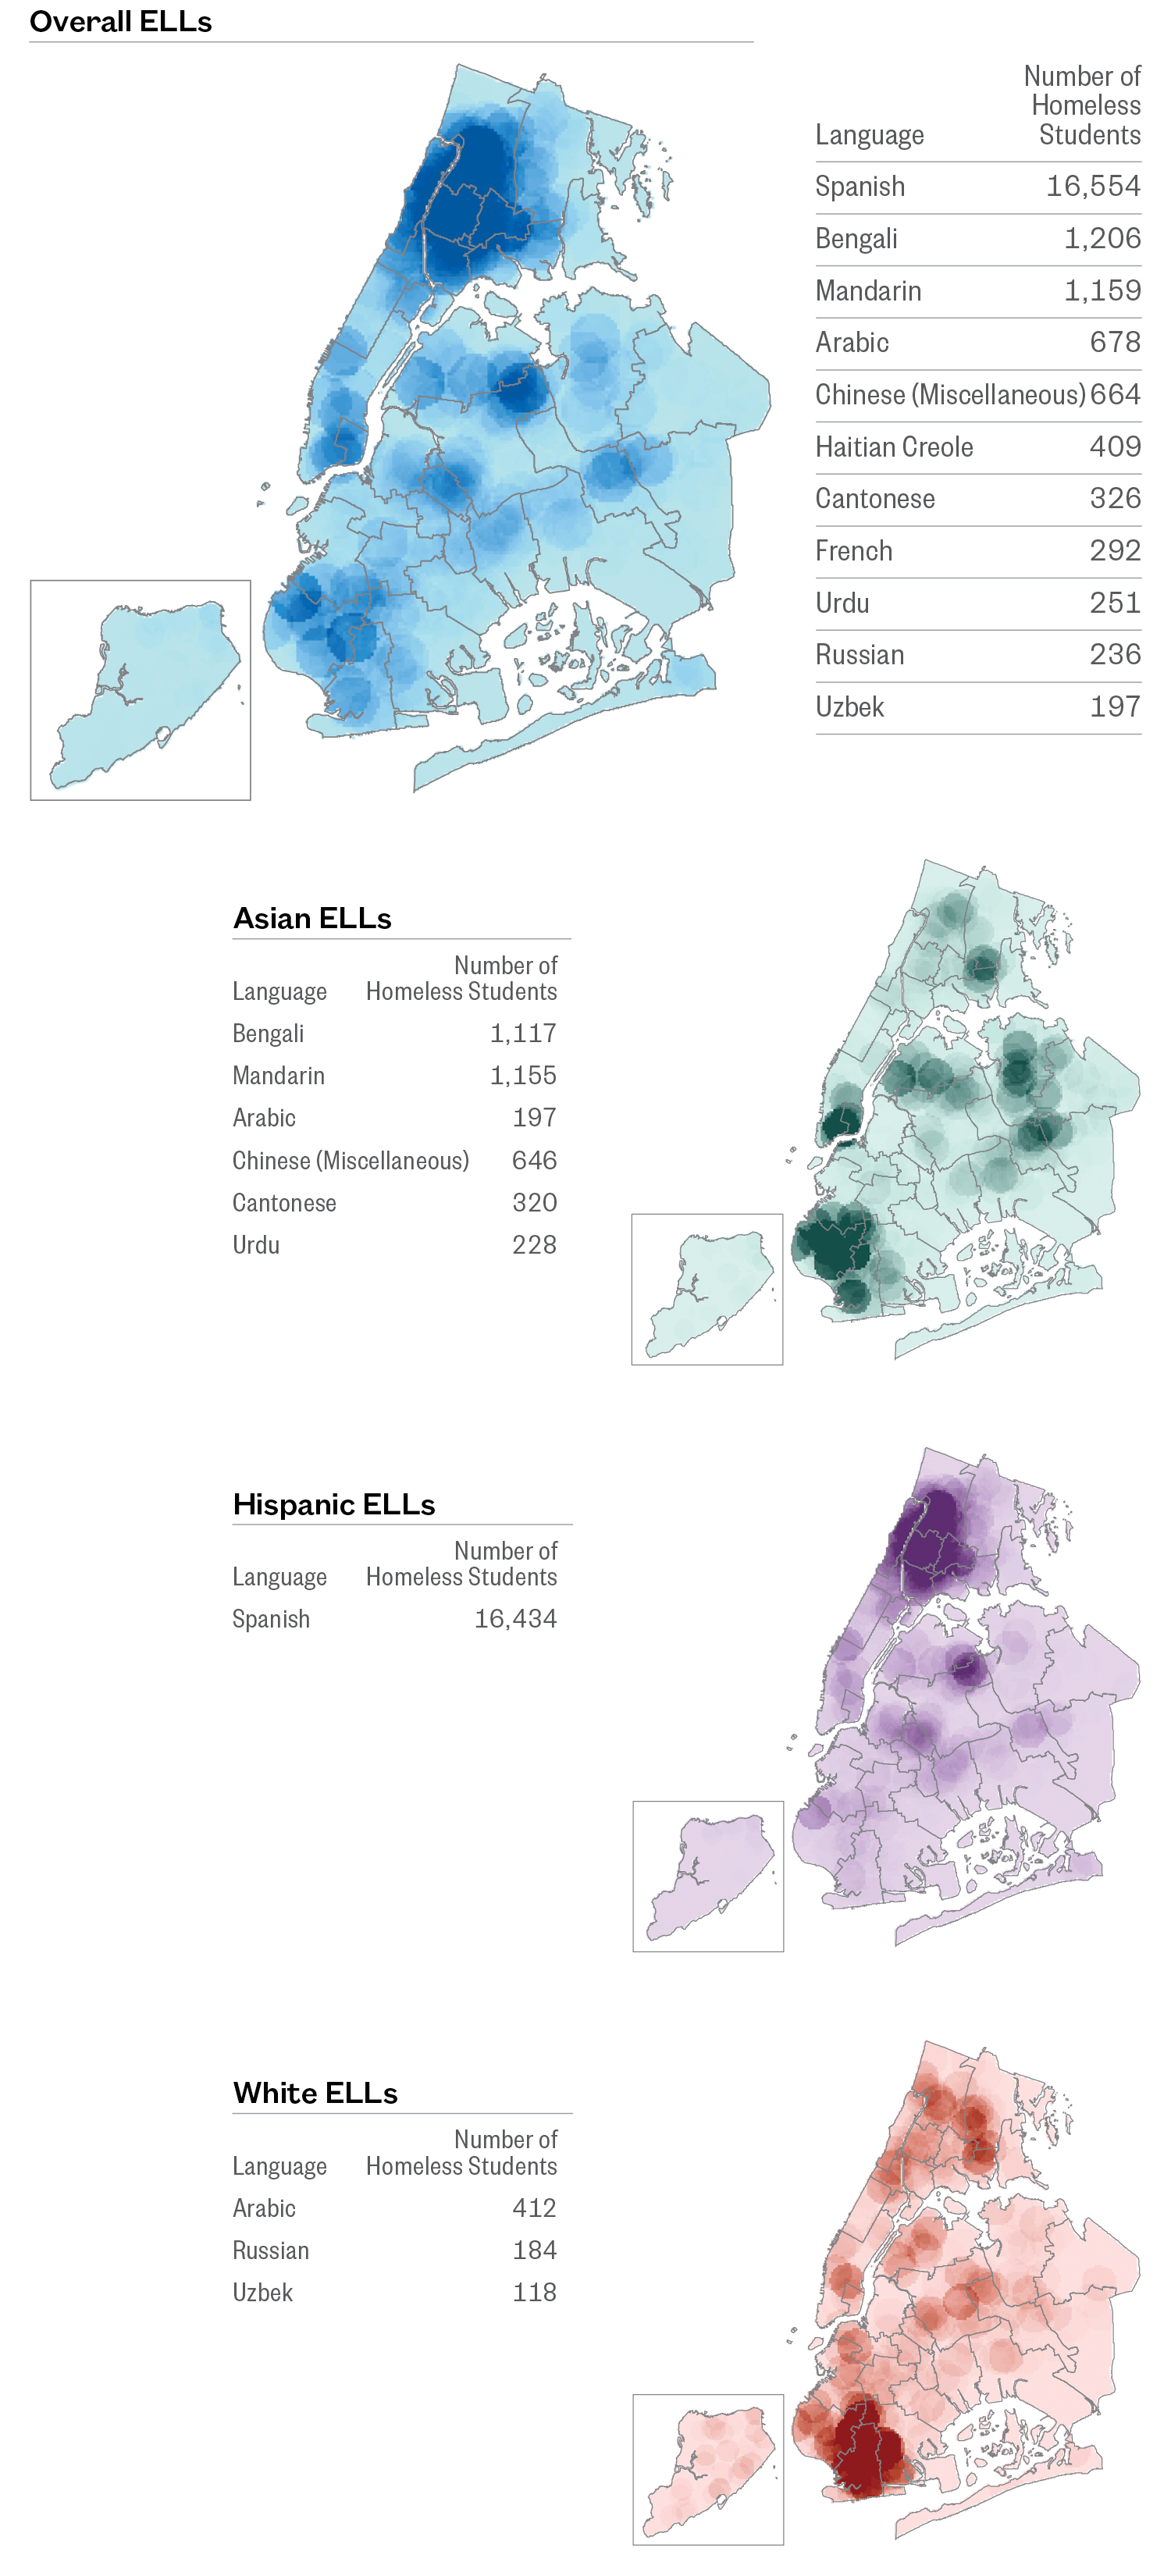
Note: Language refers to the language that students speak with their family. Chinese (Miscellaneous) refers to students whose primary language is Chinese.
- English language learners overall were concentrated in the south and west Bronx, central Queens, and south Brooklyn.
Examining ELL rates among homeless students by ethnicity shows where potential services could be coordinated and tailored to meet the different linguistic needs of homeless students.
Download Section 3 PDF
To explore homelessness in New York City schools, try our interactive map.
To learn more about the educational outcomes of homeless New York city students, try our Student Atlas app.
Return to top.
Section 4
Educational Achievement of Homeless Students: English Language Arts (ELA) and Math State Assessment Proficiency
“In our school, the [experiencing homeless] kids with the most adjustment and behavior issues are the young ones. They really have trouble settling in. They’re not used to focusing. They have trouble acclimating to the environment. We have kids who don’t want to stay in the classroom, who literally exit the classroom. Sometimes they have problems completing assignments if you send them home, so we try to do them in school.”
—Former Principal, Community School in Brooklyn
“One middle school student [age 13] said that traveling from the Bronx to school in Brooklyn caused him to go from an A average in English to a 67% due to being late. His younger brother [age 8] really struggled to get up in time to get on the train for school, and he would often fall asleep in class. Last year, his teacher became concerned that he might have a sleep disorder because he was constantly nodding off. He missed out on a lot of valuable classroom instruction and he was moved to a special education classroom.”
—Social Work Director, Partnership with Children, working in New York City public schools
The effect of housing instability on student performance is clearly demonstrated once students begin taking State-mandated math and English tests in the third grade. These tests receive significant political and media attention, yet the outcomes of homeless students and those with a history of housing instability are generally overlooked. Poor performance in school is known to correlate with students’ future academic outcomes, and meeting the educational needs of homeless students is critical to give these students the opportunity to learn on pace with their peers.
What’s New?
- Homeless students living in shelter were more at risk academically than their housed or other homeless peers. Among middle schoolers, just 8% of students in shelter scored proficient in math, a rate four times lower than housed students overall (34%).
- Amidst citywide policy and curricula changes over time, achievement gaps by housing status persisted. Homeless students scored proficient in ELA at roughly half the rate of housed students overall (21% to 40% in SY 2015–16).
Policy Considerations
- Achievement gaps must be looked at not only between homeless and housed students overall, but also among students who have been homeless living in different settings. Children who have lived in a shelter consistently see lower academic proficiency than their doubled-up peers. Targeting academic supports to students in shelter is needed to reduce these students’ academic risk.
- Students who have a history of homelessness see virtually the same level of academic risk as currently homeless students and should remain eligible for additional supportive and academic services even after moving into permanent housing.
English Language Arts Achievement Among Homeless Students
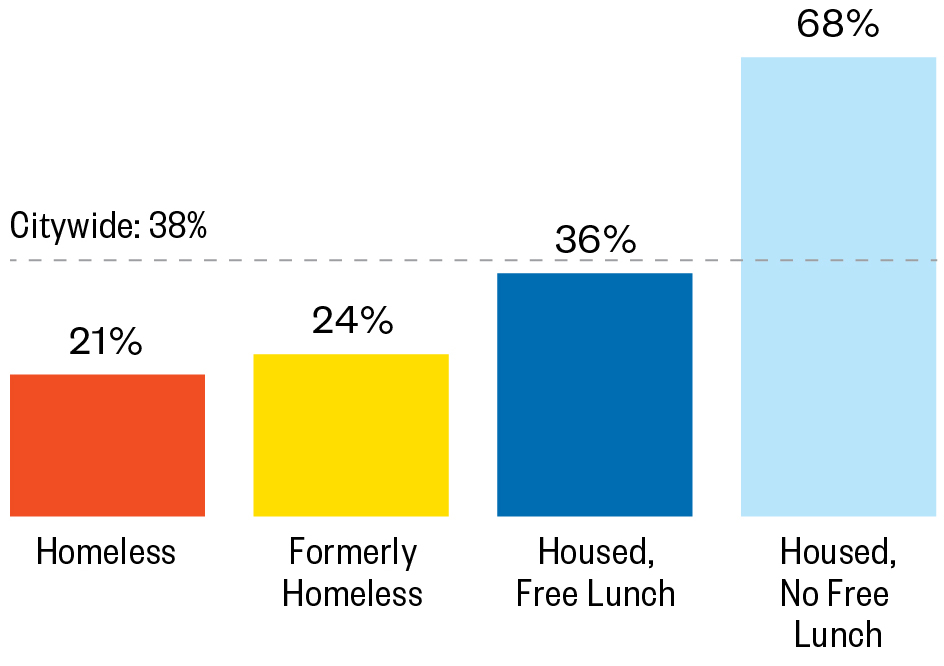
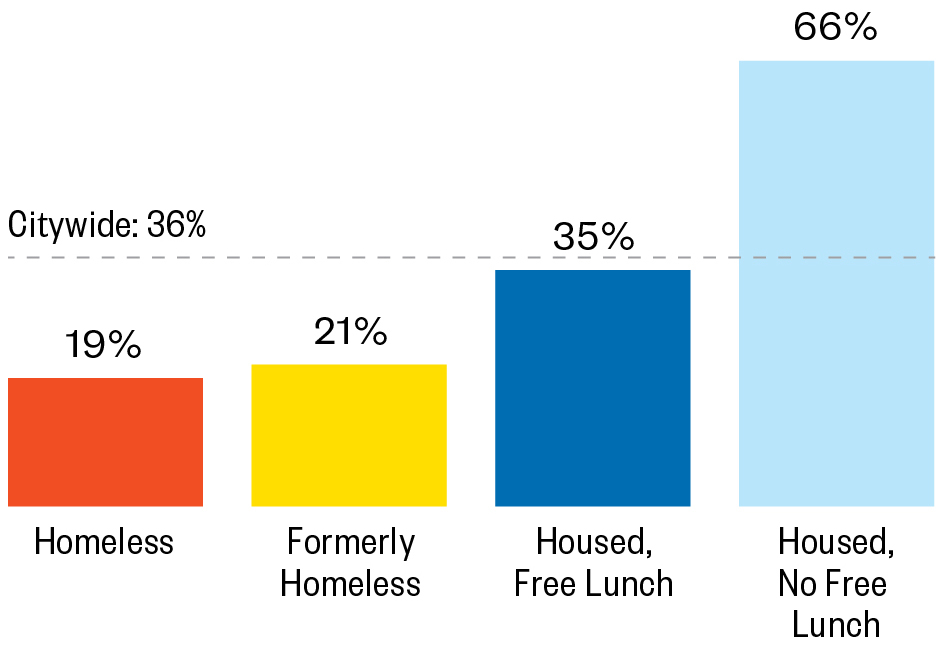
- One in five homeless students scored proficient in ELA (21%) compared to roughly a third of low-income housed students (36%) and two-thirds of non-low-income housed students (68%).
- Homelessness has a lasting impact on school achievement. Students who were currently housed but had experienced homelessness (formerly homeless) met ELA grade-level standards at roughly the same rates as their currently homeless peers (24% to 21%).
The consistency with which formerly homeless students perform far below their classmates even after they are stably housed indicates how difficult it can be for students to catch up once they have fallen behind. Ensuring that homeless students receive ongoing supports even after they become housed is critical to closing this achievement gap.
3rd–8th Grade State English Language Arts Test Proficiency Rates
SY 2015–16
Note: “Formerly Homeless” includes students who were housed during SY 2015–16 but were homeless at any point during SY 2010–11, SY 2011–12, SY 2012–13, SY 2013–14, and/or SY 2014–15.
- Homeless students were most likely to receive a level 1 score (43%)—indicating that they performed well below proficiency standards. Just 27% of low-income housed students and 10% of non-low-income housed students received that score.
- Meanwhile, only 4% of homeless students and 6% of formerly homeless students scored at proficiency level 4—the highest level—compared to 11% of low-income housed students and 31% of non-low-income housed students.
3rd–8th Grade State English Language Arts Test Proficiency Rates by Housing Status
SY 2015–16
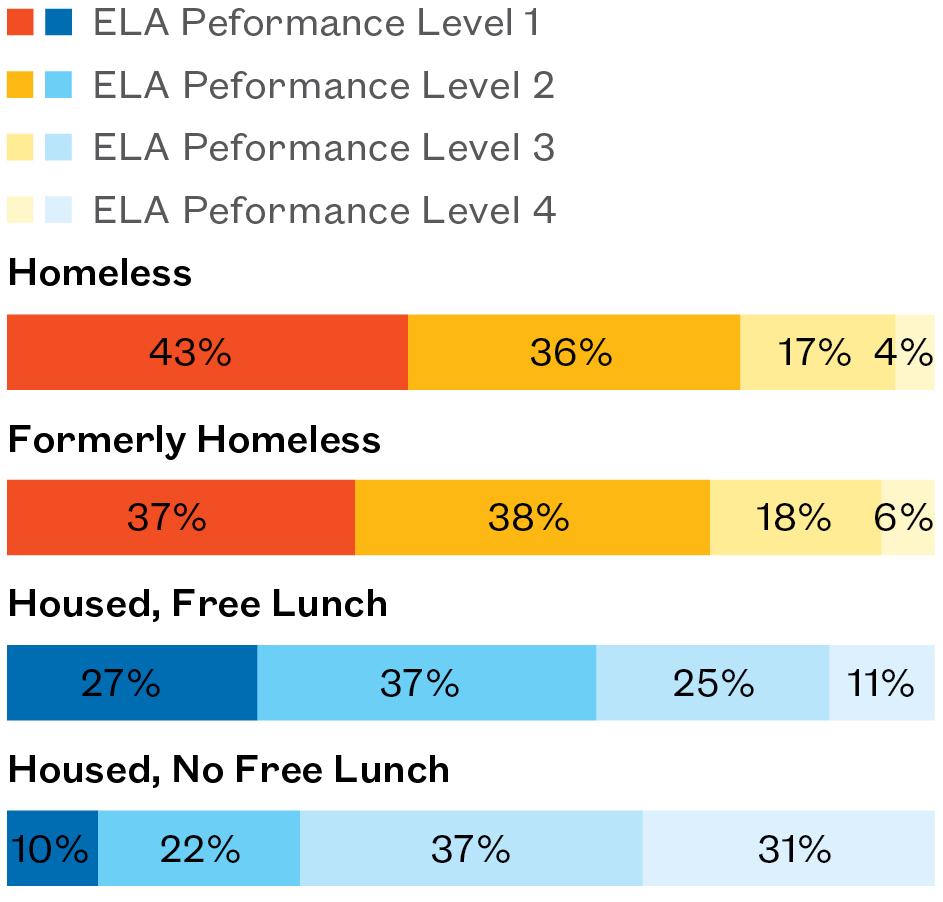
Note: Performance levels 1 and 2 indicate a student performed well below or partially below proficiency on the New York State Department of Education English Language Arts assessment, and levels 3 and 4 indicate a student performed at proficiency or higher. “Formerly Homeless” includes students who were housed during SY 2015–16 but were homeless at any point during SY 2010–11, SY 2011–12, SY 2012–13, SY 2013–14, and/or SY 2014–15. Percentages may not add to 100% due to rounding.
- With the adoption of Common Core standards into 3rd–8th grade State assessments in SY 2012–13, proficiency rates overall dropped by 16 points in ELA. Three years later in SY 2015–16, students were given unlimited time, allowing students to work at their own pace; that year, citywide ELA proficiency rates rose by 6 points.
- Amidst citywide policy and curricula changes, achievement gaps by housing status persisted. Homeless students scored proficient at roughly half the rate of housed students overall (21% to 40% in SY 2015–16).
- Homeless students living in shelter faced the greatest academic risk compared to their housed or other homeless peers. Only 15% of all students in shelter scored proficient on their 3rd–8th grade ELA assessment, roughly one-third the rate of housed students overall and two-thirds the rate of their classmates living doubled up (40% and 24%).
- Homeless students living doubled up scored proficient at roughly half the rate of their housed classmates (24% to 40%).
Changes in Citywide State English Language Arts Test Proficiency Rates by Year
SY 2010–11 to SY 2015–16
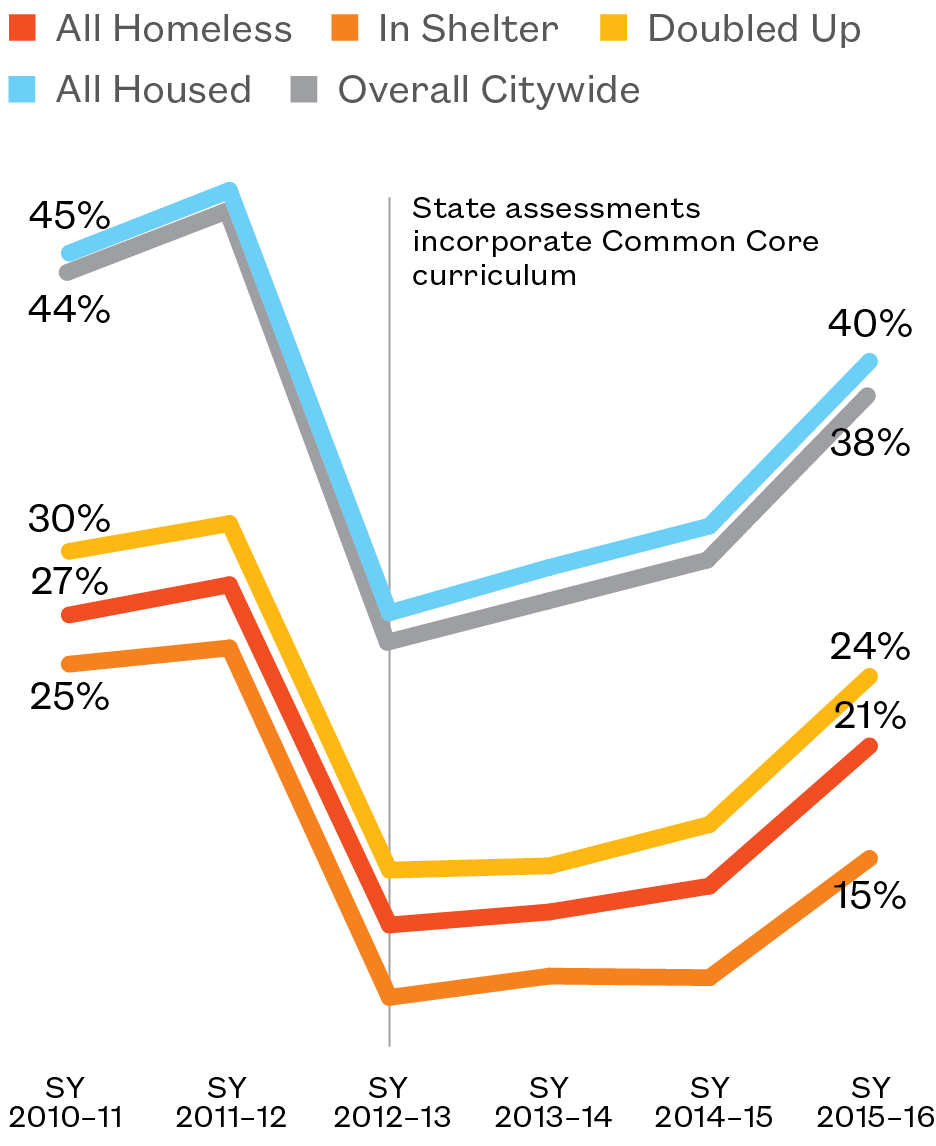
Note: SY 2012–13 was the first year that the 3rd–8th grade state assessments incorporated the Common Core curriculum. New York State first adopted the Common Core curriculum in 2010. Students were given unlimited time to complete their assessments starting in SY 2015–16. “All homeless” includes all categories of homelessness.
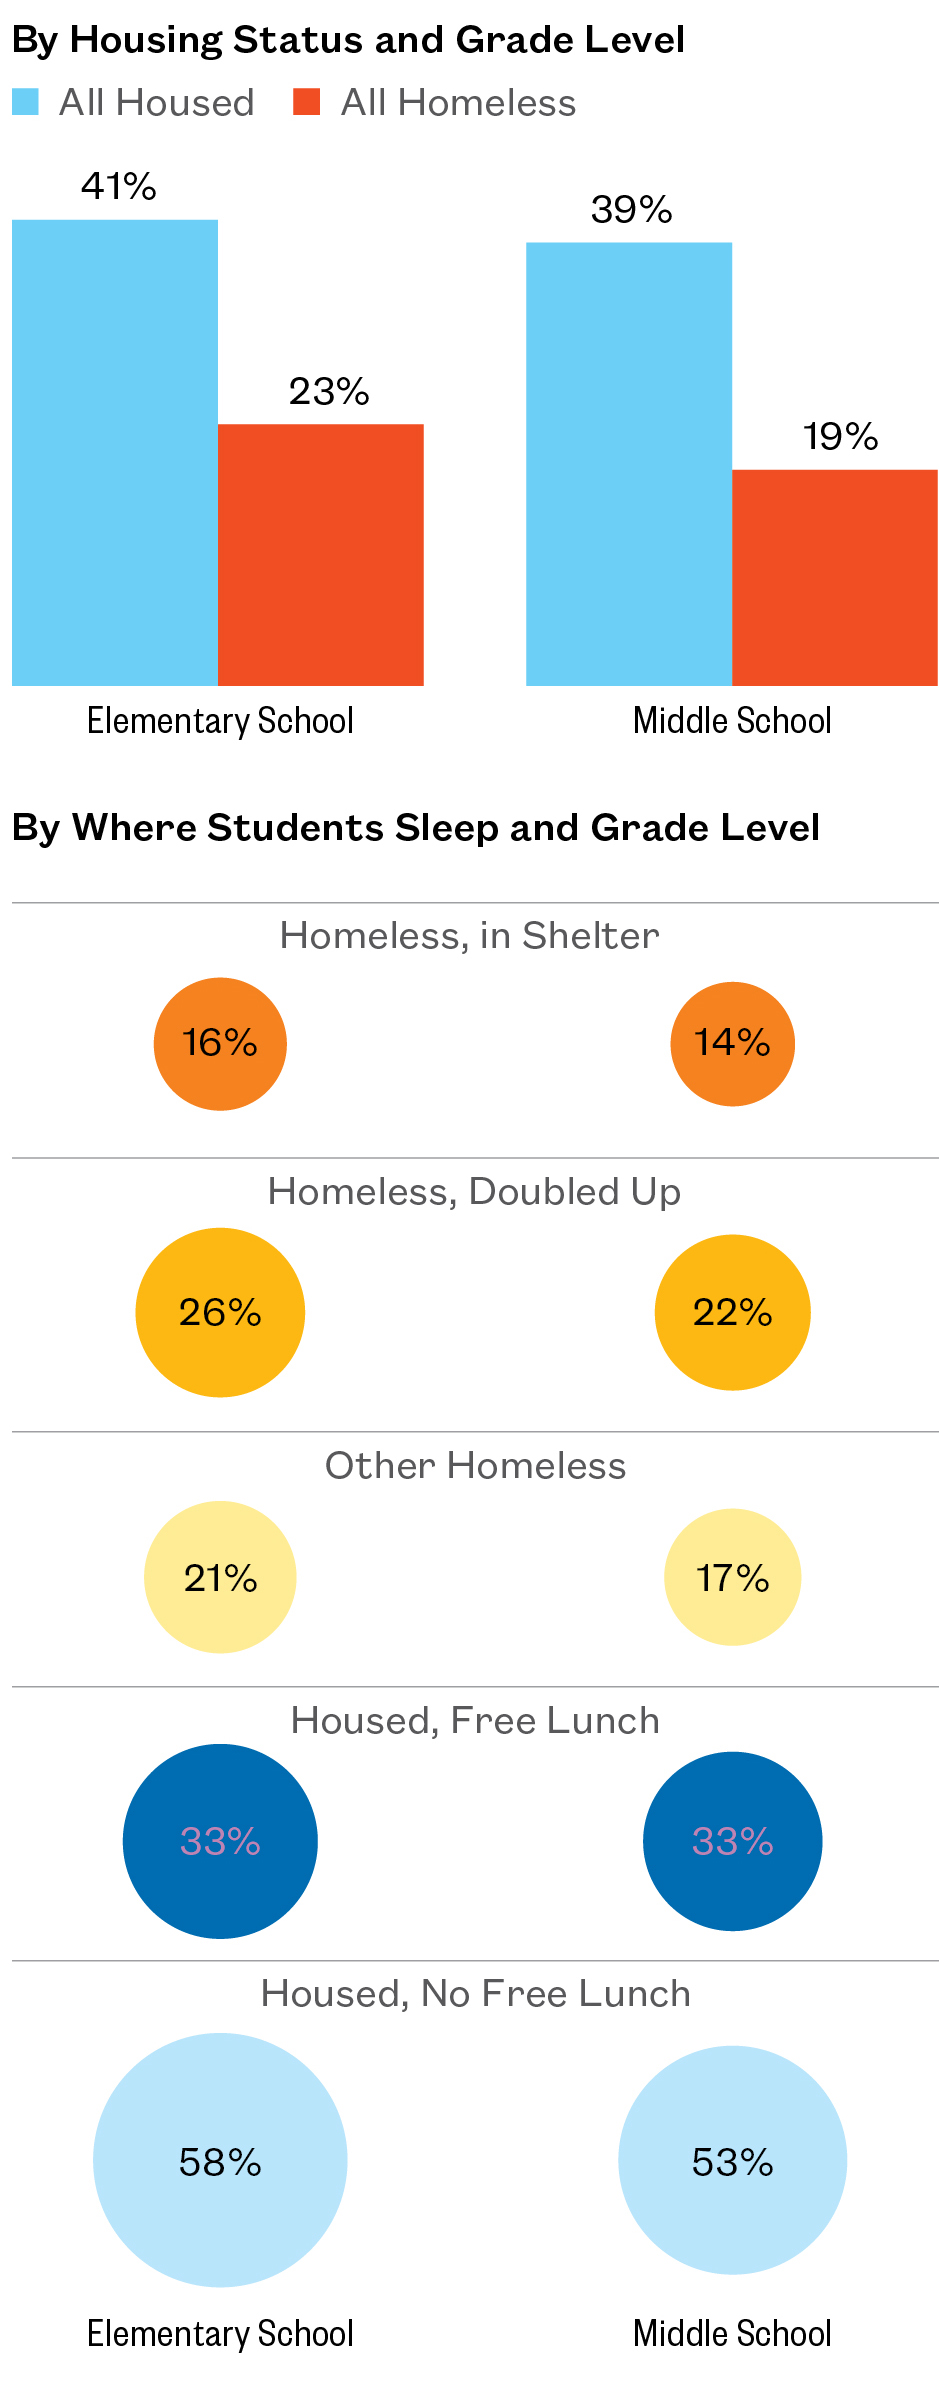
- Students living in shelter scored proficient on ELA assessments at the lowest rates of any other group, with just 16% of elementary students and 14% of middle schoolers in shelter scoring proficient in ELA—just half the rate of their housed, low-income peers (33% and 33%) and one-fourth the rate of their housed peers who were not low income (58% and 53%).
- By middle school, the proficiency gap between homeless and housed students widened, with housed students scoring proficient at over twice the rate of homeless students. This pattern likely reflects the lingering destabilizing effects of homelessness on children’s education.
Middle school proficiency is a key indicator of high school graduation and future success. Targeting academic supports to students in shelter is needed to reduce these students’ academic risk.
3rd–8th Grade State English Language Arts Test Proficiency Rates
Percent of Students who Scored Proficient on the State English Language Arts Test
SY 2015–16
Note: “Other homeless” includes students who were awaiting foster care, paying for a hotel/motel outside of the shelter system, or living in another temporary and/or unsuitable housing situation.
Geographic Patterns of English Language Arts (ELA) Proficiency
English Language Arts Grade-Level Proficiency Varies by Geography
Grade-Level Proficiency Among Homeless Students: 3rd–8th Grade State English Language Arts (ELA) Test
SY 2015–16
Note: Data are by school district for SY 2015–16 and do not include schools in non-geographic districts.
Explore Districts at bit.ly/StudentAtlasApp.
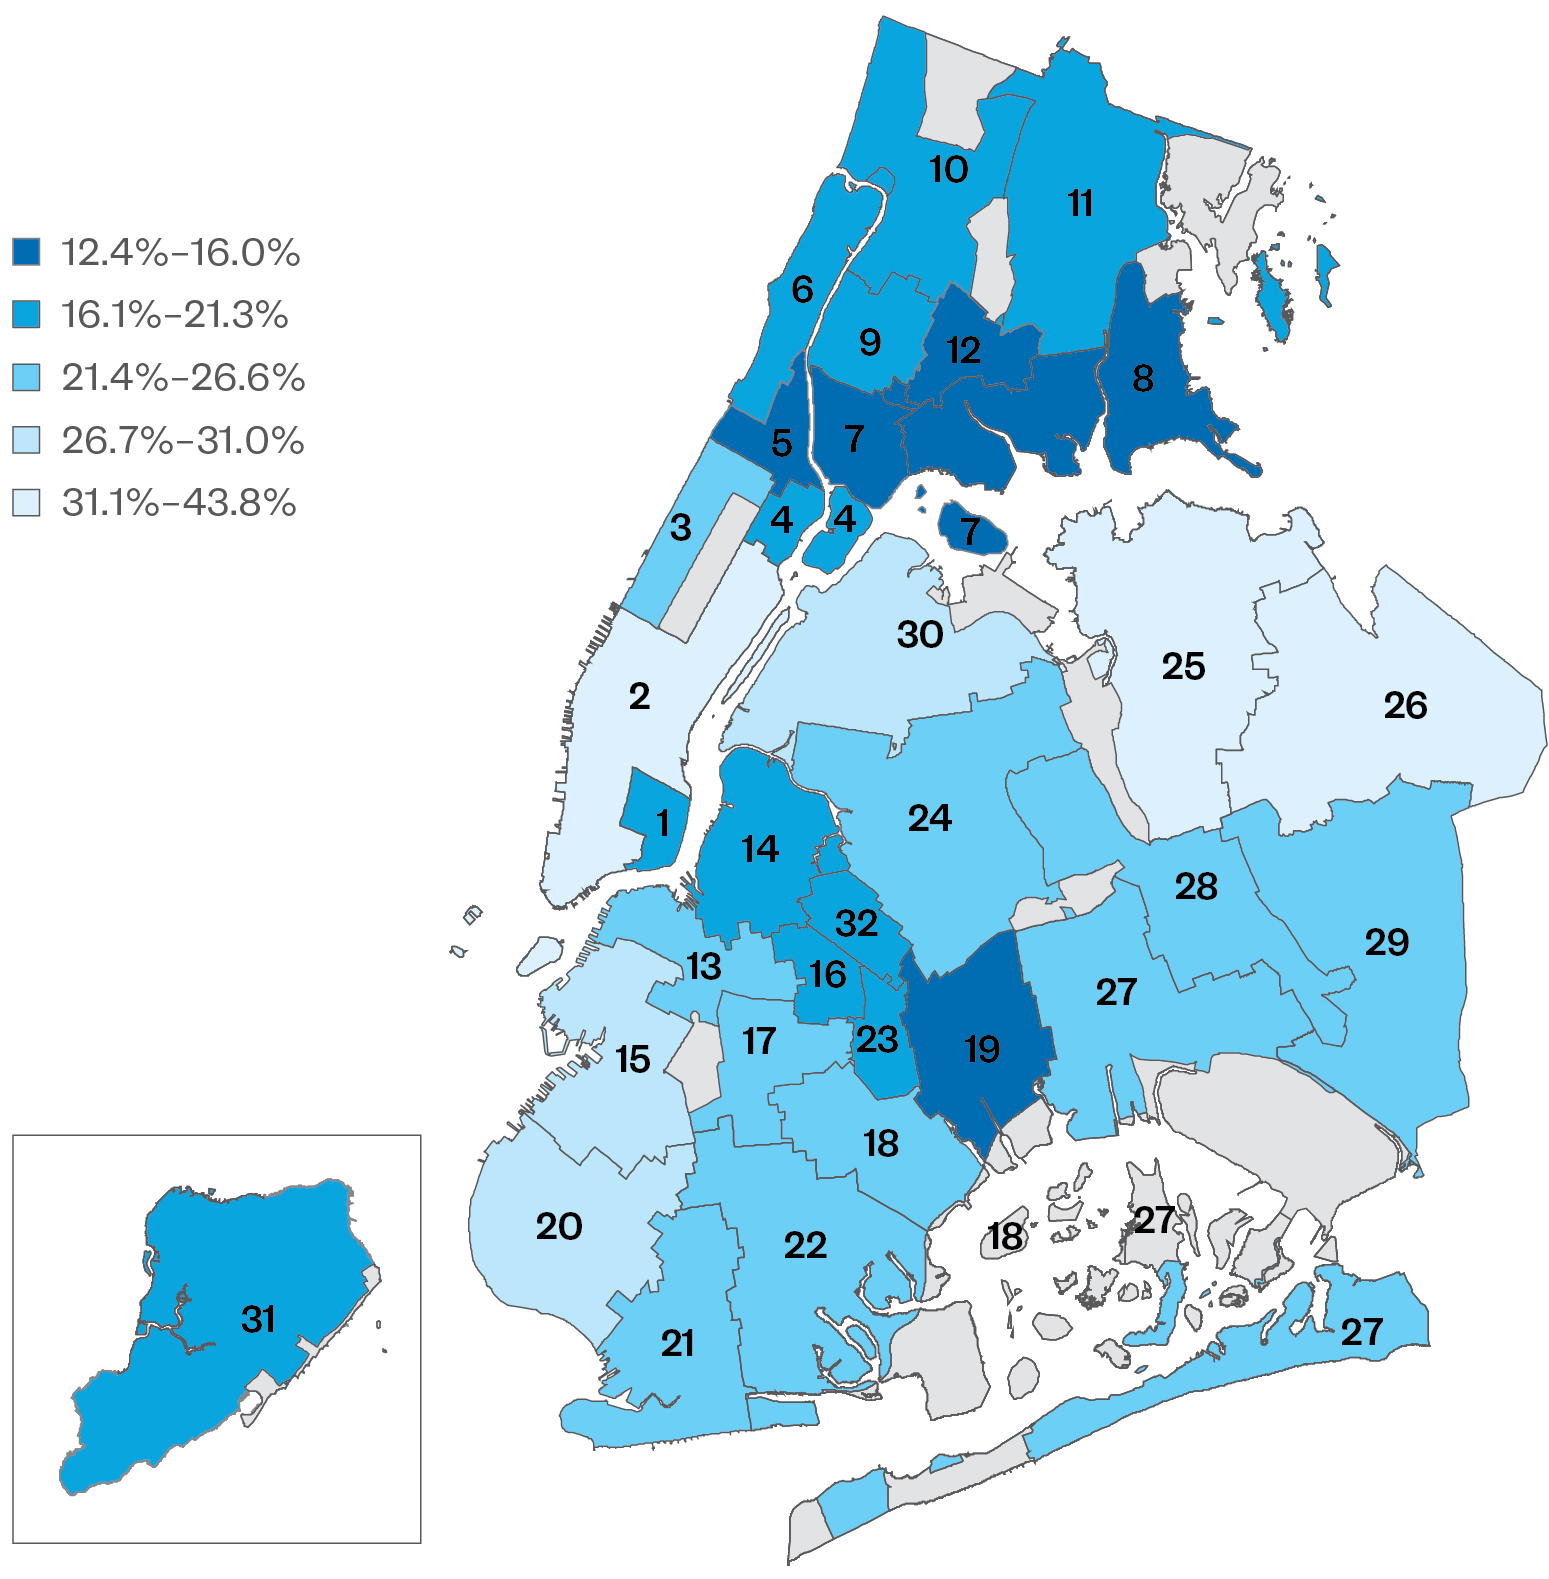
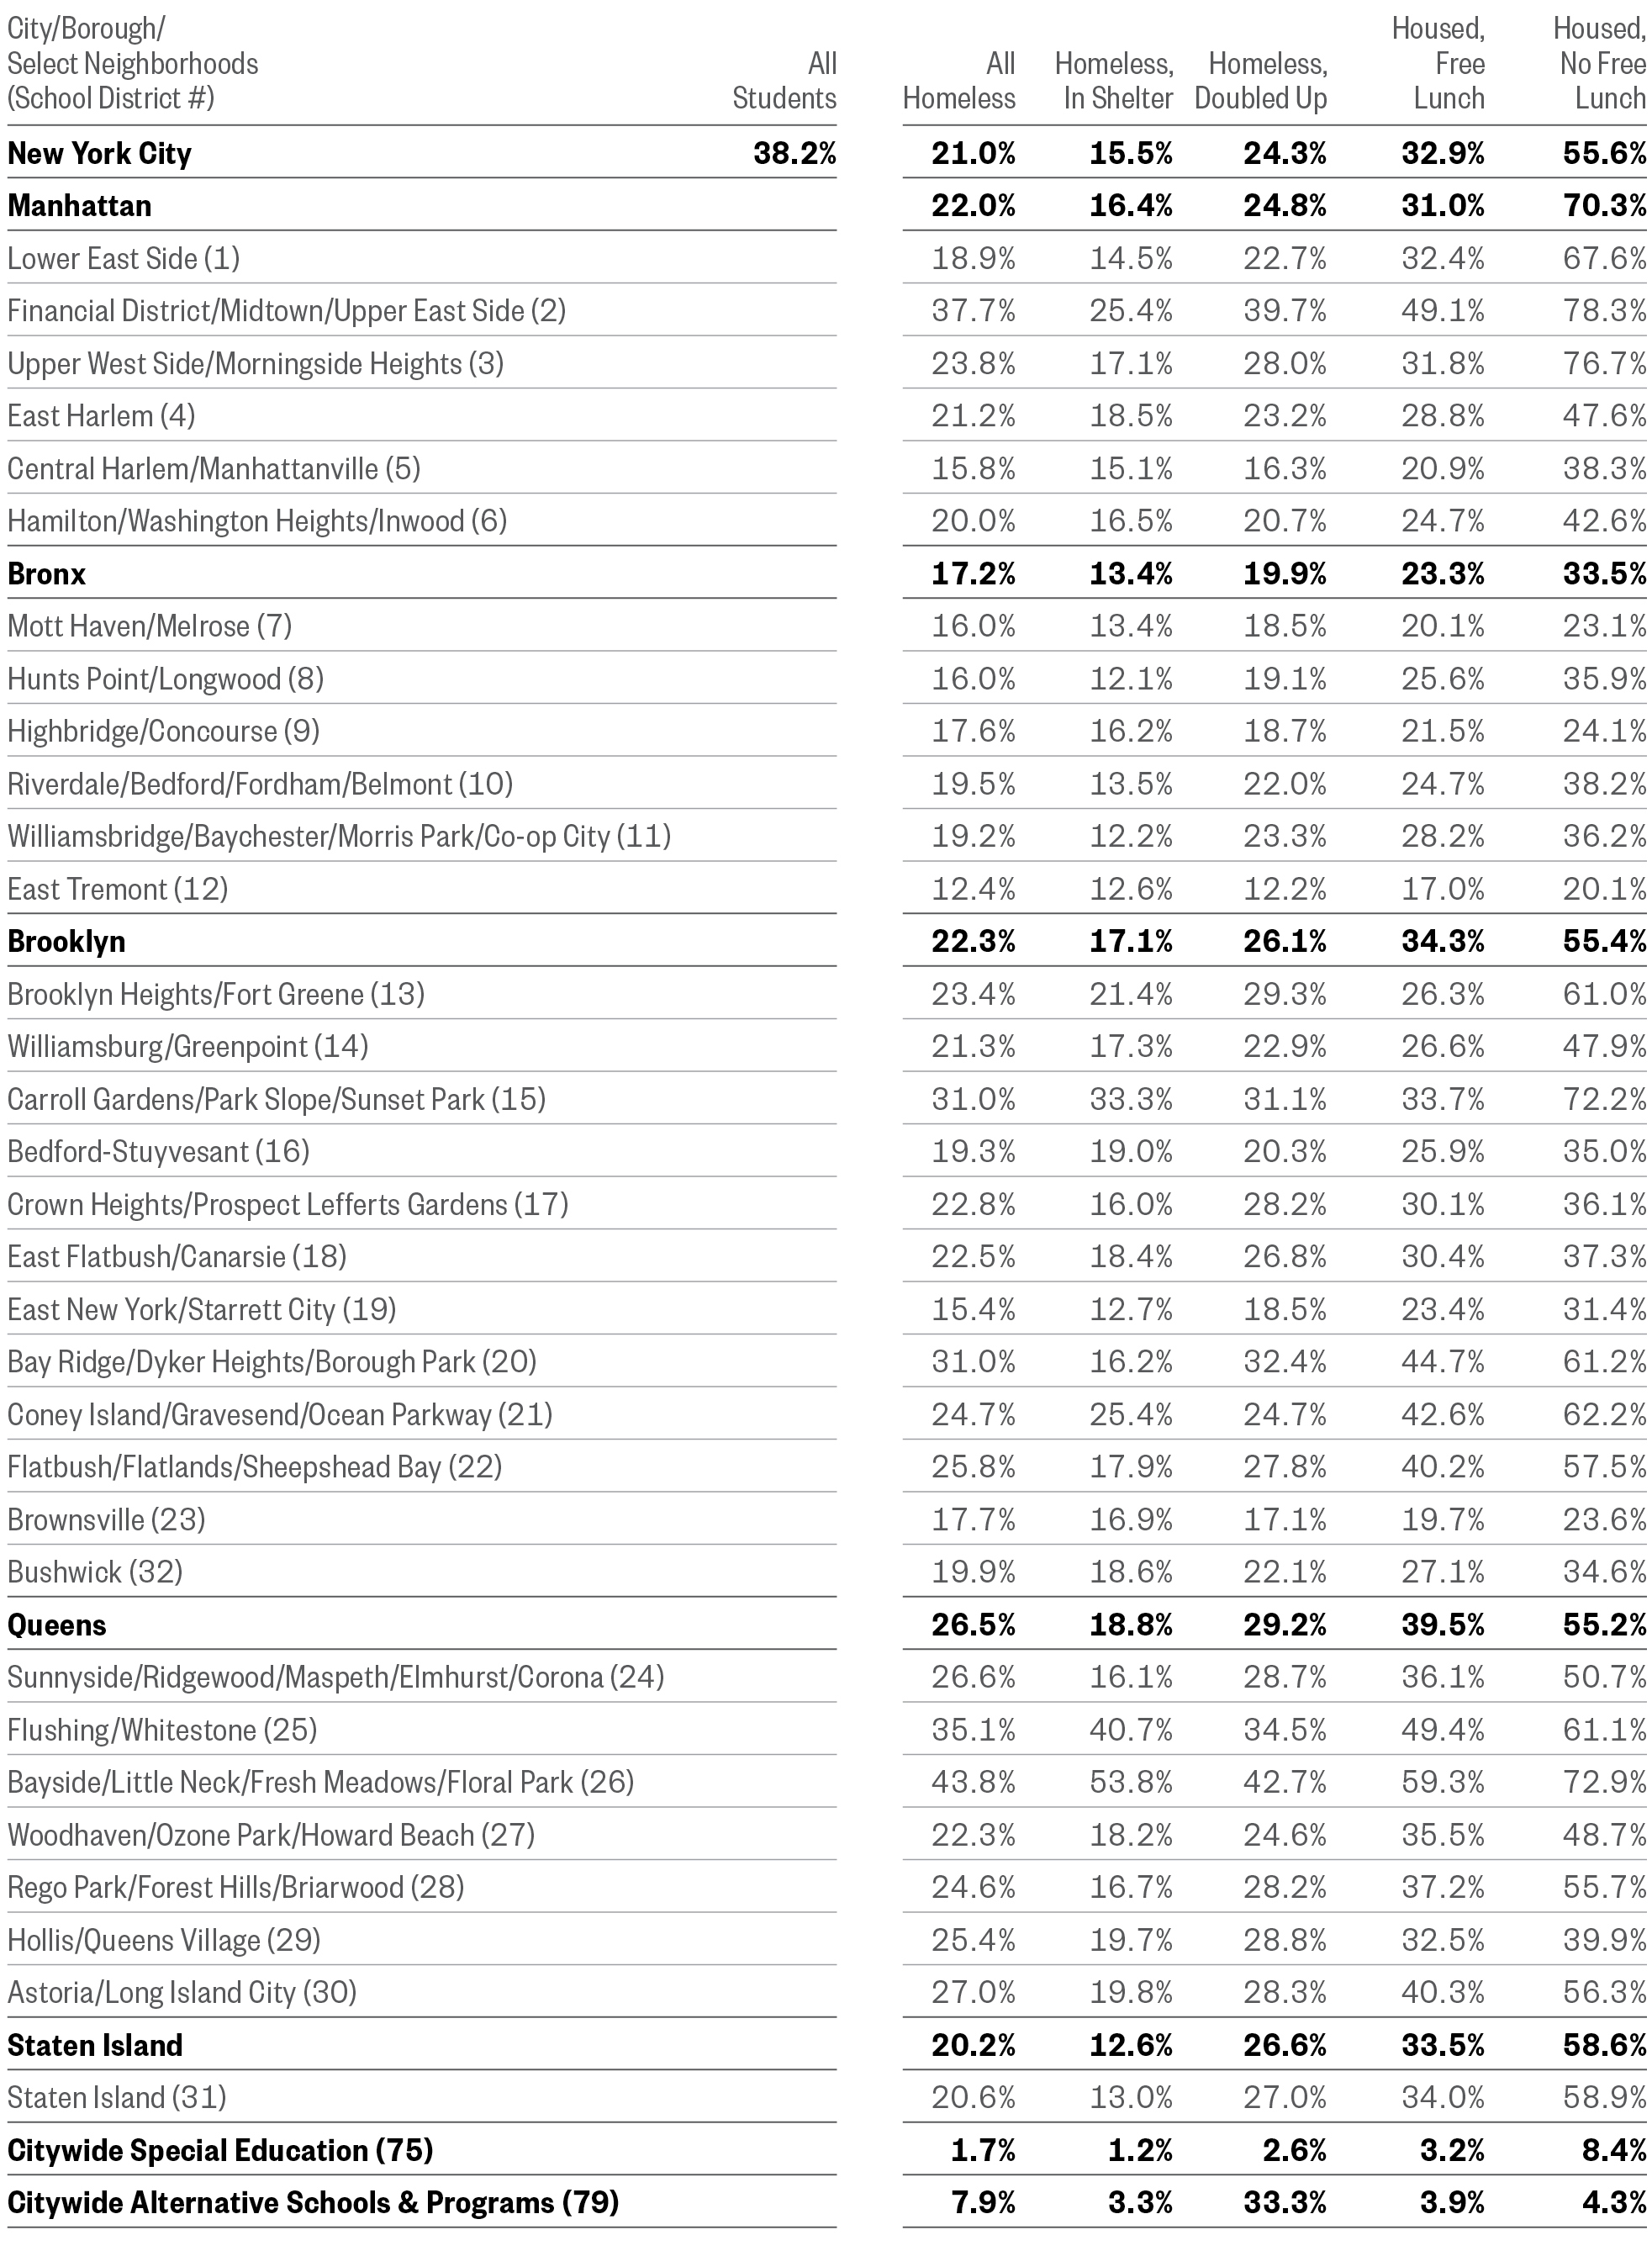
- Citywide, 38% of all students and 21% of homeless students scored proficient on their 3rd–8th grade ELA assessment. For homeless students, ELA proficiency ranged from a low of 12% in East Tremont in the Bronx to a high of 44% in Bayside, Queens. (Districts 12 and 26)
- In Manhattan, ELA proficiency rates for homeless students ranged from a high of 38% in the Financial District/Upper East Side to a low of 16% in Central Harlem compared to 21% for homeless students overall. (Districts 2 and 5)
- ELA proficiency among homeless students was lowest in some of the areas with the most homeless students overall, including upper Manhattan, the south Bronx, and central Brooklyn. (Districts 1, 4-12, 14, 16, 19, 23, 31, and 32)
3rd–8th Grade State ELA Test Proficiency Rate
SY 2015–16
Note: Data by school district do not include schools in non-geographic districts, so borough and district total percentages may differ. Ns of fewer than 30 students were redacted.
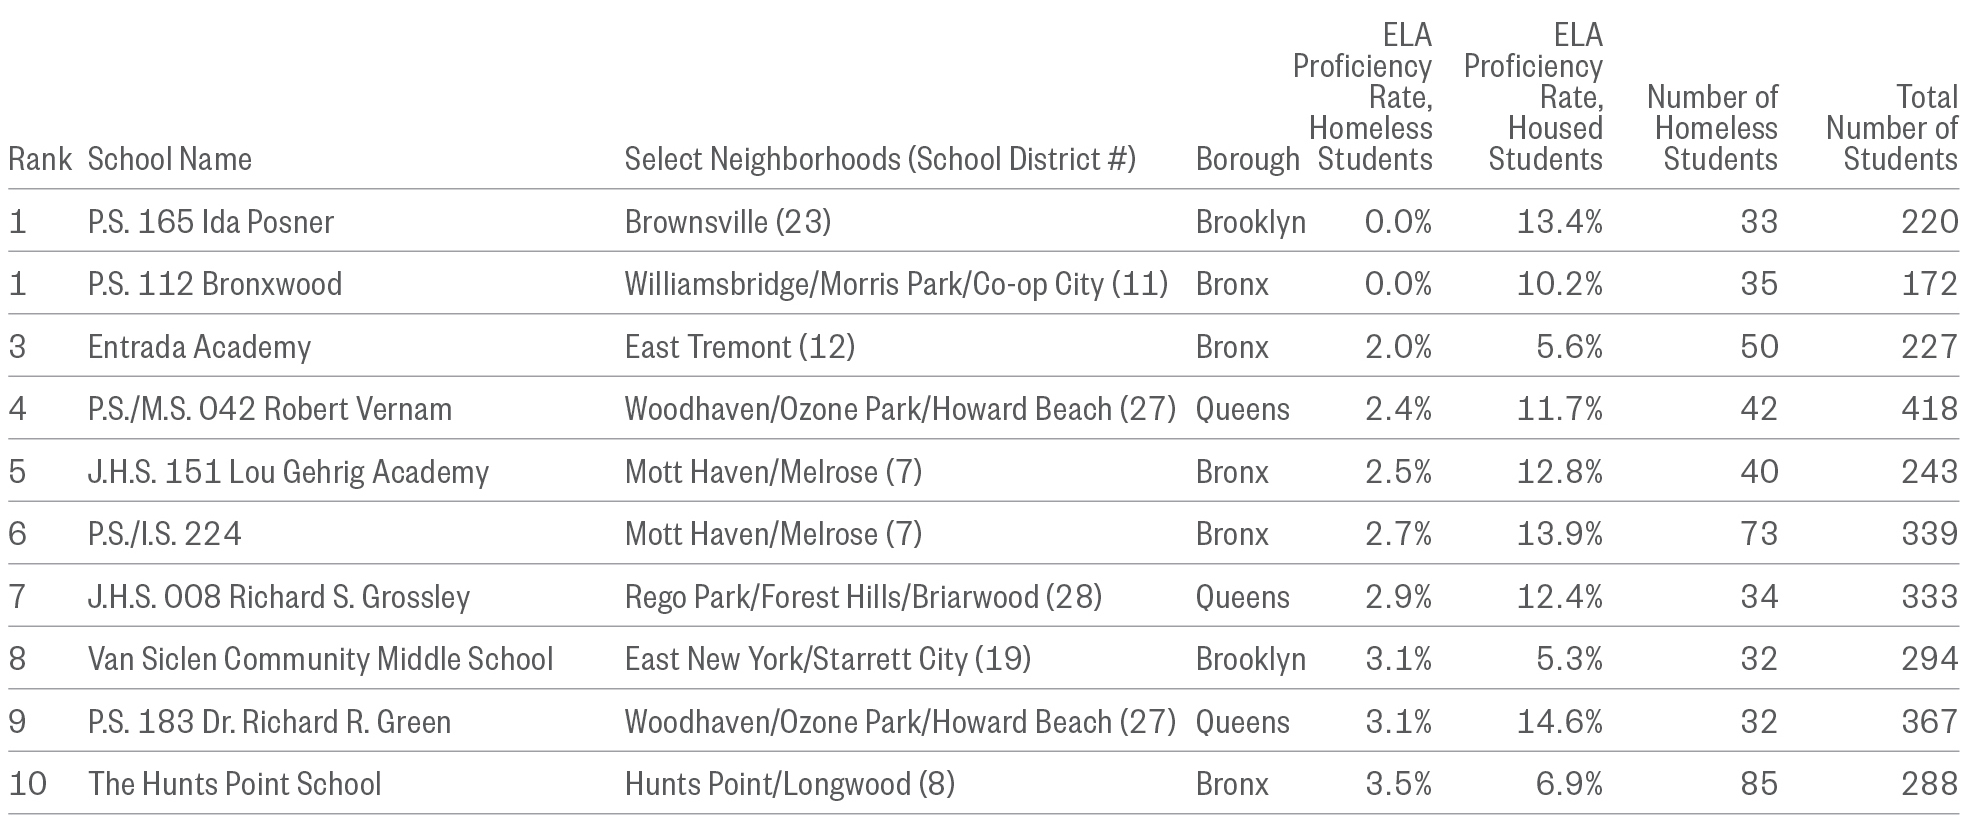
- By school, ELA proficiency rates for homeless students ranged from 0% in two schools—P.S. 165 Ida Posner in Brownsville and P.S. 112 Bronxwood in Williamsbridge—to 66% in P.S. 241 Emma L. Johnston in Crown Heights, Brooklyn. (Districts 23, 11, and 17 respectively)
Top 10 Schools for Lowest Homeless Student ELA Proficiency Rate
SY 2015–16
See schools at bit.ly/MapNYCHomelessStudents
Top 10 Schools with Lowest Homeless Student English Language Arts Proficiency Rate
SY 2015–16
Note: Data are by school district for SY 2015–16 and do not include schools in non-geographic districts.
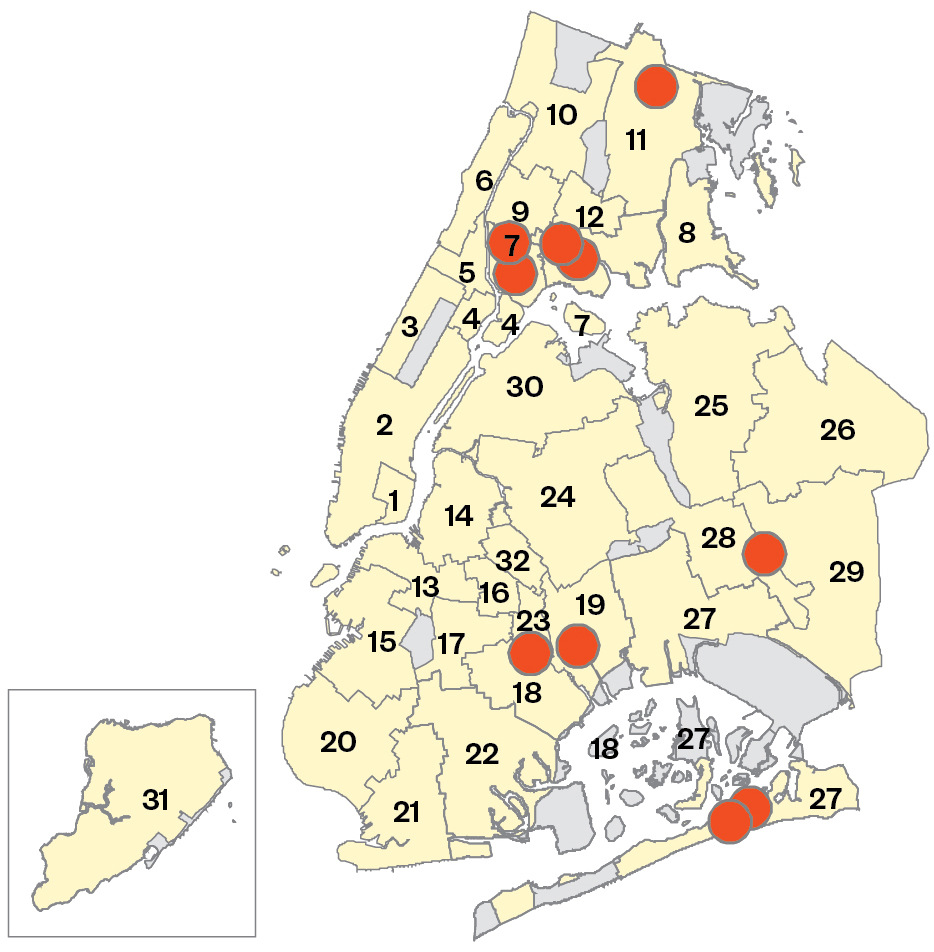
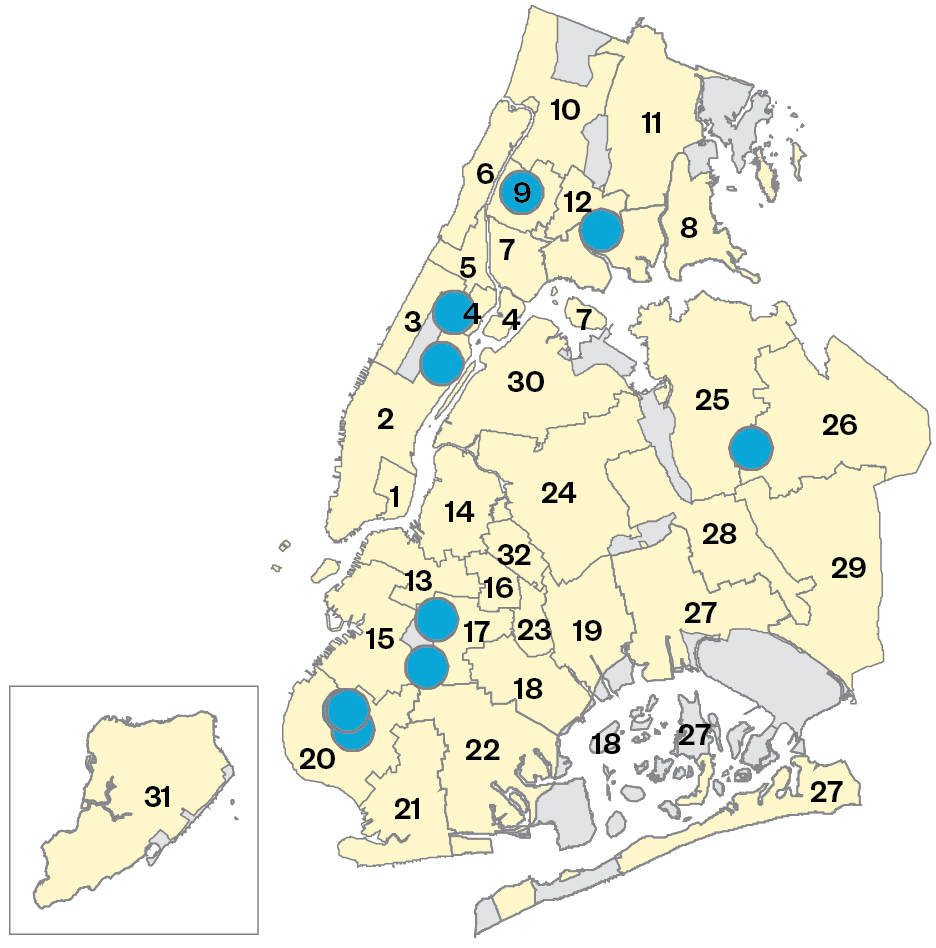
- At P.S. 241 Emma L. Johnston in Brooklyn’s Crown Heights and The School for Inquiry and Social Justice in Hunts Point in the Bronx, homeless students were proficient in ELA at much higher rates than their classmates who were housed—24 points higher and 14 points higher respectively. (Districts 17 and 8)
Understanding what supports are enabling homeless students to perform at such high rates and translating those to other schools citywide could raise proficiency rates for all students.
Top 10 Schools for Highest Homeless Student ELA Proficiency Rate
SY 2015–16
See schools at bit.ly/MapNYCHomelessStudents
Top 10 Schools with Highest Homeless Student English Language Arts Proficiency Rate
SY 2015–16
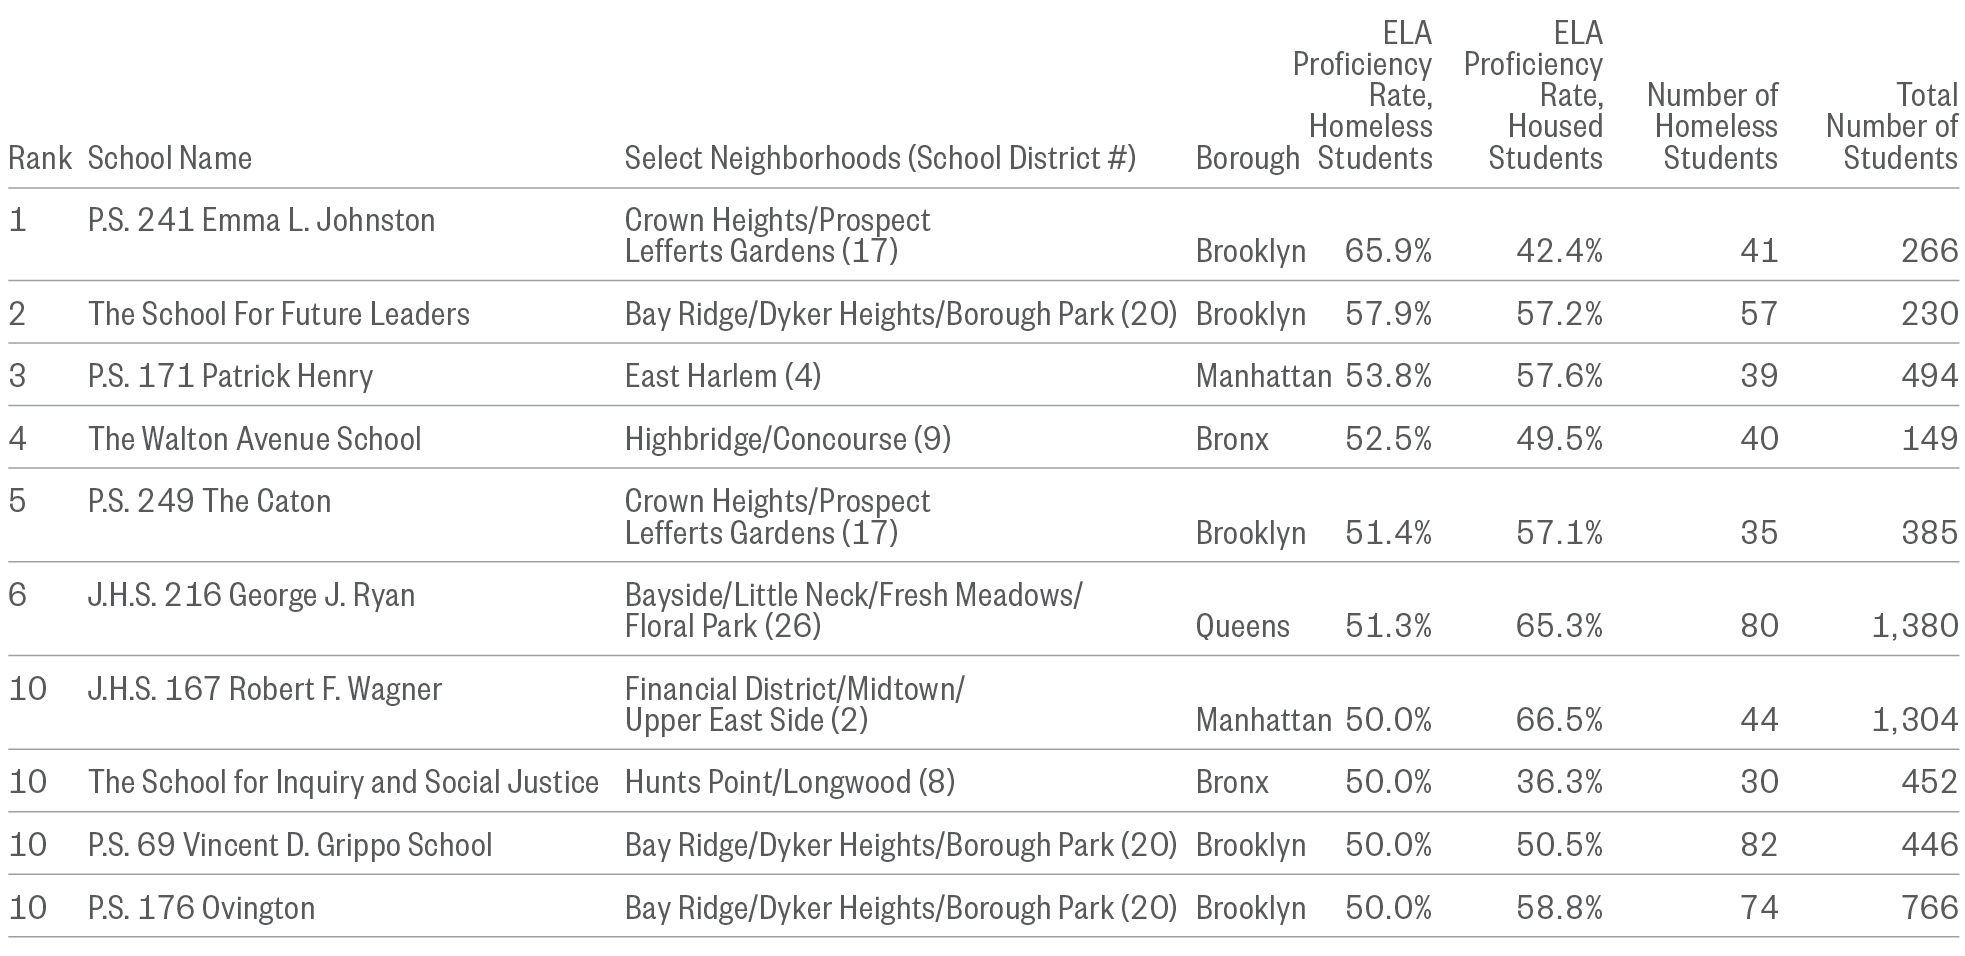
Note: Data are by school district for SY 2015–16 and do not include schools in non-geographic districts.
Math Achievement Among Homeless Students
- One in five (19%) students experiencing homelessness scored proficient on their 3rd–8th grade State math assessment compared to roughly a third of low-income housed students (35%) and two-thirds of non-low-income housed students (66%).
- Students who were currently housed but had experienced homelessness (formerly homeless) met grade-level standards at roughly the same rates as their currently homeless peers (21% to 19% in math).
3rd–8th Grade State Math Test Proficiency Rates
SY 2015–16
Note: “Formerly Homeless” includes students who were housed during SY 2015–16 but were homeless at any point during SY 2010–11, SY 2011–12, SY 2012–13, SY 2013–14, and/or SY 2014–15.
- Not only were homeless students less likely to be grade-level proficient, but their proficiency gap was also more severe. Homeless and formerly homeless students were most likely to receive a level 1 score (50% and 46%), indicating that they performed well below proficiency standards. Just 33% of low-income housed students and 13% of non-low-income housed students received that score.
- Meanwhile, only 7% of homeless students and 8% of formerly homeless students scored at proficiency level 4—the highest level—compared to 16% of low-income housed students and 40% of non-low-income housed students.
Tracking students’ housing status over time could present untapped opportunities for educators and school administrators to identify and connect formerly homeless students with educational and social support programs. These programs could help ensure that those who are still experiencing the aftershocks of homelessness are provided with the support that they need to succeed in school.
3rd–8th Grade State Math Test Proficiency Rates, by Housing Status
SY 2015–16
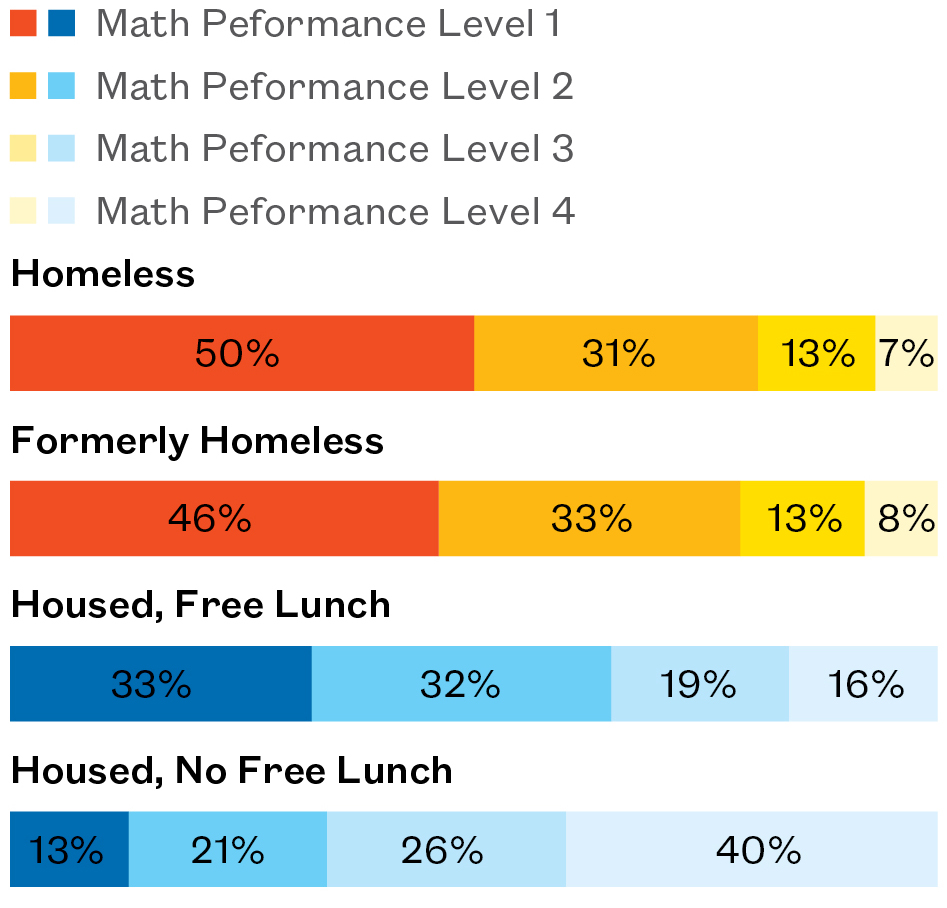
Note: Performance levels 1 and 2 indicate a student performed well below or partially below proficiency on the New York State Department of Education Math assessment, and levels 3 and 4 indicate a student performed at proficiency or higher. “Formerly Homeless” includes students who were housed during SY 2015–16 but were homeless at any point during SY 2010–11, SY 2011–12, SY 2012–13, SY 2013–14, and/or SY 2014–15. Percentages may not add to 100% due to rounding.
- With the adoption of Common Core standards into 3rd–8th grade State assessments in SY 2012–13, proficiency rates overall dropped by nearly 30 points in math. Three years later in SY 2015–16, students were given unlimited time, allowing students to work at their own pace; that year, citywide math proficiency rates rose to 36%.
- Amidst these policy and curricula changes, achievement gaps by housing status persisted. Homeless students scored proficient at roughly half the rate of housed students overall (19% to 38% in SY 2015–16).
- Homeless students living in shelter faced the greatest academic risk compared to their housed or other homeless peers. Only 12% of all students living in shelter scored proficient on their 3rd–8th grade math assessment, a rate roughly three times lower than housed students overall and two times lower than their classmates living doubled up (38% and 24%).
Changes in Citywide State Math Test Proficiency Rates
SY 2010–11 to SY 2015–16
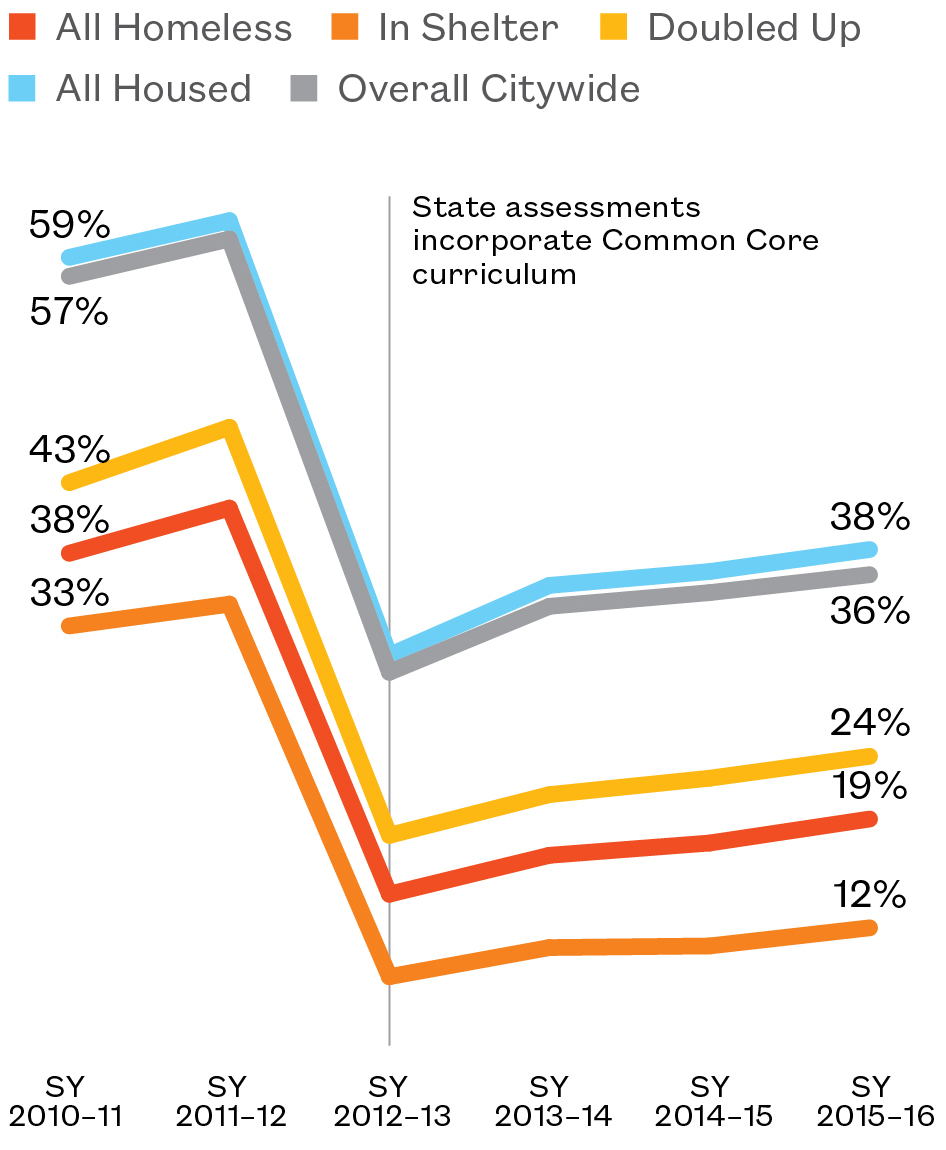
Note: SY 2012–13 was the first year that the 3rd–8th grade state assessments incorporated the Common Core. New York State first adopted the Common Core curriculum in 2010. Students were given unlimited time to complete their assessments starting in SY 2015–16. “All homeless” includes all categories of homelessness.
- In middle school, students experiencing homelessness scored proficient on their 3rd–8th grade math assessment at roughly half the rate of their housed peers (15% to 34%).
- Homeless students living in shelter were more at risk academically than their housed or other homeless peers. Among middle schoolers, just 8% of students in shelter scored proficient in math, a rate four times lower than housed students overall (34%).
- One in five (20%) doubled-up students in middle school scored proficient in math. This was 14 points lower than the proficiency rate for housed students overall in middle school (34%).
3rd–8th Grade State Math Test Proficiency Rates
Percent of Students who Scored Proficient on the State Math Test
SY 2015-16
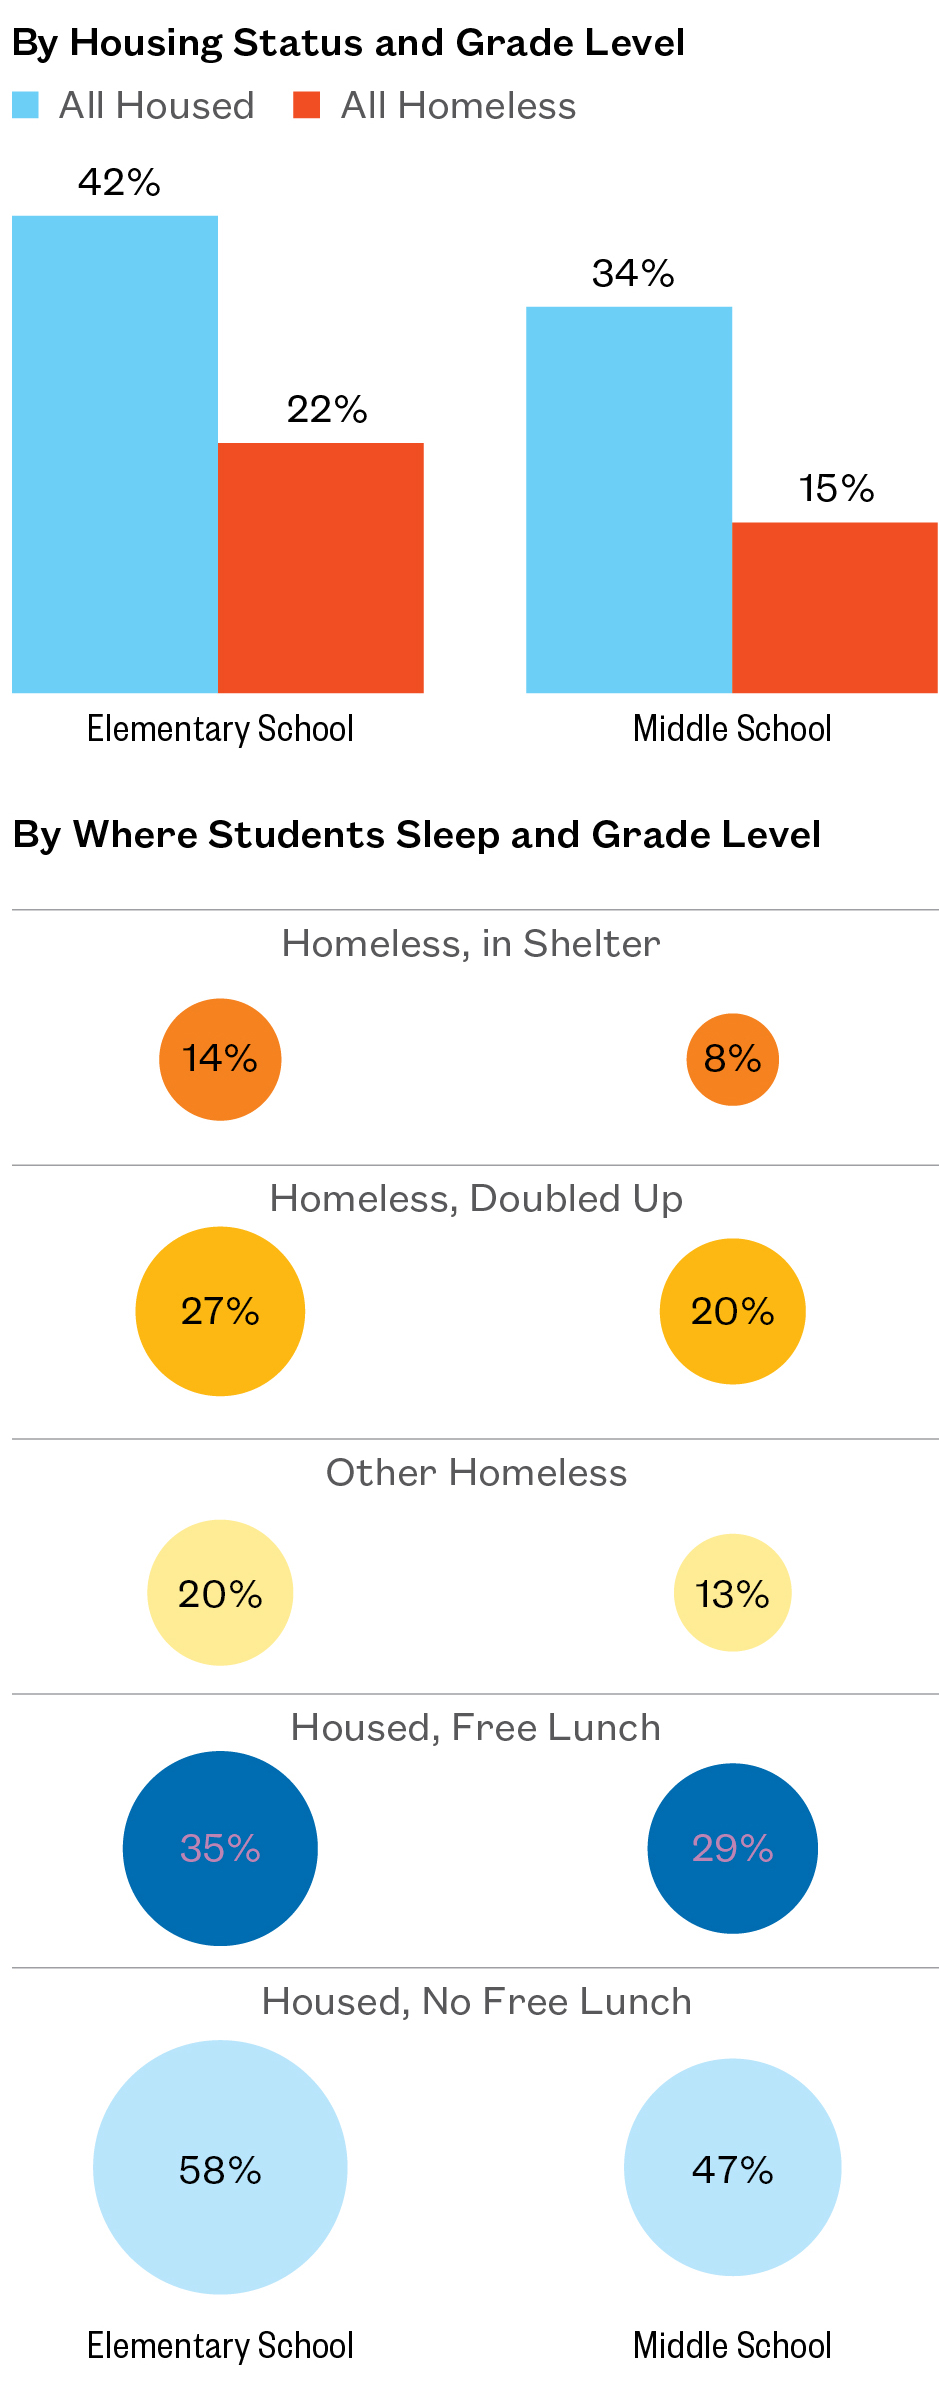
Note: “Other homeless” includes students who were awaiting foster care, paying for a hotel/motel outside of the shelter system, or living in another temporary and/or unsuitable housing situation.
Geographic Patterns of Math Proficiency
Math Grade-Level Proficiency Varies by Geography
Grade-Level Proficiency Among Homeless Students: 3rd–8th Grade State Math Test
SY 2015–16
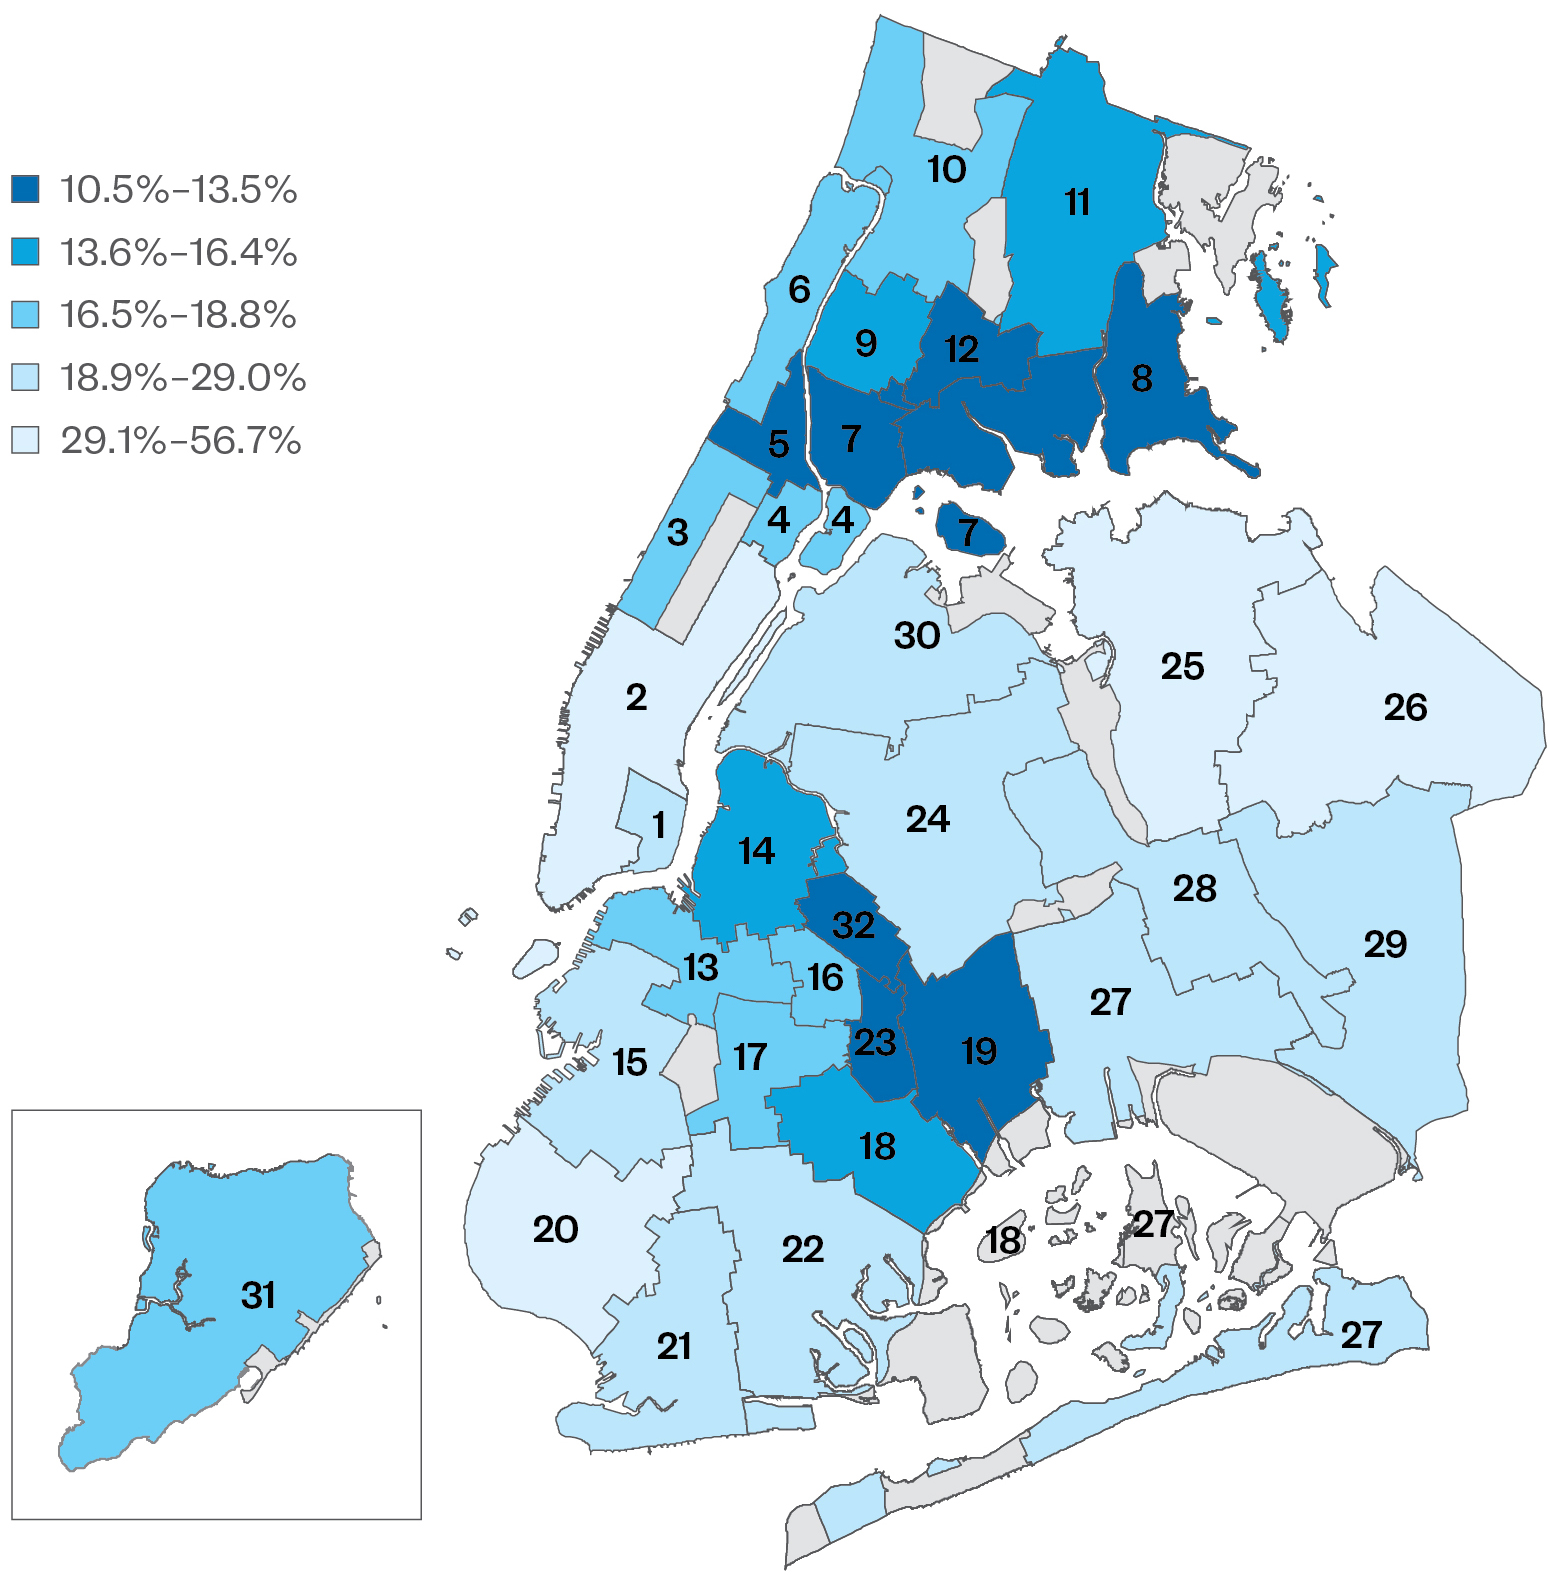
Note: Data are by school district for SY 2015–16 and do not include schools in non-geographic districts.
Explore Districts at bit.ly/StudentAtlasApp.
- Citywide, 36% of all students and 19% of homeless students scored proficient on their 3rd–8th grade math assessment.
- By borough, just 18% of students living doubled up in the Bronx scored proficient on their 3rd–8th grade math assessment, while a high of 32% of students living doubled up in Queens scored proficient.
- Students in shelter struggled more than their housed and homeless peers across virtually all districts in math, with just 6% scoring proficient in Staten Island to a high of 24% proficient in Flushing. (Districts 31 and 25)
- In three of the districts with the highest rates of math proficiency for homeless students (29% to 57%), those living in shelter were left behind, scoring proficient at just one-half the rate of their housed and other homeless peers or less. (Districts 2, 20, and 25)
3rd–8th Grade State Math Test Proficiency Rate
SY 2015–16
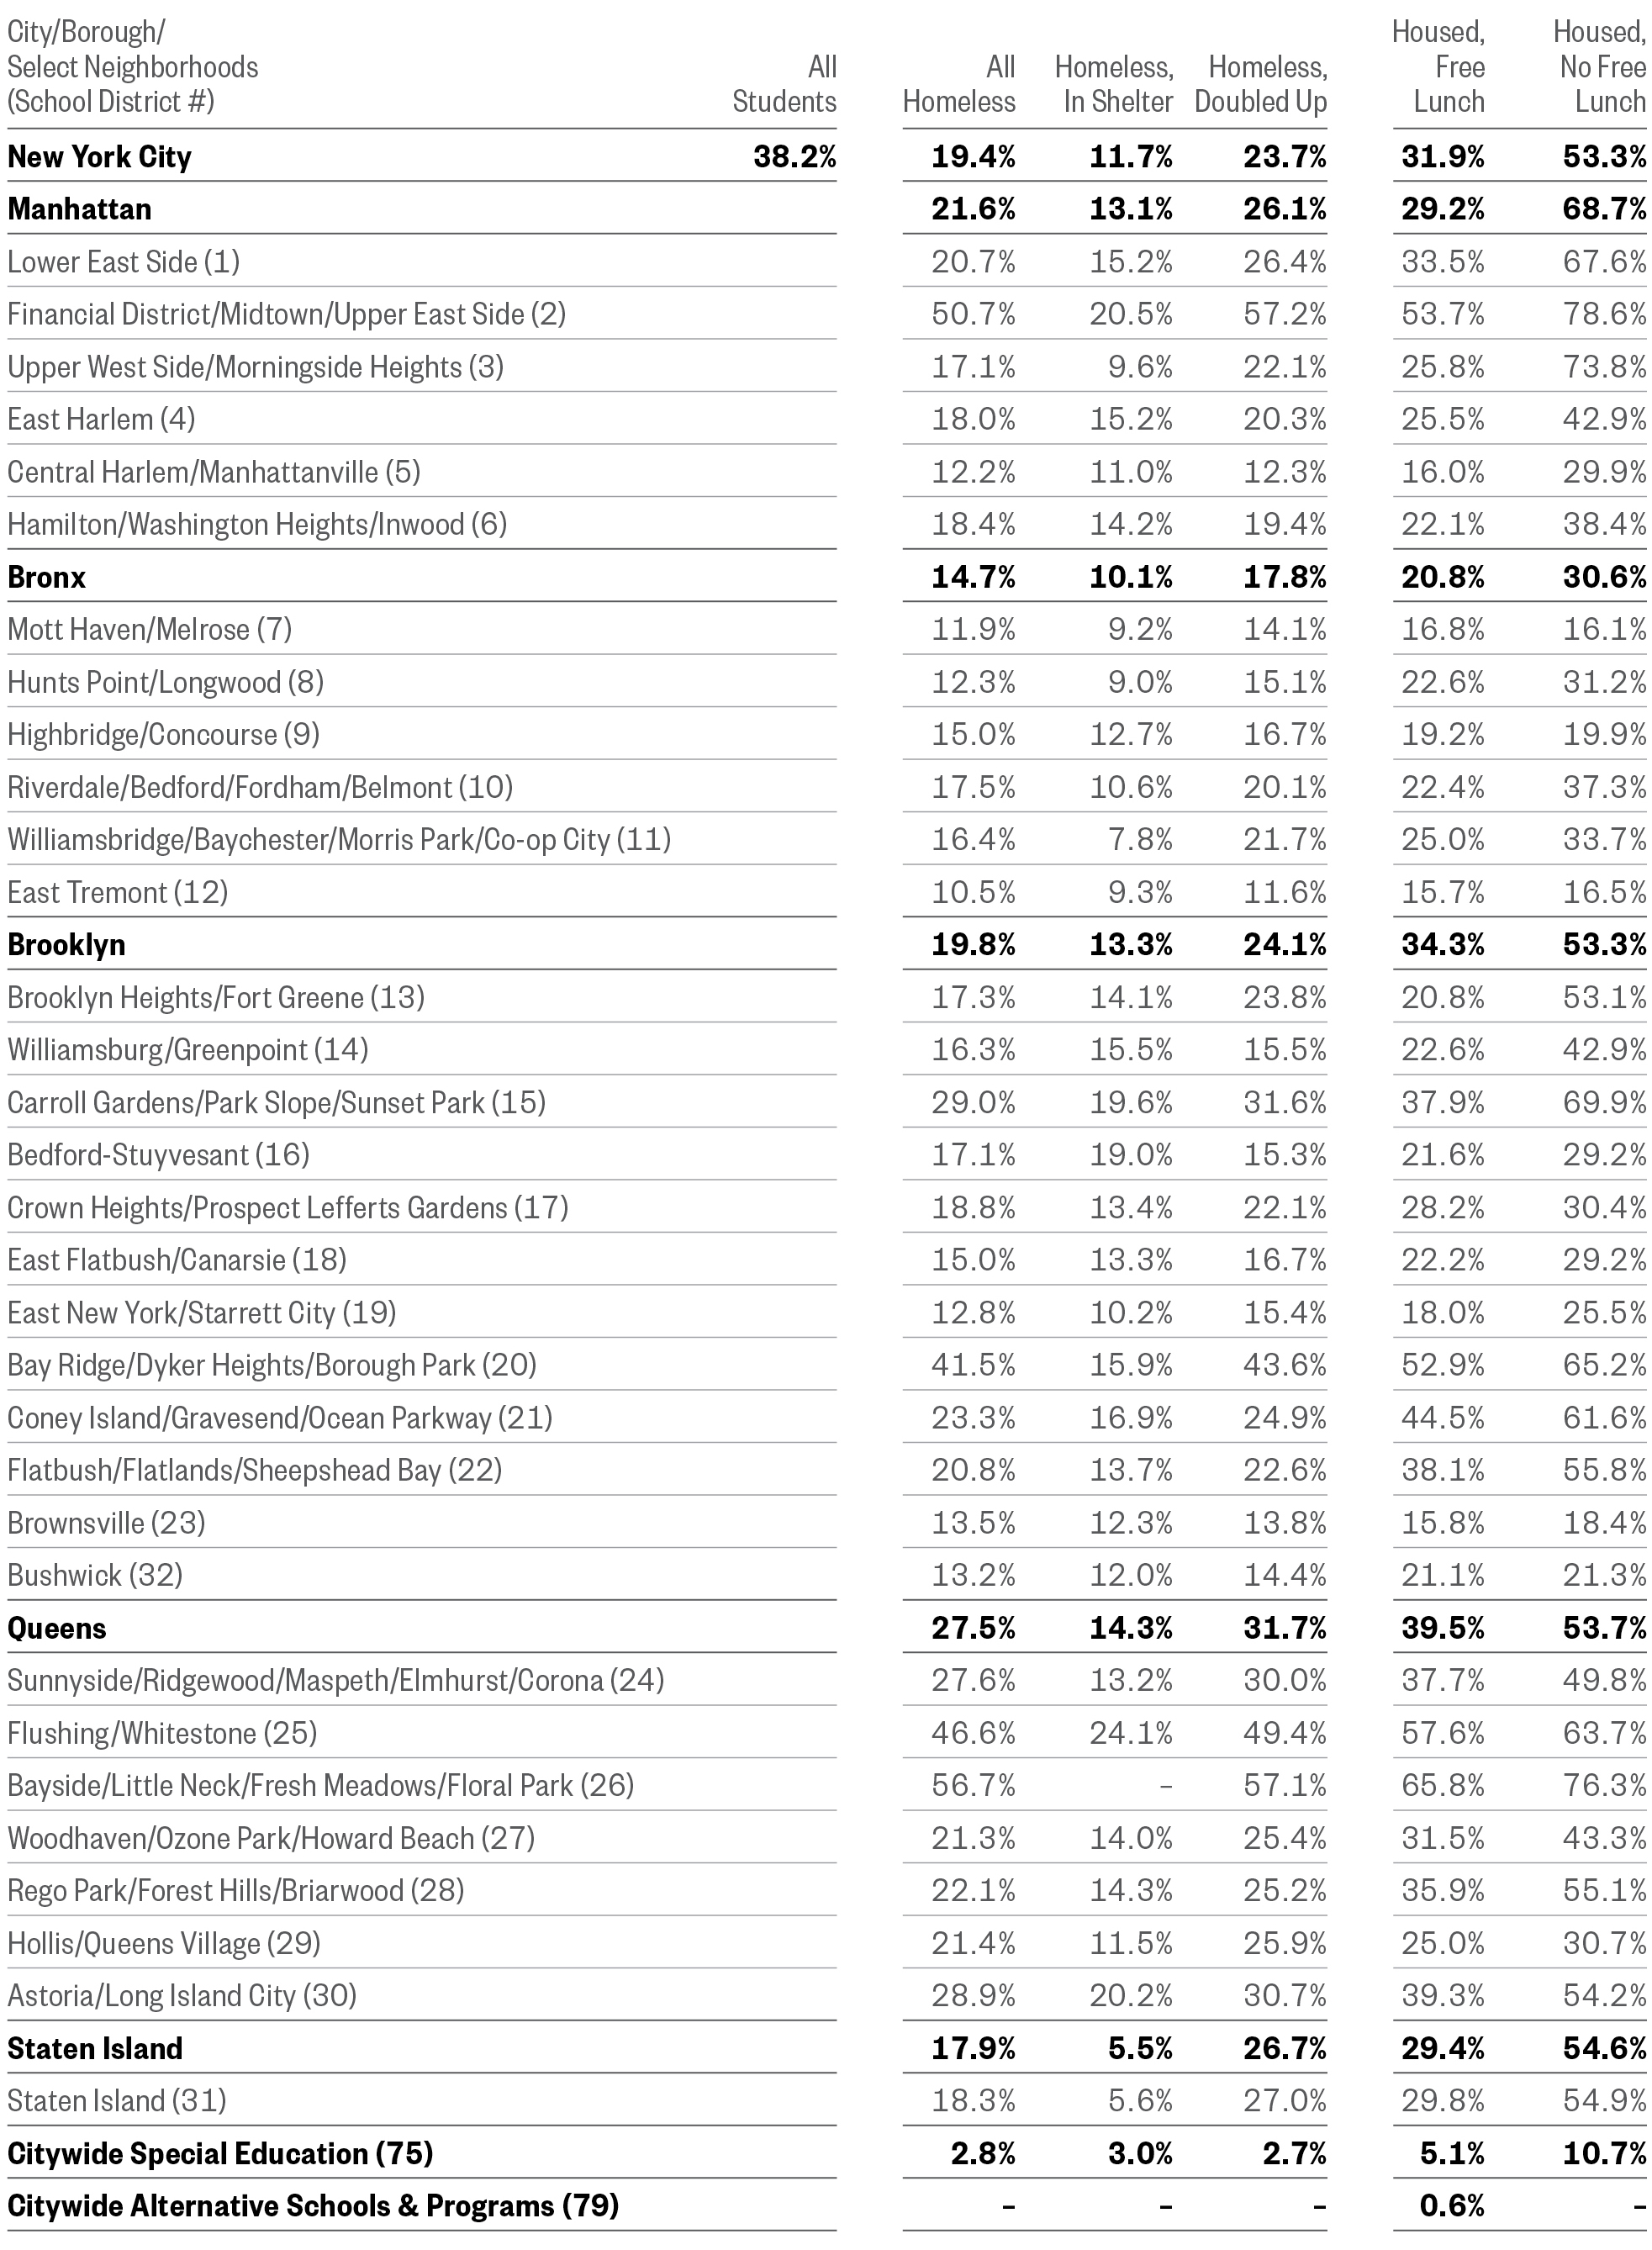
Note: Data by school district do not include schools in non-geographic districts, so borough and district total percentages may differ. Ns of fewer than 30 students were redacted.
- Proficiency rates for homeless students varied greatly by school. In 13 schools, no homeless students scored proficient on their 3rd-8th grade State math assessment, while at both P.S. 002 Meyer London in the Financial District and P.S. 69 Vincent D. Grippo School in Bay Ridge, 79% of homeless students scored proficient on their State math assessment. (Districts 2 and 20)
Low levels of academic proficiency disproportionately affect homeless students, but also some schools overall. Homeless students were far more likely to attend schools with low overall proficiency even when the proficiency rates of homeless students were not included in school-wide proficiency calculations.
Top 10 Schools for Lowest Homeless Student Math Proficiency Rate
SY 2015–16
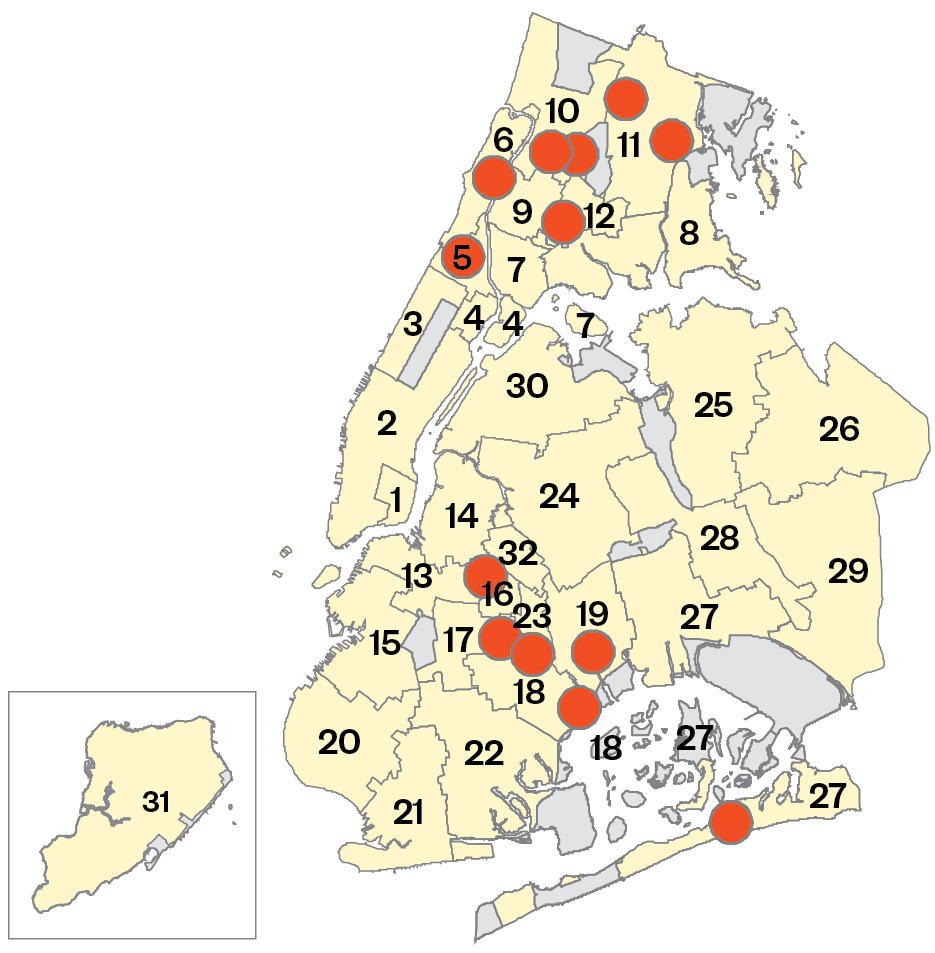
See schools at bit.ly/MapNYCHomelessStudents
Top 10 Schools with Lowest Homeless Student Math Proficiency Rate
SY 2015–16
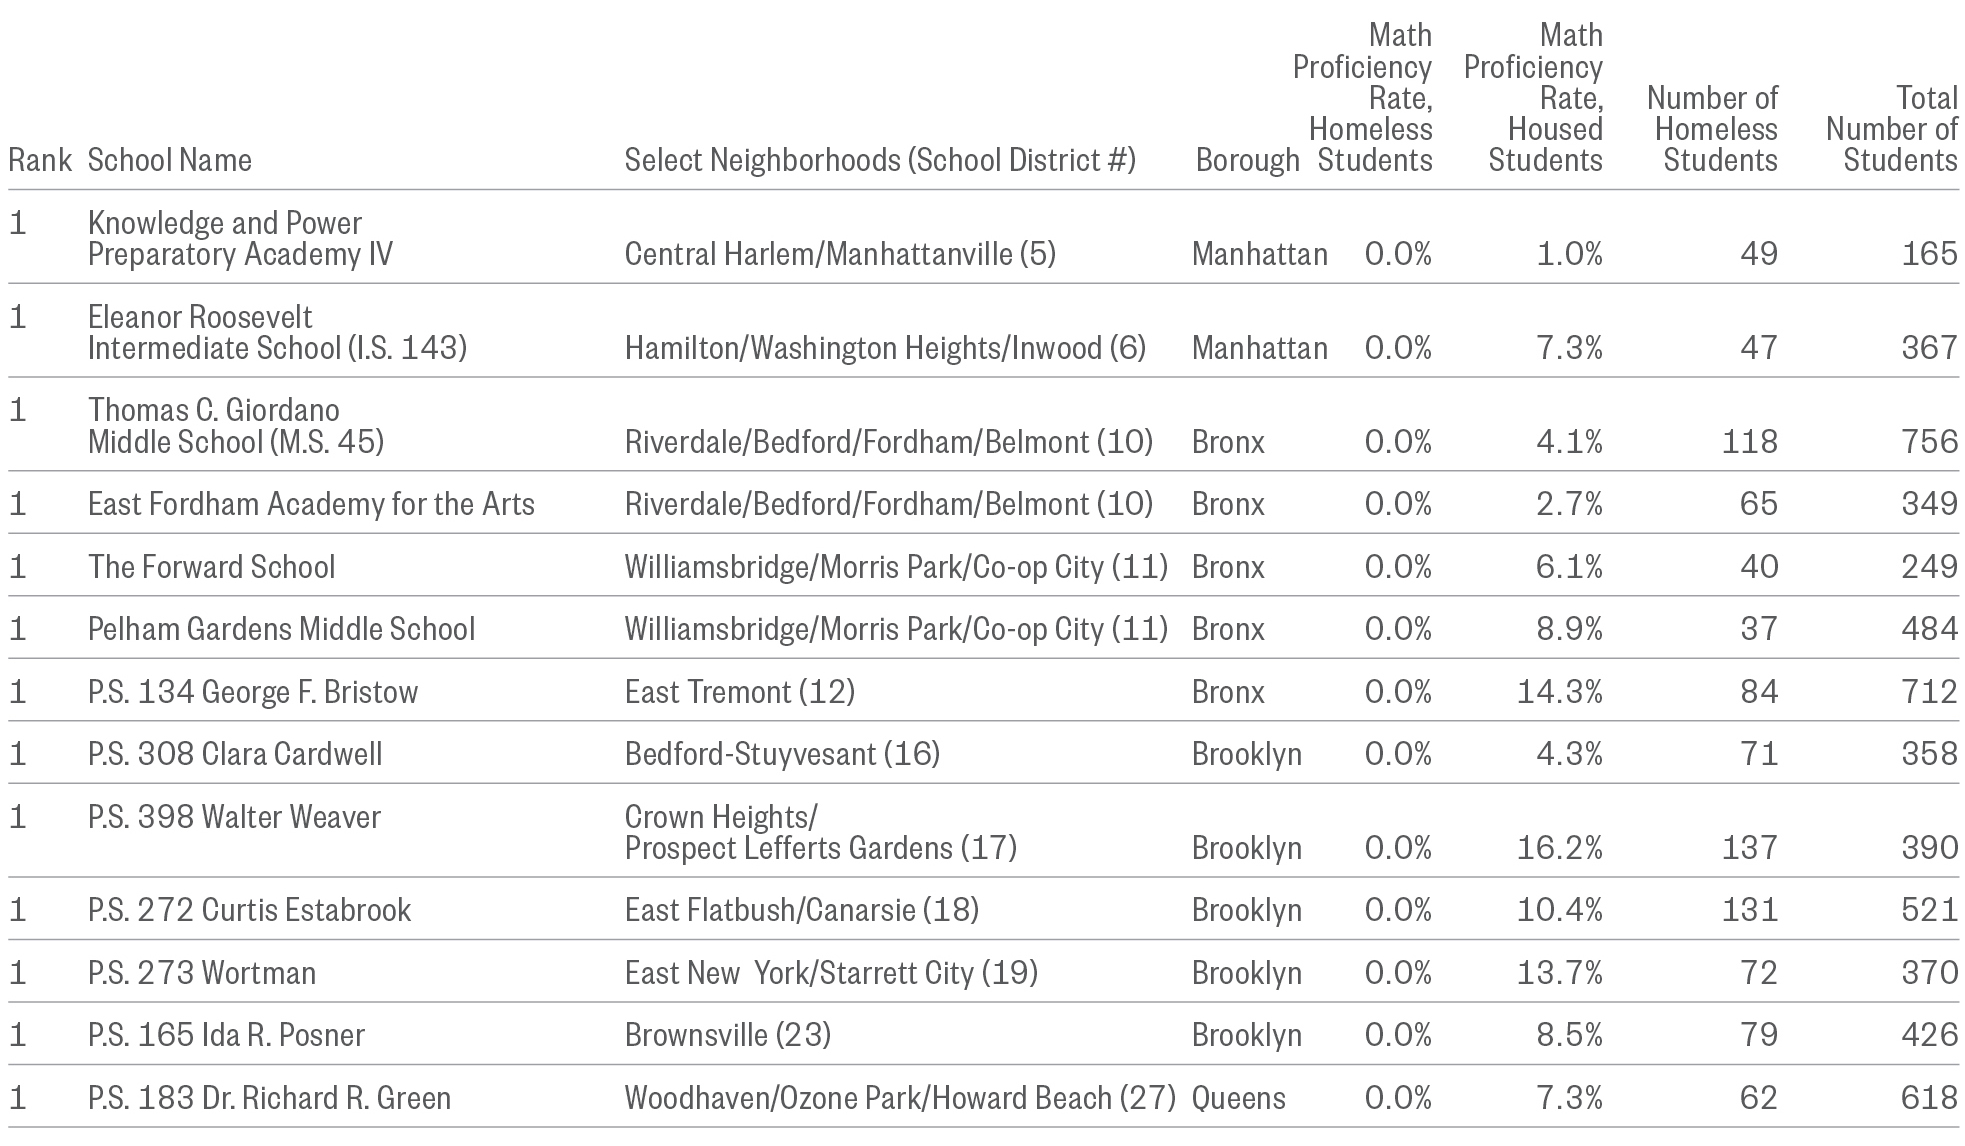
Note: Data are by school district for SY 2015–16 and do not include schools in non-geographic districts. At 13 schools where the proficiency rate for homeless students could be calculated, no homeless students scored proficient.
- At the school level, proficiency rates were similar for housed and homeless students: among the top ten schools for highest math proficiency rate of homeless students, the proficiency rate for housed students exceeded the overall citywide average. In a similar pattern, in most of the 13 schools where no homeless students scored proficient, the housed student rate was 10% or less.
Top 10 Schools for Highest Homeless Student Math Proficiency Rate
SY 2015–16
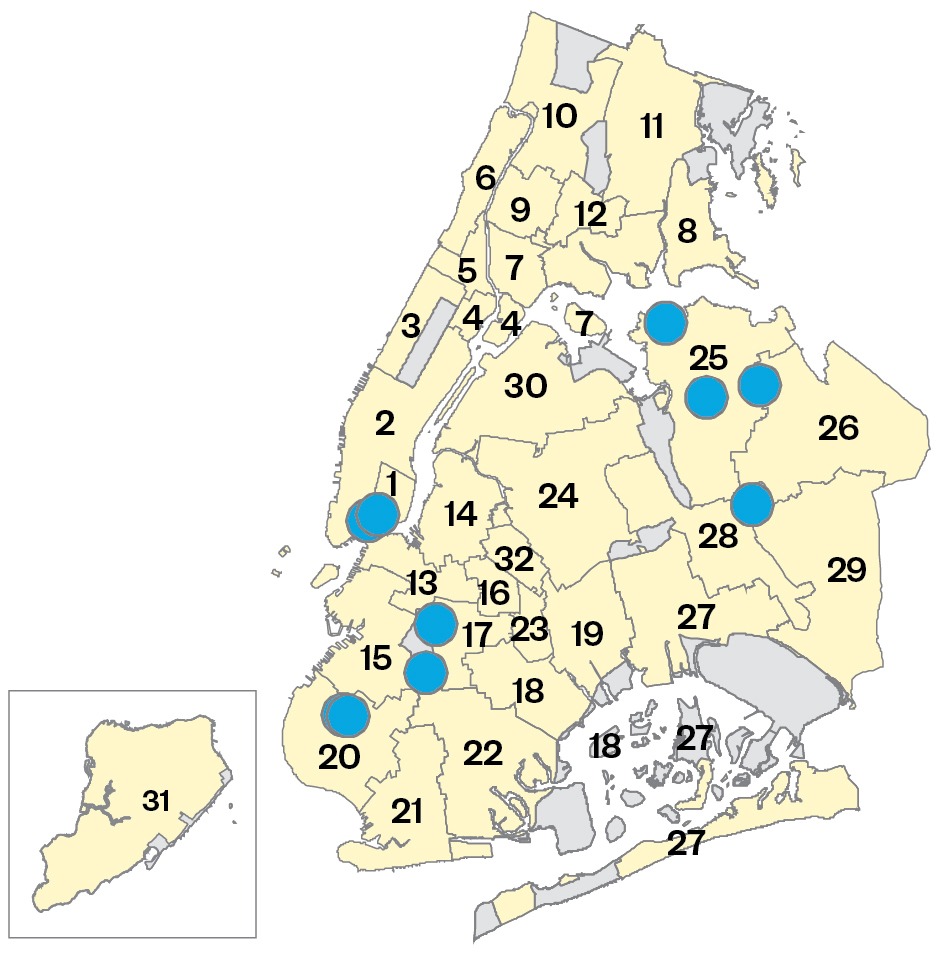
See schools at bit.ly/MapNYCHomelessStudents
Top 10 Schools with Highest Homeless Student Math Proficiency Rate
SY 2015–16
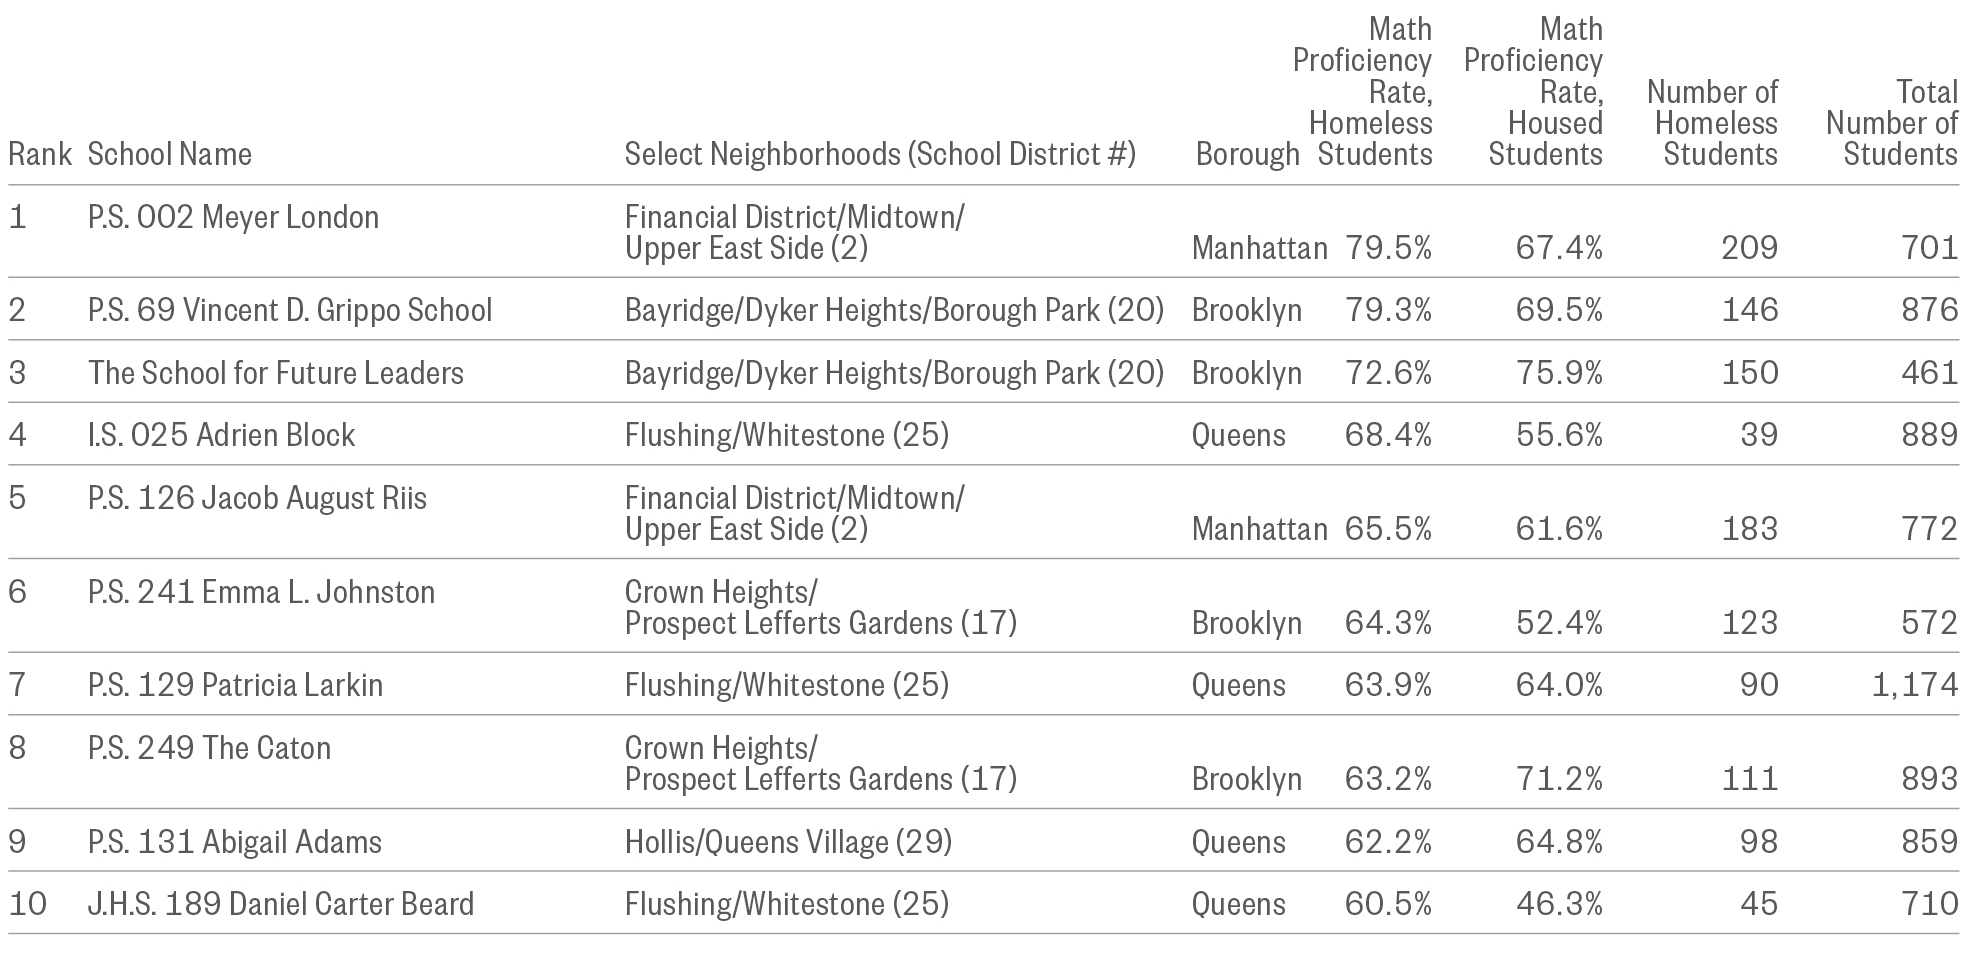
Note: Data are by school district for SY 2015–16 and do not include schools in non-geographic districts. At 13 schools where the proficiency rate for homeless students could be calculated, no homeless students scored proficient.
Download Section 4 PDF
To explore homelessness in New York City schools, try our interactive map.
To learn more about the educational outcomes of homeless New York city students, try our Student Atlas app.
Return to top.
Section 5
Behavioral Challenges and Discipline of Homeless Students
My behavior was always good, then my behavior went from good to bad, but nobody heard my silent cry. … You don’t just get up and talk about your homelessness, there’s insecurities, there’s pride. But why weren’t they able to tell?
—Graduate student, High School Class of 2010, former participant in NYC Department of Education Students in Temporary Housing (STH) Unit supportive program
One first grade girl’s family was placed in a shelter near our school (in Brooklyn) and we helped them a lot with basic resources. This year she disappeared and we found out she was transferred to a shelter in the Bronx. … When she started with us she was totally dysregulated, very delayed, because there had already been a lot of disruptions in her education. It caused a lot of emotional outbursts.
—Social Work Director, Partnership with Children,working in Brooklyn public schools
Social and behavioral challenges are widely recognized outcomes for children who have experienced trauma, especially those who are homeless. Higher risks of physical and sexual violence, substance abuse, and the everyday struggles of homelessness take a toll on homeless students’ mental health. There is a growing consensus among educators that suspending children for minor infractions is not the answer to their individual behavioral challenges, yet homeless students are suspended at higher rates than their housed peers. Considering how to close these gaps and meet homeless students’ social and behavioral challenges with support, not punishment, is key to ensuring that these students can stay in school and learn on pace with their peers.
What’s New?
- The citywide suspension rate saw a dramatic decline between SY 2010–11 and SY 2015–16. Progress has been made not only with housed students whose suspension rate declined from 4.3% to 2.4%, but also among homeless students whose suspension rate was roughly cut in half over the six-year period (5.8% to 3.2%).
- School suspensions disproportionately affect homeless students, but also some schools overall. At the ten schools with the highest suspension rates for homeless students, an average of 29% of homeless students and 18% of housed students were suspended—nearly ten times the citywide average of 2.5%.
Policy Considerations
- Students who experience housing instability face social and behavioral challenges as well as academic challenges. However, students are often unable to access the social and emotional supports they need. Recognizing the traumatic impacts of housing instability on students’ lives and meeting those needs with trauma-informed services in schools is key to reducing suspension rates among homeless students.
- High rates of suspension by school are particularly shocking when considering the City’s successful efforts to lower suspension rates in recent years. Targeting school-wide behavioral supports could reduce the number of disciplinary actions in some of the city’s highest-risk schools.
Suspension of Homeless Students
- Overall, the suspension rate among homeless students is higher than their peers: 3.2% were suspended in SY 2015–16 compared to 2.5% of NYC students overall.
- Formerly homeless students faced the greatest risk of suspension (5.0%) compared to both their currently homeless (3.2%) and low-income housed peers (2.6%). Housed students who were not low income had a far lower rate than any of these groups (0.7%).
- Black, white, Native American, and multi-racial homeless students faced a much greater risk of suspension than their housed peers.
Suspension Rate
SY 2015–16
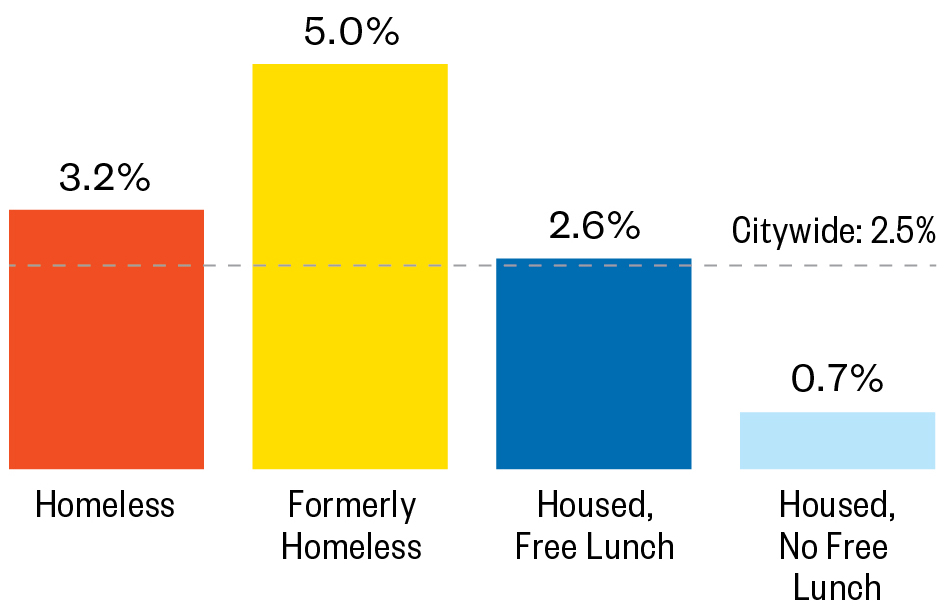
Note: Suspension rate shows the percentage of students who were suspended at some point during the 2015–16 school year. “Formerly Homeless” includes students who were housed during SY 2015–16 but were homeless at any point during SY 2010–11, SY 2011–12, SY 2012–13, SY 2013–14, and/or SY 2014–15.
- Regardless of housing status, students who are black had the highest suspension rate of all students. Still, homeless students who are black were at an even higher risk for receiving disciplinary actions in school than their housed peers (5.5% to 4.7%).
Trauma-informed approaches and other school interventions that meet homeless students’ behavioral challenges with support, not punishment, are key to supporting homeless students so they can remain in the classroom with their peers.
Suspension Rate by Race and Ethnicity
Percent of Students Who Were Suspended, by Housing Status and Race/Ethnicity
SY 2015–16
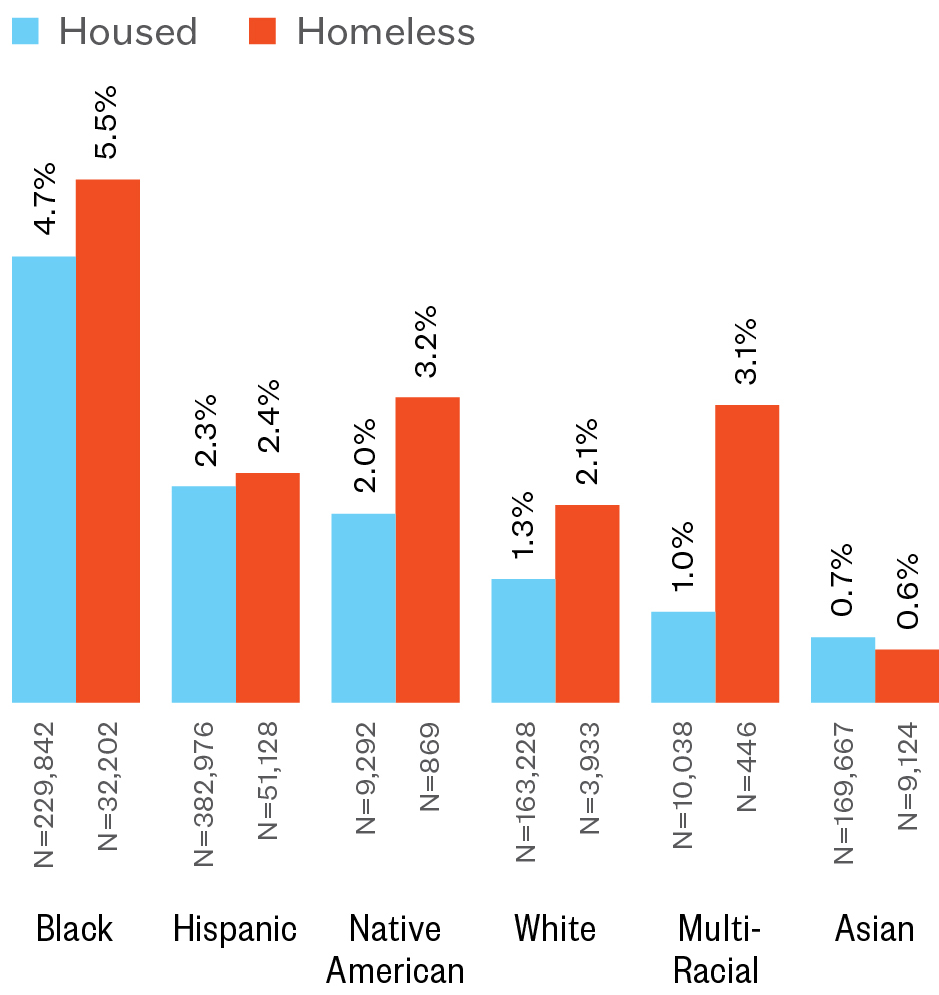
- Amidst a multi-year effort to reduce suspensions for all students citywide, the New York City Department of Education has succeeded in lowering the suspension rate from 4.4% of students overall in SY 2010–11 to 2.5% in SY 2015–16.
- Progress has been made not only with housed students, but also with homeless students, whose suspension rate was nearly cut in half over the six-year period (5.8% to 3.2%).
- Students living in shelter saw the greatest percentage-point decline over the six years (three points compared to a one-point decline for doubled-up students and a two-point decline among housed students).
- While the suspension rate of students in shelter declined, the gap persisted. Students living in shelter had twice the suspension rate of any other housing status (4.9% to 2.0% for doubled-up students and 2.4% for housed students).
Changes in Suspension Rates
SY 2010–11 to SY 2015–16
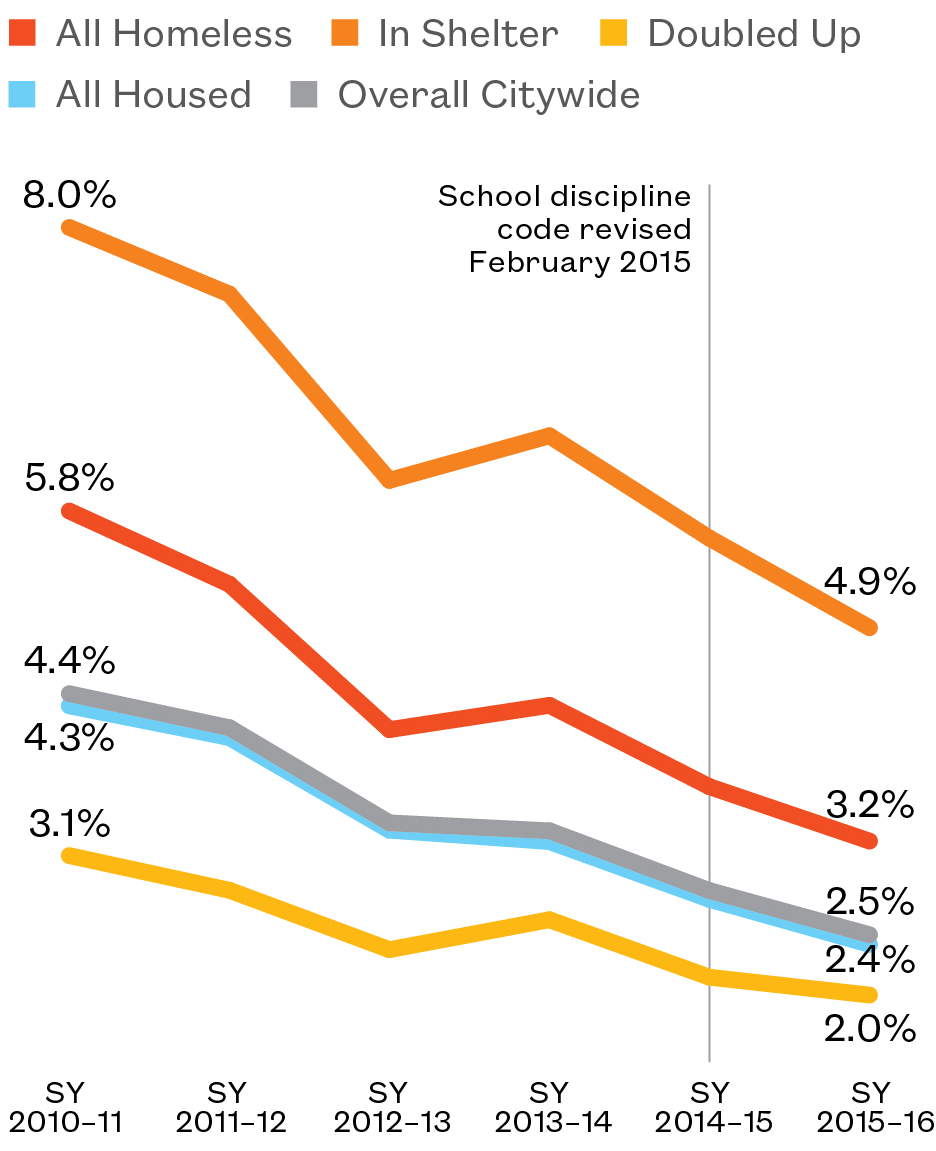
Note: The school discipline code was revised in February 2015. Revisions included requiring that principals have approval for out-of-school suspensions and restriction of reasons for out-of-school suspensions.
- Homeless students in middle school had the widest disparity in suspension rate between themselves and their housed classmates. While 6.9% of homeless middle schoolers were suspended, just 4.0% of housed students received suspensions in SY 2015–16.
- Students living in shelter had the highest suspension rates across middle and high school, with one in ten middle and high school students in shelter (10.2% and 10.0%) receiving a suspension in SY 2015–16.
- Other homeless students who were not living doubled up or in shelter also had high suspension rates, similar to sheltered students overall, with 10.1% of middle schoolers and 8.5% of high school students receiving a suspension in SY 2015–16.
Suspension Rates, by Where Homeless Students Sleep
Percent of Students Who Were Suspended
SY 2015–16
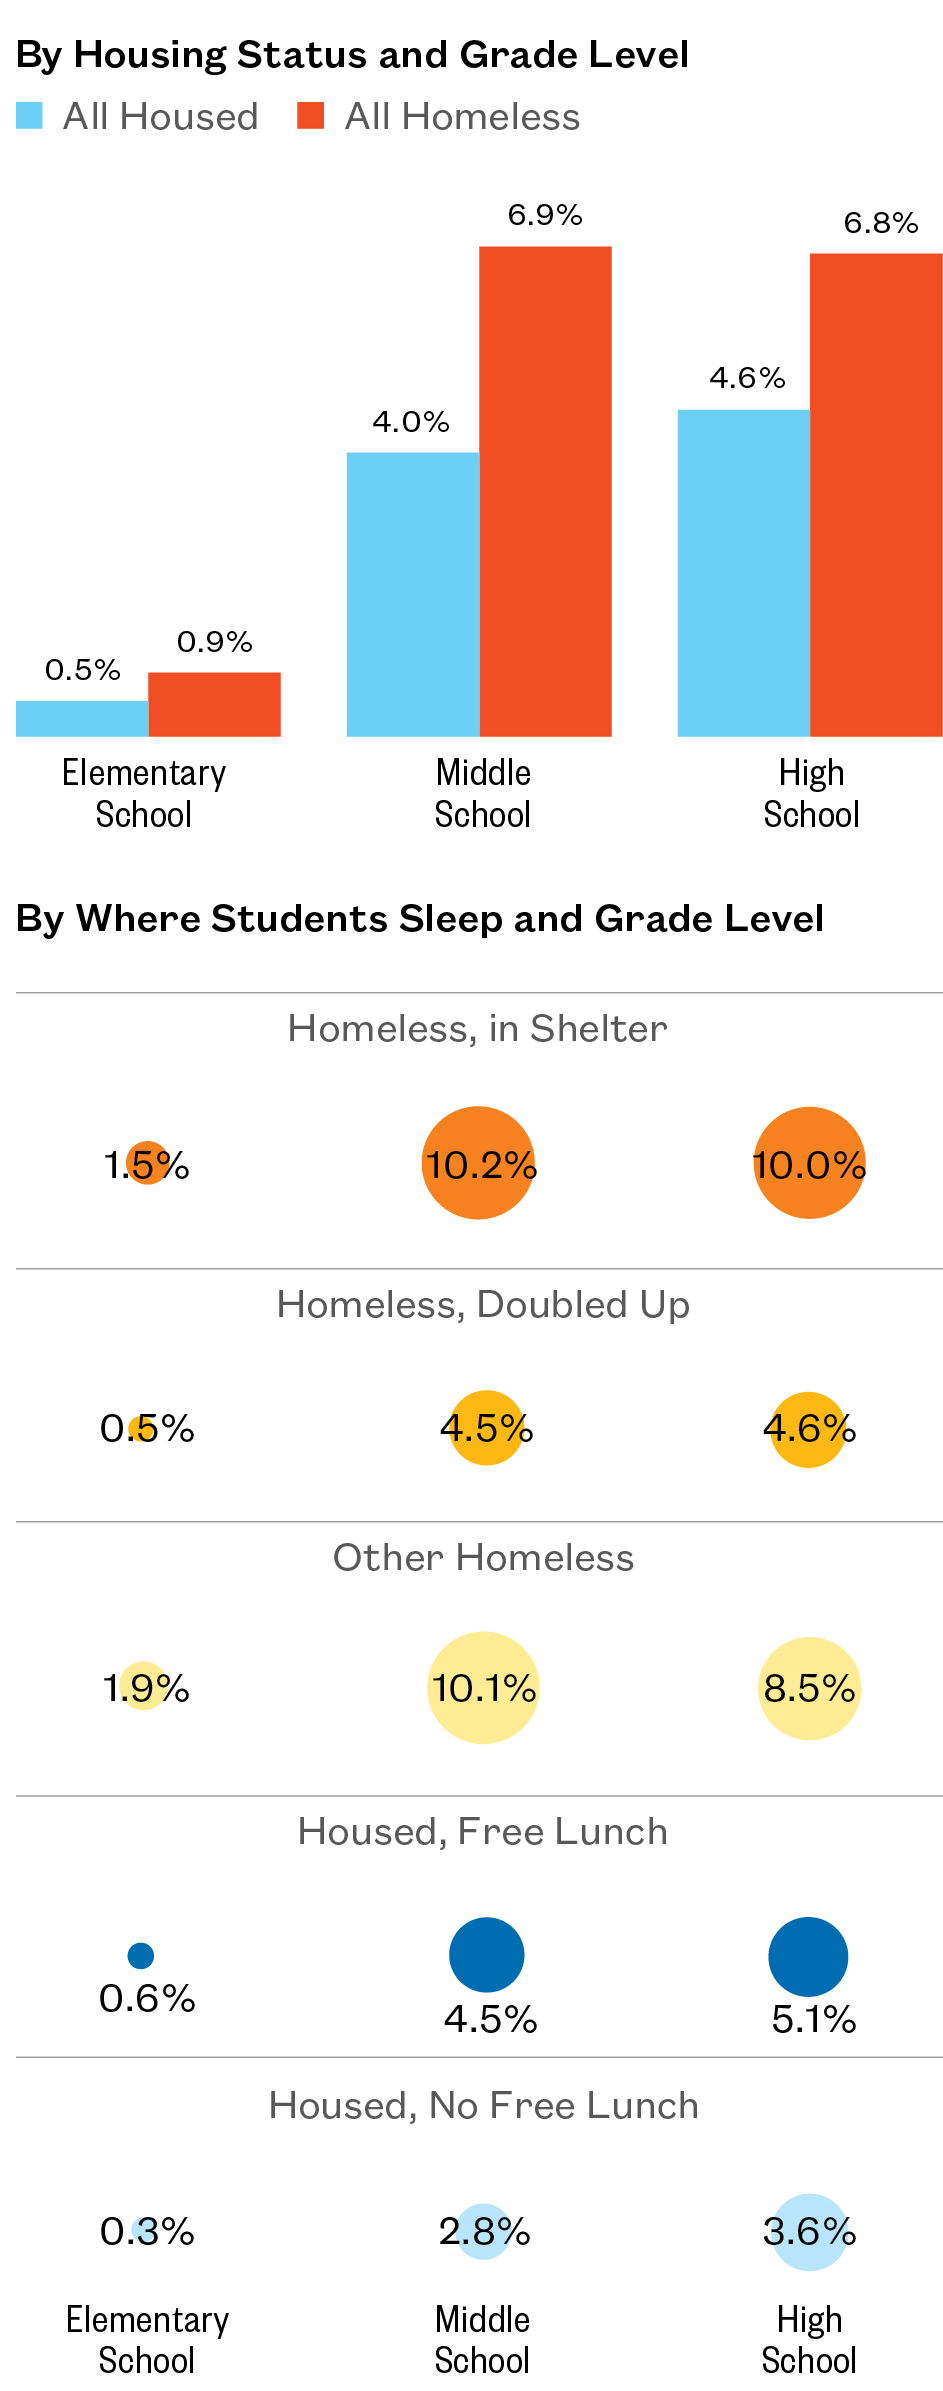
Note: “Other Homeless” includes students who were awaiting foster care, paying for a hotel/motel outside of the shelter system, or living in another temporary and/or unsuitable housing situation.
Geographic Patterns of Suspensions
The Intersection of Homelessness and Suspensions
Suspension Rate for Homeless Students
SY 2015–16
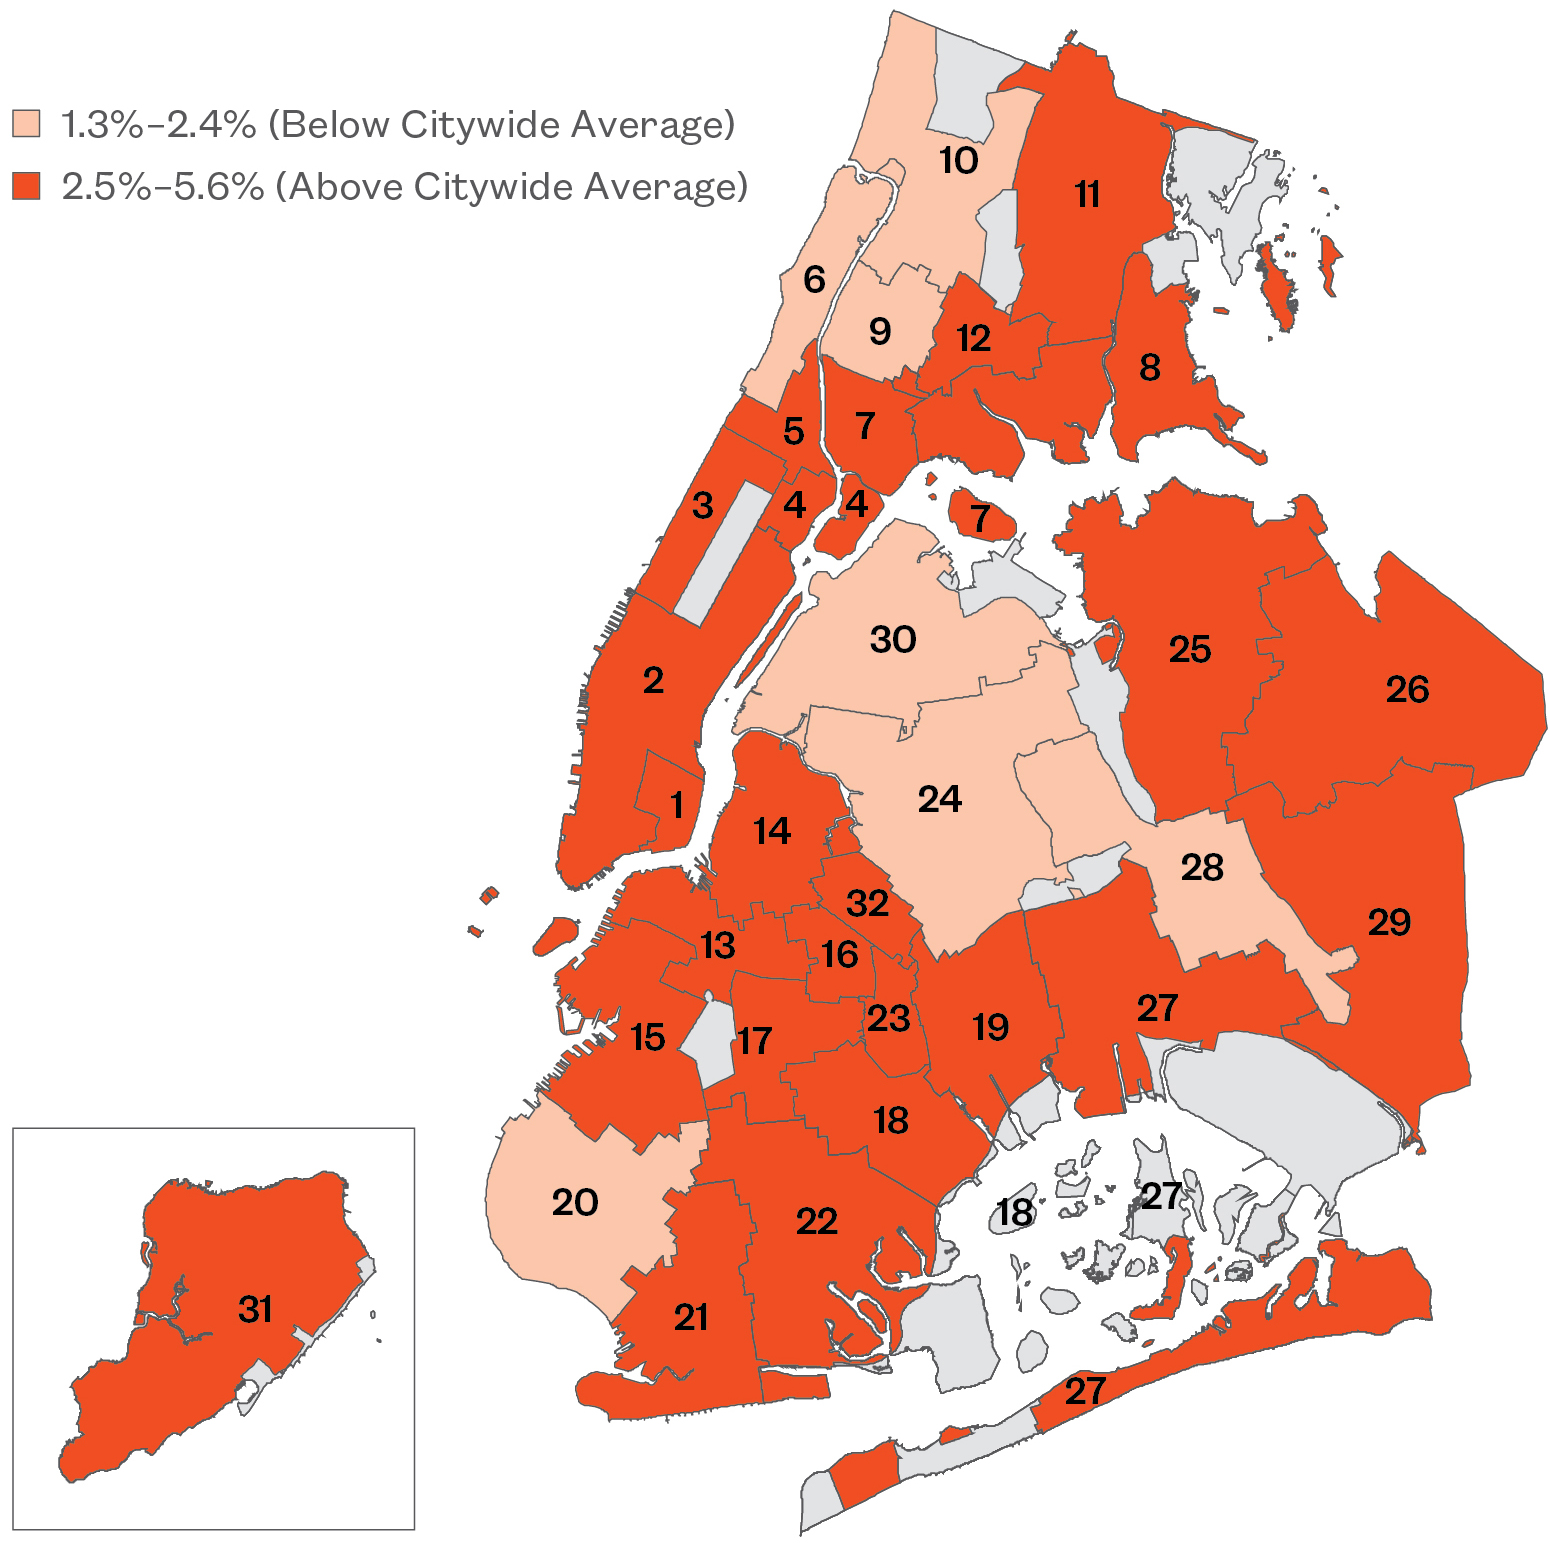
Note: Data are by school district for SY 2015–16 and do not include schools in non-geographic districts. Students were counted at their final school of enrollment for SY 2015–16.
Explore Districts at bit.ly/StudentAtlasApp.
- Citywide, 3.2% of students experiencing homelessness received suspensions in SY 2015–16. By district, homeless students’ risk of suspension varied from a low of 1.3% in Bay Ridge to a high of 5.6% in Williamsburg. (Districts 20 and 14)
- In Staten Island, 5.1% of homeless students were suspended, nearly twice the suspension rate of homeless students living in Queens (2.6%).
- In almost every City school district, students in shelter were suspended at a higher rate than both their housed and doubled-up peers. The suspension rate for students in shelter was highest at 10.8% in Flushing, Queens. (District 25)
- In all but seven City school districts located in Upper Manhattan, the west Bronx, southern Brooklyn, and west Queens, the suspension rate of homeless students exceeded the citywide average of 2.5%. (Districts 6, 9, 10, 20, 24, 28, and 30)
Suspension Rate
SY 2015–16
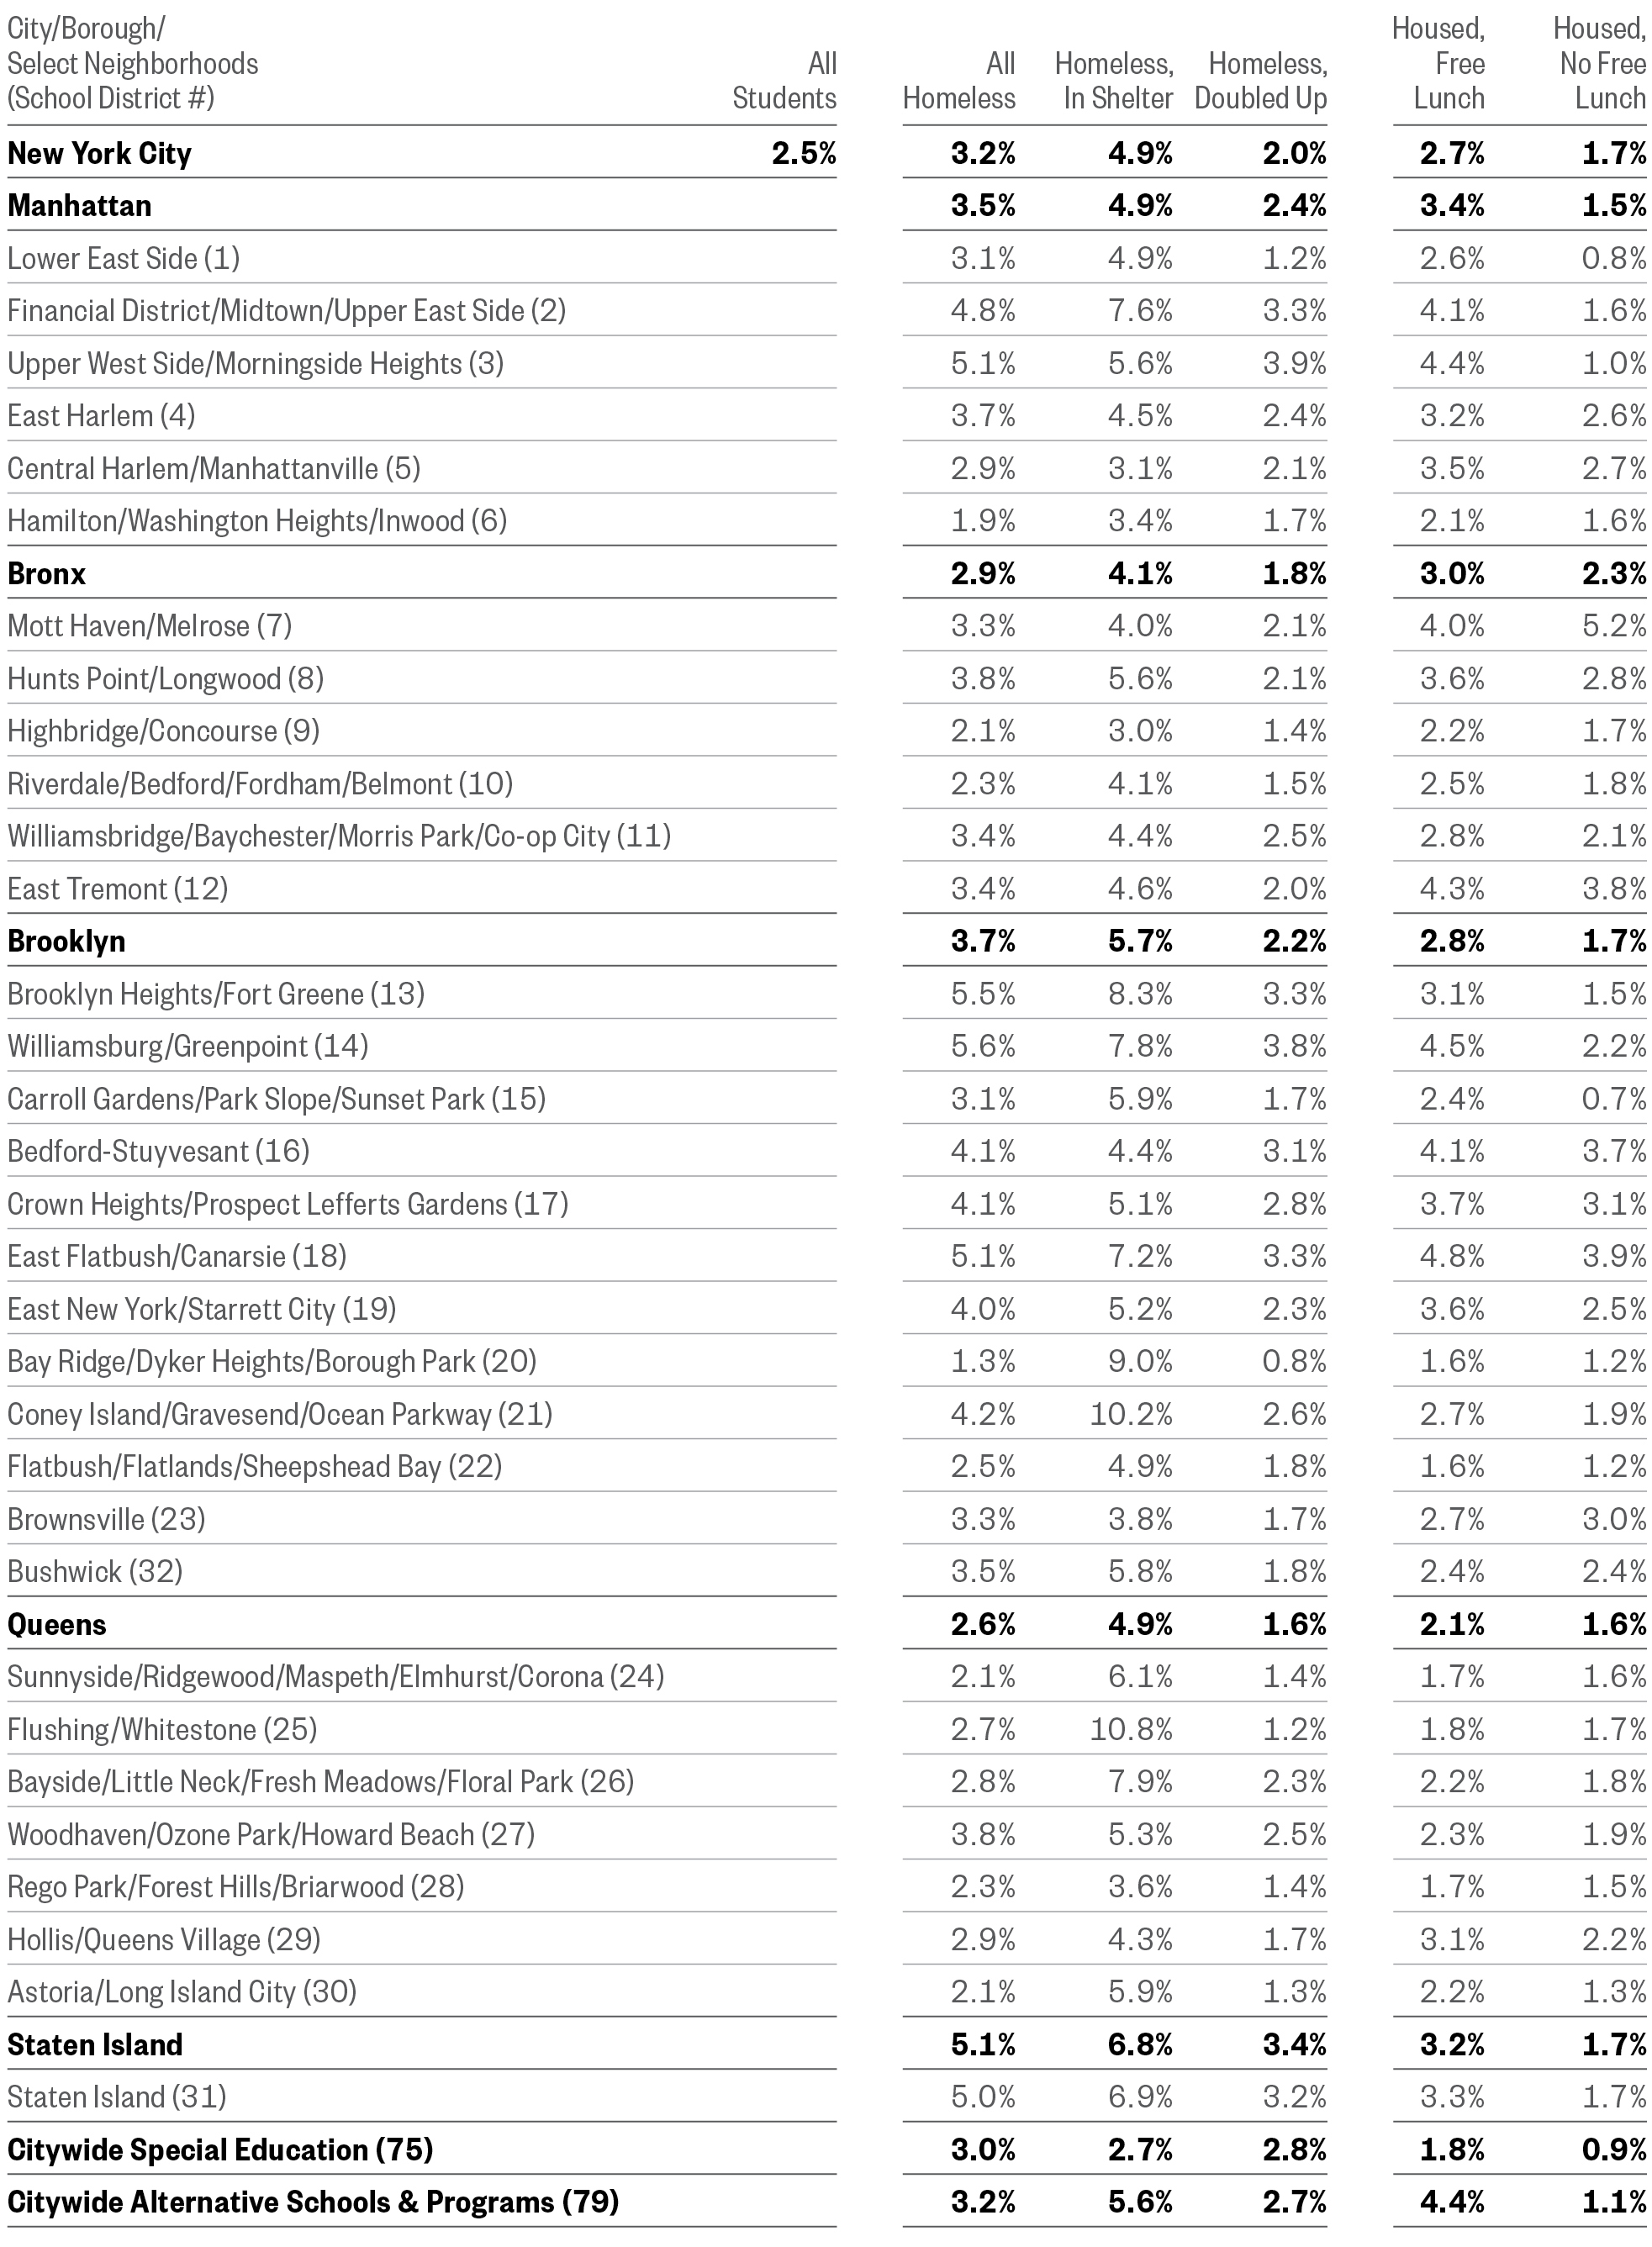
Note: Data by school district do not include schools in non-geographic districts, so borough and district total percentages may differ. Ns of fewer than 30 students were redacted.
- At the ten schools with the highest suspension rates for homeless students, an average of 29% of homeless students were suspended and 18% of housed students—compared to a citywide average of 2.5%.
- At the Brooklyn School for Music and Theatre, the Frederick Douglass Academy II Secondary School in Manhattan, and the Brooklyn High School for Law and Technology, more than one-third of homeless students received a suspension in SY 2015–16. (Districts 17, 3, and 16 respectively)
Amidst the City’s successful efforts to reduce suspensions in recent years, disproportionately high suspension rates in some schools remain. Targeting school-wide behavioral supports could reduce the number of disciplinary actions in some of the City’s highest-risk schools.
Top 10 Schools for Highest Homeless Student Suspension Rate
SY 2015–16
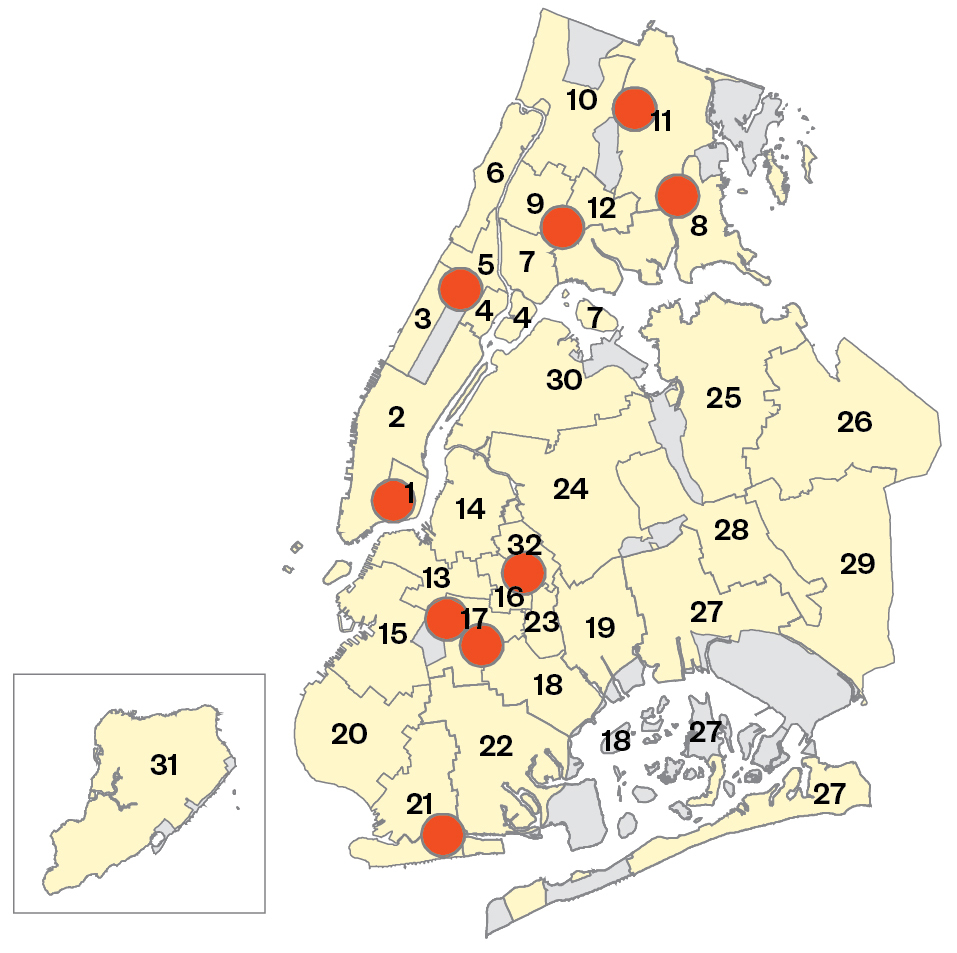
Note: Data are by school district for SY 2015–16 and do not include schools in non-geographic districts. Students were counted at their final school of enrollment for SY 2015–16.
See schools at bit.ly/MapNYCHomelessStudents
Top 10 Schools for Highest Homeless Student Suspension Rate
SY 2015–16
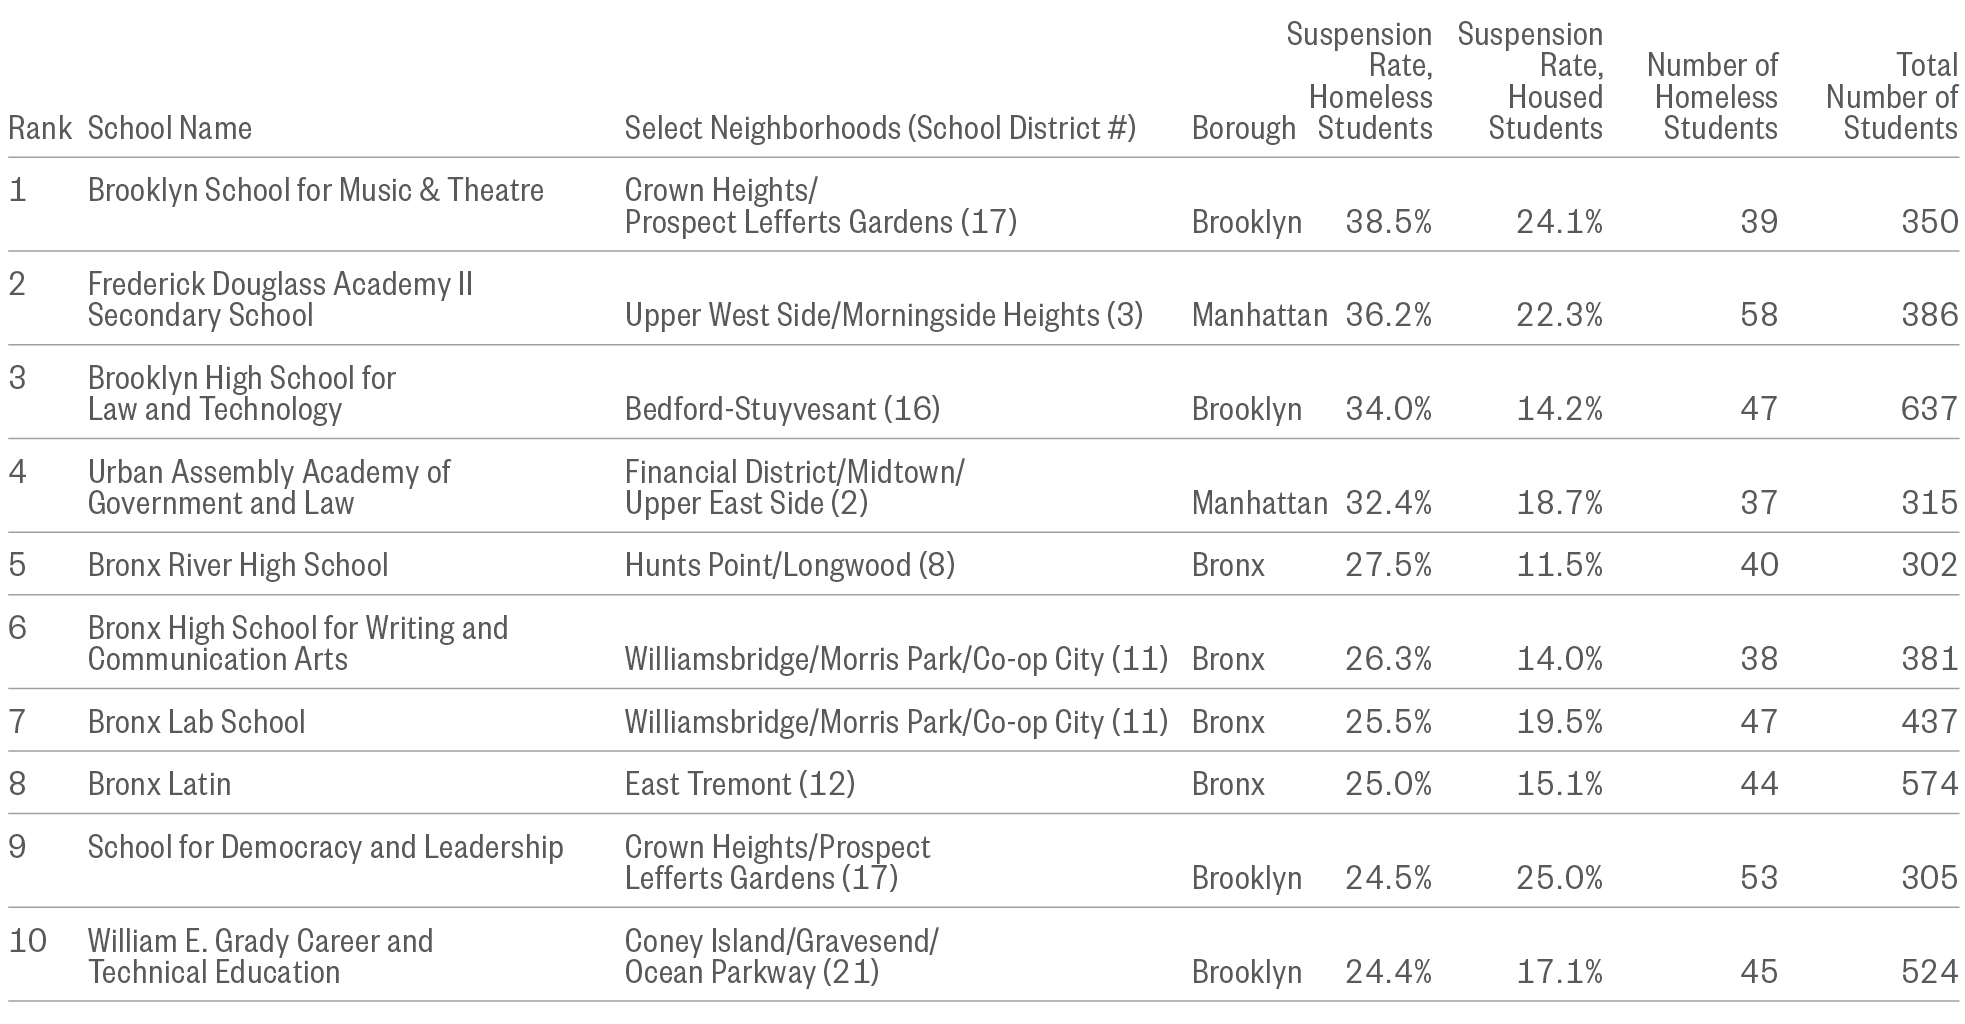
Download Section 5 PDF
To explore homelessness in New York City schools, try our interactive map.
To learn more about the educational outcomes of homeless New York city students, try our Student Atlas app.
Return to top.
Section 6
High School Outcomes of Homeless Students: Dropout and Graduation Rates
If I stick to my education, I can stop the in-and-out cycle of my family going in and out of homelessness. One of the big things for me was seeing that so many kids were graduating from high school and were going to college with scholarships. They were getting acknowledgement from the mayor and the congressman, kids who were black and brown. It reinforced to me that I could be next.
—College student, former participant in NYC Department of Education Students in Temporary Housing (STH) Unit supportive program
The sleep and having to get adjusted to other people’s schedules makes things a lot harder. … With school I had lived in the Bronx, but I was staying at my friend’s in Harlem, and I just didn’t want to wake up in time for school. My friend’s mom is not waking me up. I started lacking motivation. It’s kind of depressing. Even having a friend you want to bring over, I mean, where do you bring them?
—Graduate, Class of 2013, former participant in NYC Department of Education Students in Temporary Housing (STH) Unit supportive program
My youngest sister is asking me about college programs. From an early age it gets them interested to know that they can be that college student too, and that’s a great place to start. I was left back in the 6th grade. With all the moving, I missed the State math exam. So I went to summer school, but we moved into an apartment so I missed the exam again. Now my sibling looks at it and she knows that just being left back doesn’t mean that she can’t achieve.”
—20-year-old college student, former participant in NYC Department of Education Students in Temporary Housing (STH) Unit supportive program
High school graduation is a key marker of educational achievement and opportunity. However, experiences of homelessness place students’ school stability at risk—especially when they are recently homeless or have exited homelessness to permanent housing. For high schoolers with a history of homelessness, this too often means that they do not graduate. Adults with a high school diploma have more access to employment opportunities, are more likely to stay out of prison, and ultimately have greater life satisfaction than those who drop out of school. Closing these gaps is key to ensuring that students’ housing status does not hinder their future opportunities.
What’s New?
- Ninety percent (90%) of homeless students who were chronically absent at some point during middle school were also chronically absent during high school, placing them at a greater risk of dropping out.
- Middle school proficiency is a strong predictor of dropping out of high school. Overall, 16% of those who did not score proficient on State achievement tests ended up dropping out compared to 4% of students who did score proficient. For homeless students, this is an even stronger predictor. One in four (24%) homeless students who did not score proficient dropped out of high school.
Policy Considerations
- Identifying homeless students who are at risk of dropping out of high school by ninth grade or earlier and connecting students with attendance and other supportive services could increase their chance of graduating.
- All students who have been homeless do not face the same educational risk. Homeless students who were not chronically absent saw graduation outcomes similar to the citywide average, regardless of the type of housing setting they were living in. Addressing attendance challenges among high school students with a history of homelessness is critical in order to raise their graduation rates.
The Dropout and Graduation Gap
- New York City’s dropout rate improved slightly from 9.0% for the class of 2015 to 8.5% for the class of 2016, but the achievement gap between homeless and housed students persisted.
- Homeless students dropped out of high school at two times the rate of low-income housed students and over three times the rate of non-low-income housed students (17% to 8% and 6%).
- Homeless students did not all face the same risk for dropping out of high school. High schoolers who lived in shelter throughout or for some portion of high school dropped out at a lower rate than those who lived in other temporary non-shelter arrangements (13% to 23%).
- Transitions into and out of housing— both becoming homeless and exiting homelessness to permanent housing— have a negative effect on all homeless students. High schoolers with no transitions dropped out at lower rates: 7% of students who remained in shelters throughout high school dropped out while 16% of students who entered or exited the shelter system dropped out. A similar pattern existed for homeless students in other temporary settings, with housing transitions increasing dropout rates by about 50% (17% to 25%).
When students undergo transitions— whether becoming homeless or exiting homelessness—the instability faced at home places their academics at risk. These are critical times to support students so they can maintain attendance and school stability.
Four-Year Dropout Rate
Percent of Students Who Dropped Out of High School
Class of 2016
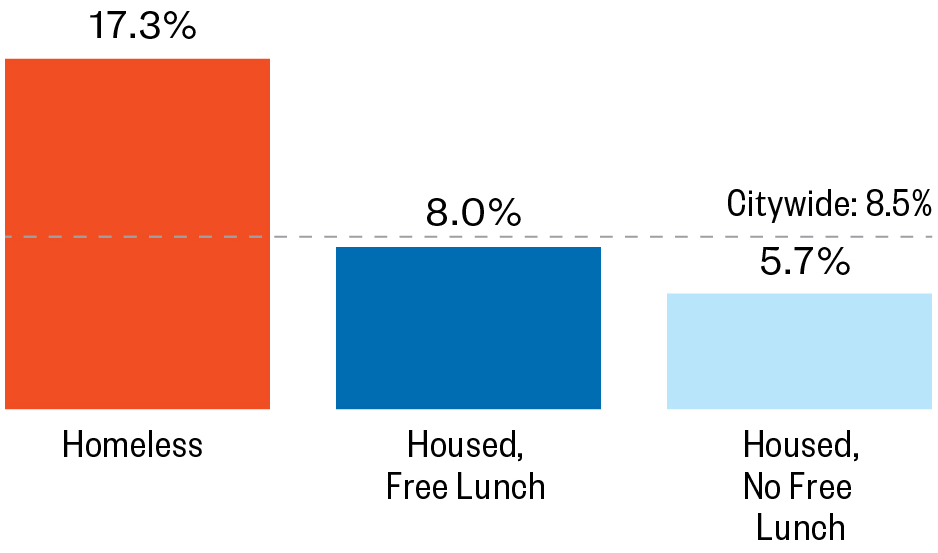
Note: Students are categorized according to whether they experienced homelessness or were eligible for free lunch at any point during their high school education (SY 2012–13 to SY 2015–16).
Four-Year Dropout Rate, by Housing Transitions and Housing Status
Percent of Students Who Dropped Out of High School
Class of 2016
![]()
Note: Students are categorized according to whether they experienced homelessness, lived in a shelter or other temporary arrangement, or had a housing transition at any point during their high school education (SY 2012–13 to SY 2015–16). “Housing Transition” refers to a student transitioning into or out of permanent housing at some point during high school.
- In New York City schools, there has been a tremendous increase in the four-year graduation rate from less than half of students graduating in 2005 to almost three-quarters in 2016. However, gaps by housing status remain.
- Over half (55%) of homeless students graduated from high school compared to 73% of low-income housed students and 84% of housed students who were not low income.
- While homeless students overall graduated at a lower rate than housed students, this differed by type of homelessness. Those who lived in shelters during high school graduated at a higher rate than students who were homeless living in other non-shelter temporary arrangements (65% to 45%).
- For all homeless students, transitions into or out of homelessness had a negative effect on graduation rates. High schoolers who remained in the shelter system throughout all four years of high school graduated at a rate of 70%— slightly lower than the citywide average— while 62% of those who entered or exited the shelter system graduated. Graduation rates for homeless students who lived in other temporary settings followed the same pattern, with students who transitioned housing graduating at a lower rate than students without a housing transition (43% to 49%).
Identifying supports that exist for high school students in shelters and replicating those supports for homeless students not living in shelter could improve school stability and raise graduation rates for this vulnerable group.
Four-Year Graduation Rate
Percent of Students Who Graduated from High School
Class of 2016
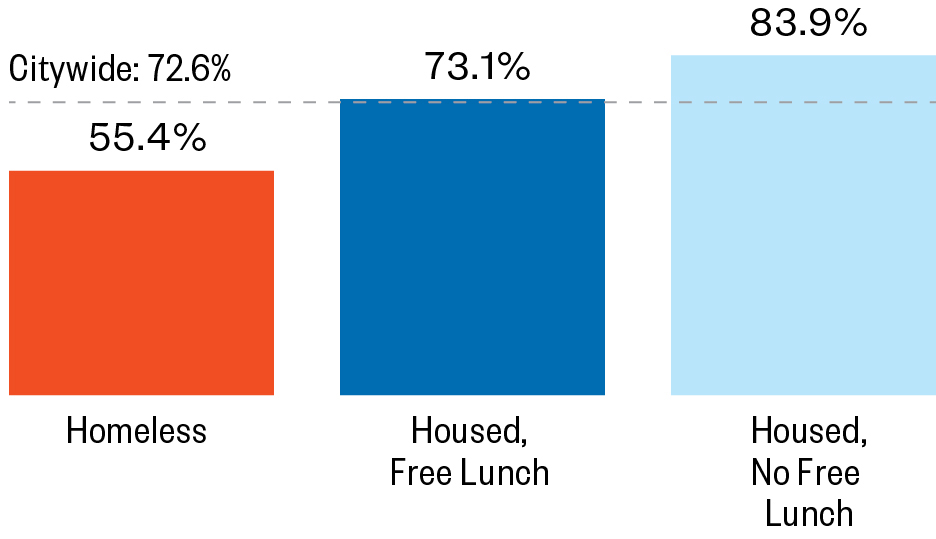
Note: Students are categorized according to whether they experienced homelessness or were eligible for free lunch at any point during their high school education (SY 2012–13 to SY 2015–16).
Four-Year Graduation Rate, by Housing Transitions and Housing Status
Percent of Students Who Graduated from High School
Class of 2016
![]()
Note: Students are categorized according to whether they experienced homelessness, lived in a shelter or other temporary arrangement, or had a housing transition at any point during their high school education (SY 2012–13 to SY 2015–16). “Housing Transition” refers to a student transitioning into or out of permanent housing at some point during high school.
Instability and Graduation
- Being homeless by itself does not increase a student’s risk of dropping out of high school. Among homeless students who experienced no instability factors during their four years of high school—including chronic absenteeism, transitioning housing, and transferring school mid-year—less than 1% dropped out of high school. This was true for both students who had lived in shelter and those who had lived in other temporary arrangements.
- Housing and school transitions among students who are not chronically absent do not greatly affect homeless students’ dropout rates. Between 4%–6% of homeless students who underwent a housing transition or school transfer without becoming chronically absent during high school dropped out.
- Students who underwent housing and school transitions were far more likely to drop out if they were also chronically absent. Among homeless students who experienced these three instability factors, over one-quarter (28%) of students in shelter dropped out and more than one in three (36%) students who were homeless living in other non-shelter temporary arrangements dropped out.
Four-Year Dropout Rates, by Instability Factors and Housing Status
Percent of Students Who Dropped Out of High School
Class of 2016
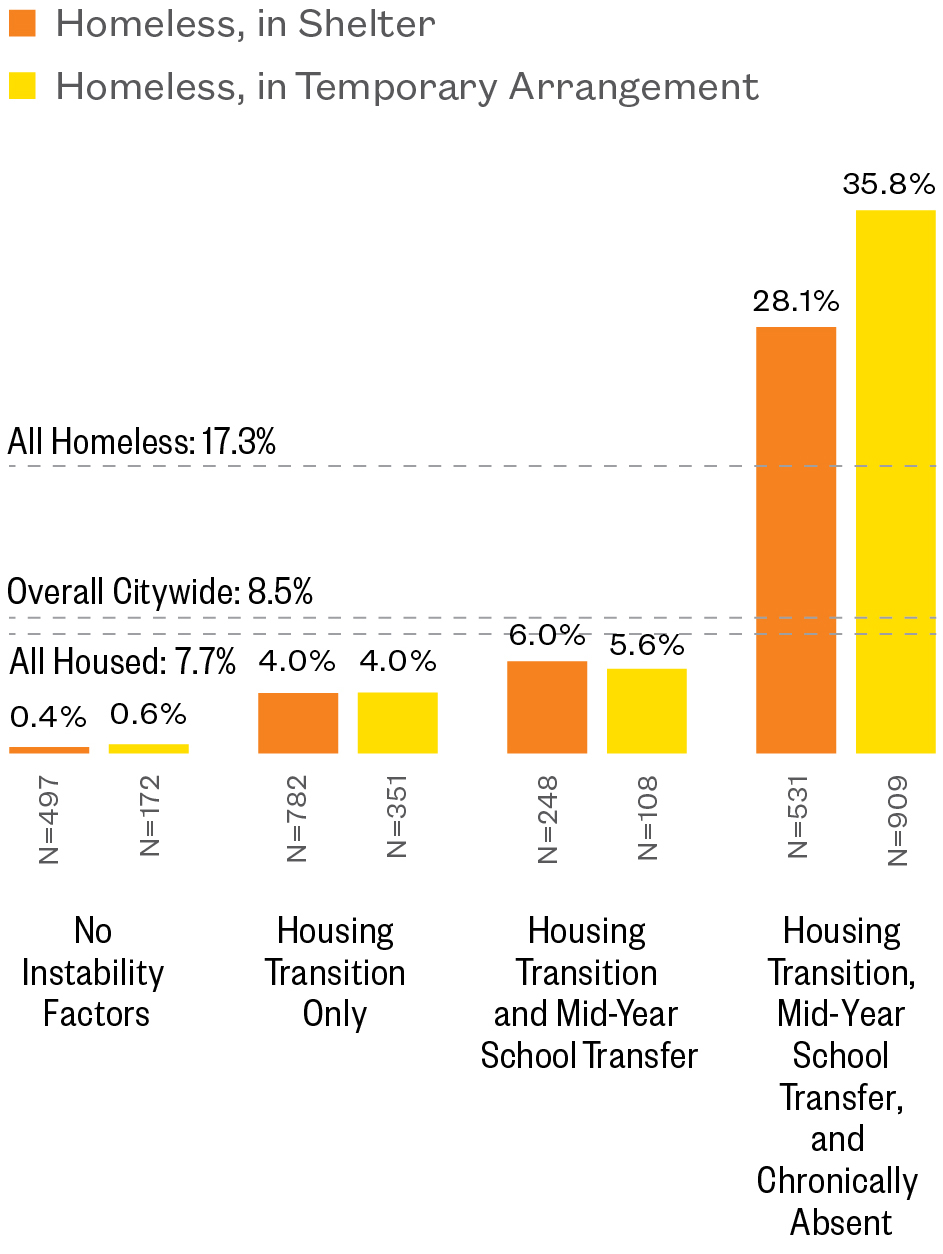
Note: Students are categorized according to whether they experienced homelessness, lived in a shelter or other temporary arrangement, or had a housing transition at any point during their high school education (SY 2012–13 to SY 2015–16). “Temporary Arrangement” refers to students living in non-shelter homeless settings at some point during high school, including doubled up or other temporary situations. “Housing Transition” refers to a student transitioning into or out of permanent housing at some point during high school. “Chronically Absent” refers to whether or not a student was ever chronically absent during high school.
- The graduation patterns of homeless students followed similar trends to their dropout rates. Homeless students who were not chronically absent during high school graduated at higher rates than the citywide average (74%–94% to 73% citywide), while homeless students who were chronically absent at some point graduated at roughly one-third to one-fourth the rate of their homeless peers (21%–26%). Preventing chronic absenteeism among all homeless students, including those who live in shelters and other temporary settings, is critical to further improving educational outcomes and closing the graduation gap for homeless students.
Preventing chronic absenteeism among all homeless students, including those who live in shelters and other temporary settings, is critical to further improving educational outcomes and closing the graduation gap for homeless students.
Four-Year Graduation Rates, by Instability Factors and Housing Status
Percent of Students Who Graduated from High School
Class of 2016
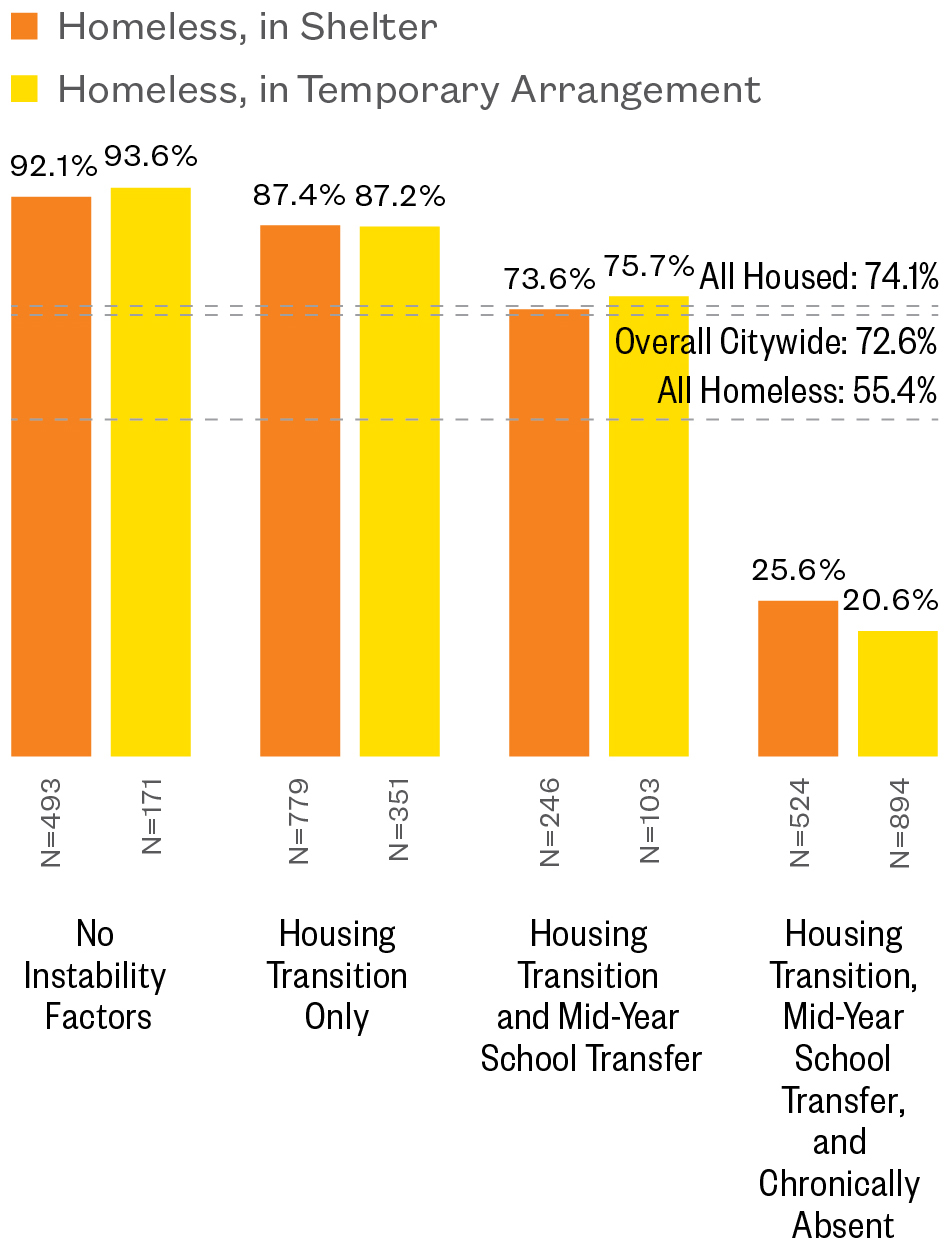
Note: Students are categorized according to whether they experienced instability factors at any point during the previous four school years. “Temporary Arrangement” refers to students living in non-shelter homeless settings at some point during high school, including doubled up or other temporary situations. “Housing Transition” refers to a student transitioning into or out of permanent housing at some point during high school. “Chronically Absent” refers to whether or not a student was ever chronically absent during high school.
Middle School Risk Factors
- Ninety percent (90%) of homeless students who were chronically absent at some point during middle school were also chronically absent during high school, placing them at a greater risk of dropping out.
- Targeting attendance supports to this severely at-risk group of roughly 1,700 homeless students could start in ninth grade or earlier to improve their likelihood of graduating.
Being chronically absent at any point in high school dramatically increases students’ risk of dropping out without receiving a diploma. Identifying those who are most at risk for chronic absenteeism in high school is critical.
Risk of High School Chronic Absenteeism
Four-Year High School Chronic Absenteeism Rates, by Middle School Chronic Absenteeism and Housing Status Class of 2016
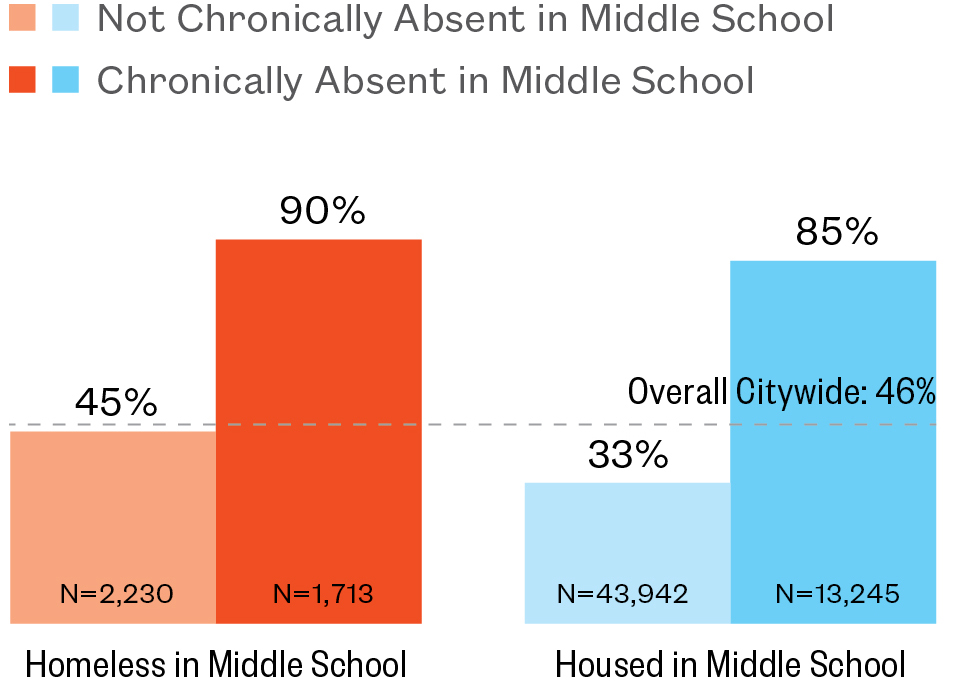
Overall High School Chronic Absenteeism Rates
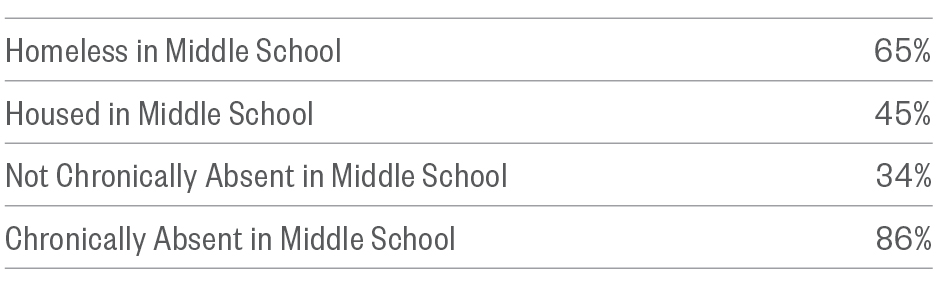
Note: Middle school data were available for the last two years of middle school only. Students were chronically absent if they missed 20 or more days of school in one year. “Homeless in middle school” refers to students who were homeless in one or both of the two years prior to entering high school.
Risk of Dropout: Middle School Proficiency
Four-Year High School Dropout Rates, by Middle School Proficiency and Housing Status
Class of 2016
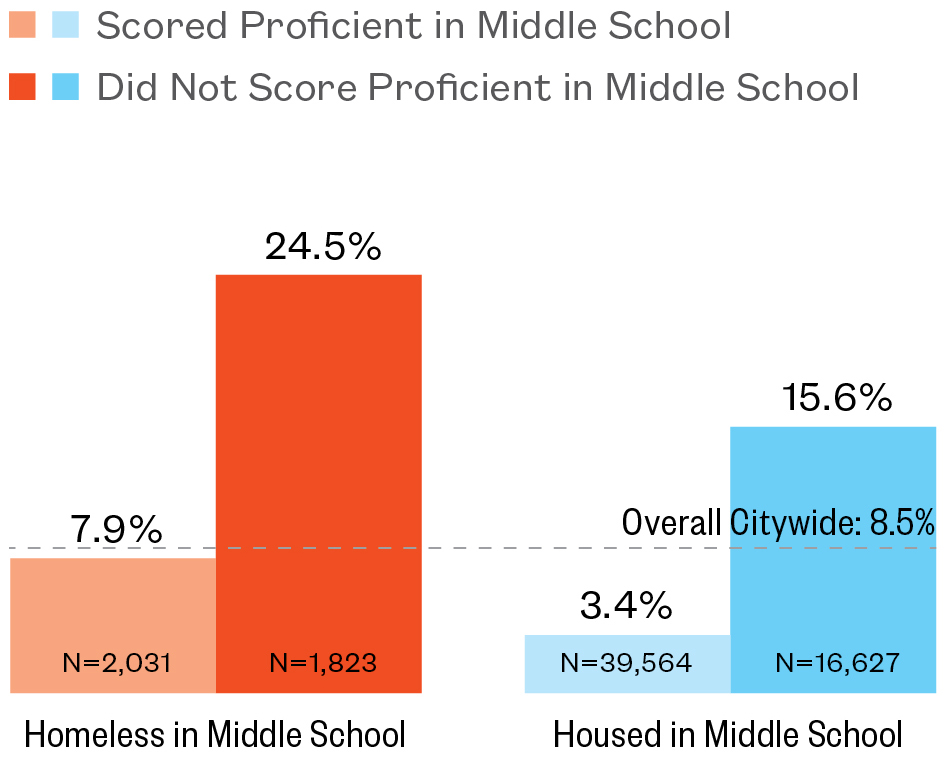
Overall Dropout Rates
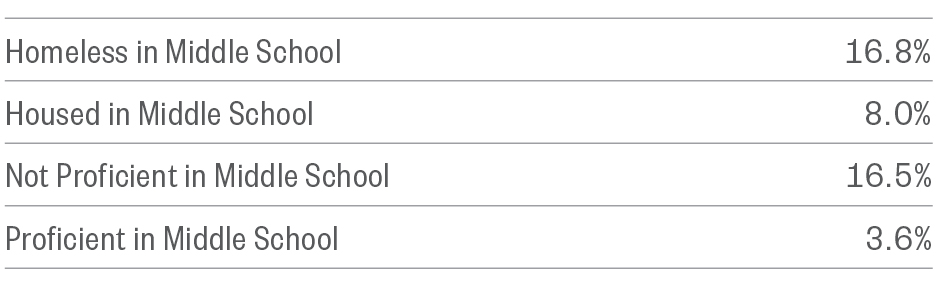
Risk of Dropout: Middle Chronic Absenteeism
Four-Year High School Dropout Rates, by Middle School Chronic Absenteeism and Housing Status
Class of 2016
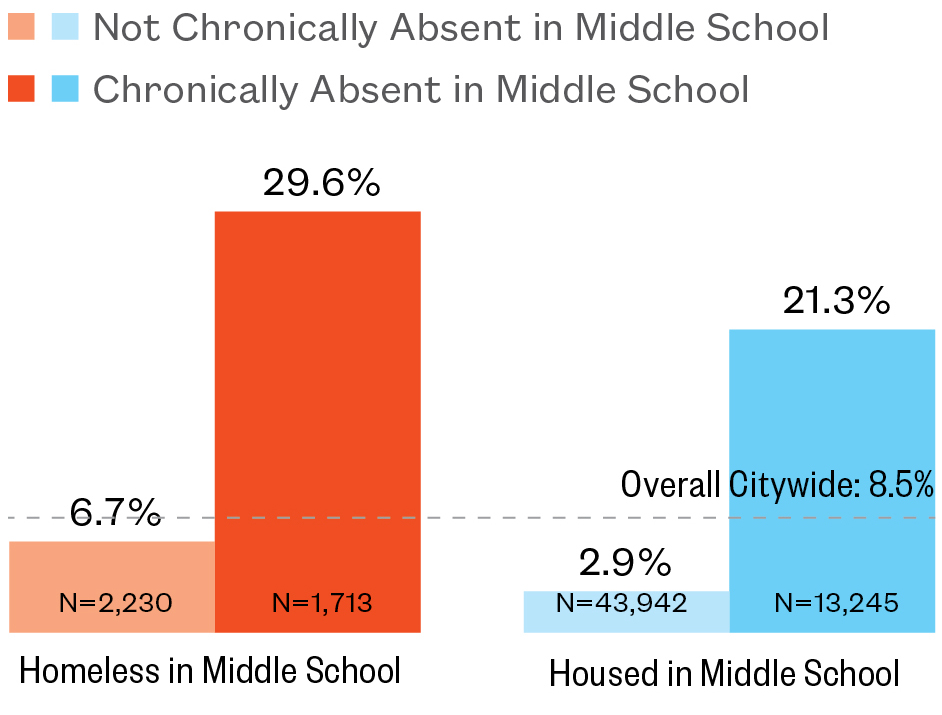
Overall Dropout Rates
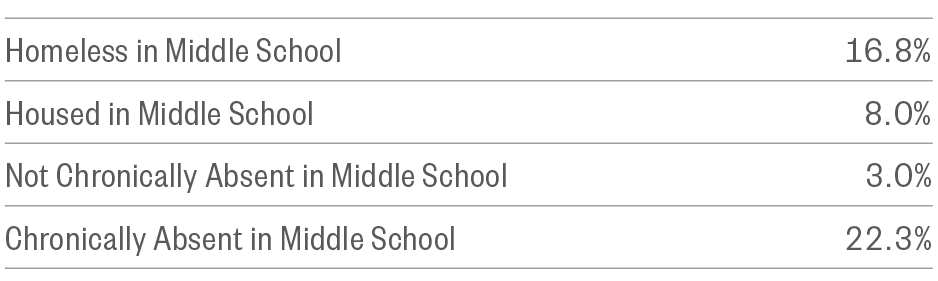
Note: Middle school data were available for the last two years of middle school only. Students were catagorized according to whether they scored proficient on either their math or English Language Arts State Assessment or were chronically absent (missing 20 or more days of school in one year) in the two years prior to entering high school. “Homeless in middle school” refers to students who were homeless in one or both of the two years prior to entering high school.
- Middle school proficiency is a strong predictor of dropping out of high school. Overall, 16% of those who were not proficient ended up dropping out compared to 4% of students who did score proficient. For homeless students, this is an even stronger predictor. One in four (24%) homeless students who did not score proficient dropped out of high school.
- A similar pattern exists when looking at the risk factor of students’ middle school chronic absenteeism. Twenty-two percent (22%) of all students who were chronically absent dropped out of high school; among homeless students, 30% who had been chronically absent dropped out.
Academic proficiency and absenteeism are two well-known predictors of high school graduation. Examining these risk factors for homeless students reveals potential opportunities for further targeting resources and improving graduation outcomes.
Geographic Patterns of Dropout and Graduation
Where Homeless Students Drop Out
Four-Year Dropout Rate Among Homeless Students
Class of 2016
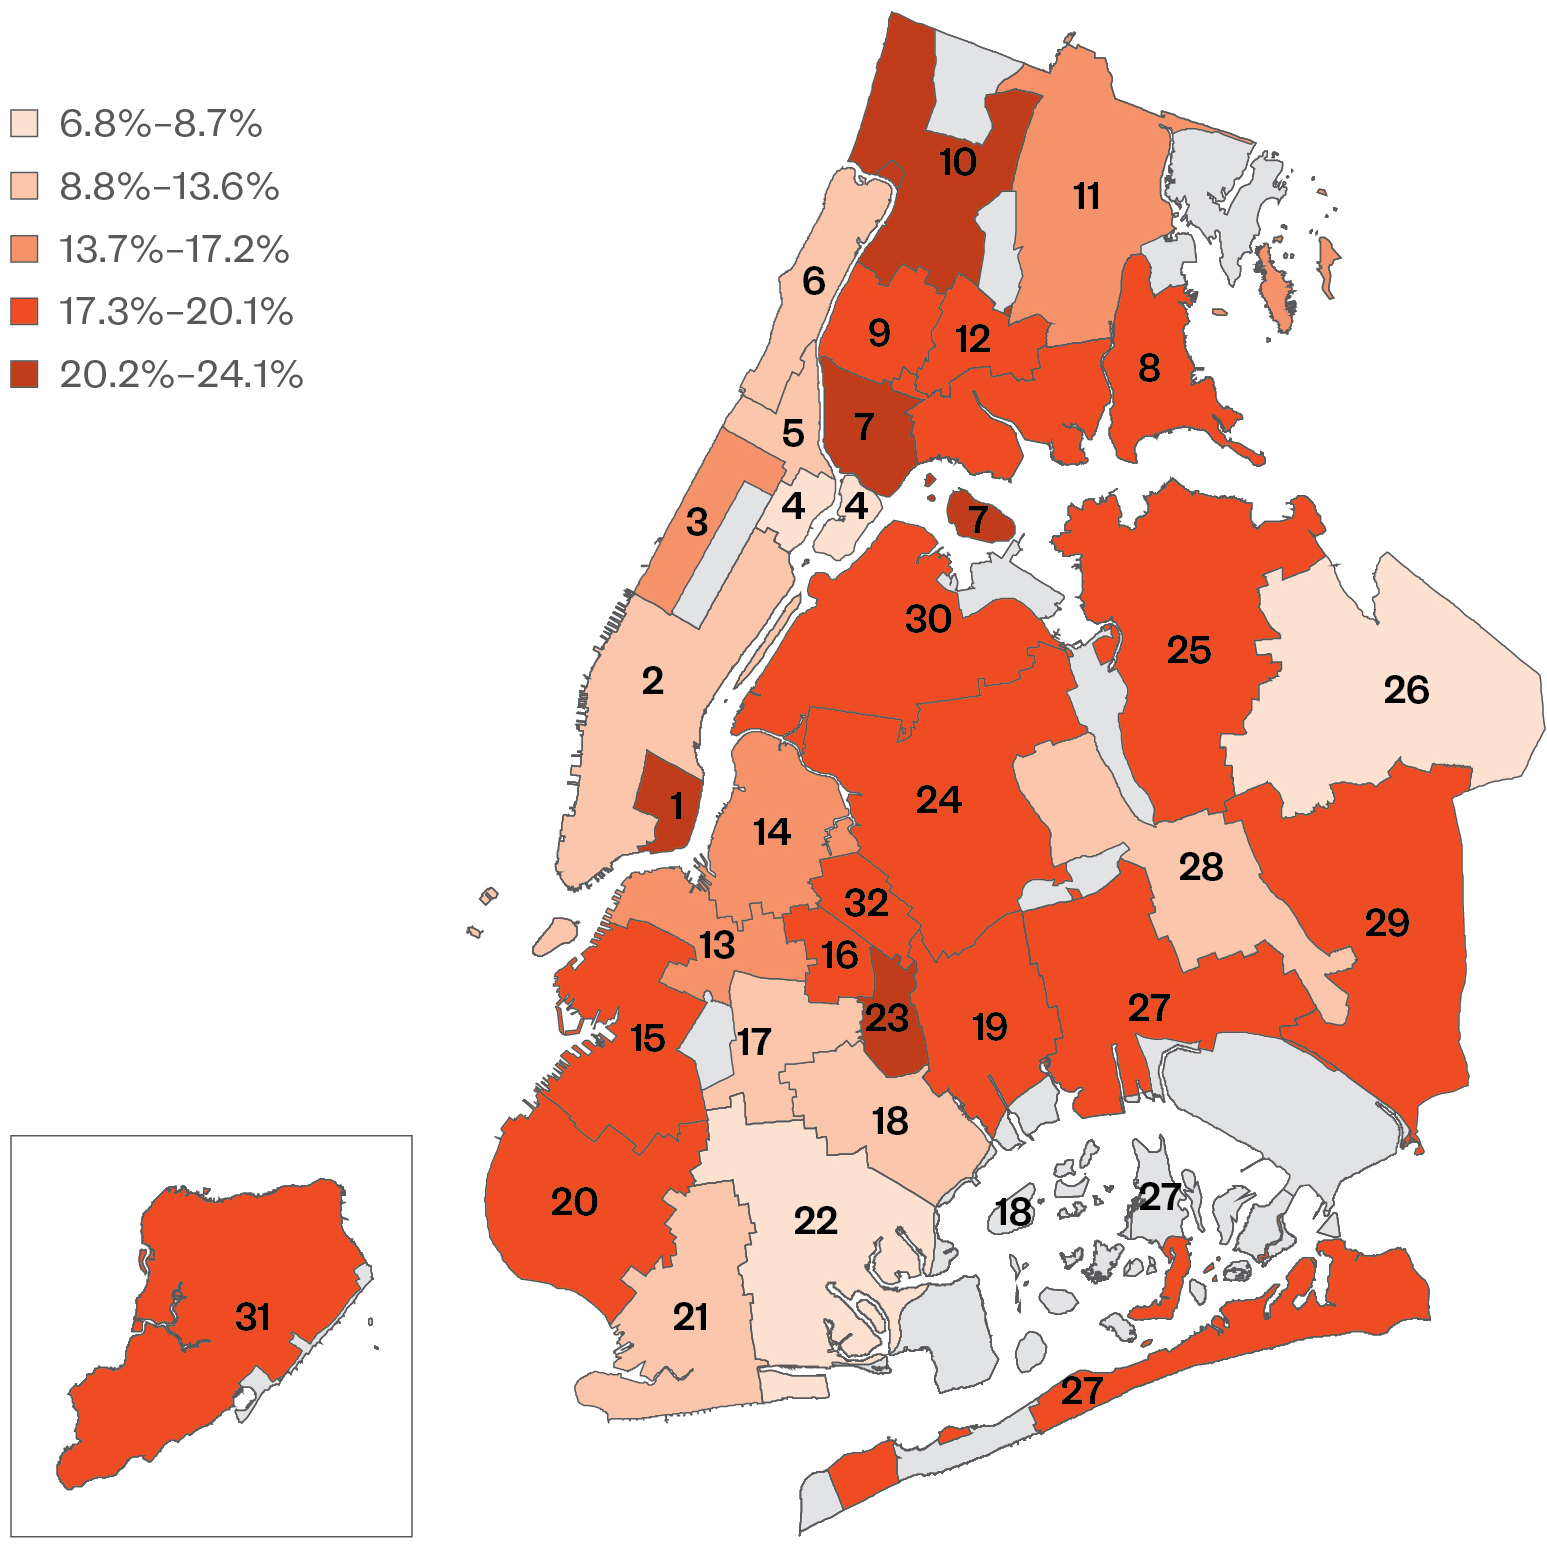
Note: Data are by school district and represent the four-year dropout rate for students who entered high school in 2012 and experienced homelessness at any point during their high school career. Data do not include schools in non-geographic districts.
Explore Districts at bit.ly/StudentAtlasApp.
- Citywide, homeless students dropped out of high school at over twice the rate of all students (17.3% to 8.5%). The dropout rate for homeless students varied from 6.8% in Flatbush, Brooklyn to 24.1% in Riverdale in the Bronx. (Districts 22 and 10)
- In five districts including the Lower East Side of Manhattan; Mott Haven, Riverdale/Bedford, and East Tremont in the Bronx; and Brownsville in Brooklyn, more than one in five homeless students dropped out. (Districts 1, 7, 10, 12, and 23)
- Homeless students were more likely to drop out than their housed peers in every City school district. The disparity was greatest in twelve school districts located across all five boroughs, where there was at least a ten-point dropout gap. (Districts 1, 3, 7, 10, 13, 15, 19, 20, 23, 24, 29, and 31)
- In Manhattan’s East Harlem, no students living in shelter dropped out of high school school. (District 4)
Graduation Rates Vary by District
Four-Year Graduation Rate of Homeless Students
Class of 2016
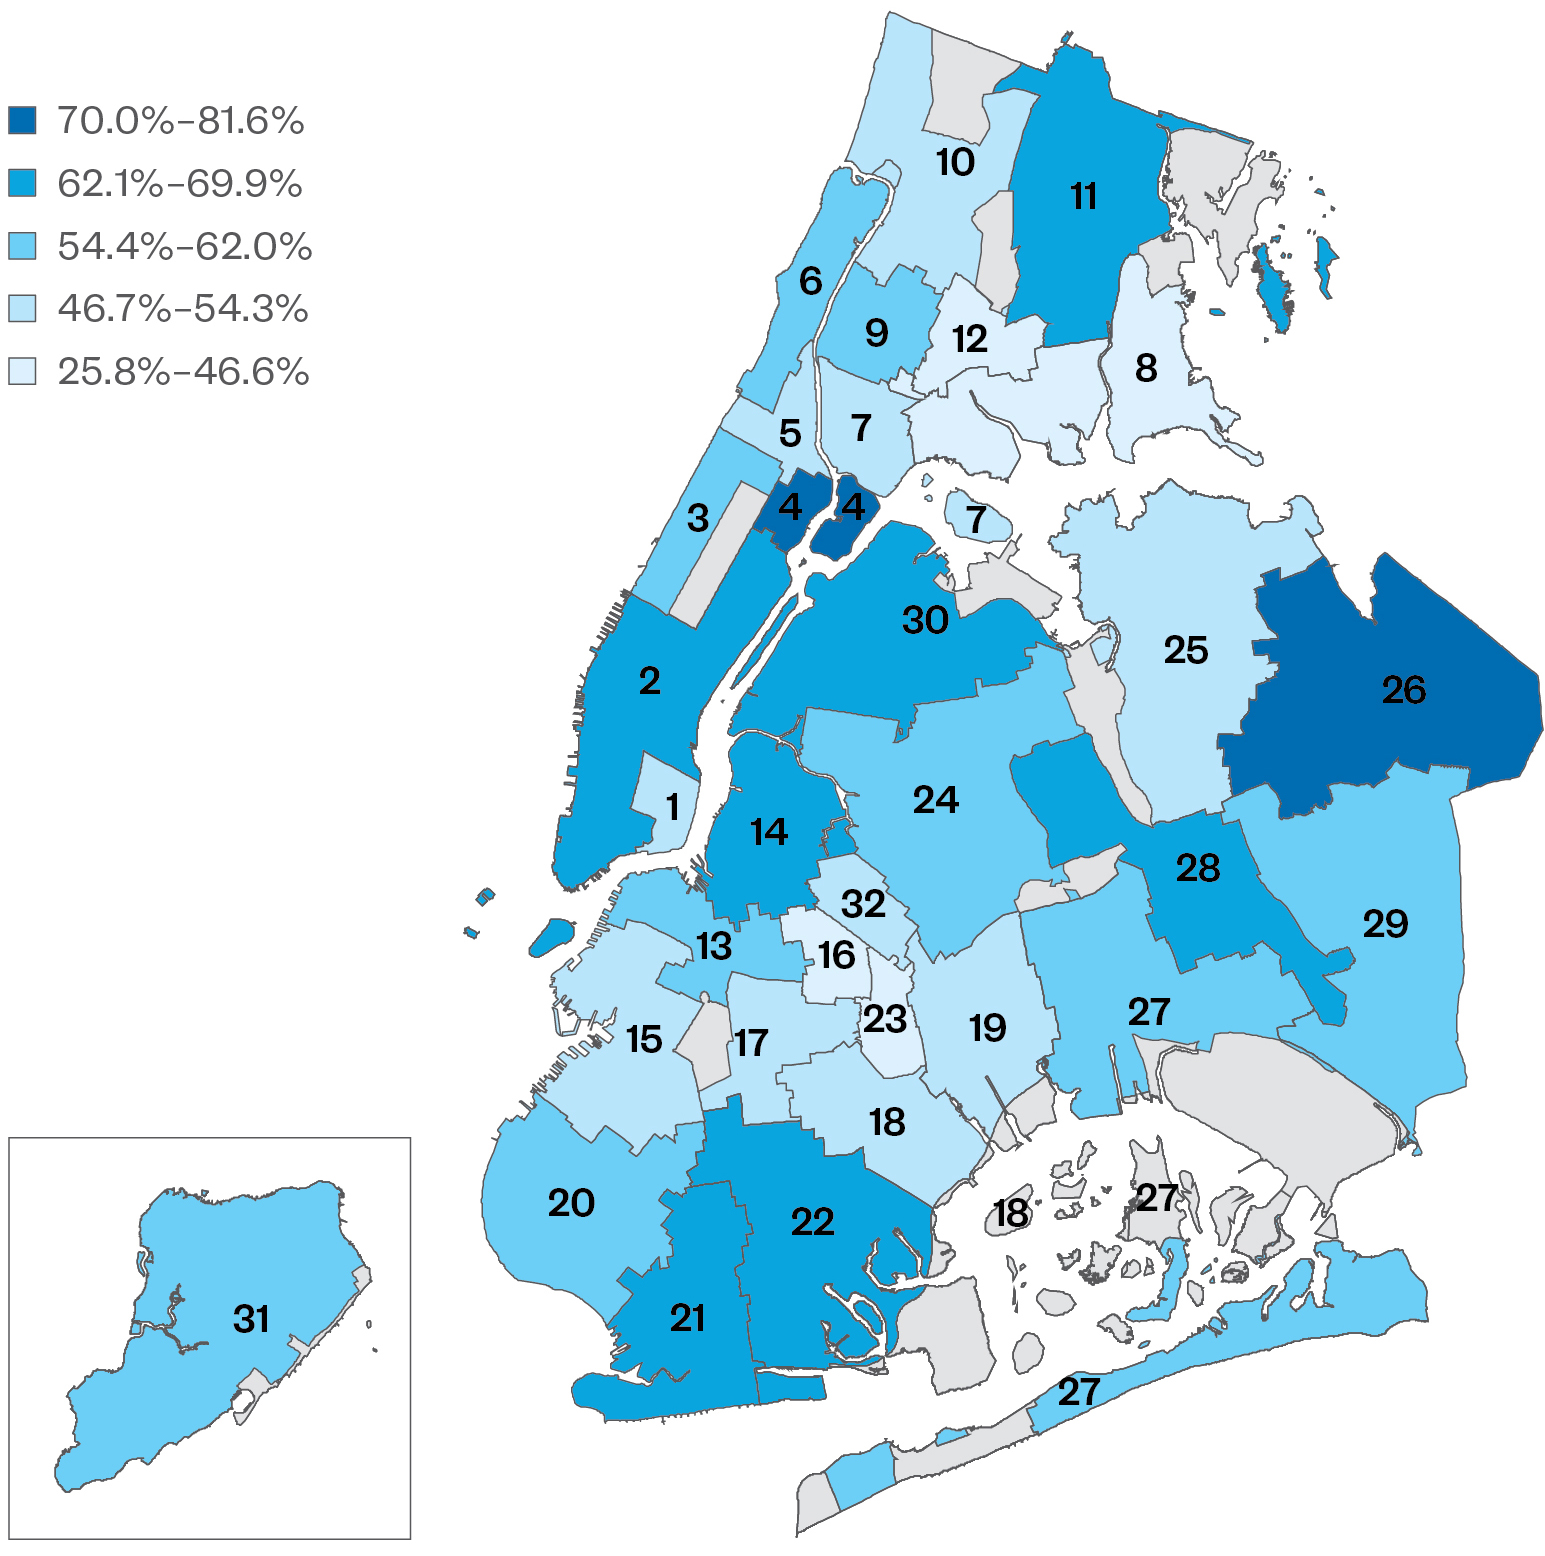
Note: Data are by school district and represent the four-year graduation rate for students who entered high school in 2012 and experienced homelessness at any point during their high school career. Data do not include schools in non-geographic districts.
Explore Districts at bit.ly/StudentAtlasApp.
- Citywide, 73% of all students and 55% of homeless students graduated high school. By City school district, graduation rates for homeless students ranged from roughly 26% in Brownsville in Brooklyn to over three times higher in Manhattan’s East Harlem (82%). (Districts 4 and 23)
- Homeless students attending school in Manhattan’s East Harlem and Bayside in Queens had the highest graduation rates citywide (82% and 79%). Meanwhile, in four districts located in the Bronx and Brooklyn, less than 46% of homeless students graduated. (Districts 4 and 26 and Districts 8, 12, 16, and 23)
- Homeless students living in a non-shelter temporary arrangement graduated at a lower rate than their housed or homeless peers, but their graduation rates varied dramatically by district. In Brownsville, Brooklyn, only 26% graduated within four years, approximately half the rate of both their housed, low-income classmates and housed, non-low-income classmates. By contrast, over 78% of homeless students who were never in shelter graduated in East Harlem. (Districts 23 and 4)
Four-Year Dropout Rate
Class of 2016
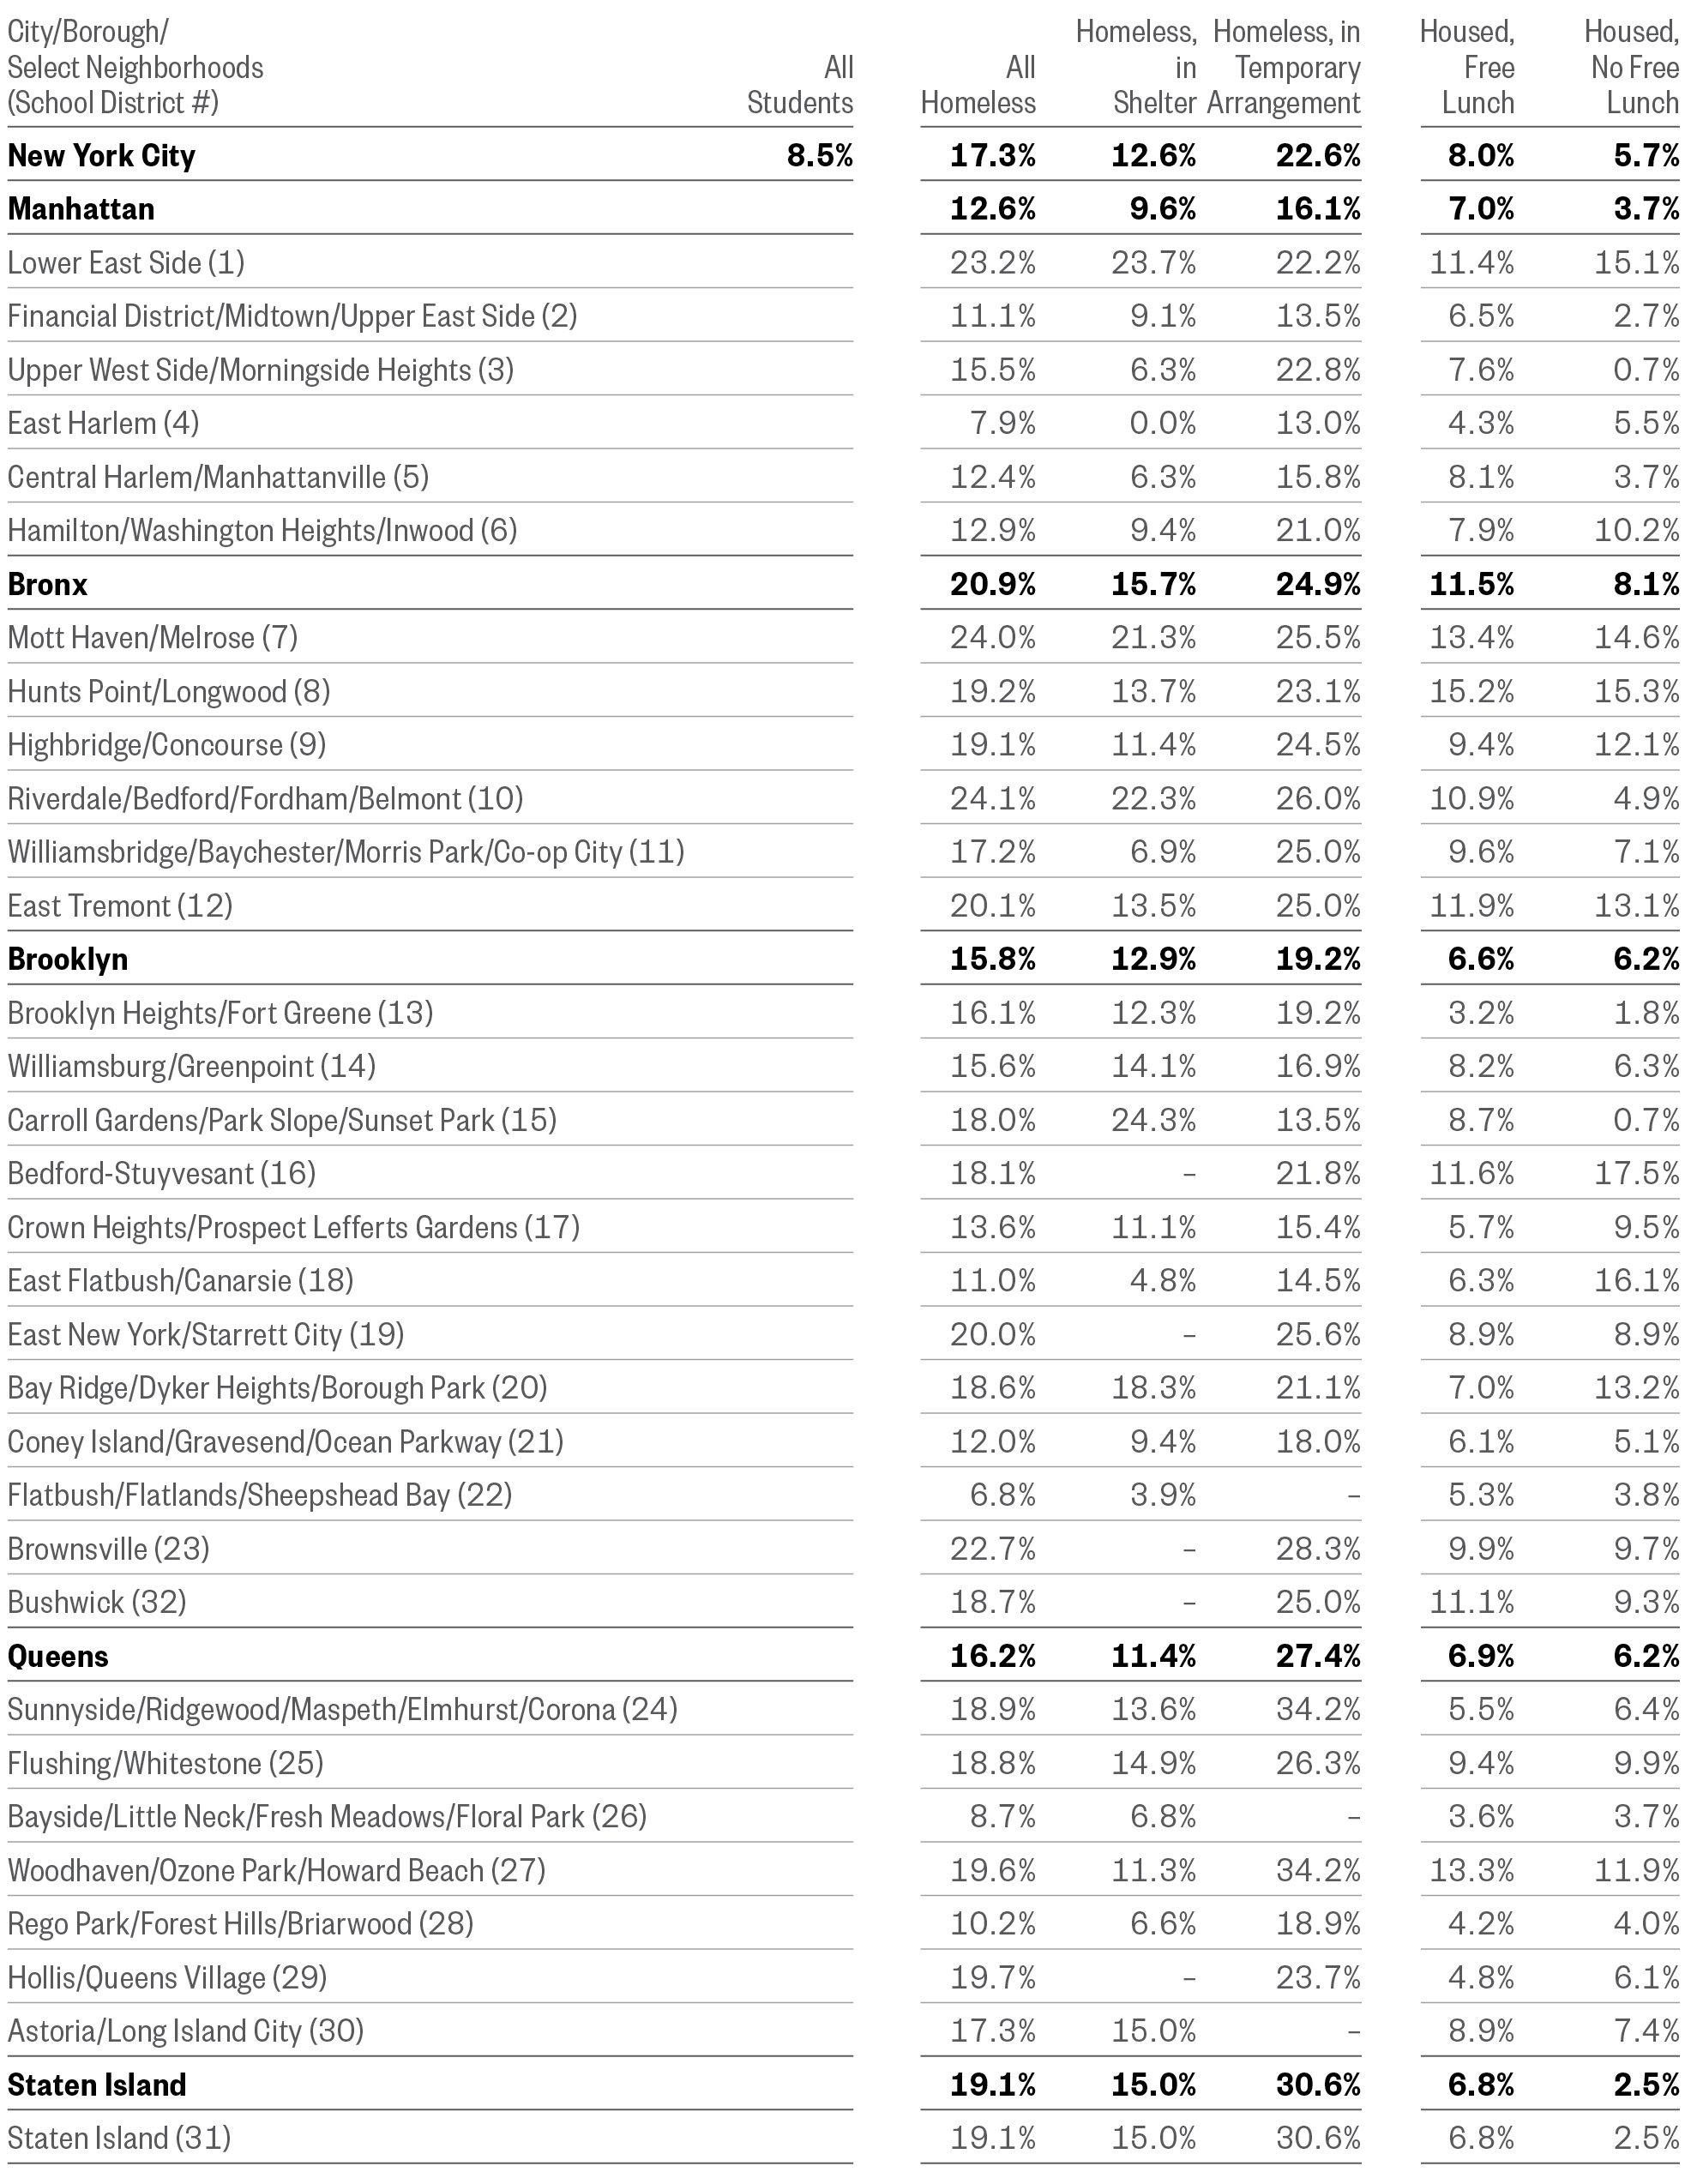
Note: Students are categorized according to whether they experienced homelessness or were eligible for free lunch at any point during their high school education. Data by school district do not include schools in non-geographic districts, so borough and district total percentages may differ. Ns of fewer than 30 students were redacted.
Four-Year Graduation Rate
Class of 2016
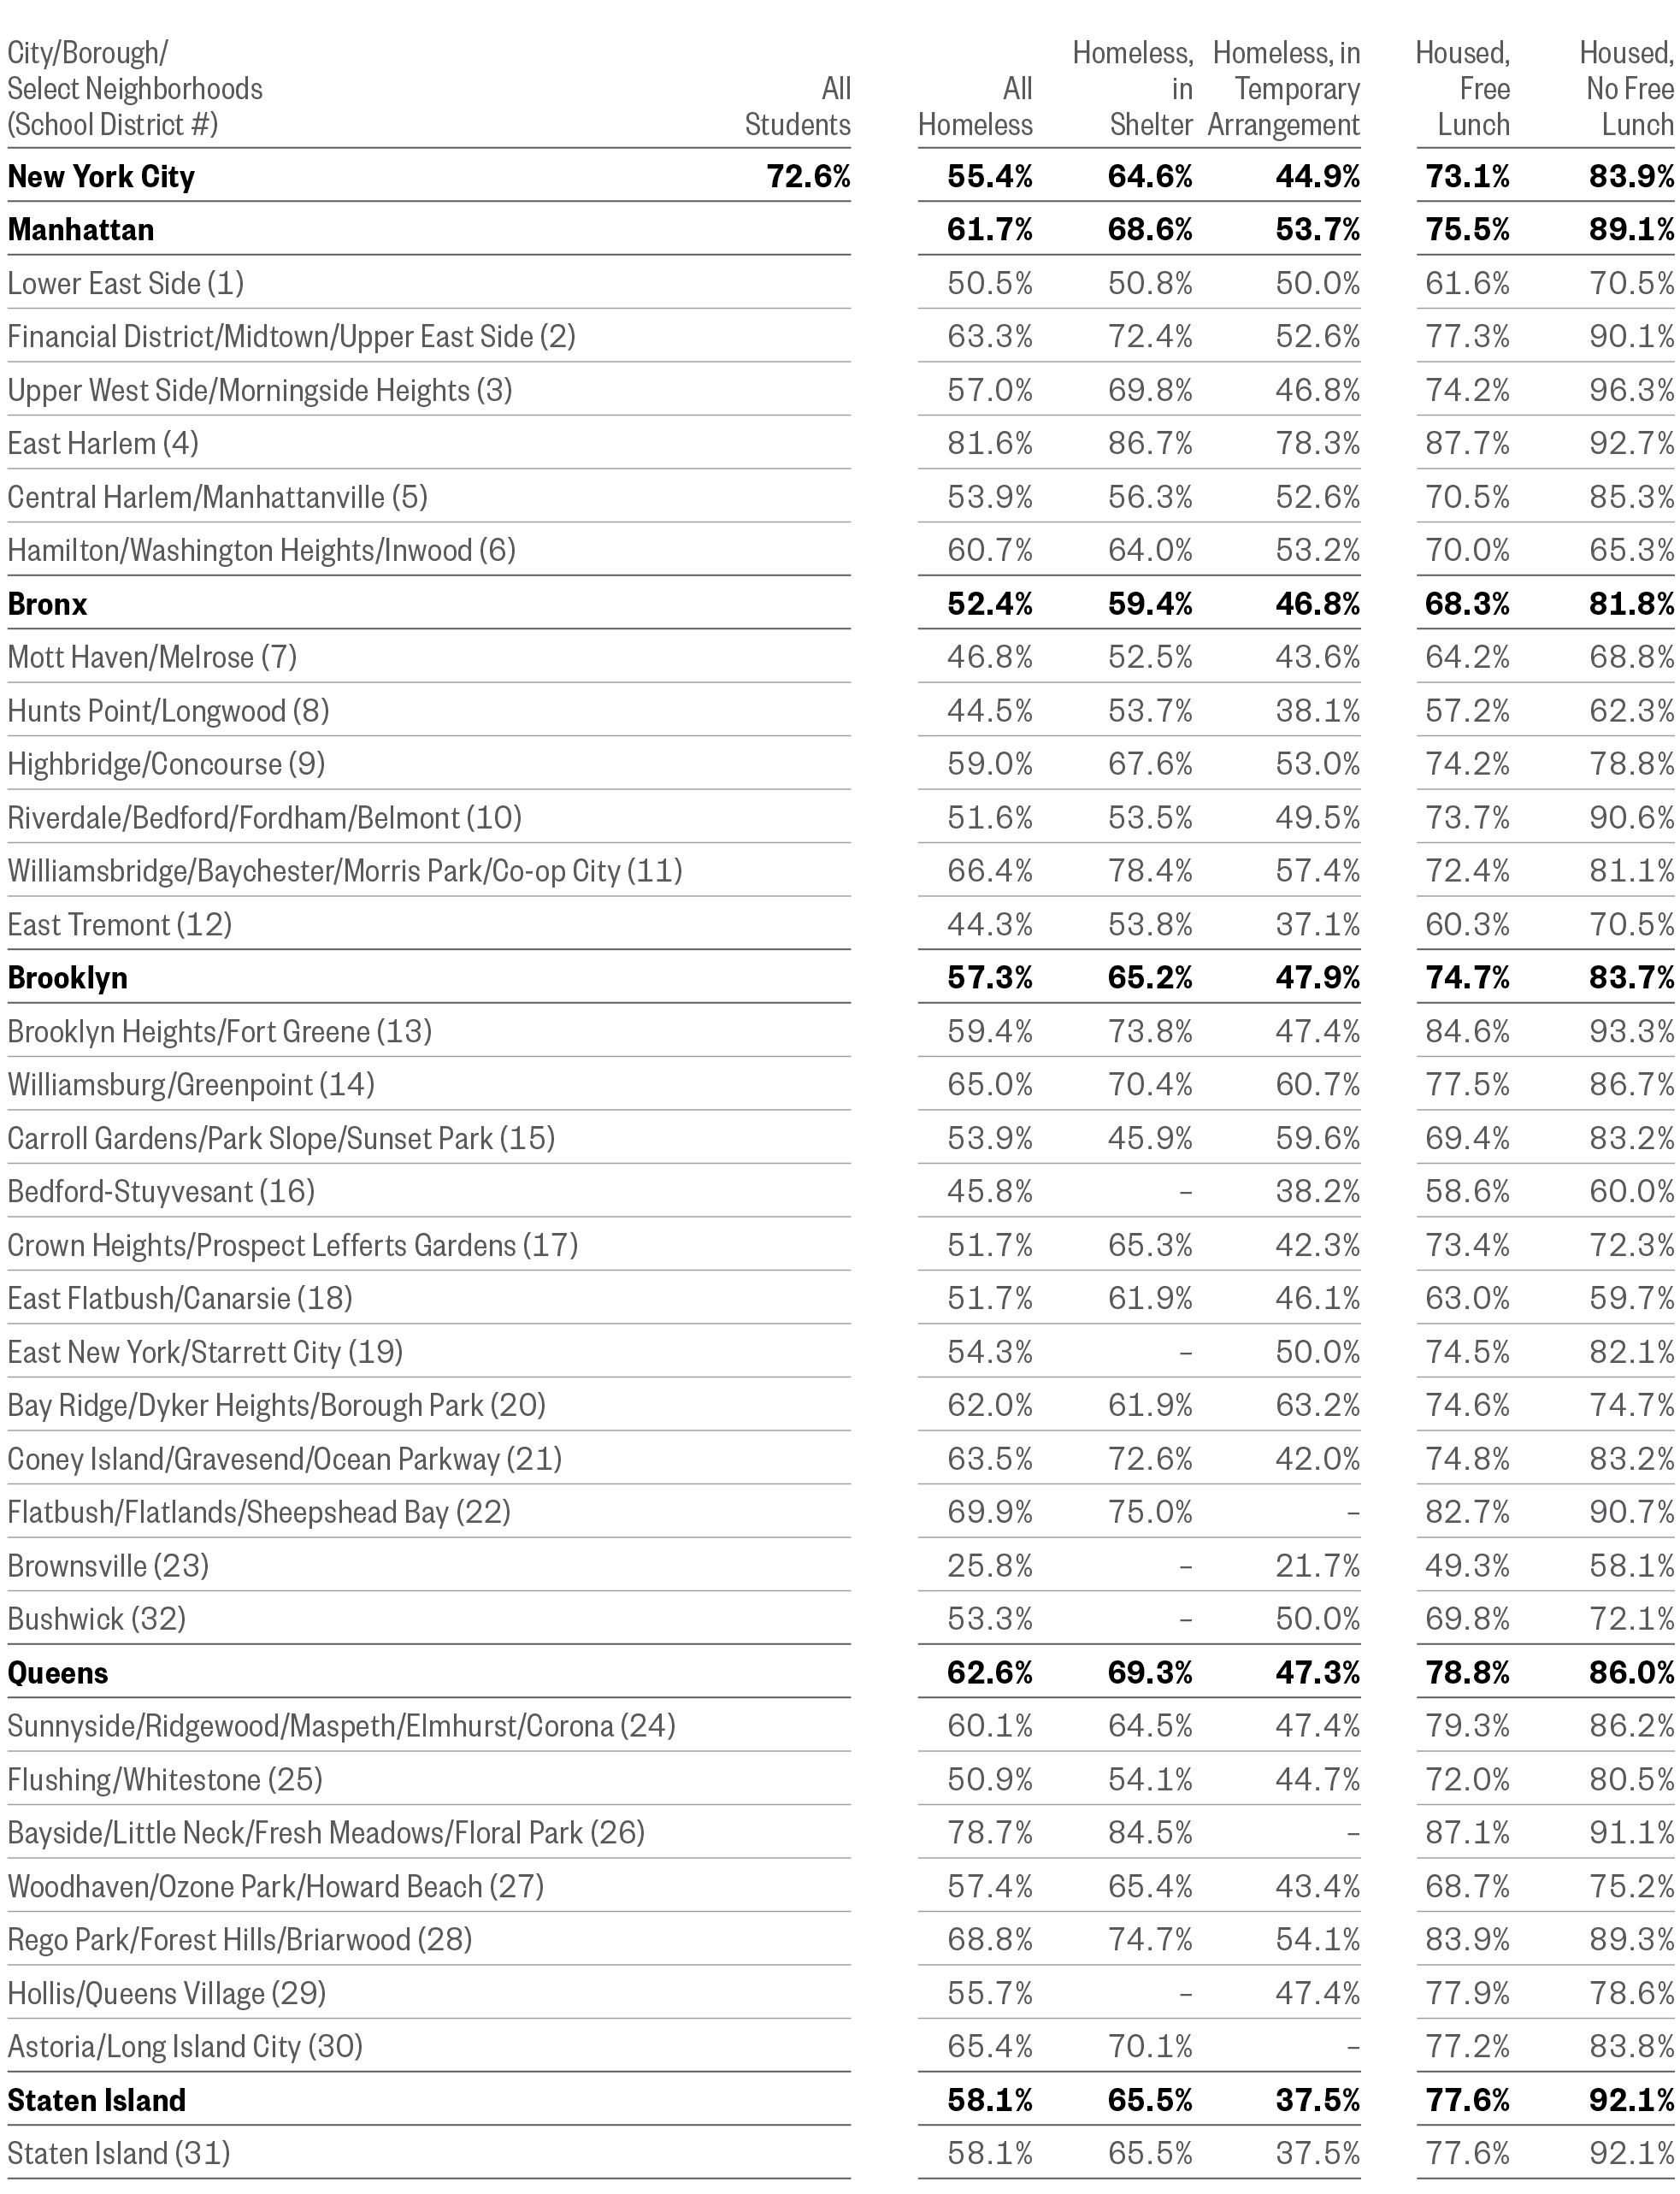
Note: Students are categorized according to whether they experienced homelessness or were eligible for free lunch at any point during their high school education. Data by school district do not include schools in non-geographic districts, so borough and district total percentages may differ. Ns of fewer than 30 students were redacted.
- Three of the top ten schools with the highest dropout rates for homeless students citywide were located on Staten Island (District 31). At these schools, homeless students dropped out at three to four times the rate of their housed classmates. (Port Richmond High School, Curtis High School, and Susan E. Wagner High School)
Top 10 Schools with Highest Homeless Student Dropout Rate
Class of 2016
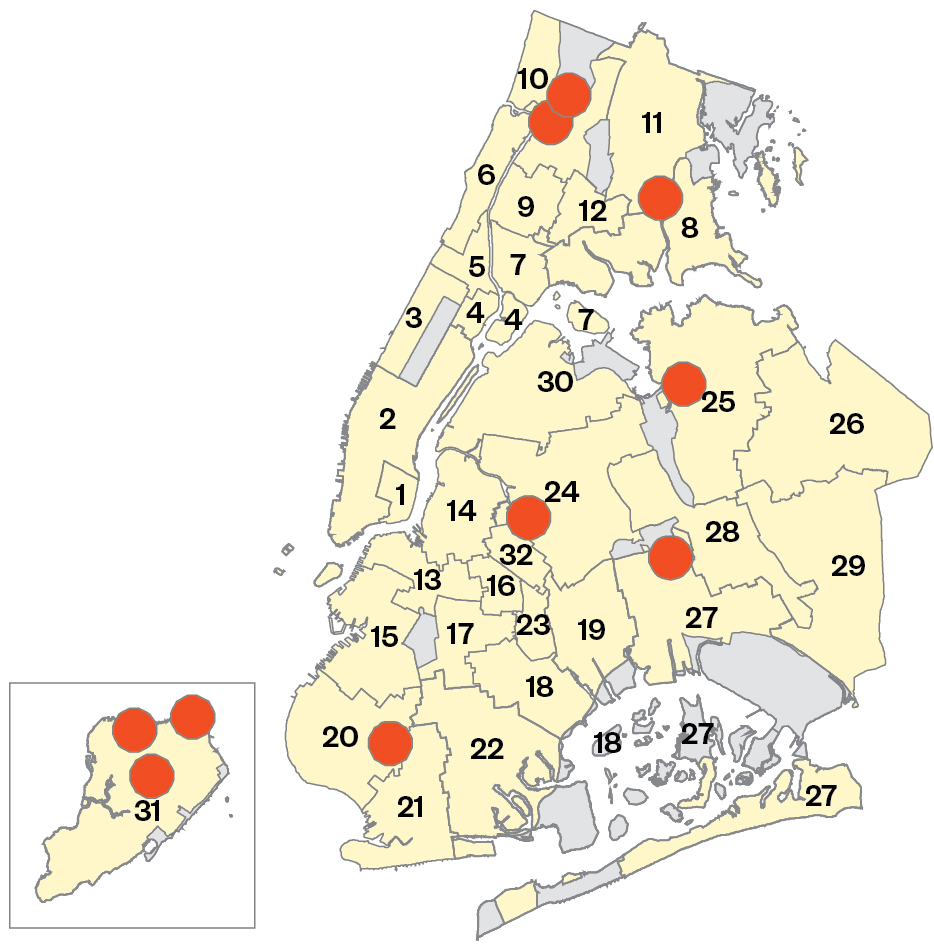
See schools at bit.ly/MapNYCHomelessStudents
Top 10 Schools with Highest Homeless Student Dropout Rate
Class of 2016
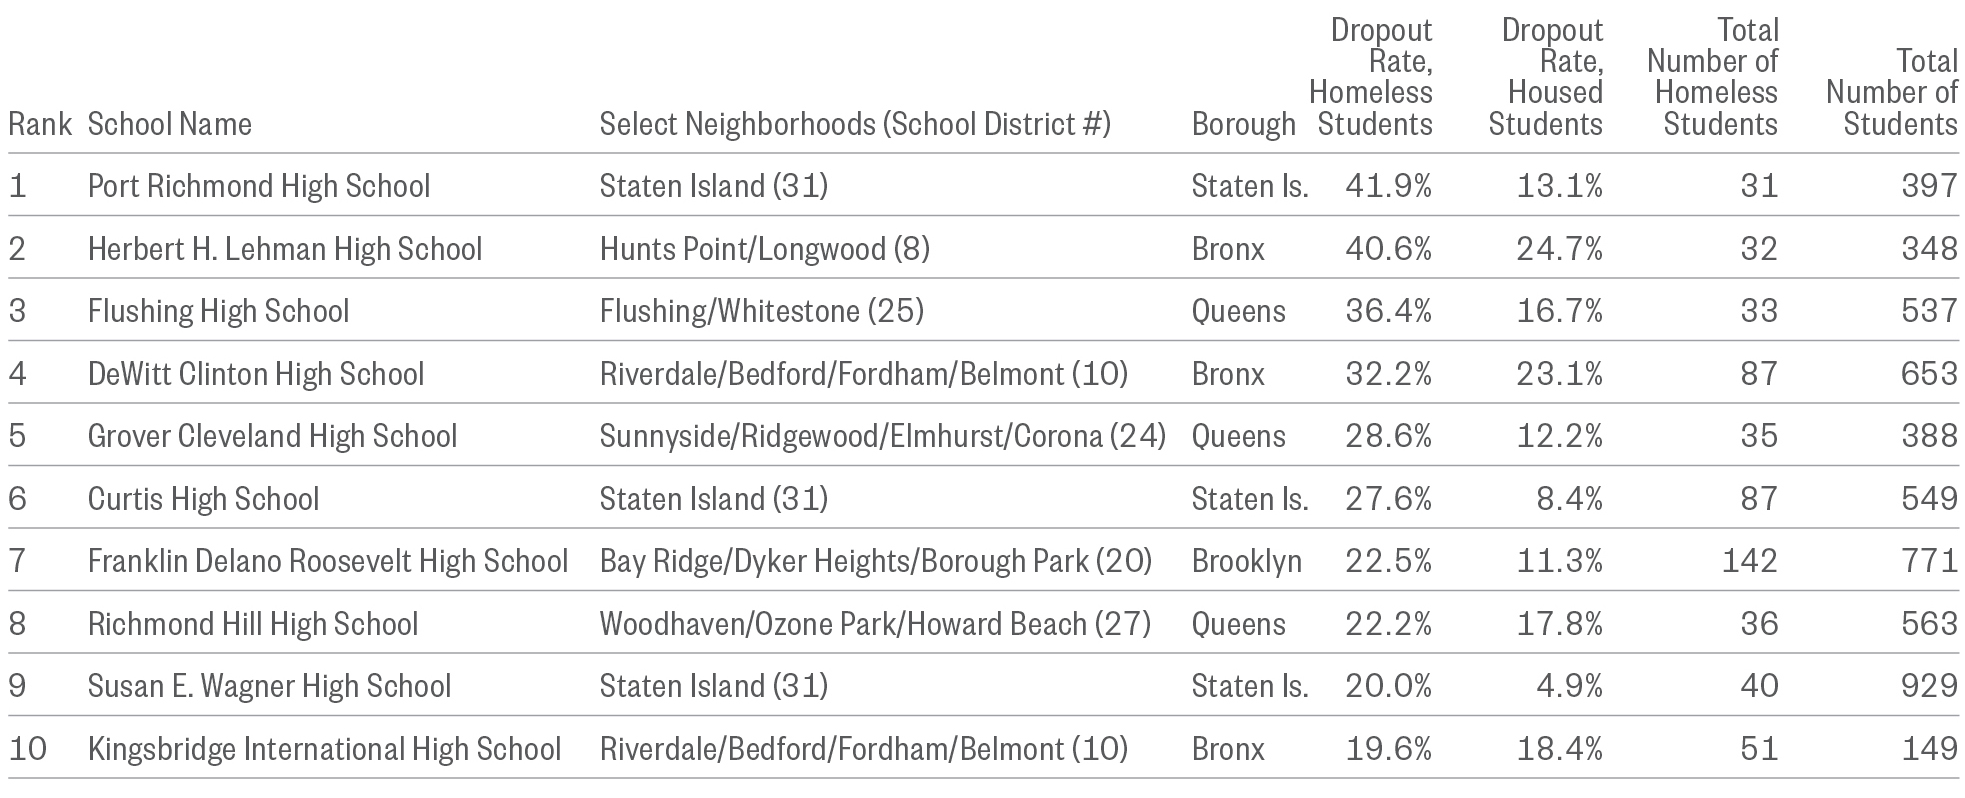
Note: Data are by school district and represent the four-year dropout rate for students who entered high school in 2012 and experienced homelessness at any point during their high school career. Data do not include schools in non-geographic districts.
- At the ten schools with the lowest graduation rates for homeless students, the average graduation rate for housed students was just 58%—compared to 74% for all housed students citywide. Understanding why homeless students are attending schools with overall lower graduation rates may be key to closing the graduation gap.
Homeless students were more likely to attend schools with worse overall graduation outcomes. Examining school enrollment policies and ensuring that homeless students are accessing quality school choices is essential.
Top 10 Schools with Lowest Homeless Student Graduation Rate
Class of 2016
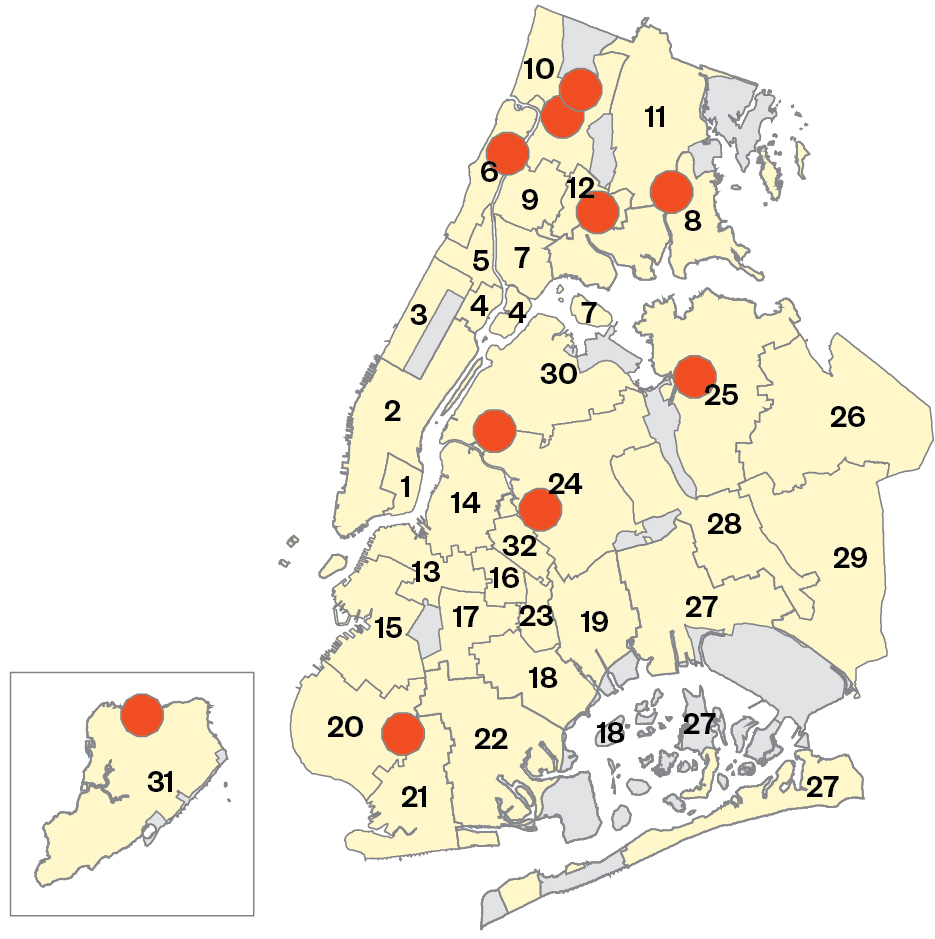
See schools at bit.ly/MapNYCHomelessStudents
Top 10 Schools with Lowest Homeless Student Graduation Rate
Class of 2016
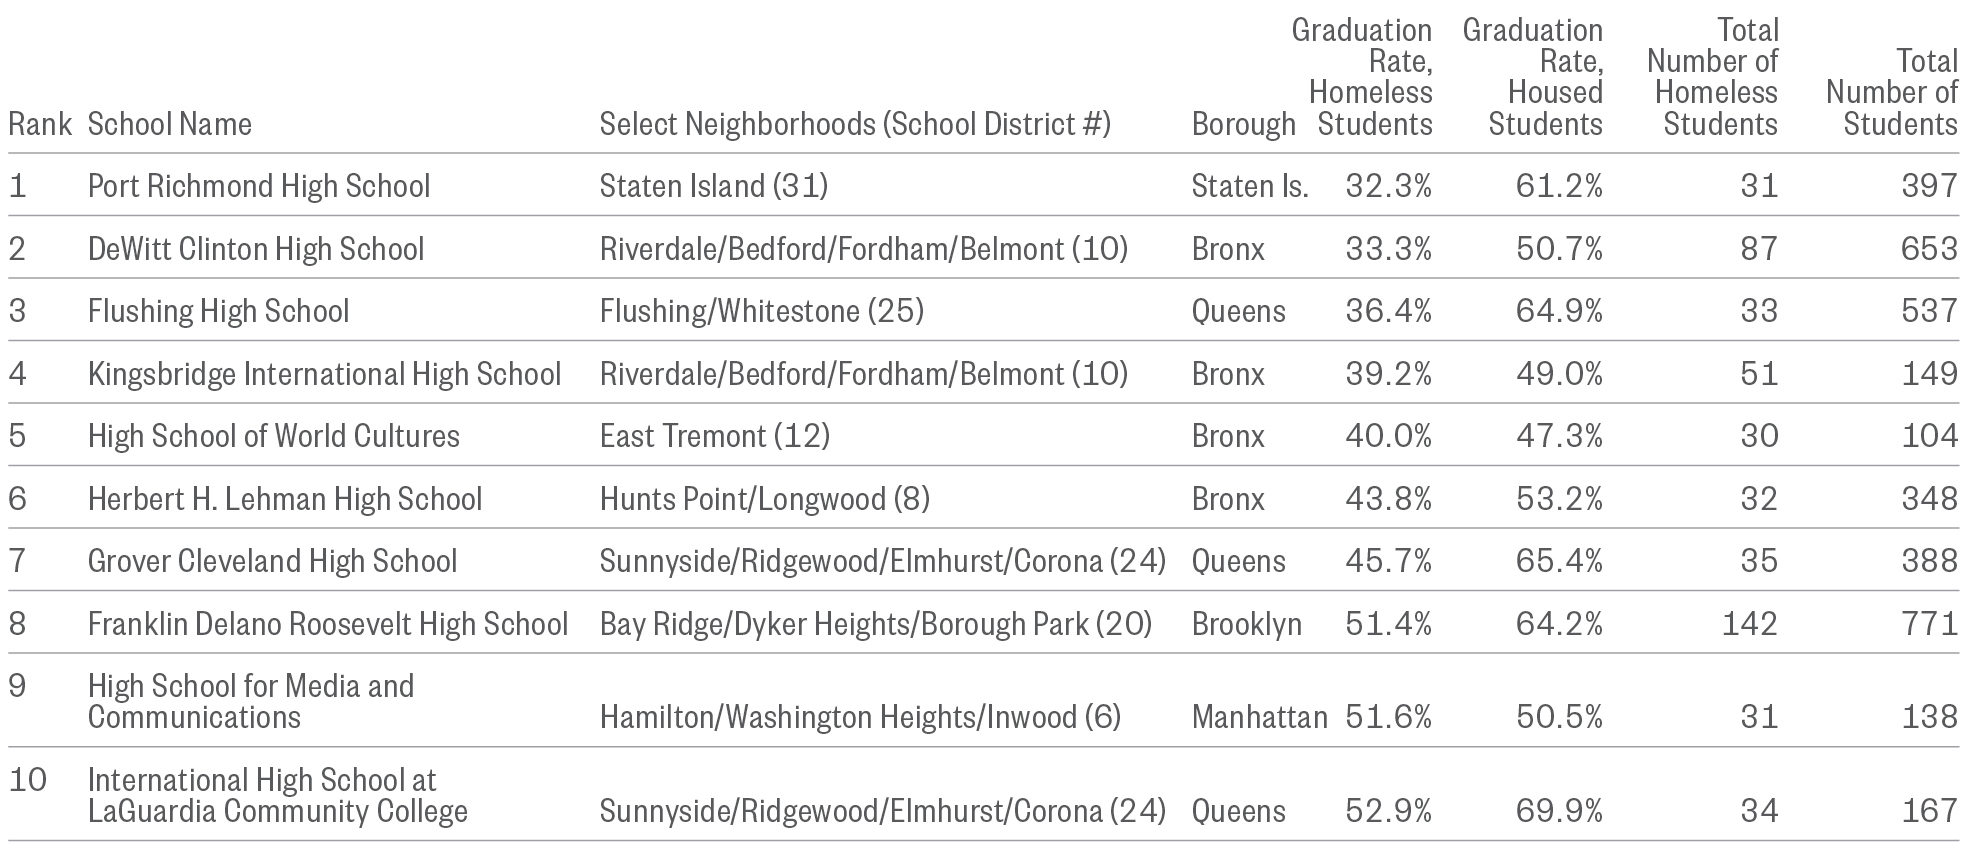
Note: Data are by school district and represent the four-year graduation rate for students who entered high school in 2012 and experienced homelessness at any point during their high school career. Data do not include schools in non-geographic districts.
Download Section 6 PDF
To explore homelessness in New York City schools, try our interactive map.
To learn more about the educational outcomes of homeless New York city students, try our Student Atlas app.
Return to top.
Section 7
Homeless Students by School District
I remember being homeless with my mom. I was never dealing with my own problems, my own insecurity, because I felt like I’m the man and I had to be strong for my mom and my baby sister. I would sacrifice going to the park, going out to school parties so I could go home and take care of my baby sister so my mom could go to work.
—College graduate, former participant in NYC Department of Education Students in Temporary Housing (STH) Unit supportive program
A [first-grade] student talked about getting kicked out of a family friend’s home in the middle of the night. He struggled to understand why someone who cared about him would kick him and his family out. He said, ‘I don’t get why someone would do that to us!’
—Social Work Director, Partnership with Children, working in New York City public school(s)
Homeless students attend school in every New York City school district. Schools are often the first public agency to discover a child’s housing instability. Once identified, these schools provide vital supportive services to children experiencing housing instability and in some cases to their parents as well. Increasing understanding of student homelessness at the district and school levels is vitally important to meeting the needs of children who are struggling with instability and at risk for poor educational outcomes.
This section provides data on each New York City public school district, including both the ratio of elementary students who will experience homelessness by fifth grade unless current trends change, and the ratio of pre-K–12 students who experienced homelessness in the last six years. Each geographic school district is ranked by the proportion of students experiencing homelessness to provide a city- and borough-wide comparison. Additional information on this year’s district pages includes the number of students who are housed but have experienced homelessness in prior school years (formerly homeless) and a comparison of the grades homeless and housed students attend in the district.
Educational outcomes are also shown for each school district, providing context for how homeless students are faring compared to their housed peers. Additionally, changes in the district’s chronic absenteeism and mid-year transfer rates over time provide a detailed picture of challenges with school stability for both homeless and housed students in the district, as well as those living in shelter and doubled up. Examining practices in districts where these rates are low or declining can provide ideas for support in other districts. Suspension rates over time are also shown as an indicator of how schools address the behavioral difficulties that homeless students face, particularly those living in shelter, and reveal districts where disciplinary actions are declining and where they are stagnant. Key district findings to facilitate further interpretation by policymakers and educators are also included.
What’s New?
- Homelessness increased in every school district in New York City between SY 2014–15 and SY 2015–16.
- The rate of student homelessness ranged from a low of 2.5% in Bayside, Queens to a high of 20% in the Bronx’s Highbridge/ Concourse. (Districts 26 and 9)
- The district with the highest percentage of homeless students is District 9 (Highbridge/ Concourse) at 20%. It is also home to the highest number of family shelter units citywide at over 1,700 units, including hotels and cluster sites.
- School districts located in the Bronx, northern Manhattan, and central Brooklyn not only have large numbers of homeless students, but also have an additional 6%–7% of their students who were formerly homeless in a previous year.
- By district, the share of homeless students with English Language Learning (ELL) needs ranged from just 5% of homeless students in Bedford-Stuyvesant to over half of homeless students in Bay Ridge. (Districts 16 and 20)
- Brownsville in Brooklyn had the highest percentage citywide of chronically absent homeless students at 44%. (District 23)
- East Tremont had the largest decrease in the suspension rate of homeless students from SY 2010–11 to SY 2015–16 at 5% (from 8% to 3%). (District 12)
- The district with the highest percentage of homeless students transferring mid-year was District 31 (Staten Island), where 34% of homeless students transferred in SY 2015–16.
- Homeless students in Bedford-Stuyvesant have seen an improvement in school stability, with declines in both the chronic absenteeism rate (53% to 41%) and the mid-year transfer rate (37% to 26%) since SY 2010–11. (District 16)
- Homeless students in East New York have the highest rate of late IEP identification in the city at 78%. This was 50% higher than the rate for housed students in the district and roughly twice the overall citywide rate. (District 19)
- Roughly 2,750 doubled-up homeless students and 165 students in shelter attended Bay Ridge schools. (District 20)
Policy Considerations
- Students living in shelters face heightened academic risks and school instability, but their risk is not the same in every district. Learning from collaborations between schools and shelters may be key to improving stability and outcomes for students in shelter.
- Identifying the supports that are helping homeless students in some districts maintain stability in the classroom and replicating those in other districts could help students in shelter across the city succeed.
- Many districts educate large numbers of homeless students living in shelter and doubled up, yet have few family shelters located nearby. Understanding the specific challenges of students in shelter who may be traveling long distances to attend school—and the instability faced by doubled-up students who may not be able to enter a shelter—is critical for educators and administrators.
Download Section 7 PDF
Manhattan
City School District 1 Manhattan
City School District 2 Manhattan
City School District 3 Manhattan
City School District 4 Manhattan
City School District 5 Manhattan
City School District 6 Manhattan
Bronx
Brooklyn
City School District 13 Brooklyn
City School District 14 Brooklyn
City School District 15 Brooklyn
City School District 16 Brooklyn
City School District 17 Brooklyn
City School District 18 Brooklyn
City School District 19 Brooklyn
City School District 20 Brooklyn
City School District 21 Brooklyn
City School District 22 Brooklyn
City School District 23 Brooklyn
City School District 32 Brooklyn
Queens
City School District 24 Queens
City School District 25 Queens
City School District 26 Queens
City School District 27 Queens
City School District 28 Queens
City School District 29 Queens
City School District 30 Queens
Staten Island
City School District 31 Staten Island
Special School Districts
To explore homelessness in New York City schools, try our interactive map.
To learn more about the educational outcomes of homeless New York city students, try our Student Atlas app.
Return to top.
Appendix
User’s Guide
Homeless Students by School District
Homeless Students by Community District
Homeless Students by City Council District
Homeless Students by State Assembly District
Homeless Students by State Senate District
Glossary of Terms
Ralph da Costa Nunez, PhD, President and CEO
Liz Cohen, Chief of Staff
Project Team:
Anna Shaw-Amoah, Principal Policy Analyst
Jenna Davis, Senior Policy Analyst
Kristen MacFarlane, Senior GIS Analyst
Kaitlin Greer, Policy Analyst
Rachel Barth, Policy Analyst
Janice Tolbert, Policy Analyst
Trisha Clifton, Policy Intern