Executive Summary
Children need stability to thrive. But across the United States, more and more children are facing the most extreme form of instability and poverty—homelessness. In no place is this more evident than in New York City, where one out of every eight children attending public school in SY 2014–15 had experienced homelessness within the past five school years.
Together, these over 127,000 children would form a school district larger than that of Boston and Seattle combined, and comparable in size to the Unified District of San Diego, CA, the 20th largest school district in the country.1 Given the scope and direction of homelessness among school-age students, it is imperative for policymakers and educators to know more about homeless students’ experiences in school.
The 2016 On The Map: Atlas of Student Homelessness in New York City builds from where last year’s 2015 Atlas of Student Homelessness left off. It provides a detailed picture of homelessness within the City’s educational system: where homeless students go to school, what kinds of supports they may need, what their academic outcomes look like, what differences exist by the type of homelessness a student experiences, and what the lasting impacts of homelessness are educationally—even after a student’s housing instability has ended. This picture dispels the notions that homeless students are the same as other poor students and that the experience of homelessness is the same across all school districts.
Student homelessness affects the entire city, but the dynamics of homelessness differ locally. Homelessness is experienced one neighborhood, school, or shelter at a time, and each child has a different story. While citywide findings can illuminate the larger context of student homelessness in New York City, they do not provide local texture or opportunity for comparisons between districts and schools. To get closer to the lived experience of homeless school age children, the 2016 Atlas of Student Homelessness profiles each of the City’s 32 geographic school districts as well as its two citywide special districts.
Housing instability can leave lasting scars on a child’s development. Psychologically, chronic stress can traumatize children, overloading the stress response center in their brains and weakening executive function skills, limiting their ability to effectively plan, juggle multiple tasks and remember instructions.2 Without needed supports, this can have long-term social consequences, making the normal challenges of navigating daily life even more difficult and carrying over into friendships and school. Children who experience housing instability struggle more academically, not because they have less potential than other children, but because they must constantly deal with the stress of uncertainty—will they have food, clean clothes, a safe place to sleep? Education is key to breaking the cycle of poverty and ensuring homeless children have access to a better future. With more and more children experiencing homelessness, it is vitally important to understand the unique challenges that homeless students face and the interventions and opportunities available to meet their needs.
xxx
Key Citywide Findings
-
One out of every eight students in NYC public schools in SY 2014–15 experienced homelessness within the past five school years.
-
In one-quarter of New York City school districts, at least one out of every five students had experienced homelessness within the past five school years.
-
Over two-thirds of students who were homeless in SY 2014–15 had been homeless during a previous school year.
-
If all of the students who experienced homelessness in NYC had their own school district, it would be comparable in size to the Unified District of San Diego, California, the 20th largest school district in the country.
-
Homeless elementary students living in shelter had the highest rates of mid-year transfers and chronic absenteeism. Forty percent transferred during the school year and over half missed 20 or more days of school.
-
Homelessness has a lasting impact on grade-level proficiency and retention rates. Students who were housed but had experienced homelessness had lower rates of grade-level proficiency and higher rates of grade retention than their low-income peers who had never experienced homelessness.
-
Only one-third of homeless students with special education needs received their IEP by the end of Kindergarten, a much lower rate than that of their housed peers.
-
While overall, homeless students dropped out at twice the citywide average, homeless students living in shelter during all four years of high school dropped out at rates that were statistically no different than their housed peers.
Key District-Level Findings
-
Almost 20% of homeless students, or over 15,000 children, attended just two school districts in the Bronx (Districts 9 and 10). These two districts serve the Highbridge and Fordham areas of the Bronx.
-
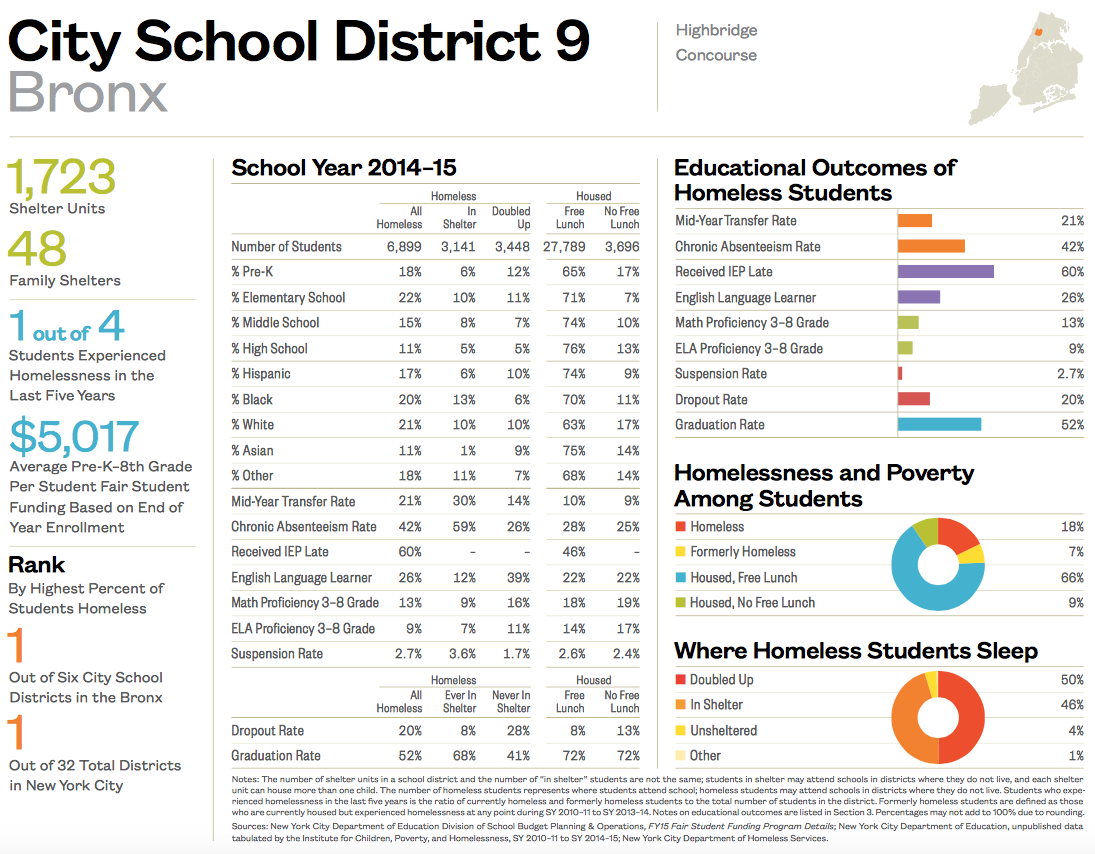
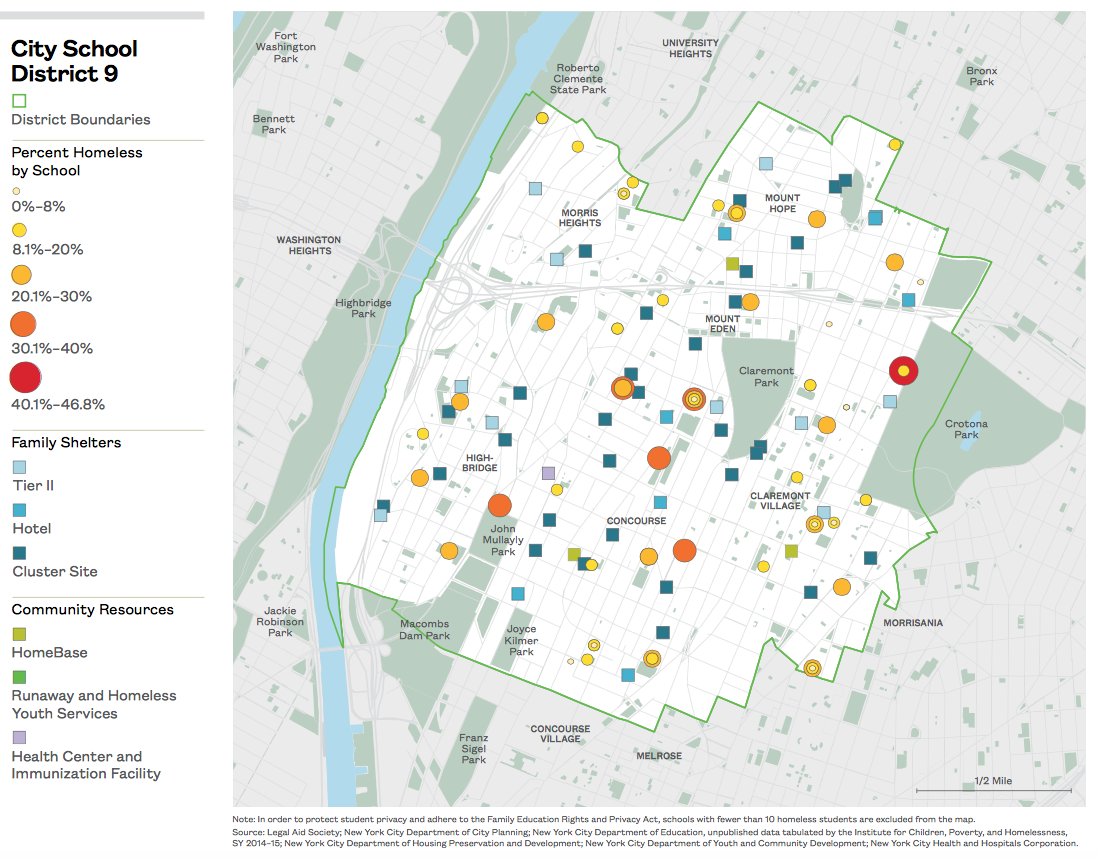
The Highbridge neighborhood of the Bronx (District 9) had the highest proportion of students who were homeless in SY 2014–15.
-
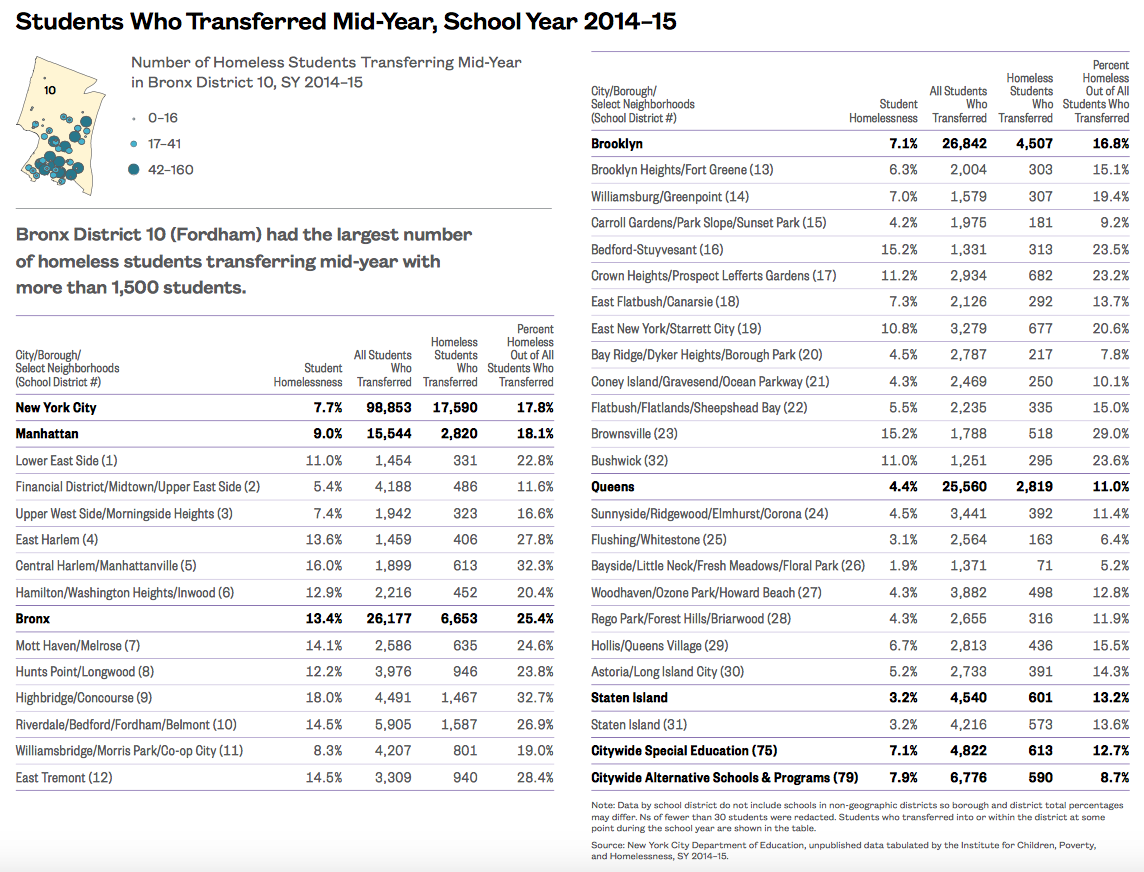
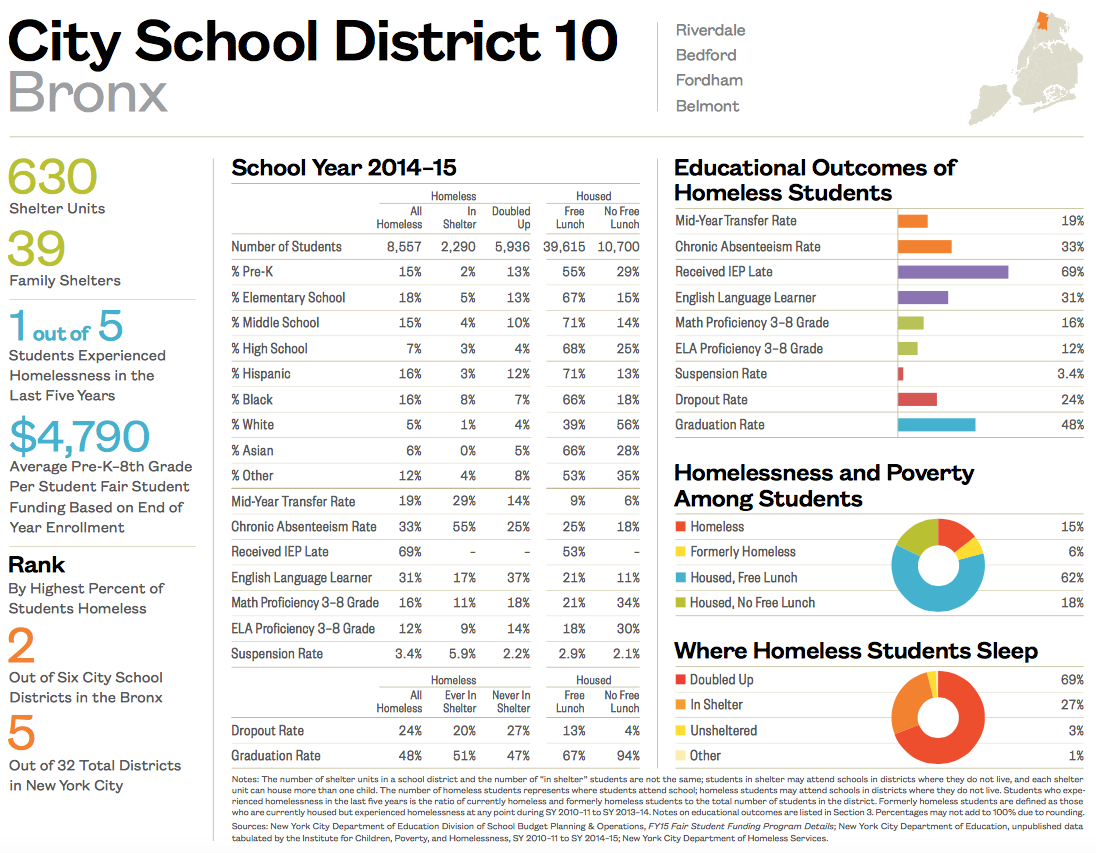
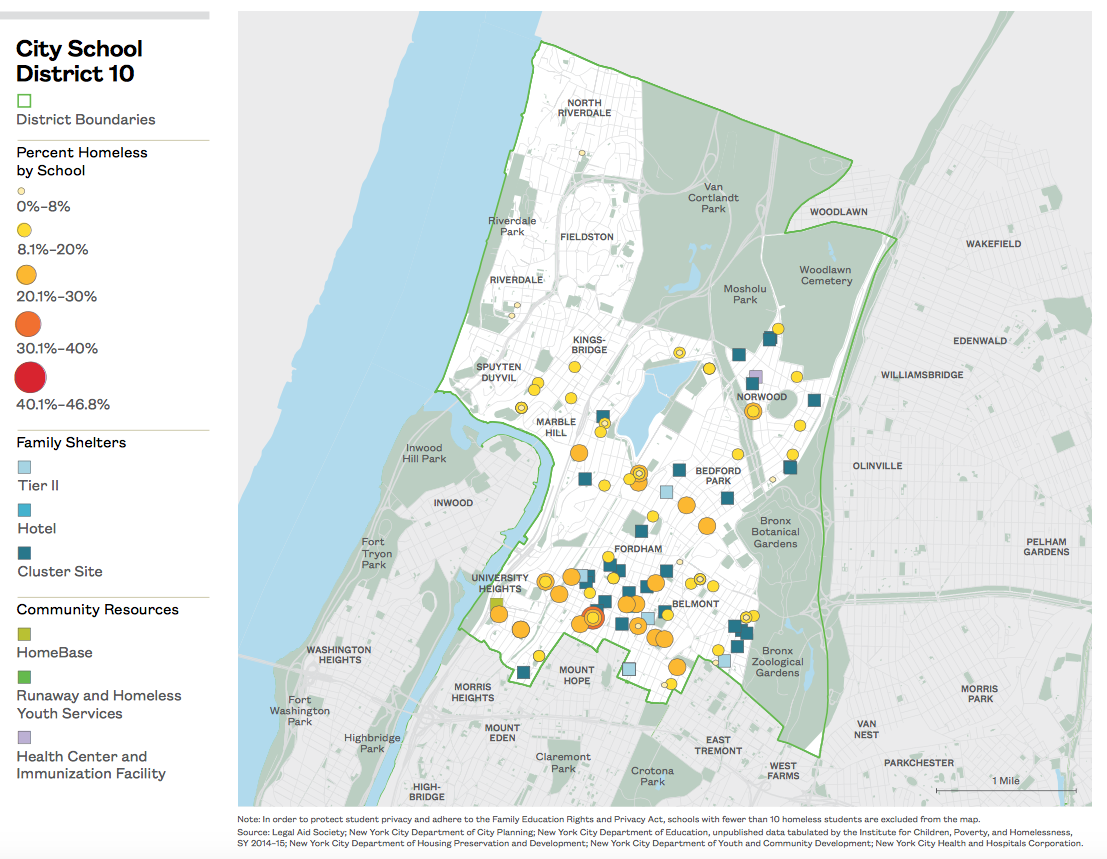
District 10, including the Fordham neighborhood of the Bronx, had the largest number of homeless students with more than 8,500 students enrolled in SY 2014–15.
-
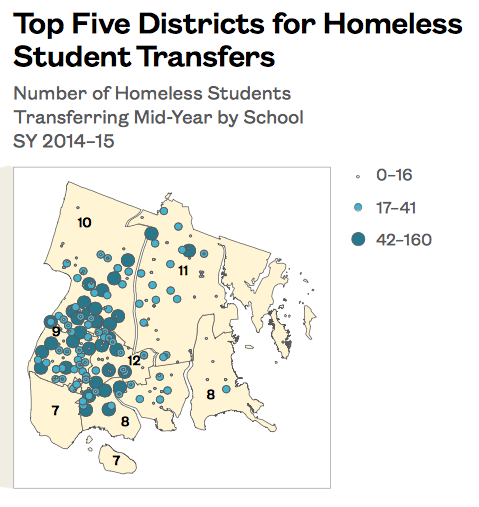
The top five school districts for the number of homeless students transferring mid-year were all in the Bronx.
-
One out of every three students who transferred into District 9 (Highbridge) mid-year was homeless.
-
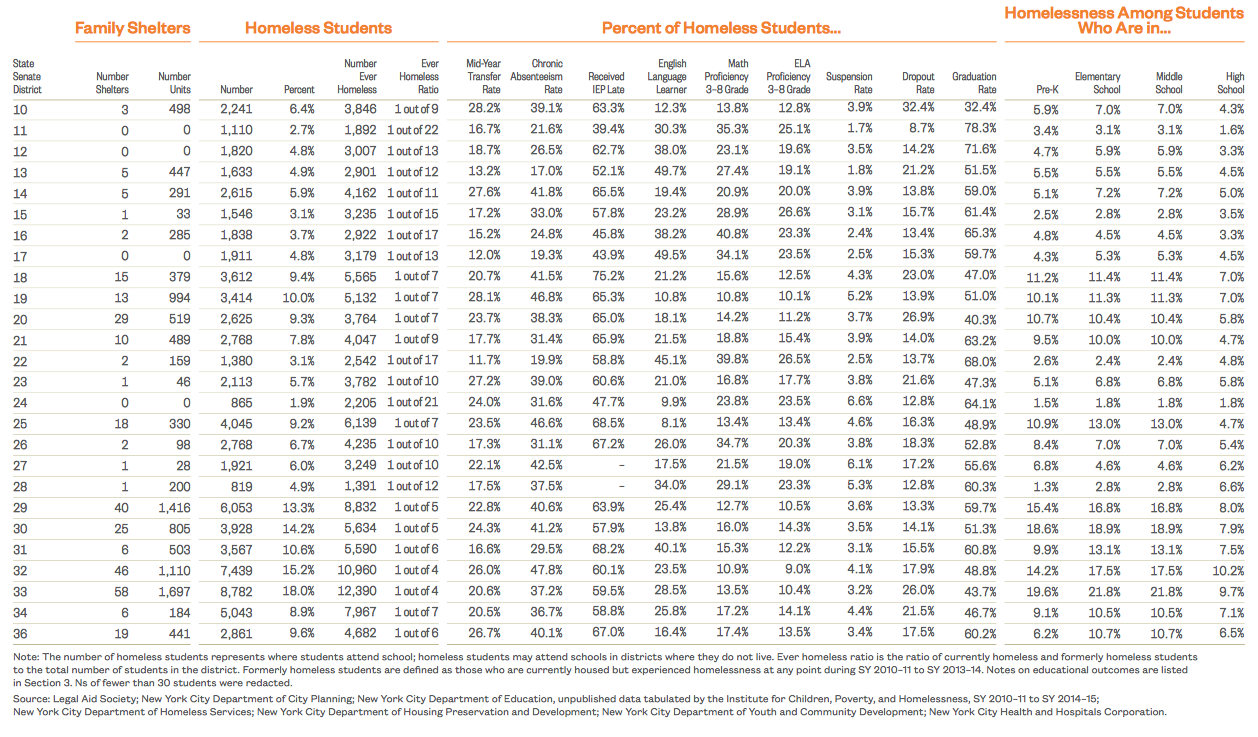
District 9 (Highbridge) was home to 48 shelters with capacity for over 1,700 families with children. This was more than two times the family shelter capacity of the next-highest school district (District 19 serving East New York), which had 730 units located in 9 different shelters.
-
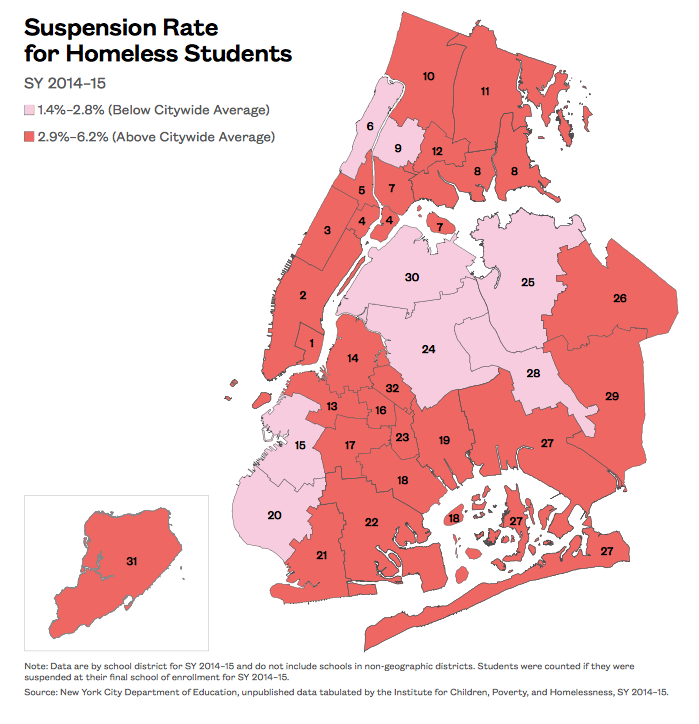
In eight out of NYC’s 32 school districts, homeless students were suspended at rates that were below the citywide average of 2.8%.
-
In seven school districts more than 62% of students who experienced homelessness during high school graduated. In the year prior, only three school districts had graduation rates for homeless students that were above 60%.
1 National Center for Education Statistics, “Table 215.30, Enrollment, poverty, and federal funds for the 120 largest school districts, by enrollment size in 2013: Selected years, 2012–13 through 2015,” http://nces.ed.gov/programs/digest/d15/tables/dt15_215.30.asp?current= yes (accessed June 29, 2016).
2 Robert F. Anda et al, “The enduring effects of abuse and related adverse experiences in childhood: A convergence of evidence from neurobiology and epidemiology,” European archives of psychiatry and clinical neuroscience, 256, 3, (2006): 174-86.
xxx
xxx
Overview:
Homeless Students in New York City
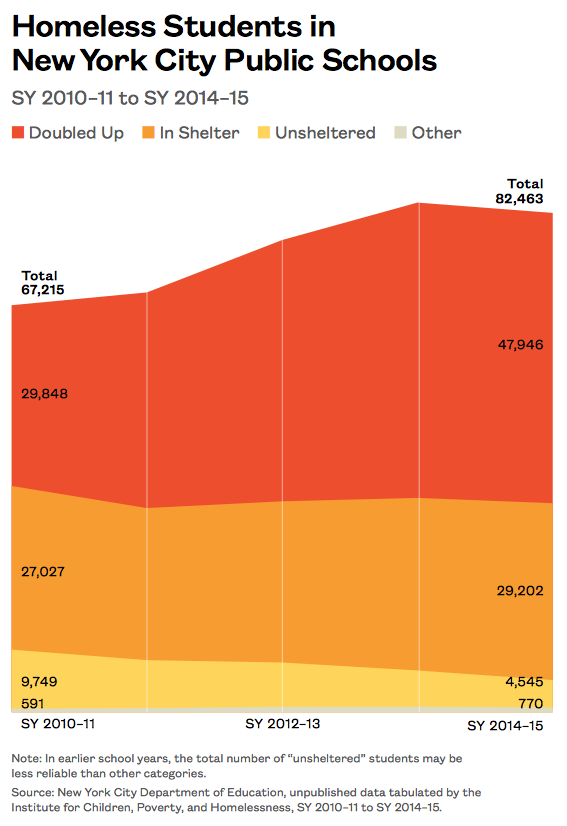
Homelessness impacts every school district across the city. Over 82,000 students attending New York City Public Schools were homeless in School Year (SY) 2014–15, and one out of eight students had experienced homelessness at some point between SY 2010–11 and SY 2014–15. The information presented in this section provides an overview of homelessness among students in New York City. Building off of the 2015 Atlas of Student Homelessness, the 2016 Atlas of Student Homelessness examines differences in student outcomes by the type of homelessness experienced, including whether students were living in shelter, doubled up, unsheltered, or housed but with a history of homelessness (formerly homeless). Additional indicators of school success, such as the timing of when students with special education needs are first identified for services (IEPs), are also included.
-
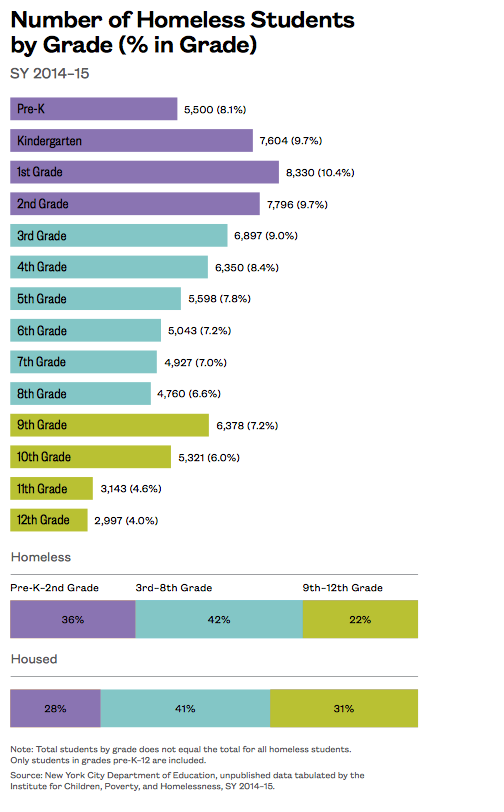
Children are most likely to experience homelessness when they are young—before third grade.
-
One out of every eight students attending school in SY 2014–15 had experienced homelessness within the past five school years.
-
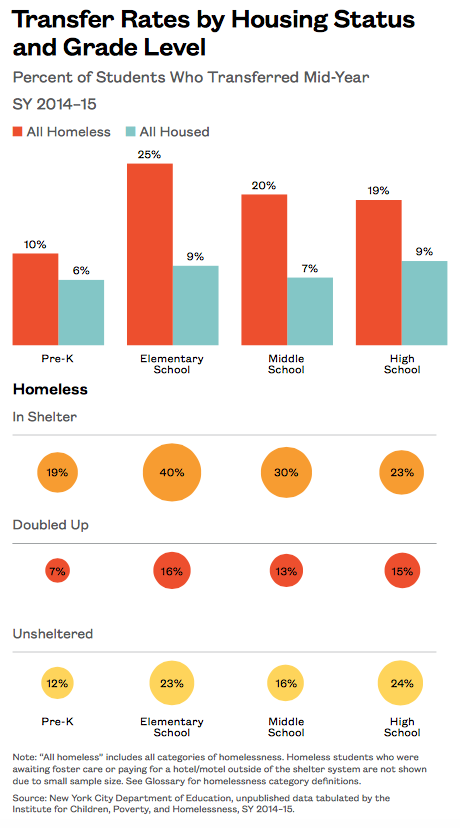
Forty percent of homeless elementary students living in shelter transferred during the school year compared to just 9% of their housed peers.
-
Across grade levels, homeless students living in shelter had higher rates of chronic absenteeism than not only their housed peers, but also homeless students living doubled up.
-
Homelessness has a lasting negative impact on grade-level proficiency and retention rates.
-
Only one-third of homeless students with special education needs received their IEP by the end of Kindergarten, a much lower rate than that of students who were always housed.
-
More eligible homeless children enrolled in pre-K in SY 2014–15 than in the prior school year.
-
Homeless students living in shelter during all four years of high school dropped out at rates that were no different than their housed peers.
xxx
Student Homelessness Remains Pervasive
-
One out of every eight students attending school in SY 2014–15 had been homeless at some point since SY 2010–11—over 127,000 students.
-
New York City continues to have over 80,000 homeless public school students in SY 2014–15.
-
For every homeless student living in a City shelter, there are roughly two more who are homeless living in some other temporary location, such as doubled up with another family.
-
For the first time since SY 2010–11, the number of homeless students in New York City declined slightly from just over 84,000 in SY 2013–14 to roughly 82,500 in SY 2014–15. This decrease was seen primarily among unsheltered and doubledup students, while the number of students living in shelter increased slightly by 2%.
xxx
Most Children Are Homeless for More Than One School Year
-
Homelessness is not a brief or isolated experience for New York City school children.
-
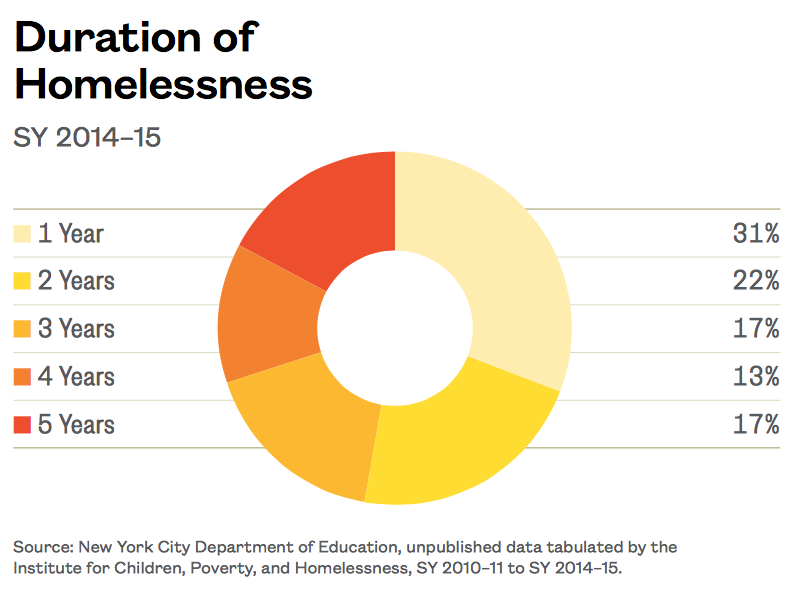
Over two-thirds of students who were homeless in SY 2014–15 had been homeless during a previous school year.
-
It was common for homeless students to experience multiple housing transitions from one year to the next. Among students who were homeless during more than one school year, over three-quarters experienced more than one type of homelessness or transitioned in and out of permanent housing more than once.
xxx
Hispanics and Blacks Are Over-Represented
-
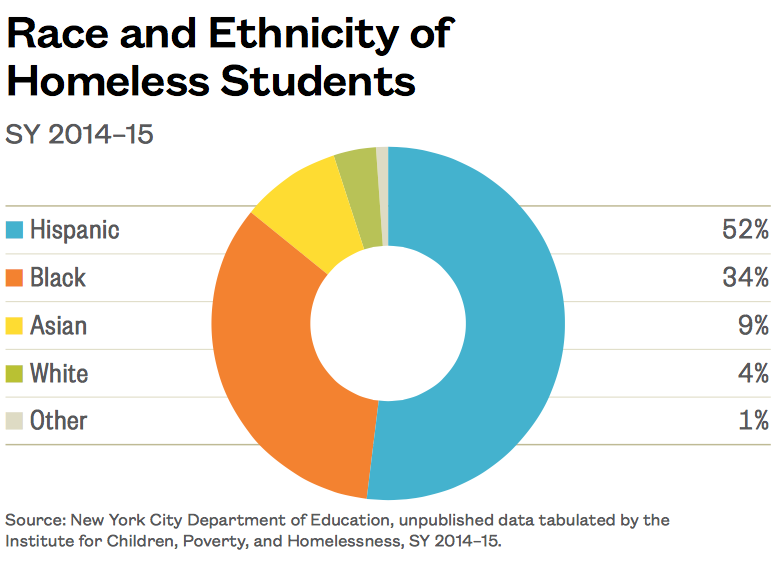
Over half of all homeless students in New York City were Hispanic in SY 2014–15.
-
While black and Hispanic students made up 66% of New York City public school students overall, they represented 86% of students who were homeless in SY 2014–15.
xxx
Young Students Are Most at Risk for Homelessness
- Children are most likely to experience homelessness when they are young. In SY 2014–15, 36% of homeless students were enrolled in pre-K through 2nd grade. By comparison, only 28% of housed students were enrolled in these early grades. Homelessness prior to 3rd grade has been shown to have long-term effects on later grade-level proficiency.1
- More eligible homeless children enrolled in pre-K in SY 2014–15 than in the prior school year. Enrollment among homeless pre-K students increased by 17%, or over 750 students, suggesting that New York City’s expansion of public pre-K is reaching more homeless students.
- Despite this progress, the enrollment gap between pre-K and Kindergarten suggests that over 2,000 homeless children eligible for pre-K were not reached in SY 2014–15 by the program.
- In high school, the spike in 9th and 10th grade followed by a drop in 11th and 12th is reflective of homeless students being held back and dropping out of school.
xxx
xxx
Housing Instability Undermines School Stability
-
Every school transfer is estimated to set a student back academically by up to six months.2
-
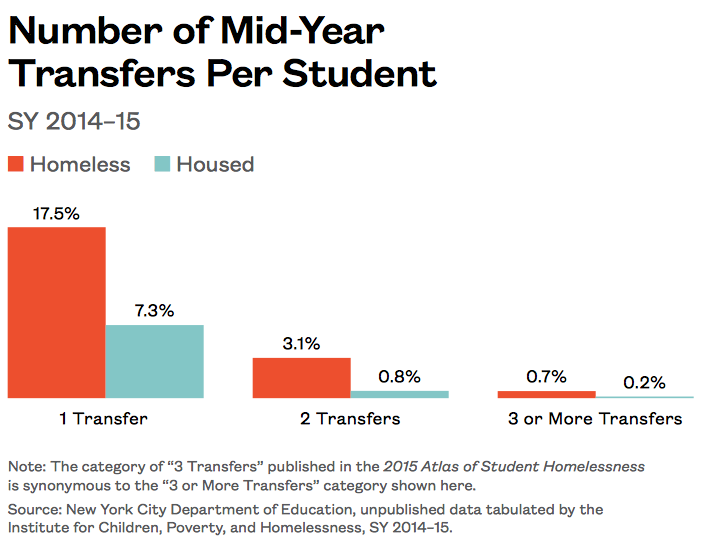
Homeless students continued to transfer at close to three times the rate of housed students overall in SY 2014–15 (21% compared to 8%).
-
Homeless elementary students had the highest rate of mid-year transfers (25%) by age group. This rate was higher for those who were living in shelter; 40% transferred during the school year.
xxx
xxx
Empty Seats: Who Is Missing?
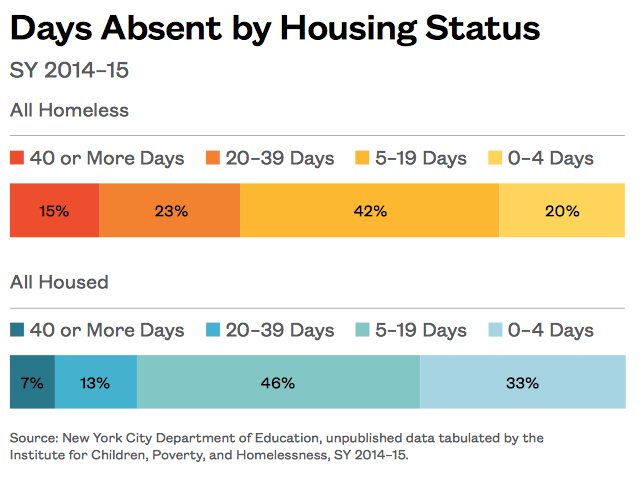
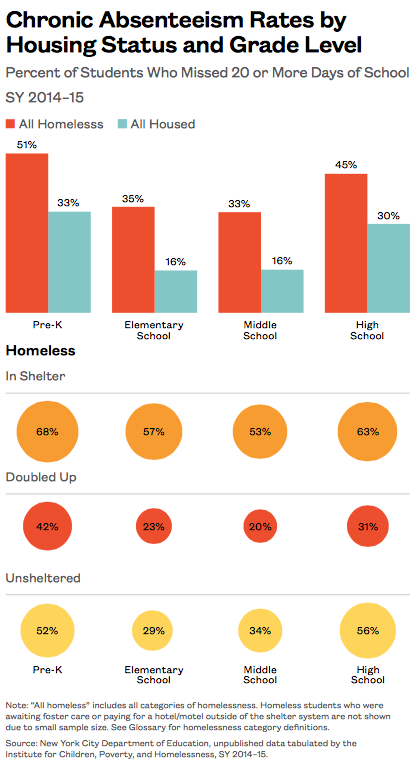
- Chronic absenteeism is one of the strongest predictors of student achievement and graduation.3 Homeless students were chronically absent, missing 20 or more days of school, at close to twice the rate of housed students overall (37% compared to 21%).
- More than one in seven homeless students (15%) missed 40 or more days of school—roughly 20% of the school year.
- Across grade levels, homeless students living in shelter had higher rates of chronic absenteeism than their homeless peers living doubled up.
xxx
xxx
Aftershocks of Homelessness on Grade-Level Proficiency
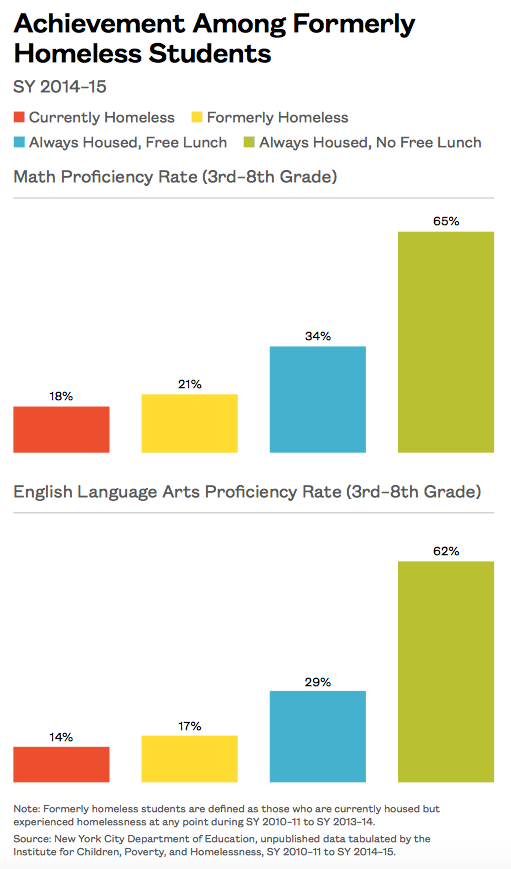
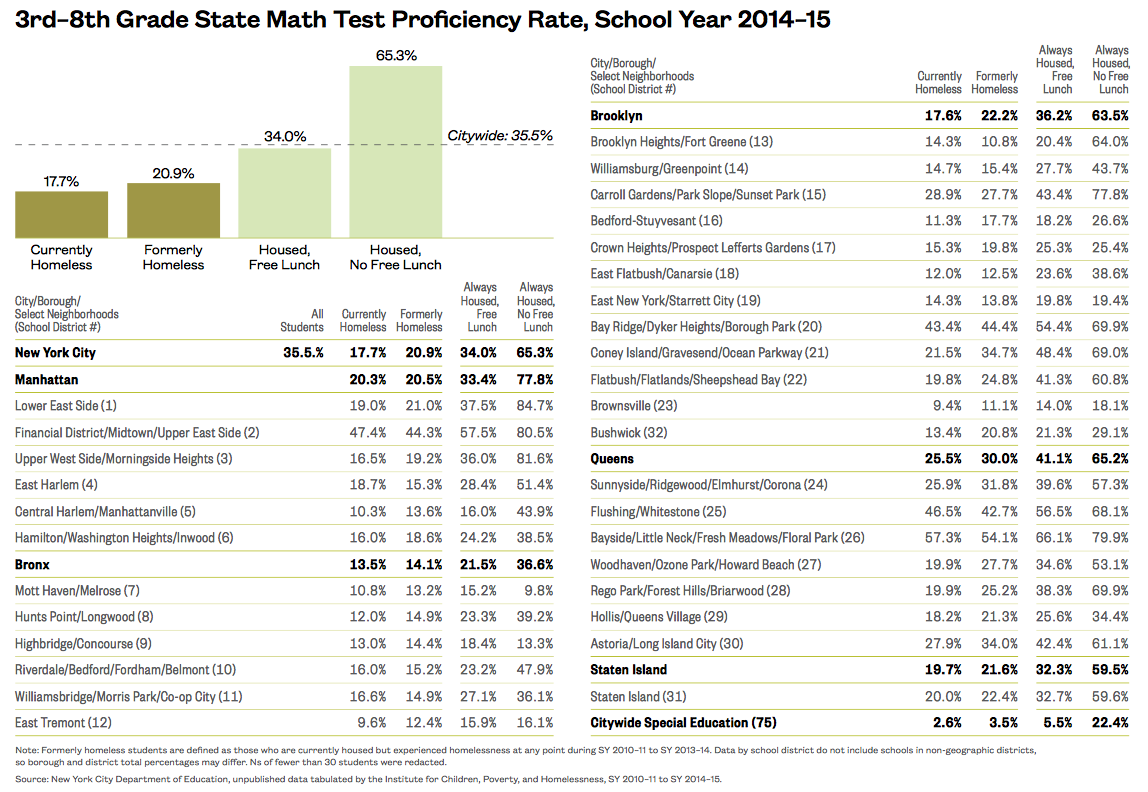
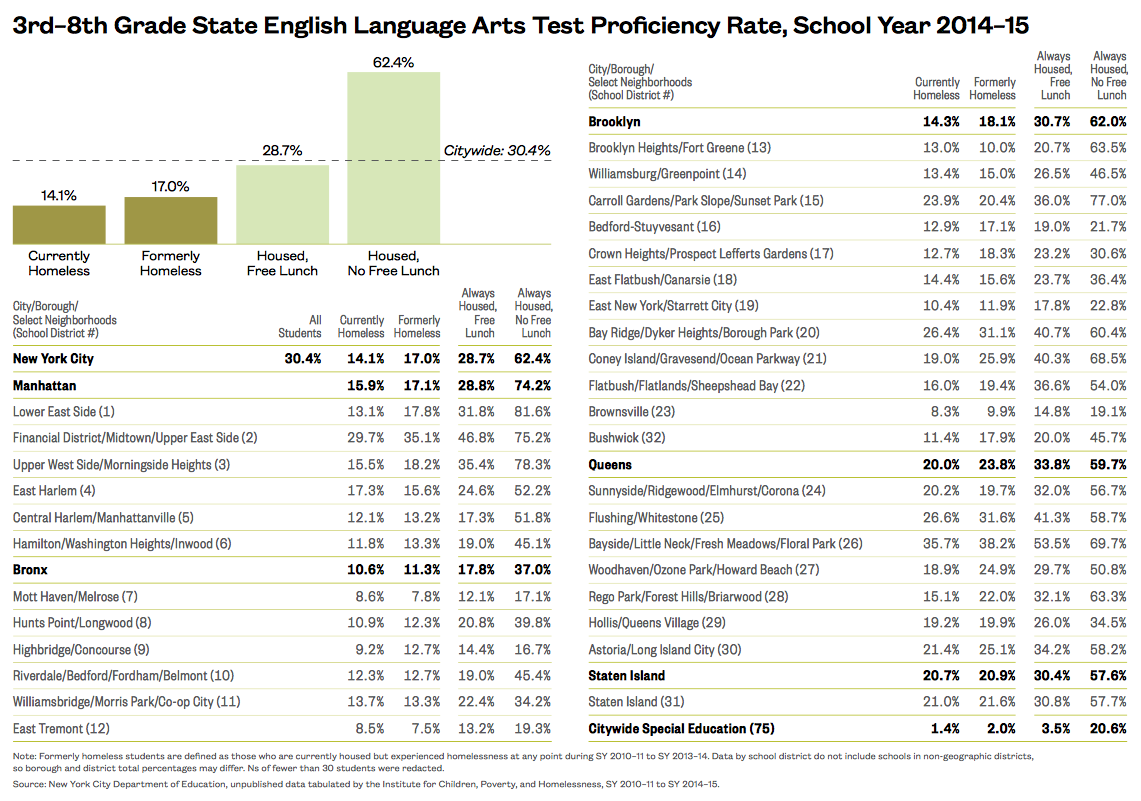
- Homelessness has a lasting impact on school achievement. In both English and math, students who were currently housed but had experienced homelessness (formerly homeless) met grade-level proficiency standards at rates that were almost the same as their currently homeless peers (18% compared to 21% respectively in math and 14% compared to 17% respectively in English).
- Across all school districts, formerly homeless students were grade-level proficient at rates that were lower than their peers who were low-income but had never experienced homelessness (always housed, eligible for free lunch). The gap in proficiency was on average 13 percentage points lower in math and 12 percentage points lower in English.
xxx
xxx
Left Back: Who Is Retained?
-
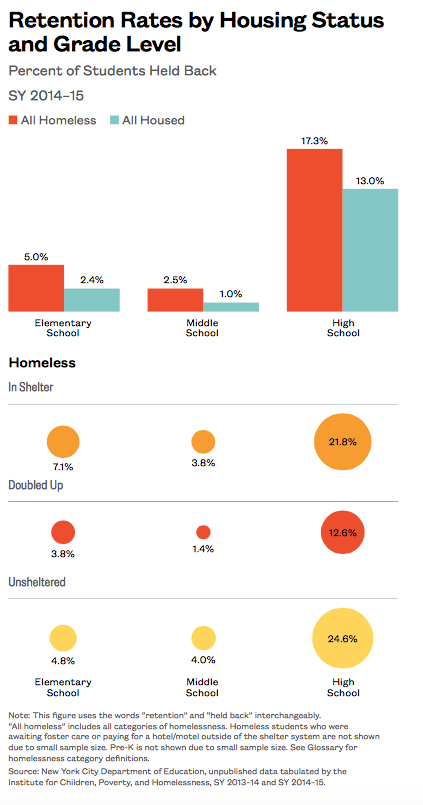
Homeless students were retained at higher rates than their housed peers across grade levels.
-
Among elementary students, those living in shelter had the highest rates of grade retention at 7%. This was over twice the grade retention rate of housed students overall.
-
High school homeless students saw the highest rates of grade retention at 17% compared to 13% for housed students overall. Retention rates were particularly high for high school students who were unsheltered and those who were homeless living in shelter (25% and 22% respectively).
xxx
xxx
Lasting Impact on Grade Retention
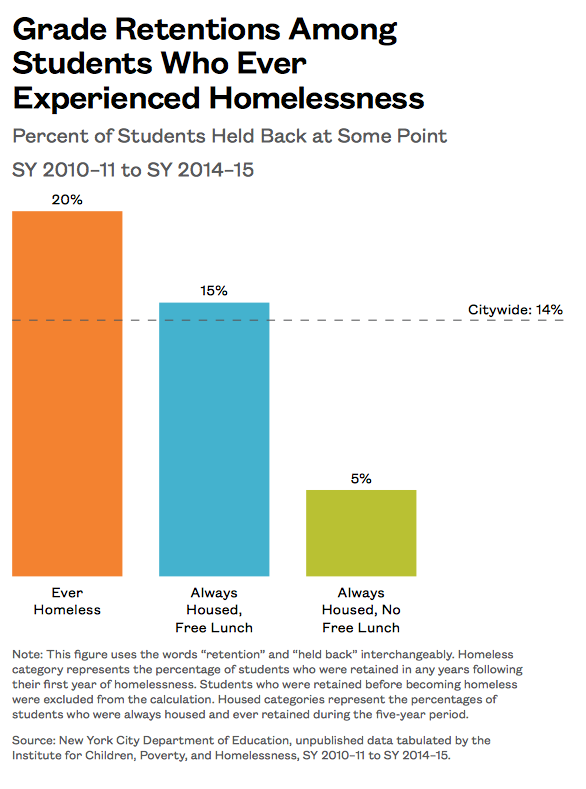
- Homelessness placed students at risk educationally even after housing instability was over.
- One out of every five students who experienced homelessness between SY 2010–11 and SY 2014–15 was retained after being homeless. This was four times the rate of students who were housed and not low-income (5%).
xxx
xxx
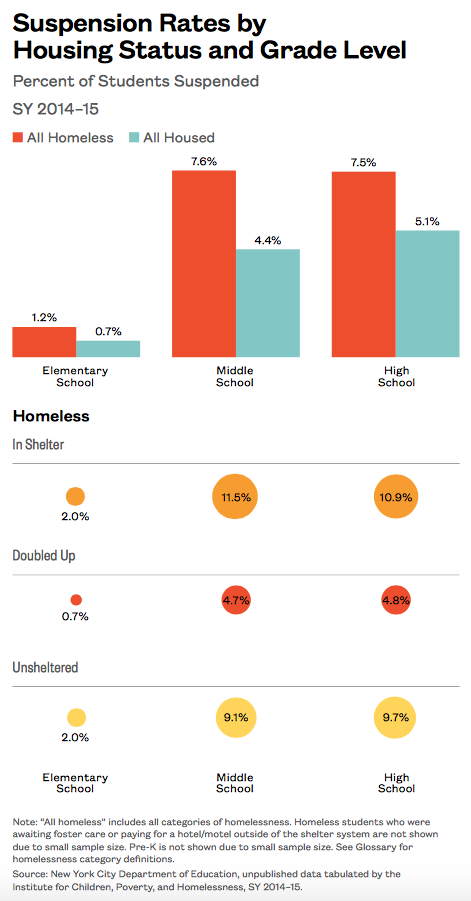
Unequal Discipline: Who Is Suspended?
-
Across grade levels, homeless students experienced higher rates of suspension than their housed peers.
-
This was particularly true for homeless students living in shelter, who were suspended at over two times the rate of their housed peers.
-
Middle school students living in shelter saw the highest rate of suspension with one out of every nine students suspended.
xxx
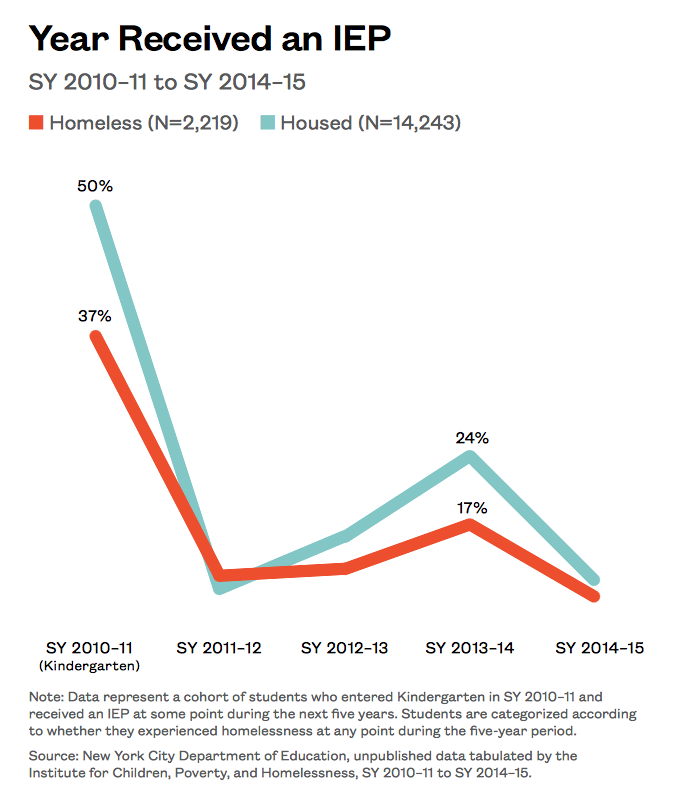
Overlooked: Who Receives Late IEPs?
-
The Individualized Education Program (IEP) is a mandated plan outlining the special education services a student will receive to support their learning while facing challenges within one of 13 disability categories such as speech/language impairment and learning disabilities. Districts are legally required under the Child Find law to identify and evaluate all children with disabilities.4
-
Over 36,500 students with special needs experienced housing instability between SY 2010–11 and SY 2014–15. These students face many challenges, and key among these is the early identification and receipt of services to meet their individual educational needs.
-
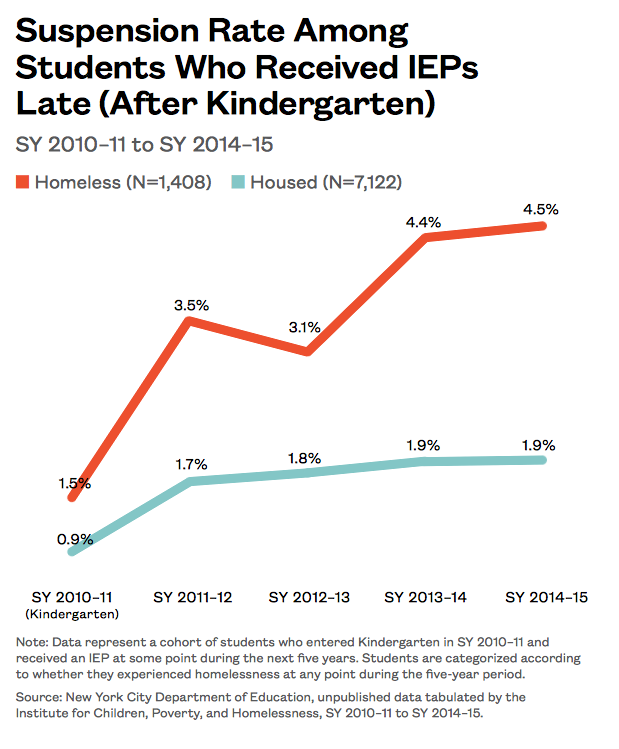
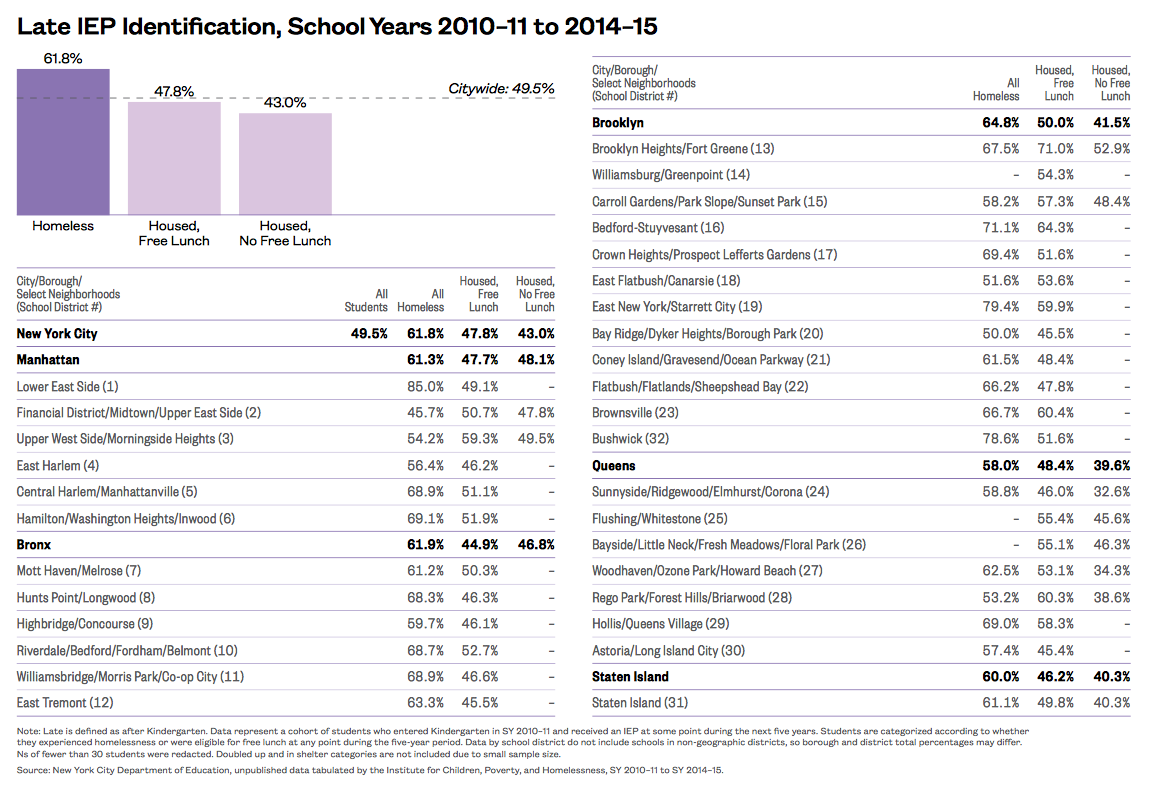
Only one-third of homeless students with an IEP were identified for their IEP by the end of Kindergarten compared to half of housed IEP students.
xxx
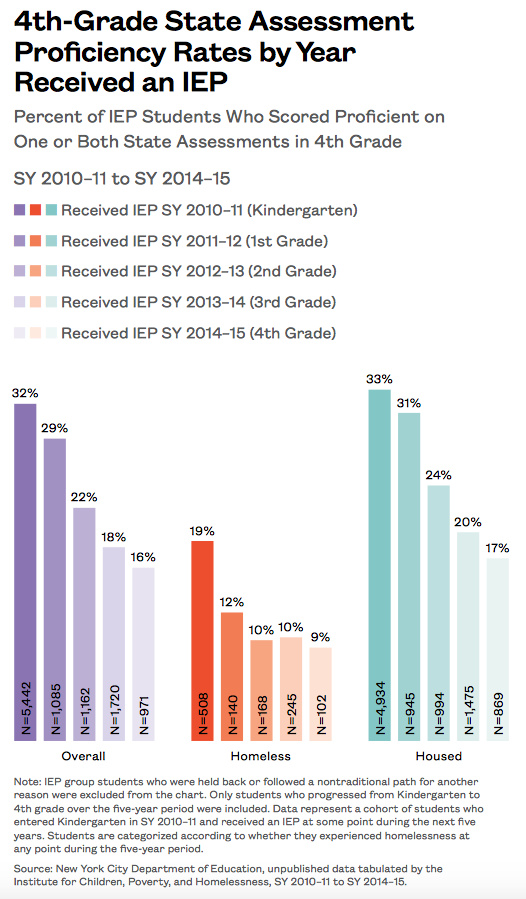
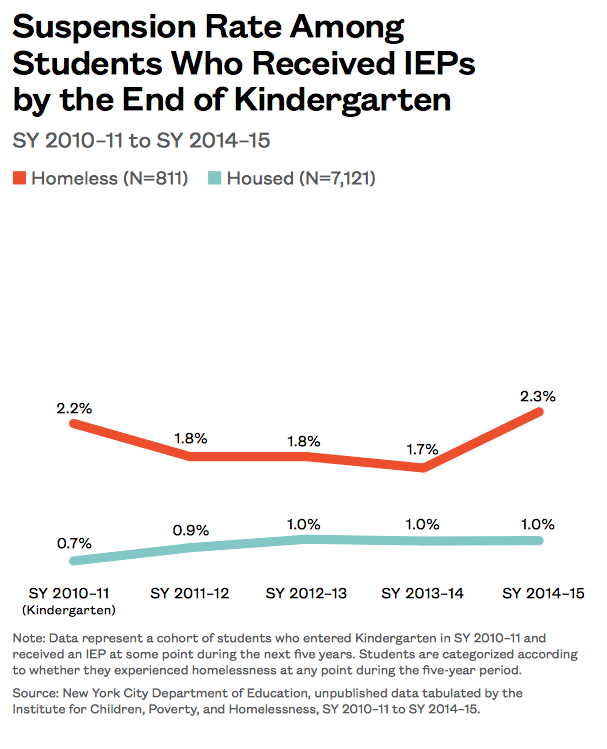
Early Intervention Matters
-
Connecting homeless students with needed supports can increase educational success. Homeless students who receive IEPs early are more likely to achieve grade-level proficiency and less likely to be suspended.
-
Homeless special needs students who had IEPs by the end of Kindergarten were twice as likely to score proficient on 4th-grade State assessments (19% compared to 9%).
-
When homeless students’ IEP needs were identified by Kindergarten, suspension rates were roughly half those of their homeless peers identified later.
xxx
Defying the Odds in High School: Who Is Dropping Out and Who Is Graduating?
-
Homeless students living in shelter during all four years of high school dropped out at rates that were statistically no different than their housed peers.
-
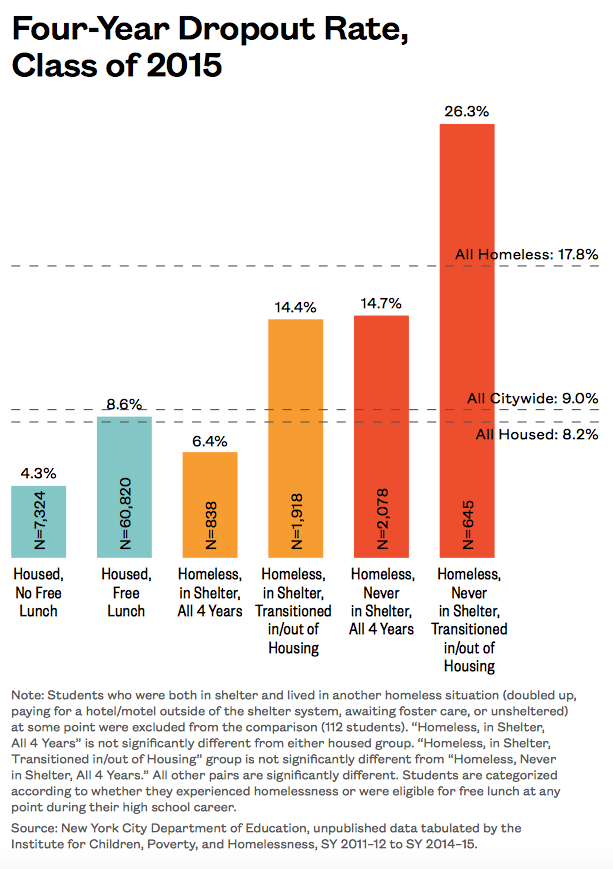
Only 6% of students who were homeless and living in shelter during all four years of high school dropped out. This falls between the dropout rate for low-income and non-low-income housed students (9% and 4%).
-
The dropout rate for students who were homeless for all four years of high school but never entered a City shelter was over twice the rate of students living in shelter for all four years (15% compared to 6%).
-
Transitions into and out of permanent housing appear to have the greatest negative impact on students, doubling dropout rates when compared to peers in similar settings who experienced no transitions.
-
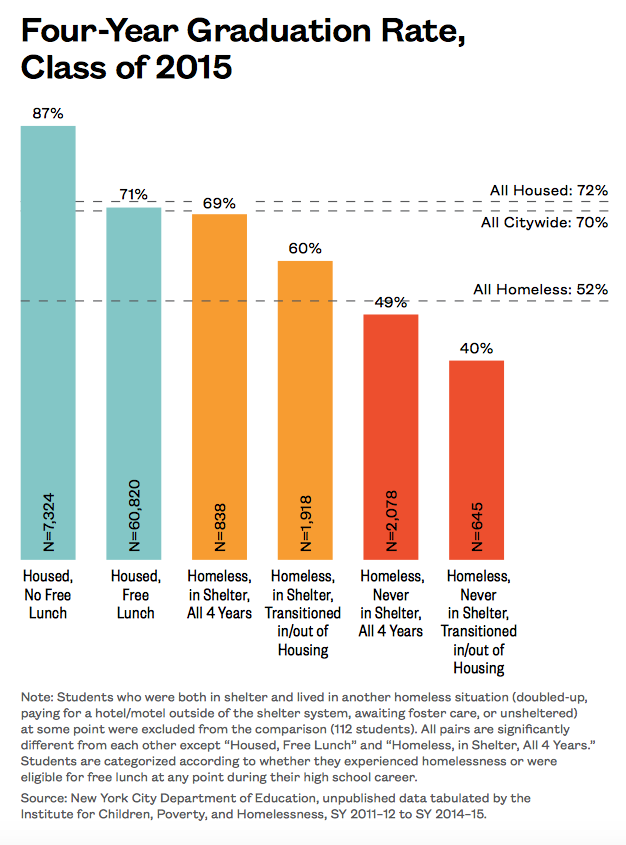
Graduation rates for students who were homeless and living in shelter all four years were essentially the same as the rates for low-income housed students (69% and 71% respectively).
-
Homeless students living in other homeless situations, particularly those who experienced a transition into or out of permanent housing, had the lowest four-year graduation rate—40%.
xxx
The Geography of Student Homelessness
While homeless children attend schools in every district, homelessness is not equally distributed across the city. Dramatic differences are evident between districts, adjoining schools within districts, and even among schools co-located within the same building. This section provides information on the geographic distribution of homelessness among students in New York City and how patterns differ by the types of homelessness children experience. Additionally, this year’s Atlas of Student Homelessness explores mid-year transfer patterns, late enrollment, and the funding challenges these create.
- For every student living in shelter, there were two more homeless students living in some other temporary situation. The majority of these students were living doubled up.
- Over 15,000 homeless students attended just two school districts in the Bronx.
- The top five school districts for the number of homeless students transferring mid-year were all in the Bronx.
- One out of every five students who transferred school mid-year in SY 2014–15 was homeless.
- Over 33,000 students enrolled after October 31, the official enrollment count date; 22% of these students were homeless compared to 8% of students overall.
- Many school districts face the dual challenges of high homelessness and late enrollment, creating additional strain on limited school funding.
xxx
Where Are Homeless Students?
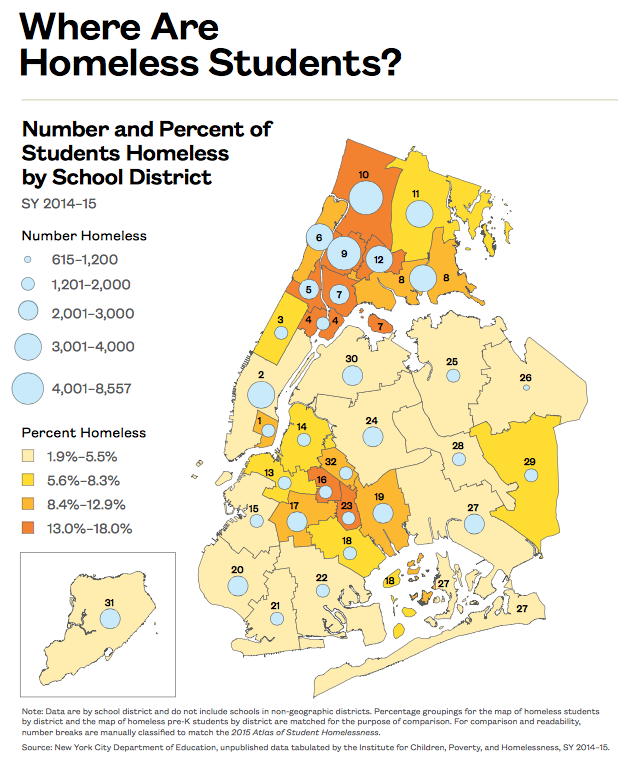
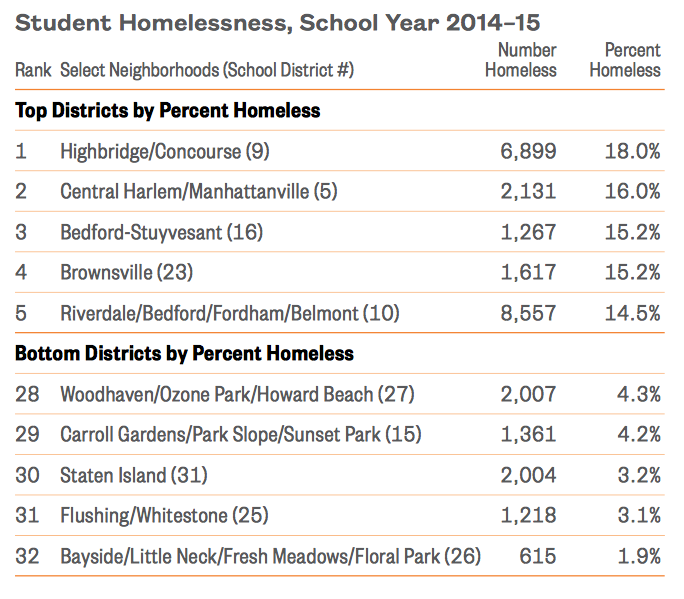
- Homeless students attended school in every school district in New York City in SY 2014–15 with an average of 8% of students homeless citywide.
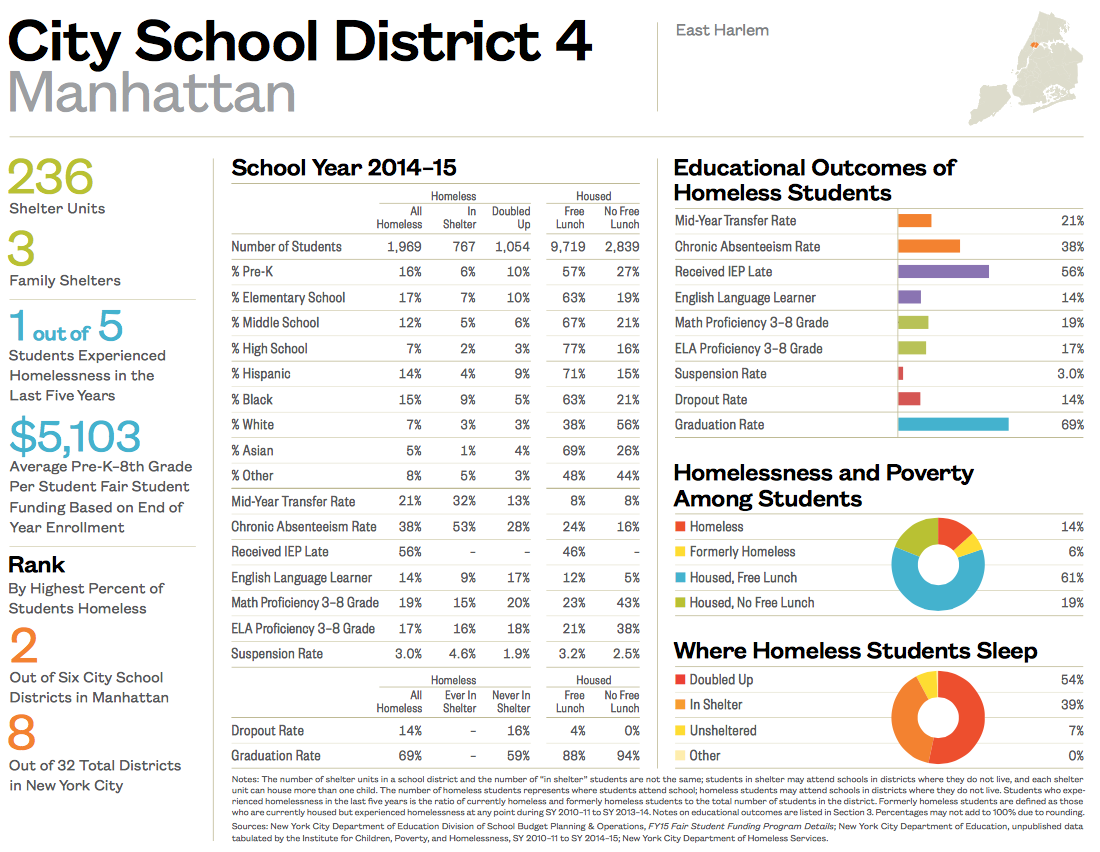
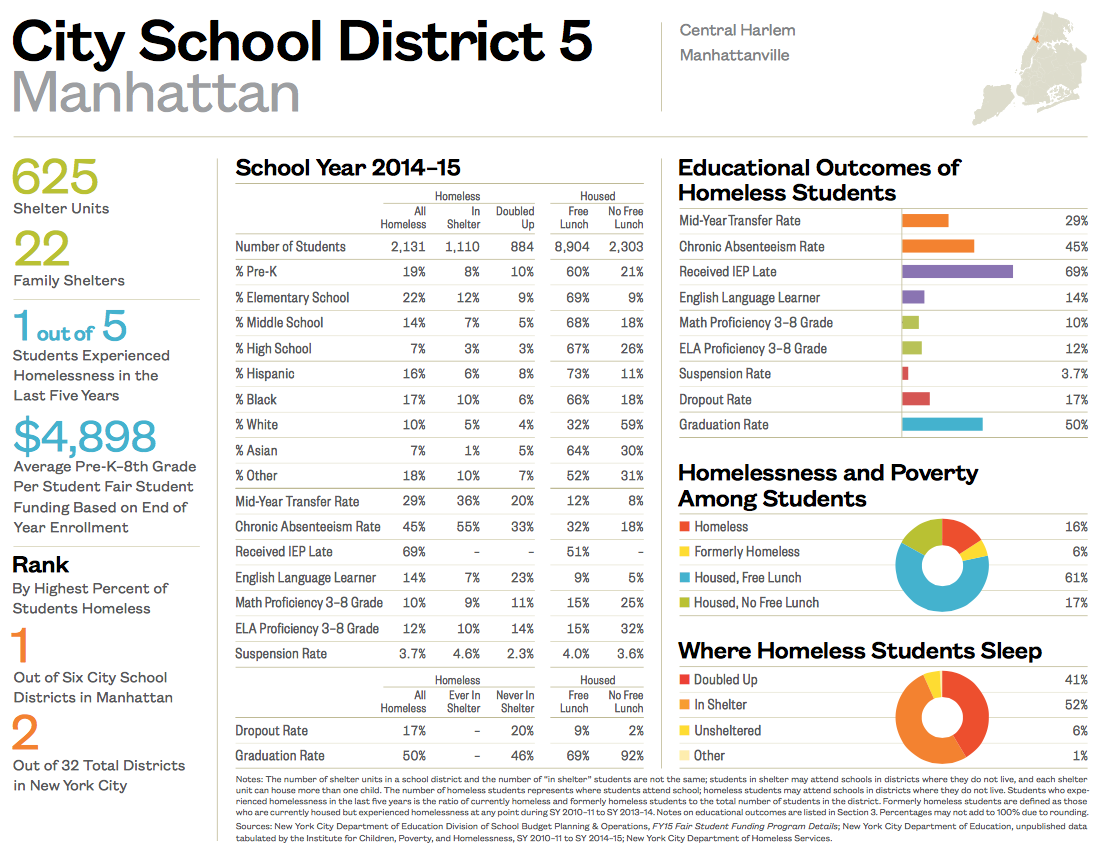
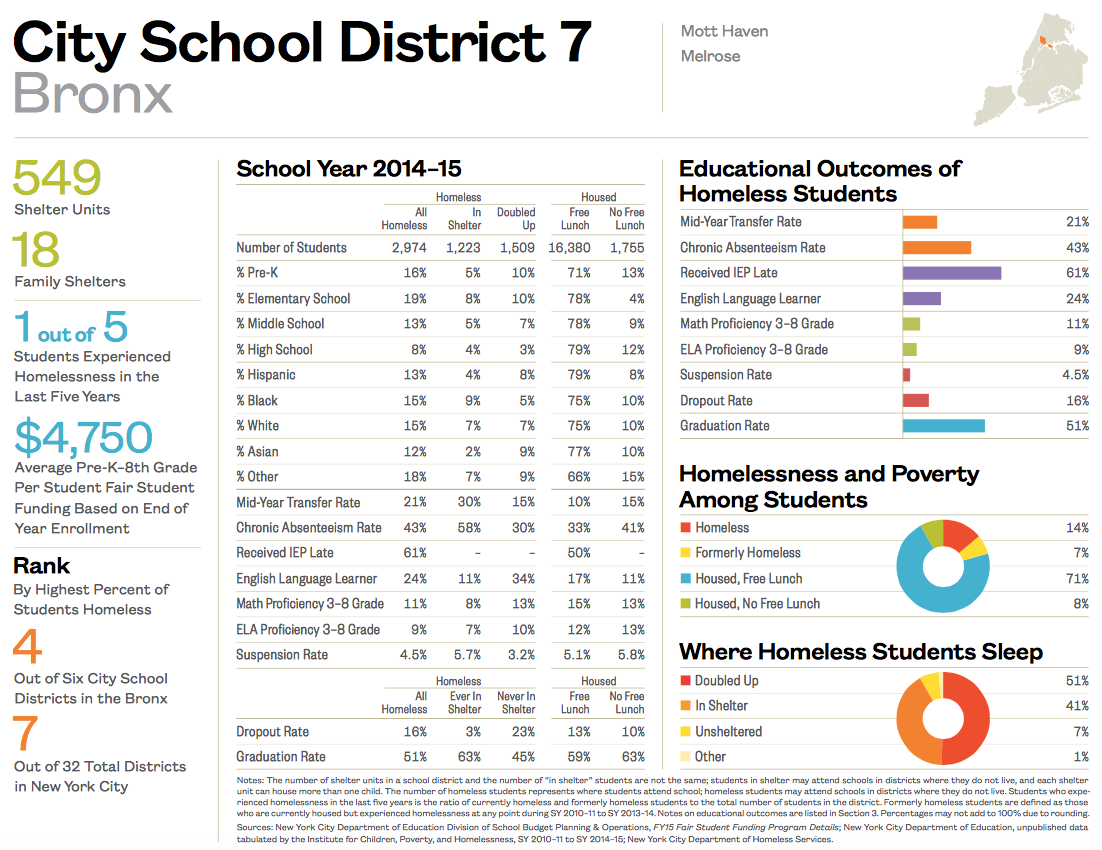
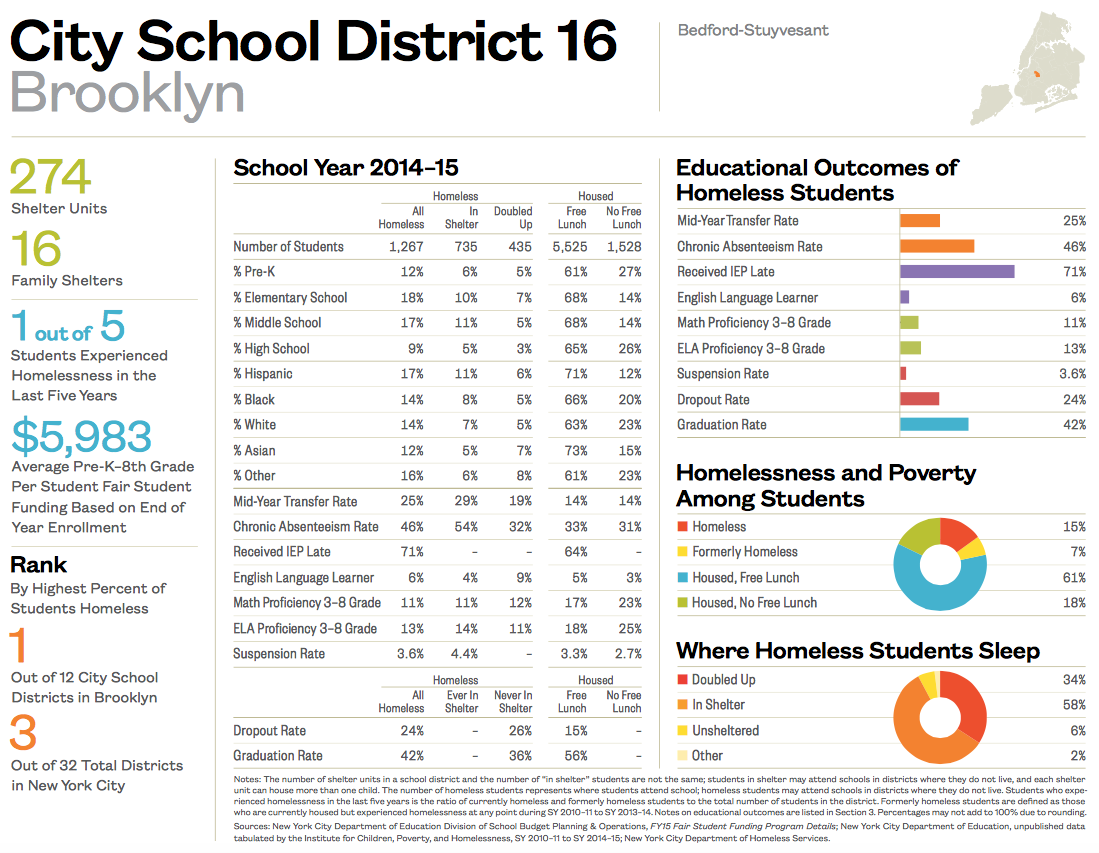
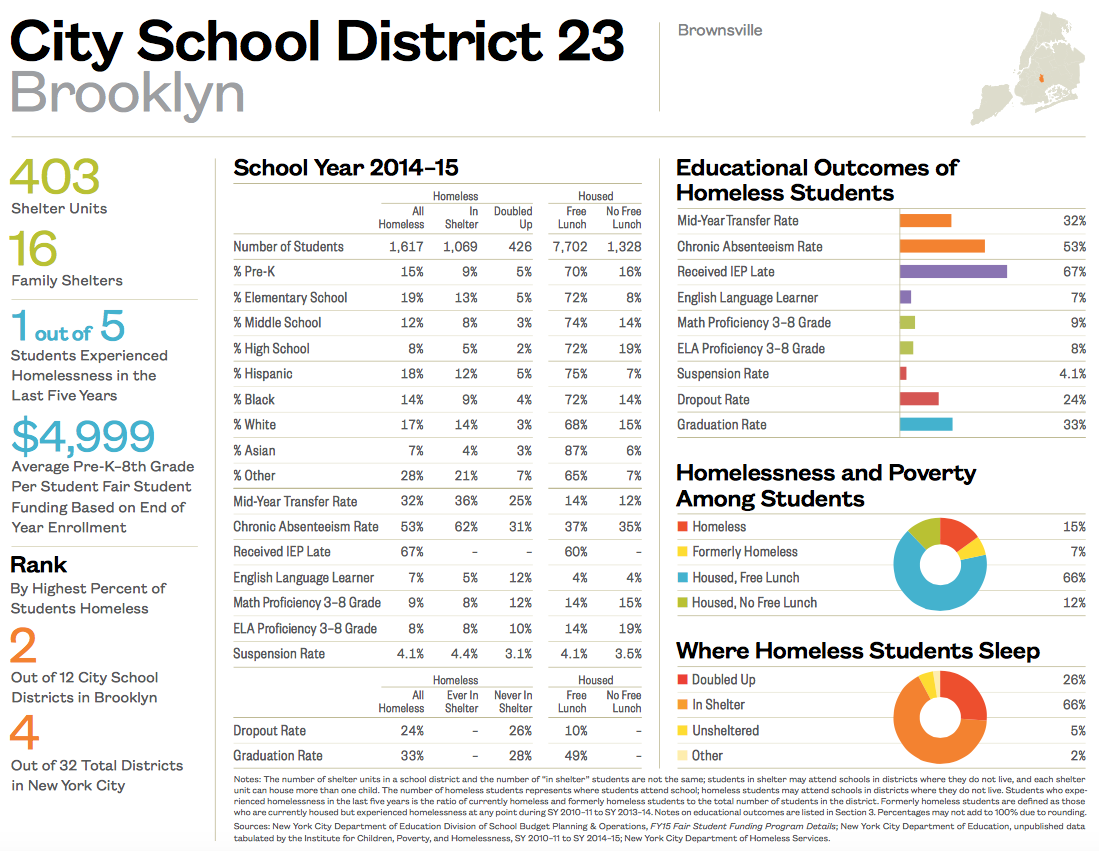
- In eight school districts between 13% and 18% of students were homeless. These districts included East Harlem, Central Harlem, Mott Haven, Highbridge, East Tremont, Fordham, Bedford-Stuyvesant, and Brownsville (Districts 4, 5, 7, 9, 10, 12, 16, and 23).
- Over 15,000 homeless students attended just two school districts in the Bronx (Districts 9 and 10), encompassing the Highbridge/Concourse neighborhoods north through the Fordham, Belmont, and Bedford areas of the Bronx.
xxx
Differences in Pre-K Enrollment
xxx
-
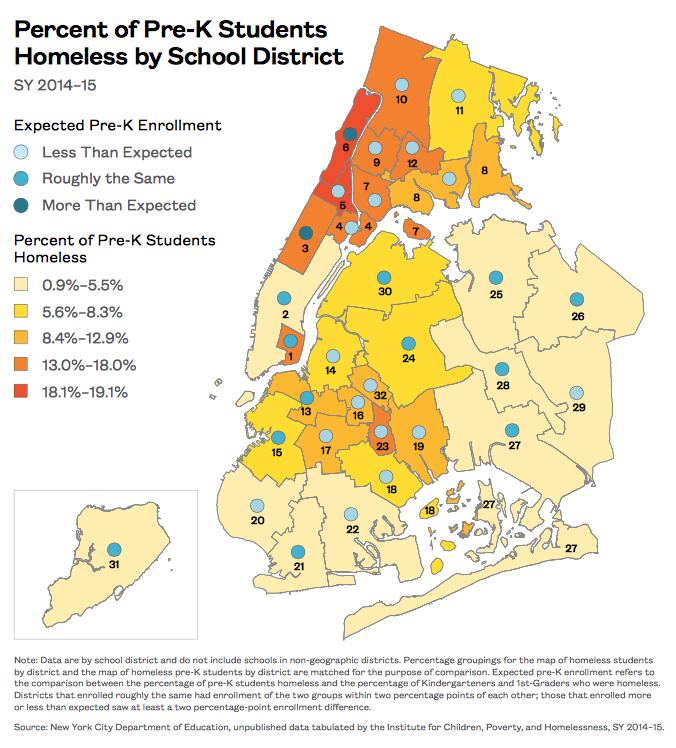
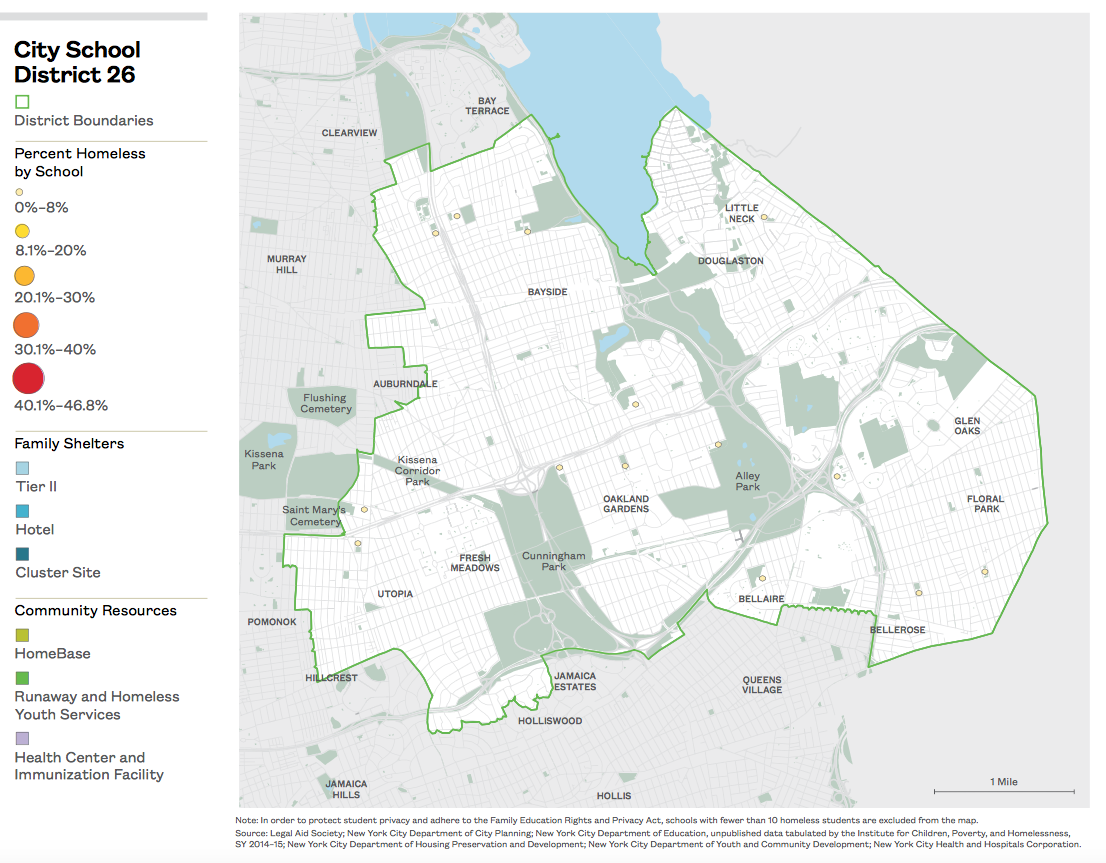
On average, 8% of pre-K students were homeless in SY 2014–15, ranging from 1% in Bayside, Queens (District 26) to 19% in Central Harlem (District 5).
-
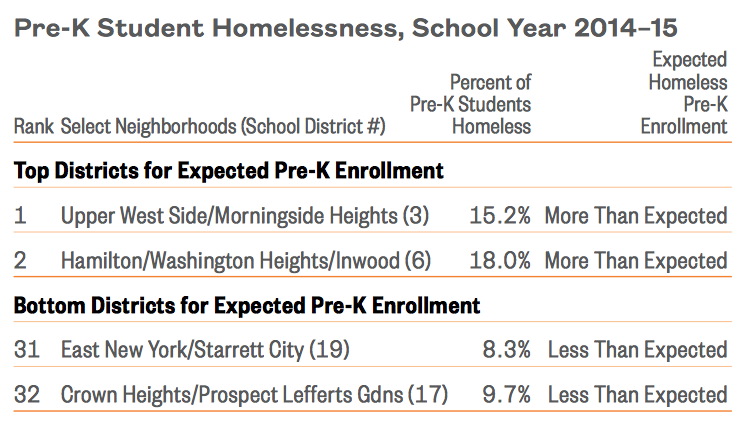
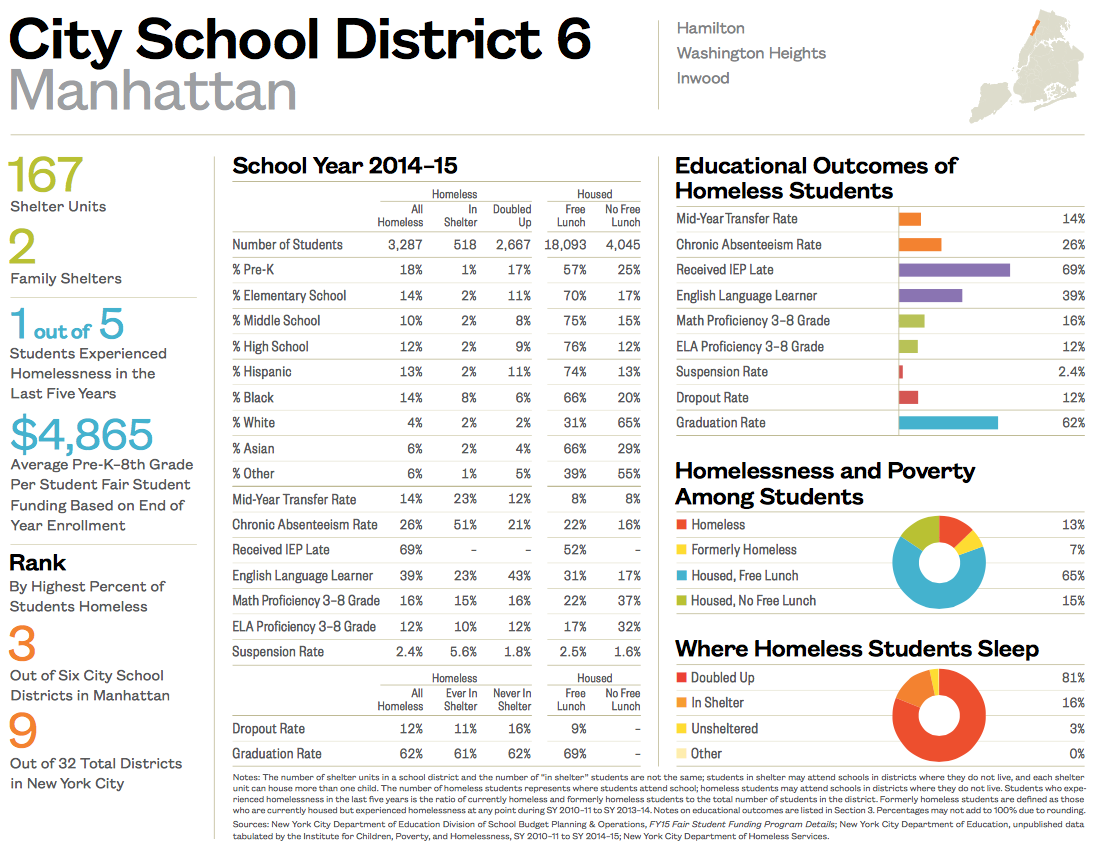
Only two school districts enrolled more homeless pre-K students than expected based on the percentage of homeless Kindergarten and 1st-grade students enrolled in their district. These districts included the Upper West Side and Washington Heights in Manhattan (Districts 3 and 6).
-
The majority of school districts enrolled fewer homeless pre-K students than would be expected. The two districts with the largest gaps were Crown Heights and East New York in Brooklyn (Districts 17 and 19).
xxx
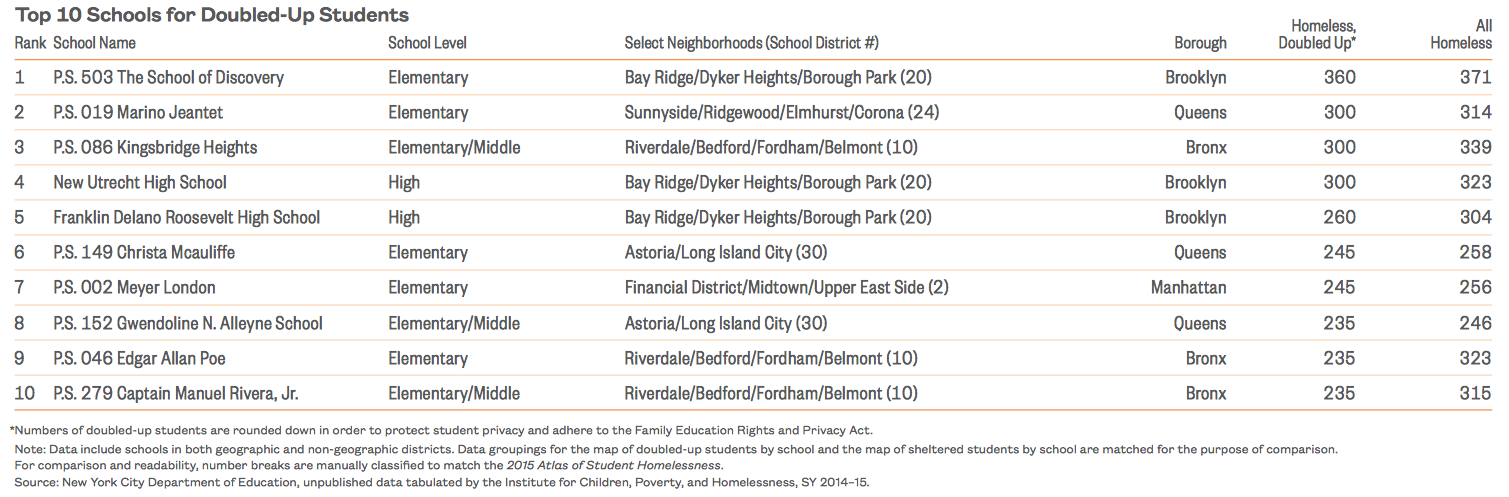
Where Sheltered and Doubled-Up Students Go to School
- Doubled-up students attended schools across the city, including many areas with no family shelters. This pattern was particularly noticeable in areas of Queens and southern Brooklyn.
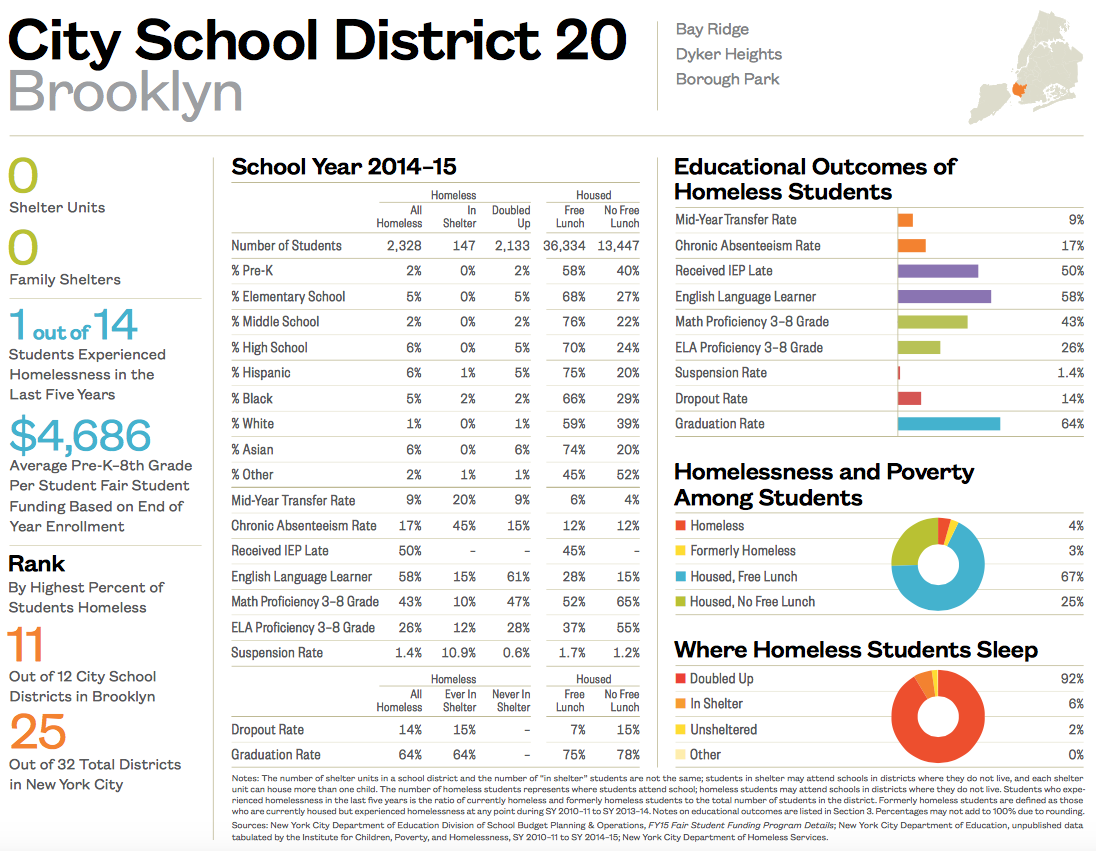
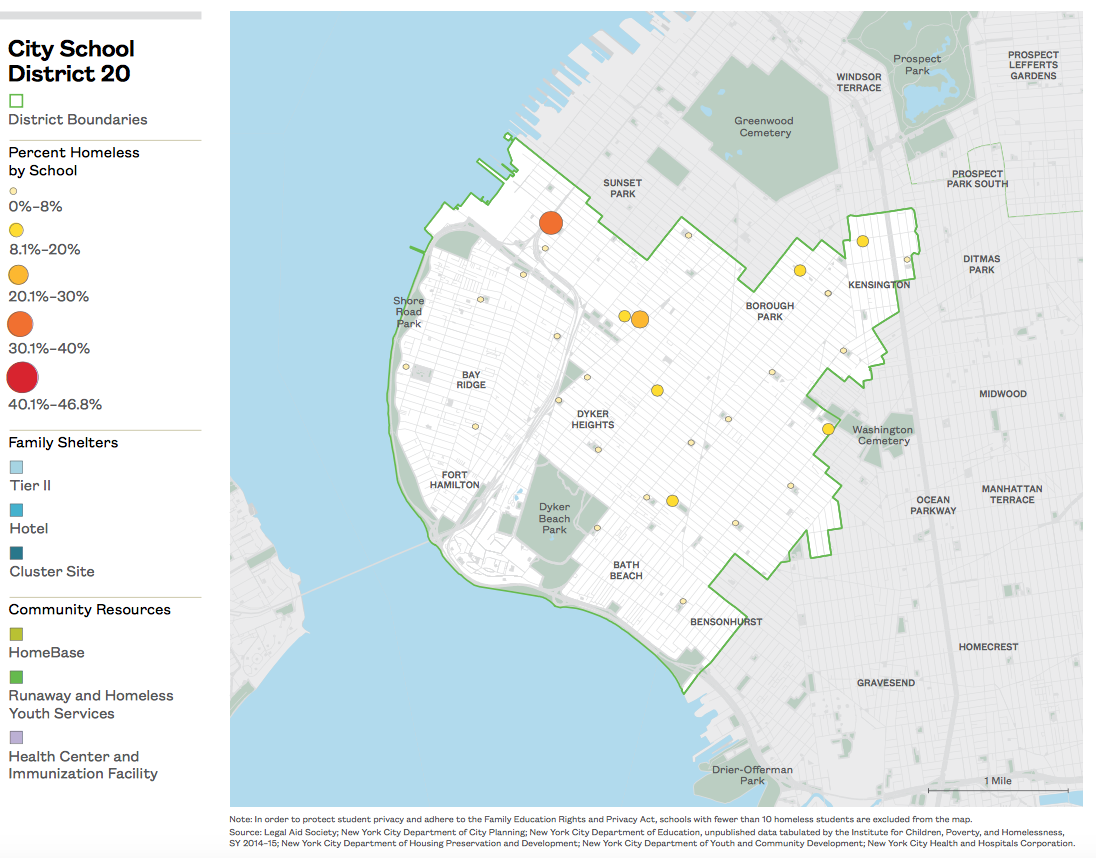
- P.S. 503, The School of Discovery, in Bay Ridge (District 20) had over 360 doubled-up students. This was the largest number of doubled-up students enrolled in any school in New York City in SY 2014–15.
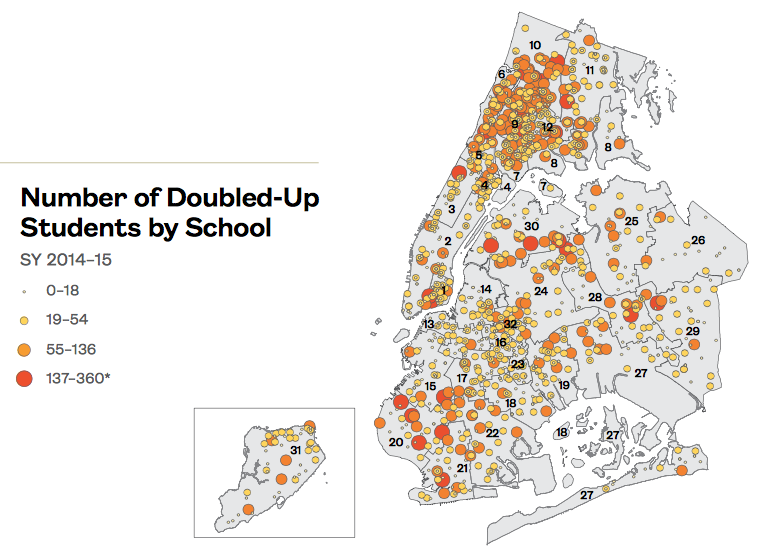
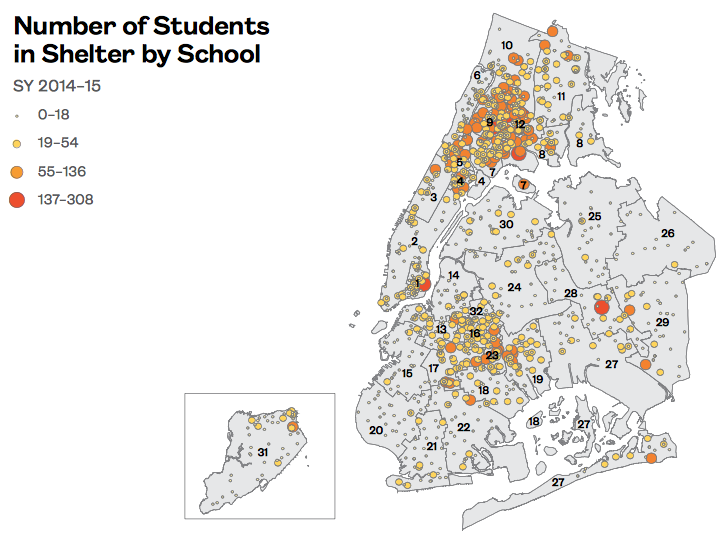
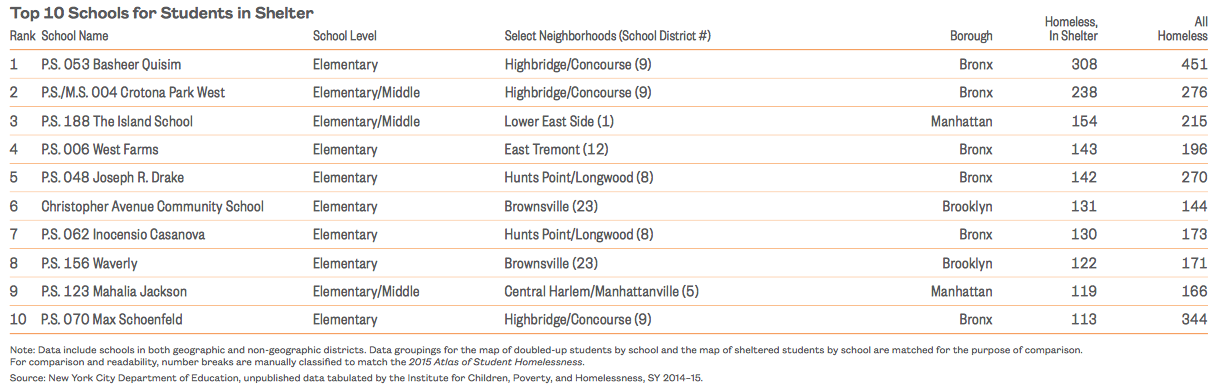
- The schools that homeless students living in shelter attended continued to be clustered in northern Manhattan, the south and west Bronx and central Brooklyn. This pattern mirrors the locations of City shelters, suggesting that homeless students in shelter are often unable to remain in their school of origin.
- P.S. 053, Basheer Quisim Elementary School, in Highbridge/Concourse (District 9) had over 300 homeless students living in shelter enrolled. This was the largest number of any school in New York City in SY 2014–15.
xxx
Patterns of School Transfers Among Homeless Students
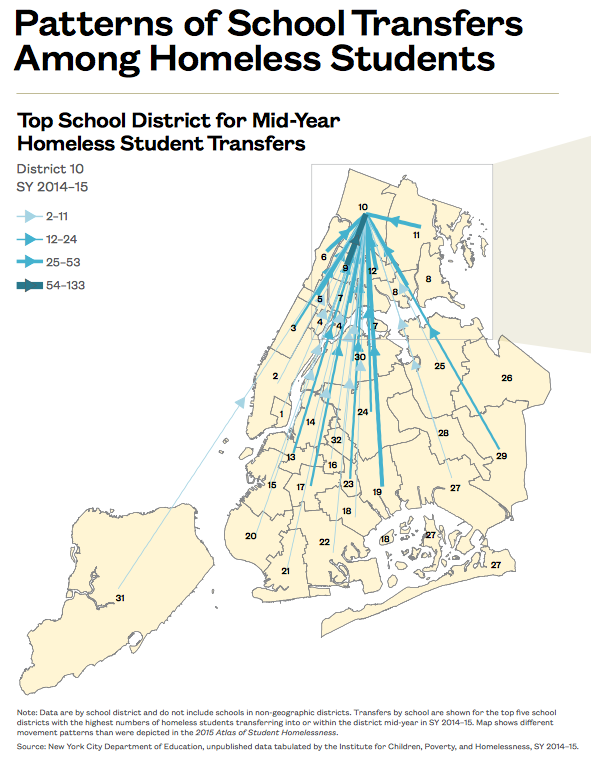
-
For homeless students, mid-year transfers are common. Over one out of every five homeless students transfers school mid-year.
-
Homeless students also represent a significant proportion of all mid-year transfers in New York City. One out of every five students who transferred school mid-year in SY 2014–15 was homeless, over two times the overall citywide rate of homelessness (8%).
-
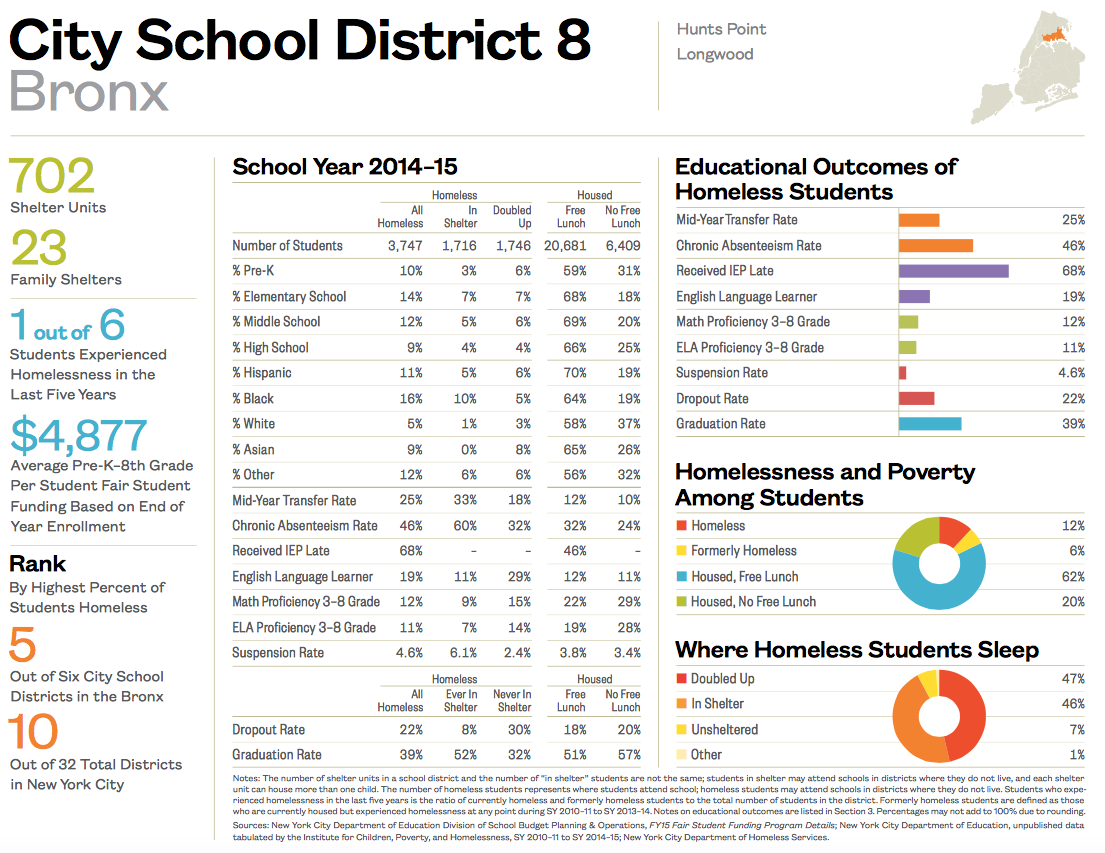
The top five school districts for the number of homeless students transferring mid-year were all in the Bronx (Hunts Point, Highbridge, Bedford, Williamsbridge, and East Tremont; Districts 8, 9, 10, 11, and 12).
xxx
xxx
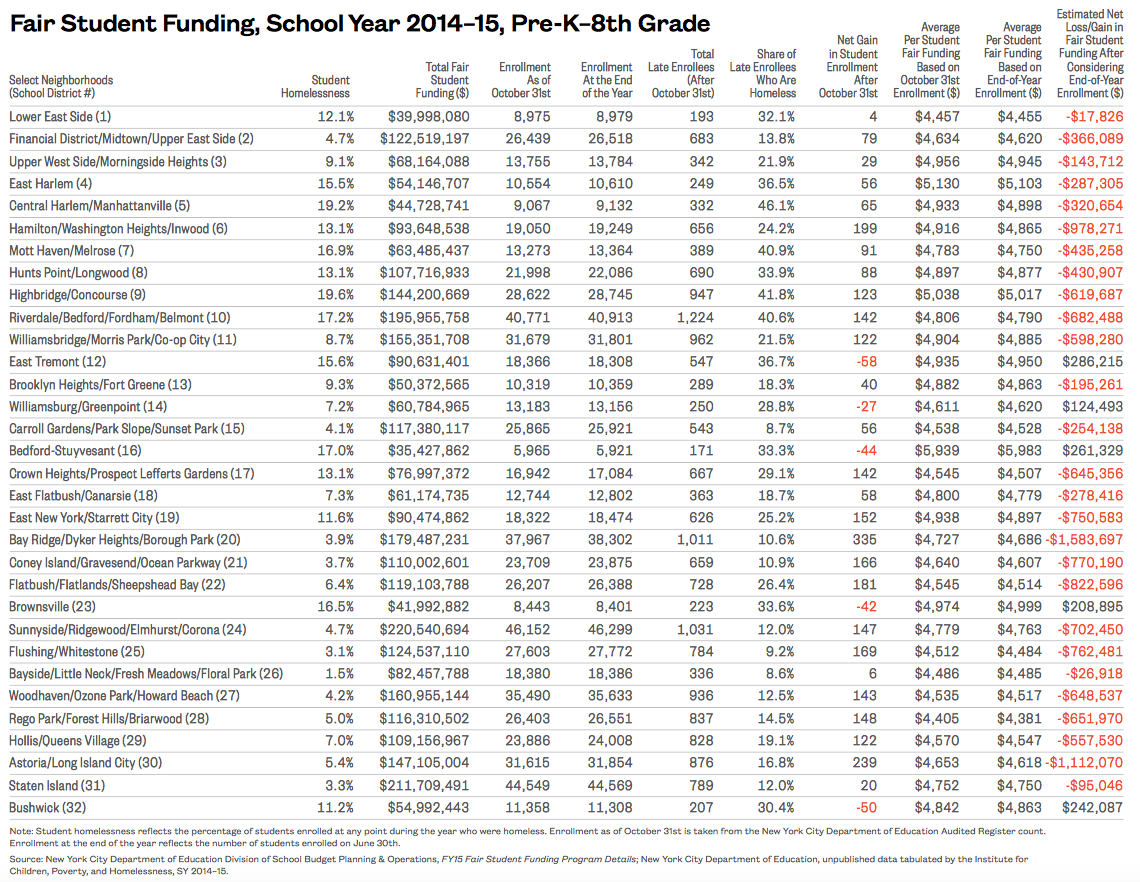
Late Enrollment Impacts Funding
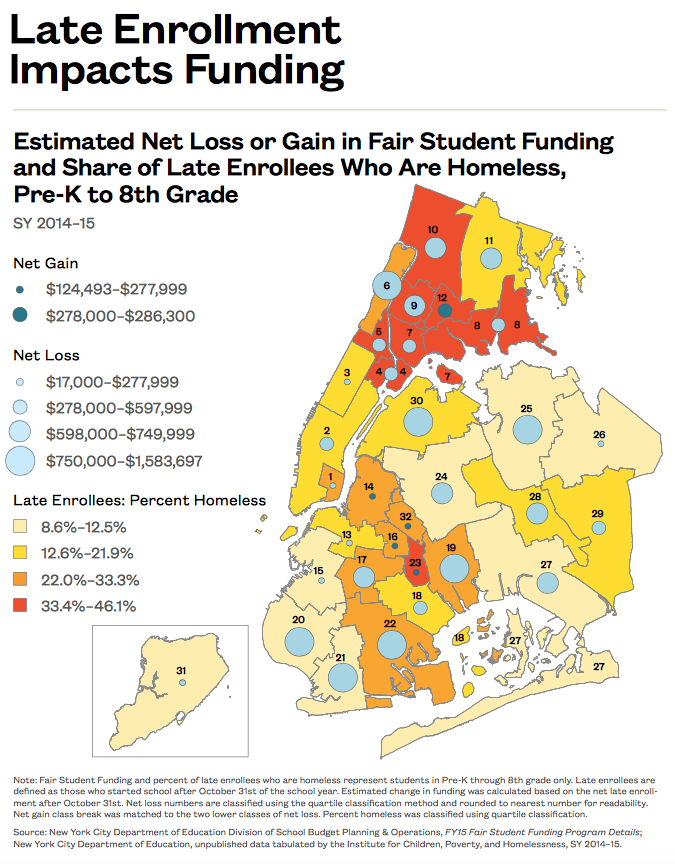
- More than 33,000 students, or roughly 3% of the total student population, enrolled in school late—after the October 31 official enrollment count. One-fifth of all of these students (22%) were homeless. This was a pattern consistent with prior years.
- The proportion of students who enroll late and are also homeless varies dramatically by district from a low of 9% in Carroll Gardens (District 15) to a high of 46% in Central Harlem (District 5).
- Many school districts face the dual challenge of high homelessness and late enrollment, which creates additional strain on limited school funding. Ten districts with higher than average student homelessness lost out on an estimated $287,000 to $1,000,000 in Fair Student Funding by the end of the year. These districts included East Harlem, Central Harlem, and Washington Heights in Manhattan (Districts 4, 5, and 6), Mott Haven, Hunts Point, Highbridge, Fordham, and Williamsbridge in the Bronx (Districts 7, 8, 9, 10, and 11), and Crown Heights and East New York in Brooklyn (Districts 17 and 19).
- The current Fair Student Funding formula for New York City does not factor in student homelessness as a variable to help level the playing field.
xxx
xxx
Educational Achievement of Homeless Students
Not having a consistent place to call home undermines a child’s sense of stability, making it difficult to succeed in school. Across grade levels, homeless students are more likely than their housed peers to transfer schools mid-year, have special education needs identified late, be chronically absent, and not meet grade-level standards in math and English. By high school, homeless students drop out at higher rates and graduate less often. While homeless students have consistently worse educational outcomes than both their low-income and non-low-income housed peers, a great deal of variation exists by school district and by the type of homelessness a child experiences. This section examines local differences in the educational outcomes of homeless students both across and within school districts. Building on the 2015 Atlas of Student Homelessness in New York City, Section 3 looks not only at homeless students in comparison to their housed peers, but also at the differences between homeless students living doubled up and those living in shelter. These differences highlight not only the challenges homeless students face, but also areas of success that can be shared and built upon among school districts.
-
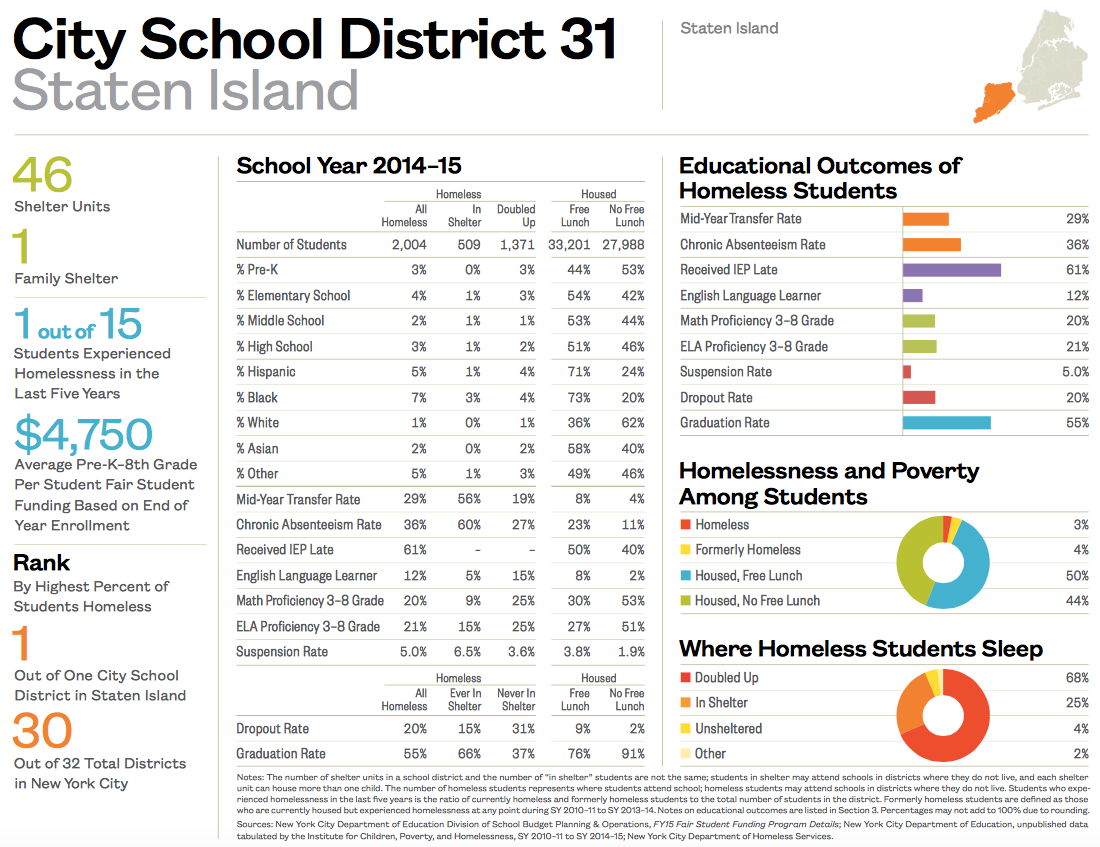
Staten Island (District 31) had the highest rate of mid-year transfers for homeless students living in shelter, with over half transferring schools compared to just 9% of all students citywide.
-
In seven school districts, more than 43% of homeless students were chronically absent, missing four weeks or more of school.
-
ELA proficiency among homeless students varied from 8% in Brownsville, Brooklyn to 36% in Bayside, Queens (Districts 23 and 26).
-
Sharply different rates of late IEP identification existed with a close to 40 percentage-point gap between homeless students in two adjacent Manhattan districts (1 and 2).
-
In eight school districts, homeless students were suspended at rates that were below the citywide average of 2.8%.
-
Only half of students who were homeless during high school graduated in four years and 18% dropped out compared to 71% and 9% citywide.
xxx
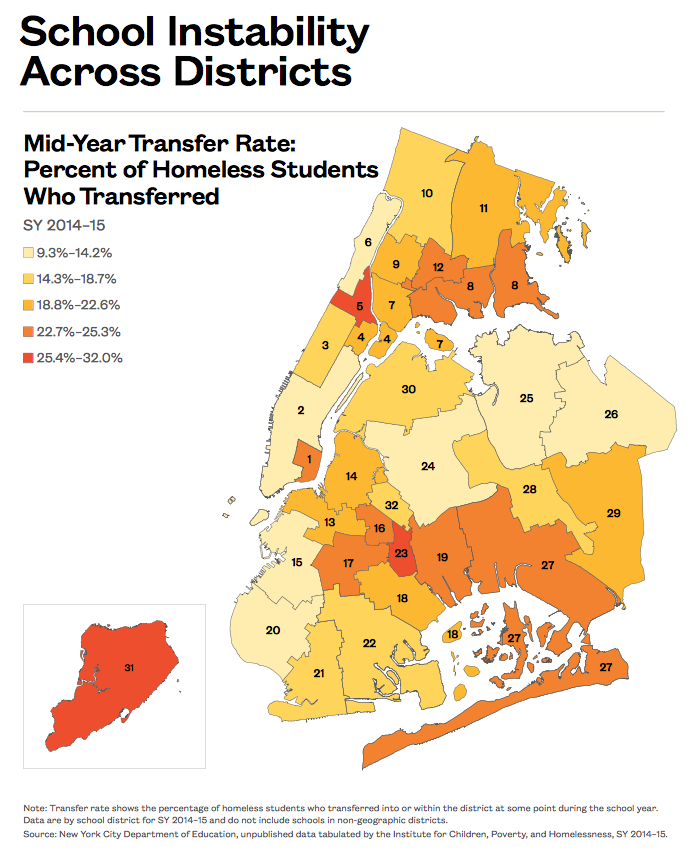
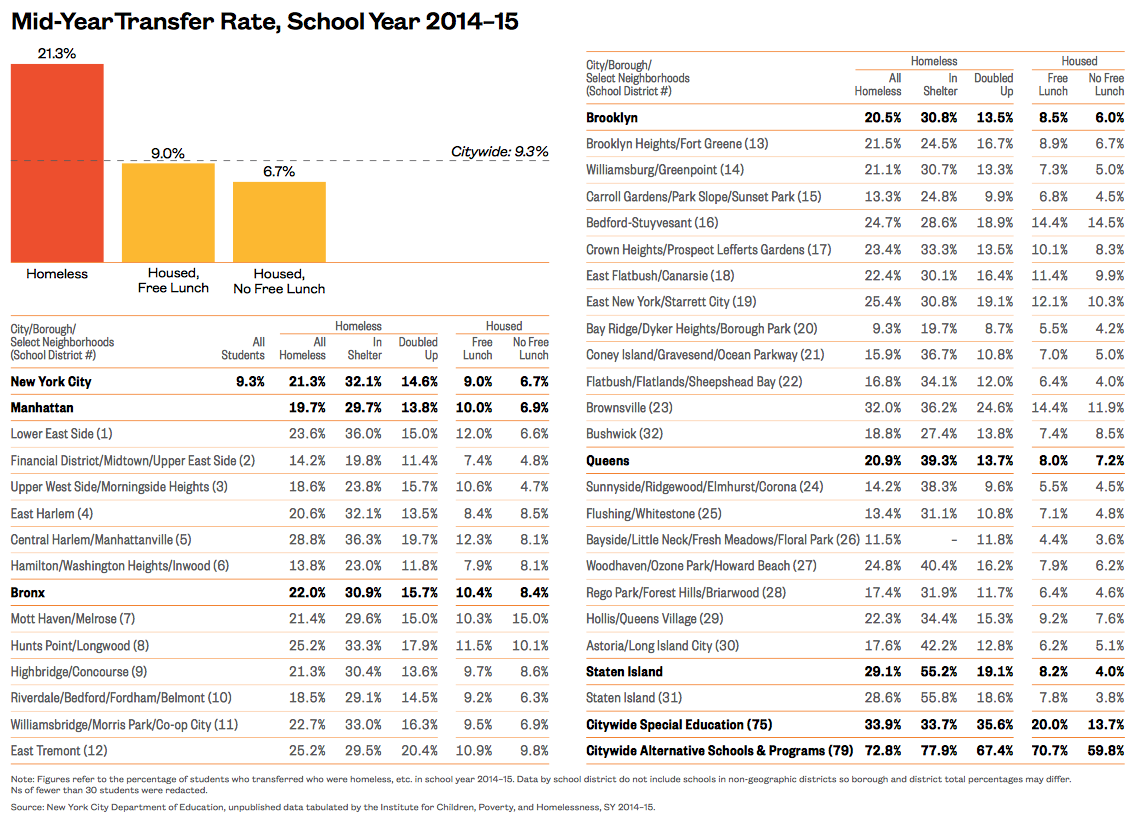
School Instability Across Districts
-
School stability is key to educational success, but many students face disruptive mid-year transfers. This disruption was most pronounced for homeless students, who transferred schools mid-year at two times the rate of their low-income housed peers and three times the rate of their non-low-income peers (21%, 9%, and 7% respectively).
-
Homeless students living in shelter had the highest mid-year transfer rate at 32%—twice the rate of their homeless peers living doubled up (15%) and more than four times the rate of their non-low-income housed peers (7%).
-
Mid-year transfer rates varied greatly by district, even among similar income and housing groups. Among homeless students living doubled up, transfer rates ranged from a low of 9% in Bay Ridge (District 20) to a high of 25% in Brownsville (District 23). Among homeless students living in shelter, 20% transferred in the Financial District in Manhattan and Bay Ridge, Brooklyn (Districts 2 and 20) compared to 56% in Staten Island (District 31).
-
Staten Island (District 31) had the highest rate of mid-year transfers for homeless students living in shelter, with over half (56%) transferring mid-year.
xxx
xxx
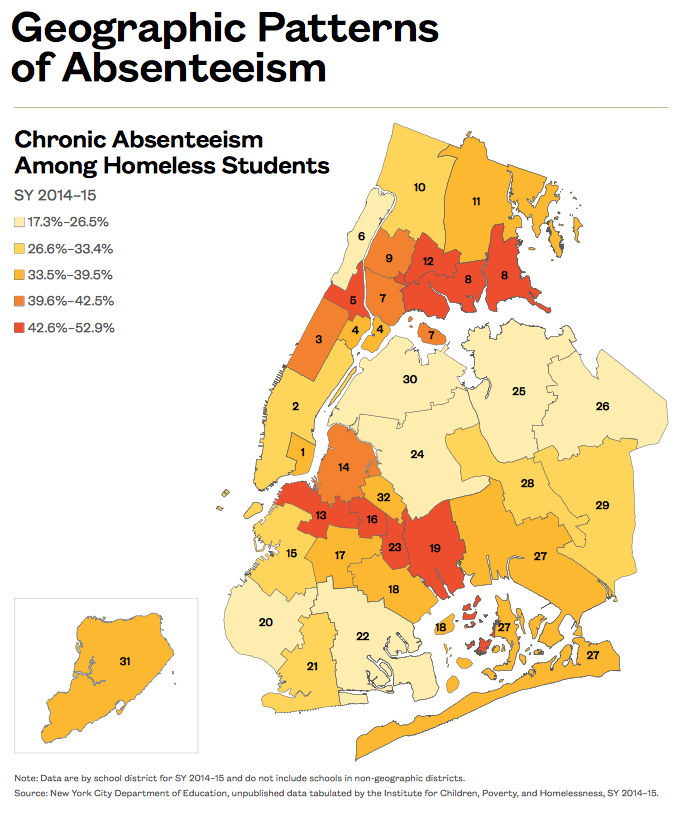
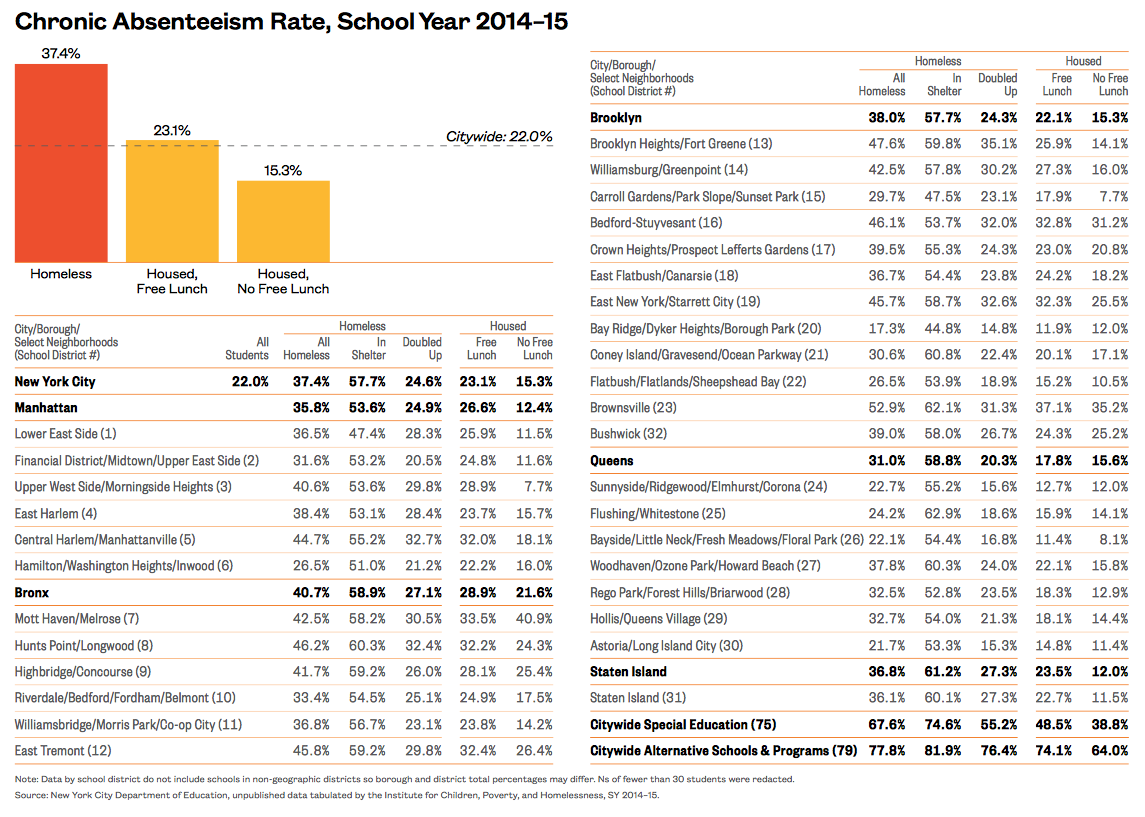
Geographic Patterns of Absenteeism
-
On average, 22% of students in New York City and 37% of all homeless students were chronically absent, missing 20 or more days of school in SY 2014–15.
-
Across all school districts, homeless students living in shelter had the highest rates of chronic absenteeism when compared to all other housing and income groups. Over half of students in shelter were chronically absent compared to 25% of their homeless peers living doubled up, 23% of their low-income housed peers, and 15% of their non-low-income housed peers.
-
The seven geographic school districts with the highest rates of chronic absenteeism among homeless students were: Hunts Point and East Tremont in the Bronx (Districts 8 and 12), Central Harlem in Manhattan (District 5), and Brooklyn Heights, Bedford-Stuyvesant, East New York, and Brownsville in Brooklyn (Districts 13, 16, 19, and 23). In each of these districts, over 43% of homeless students were chronically absent from school.
-
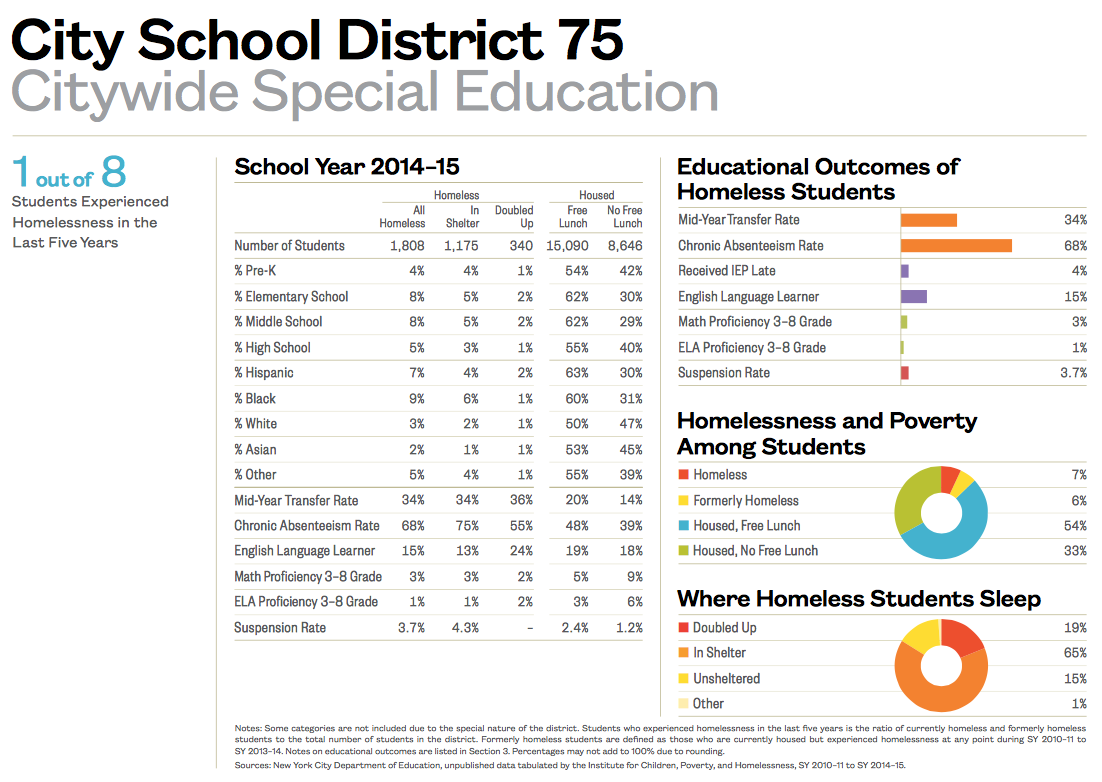
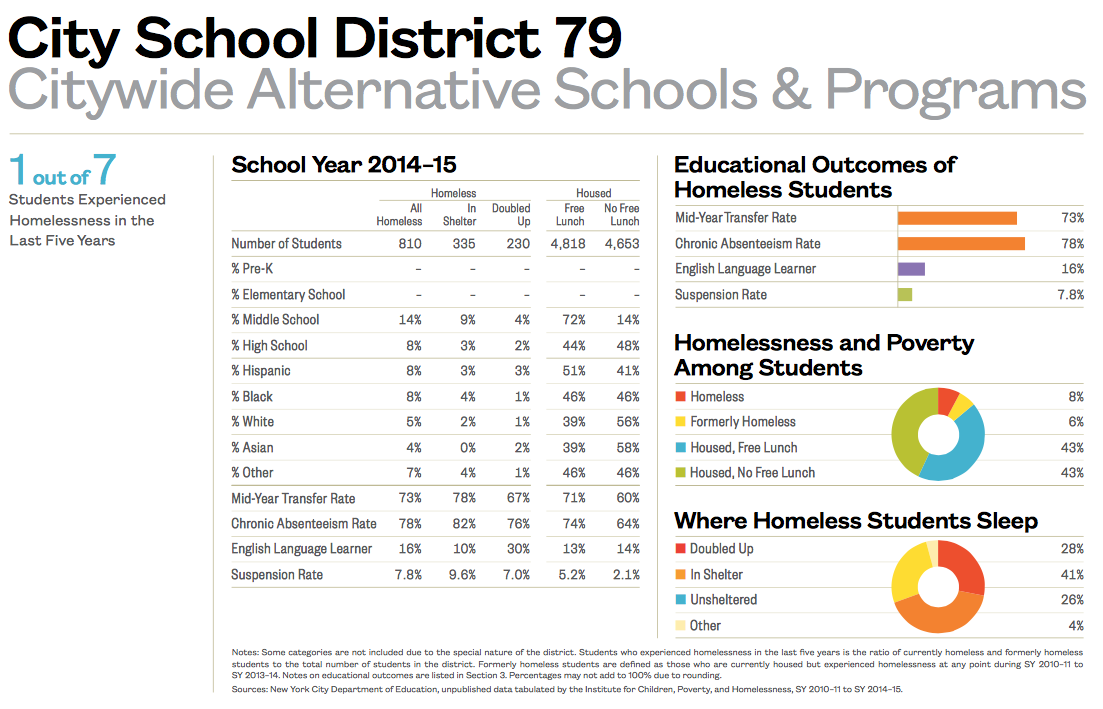
In New York City’s Special Education District (75) and Alternative Schools & Programs District (79), homeless students were particularly vulnerable to chronic absenteeism. More than two-thirds of all homeless students, and three-quarters of students living in shelter, missed 20 or more days of school.
xxx
xxx
Identifying Students in Need of IEPs
xxx
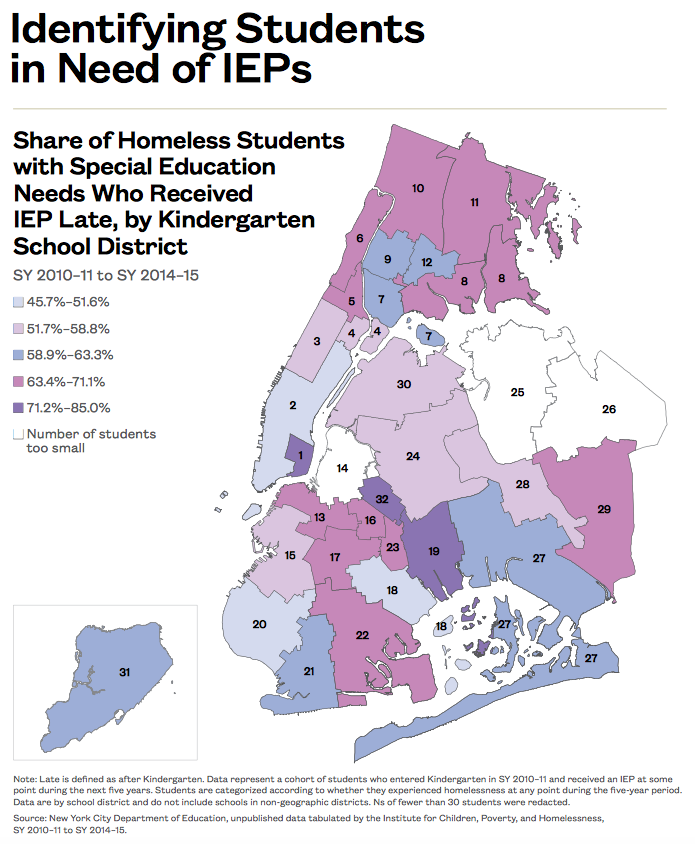
Early identification of special education needs is critical to the success of all students. Citywide, half of students (50%) with special education needs received theirIndividual Education Plan (IEP) late, after Kindergarten.
-
Homeless students were more likely than their housed peers to receive their IEP late. Among homeless students with IEPs, 62% received their IEP after Kindergarten compared to 48% of low-income housed students and 43% of non-low-income housed students.
-
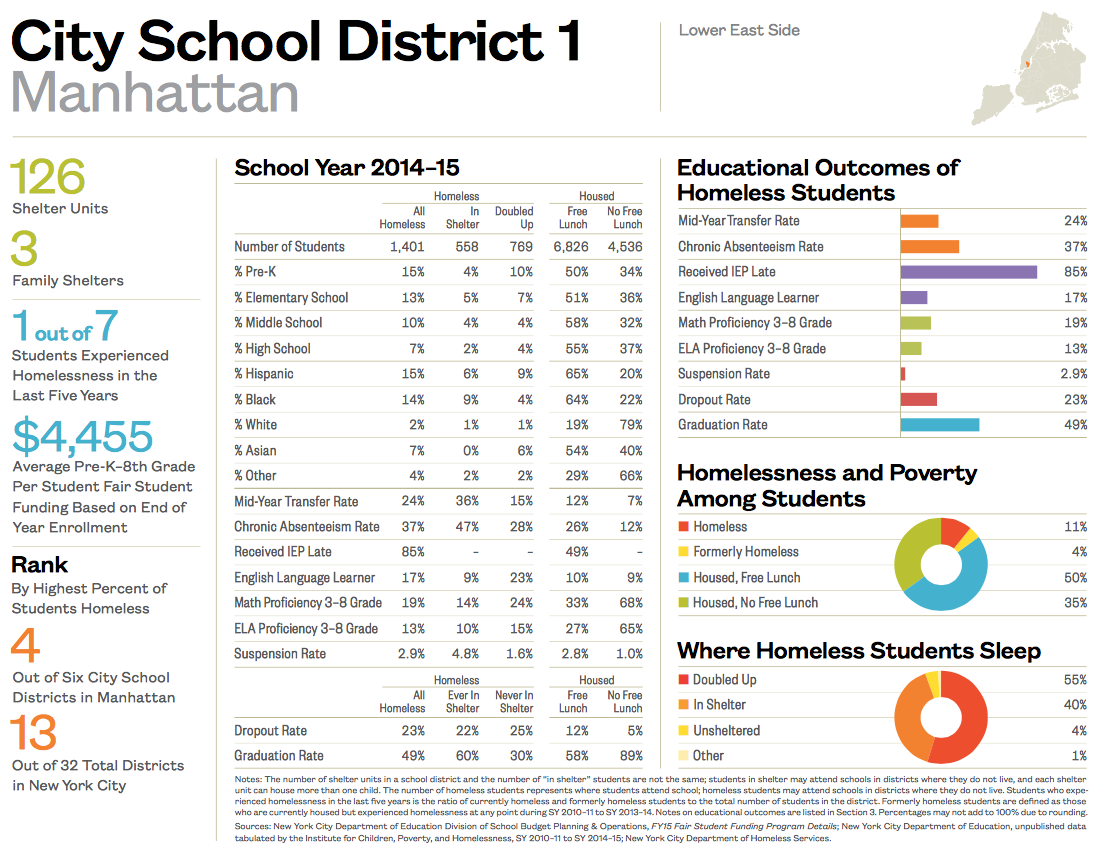
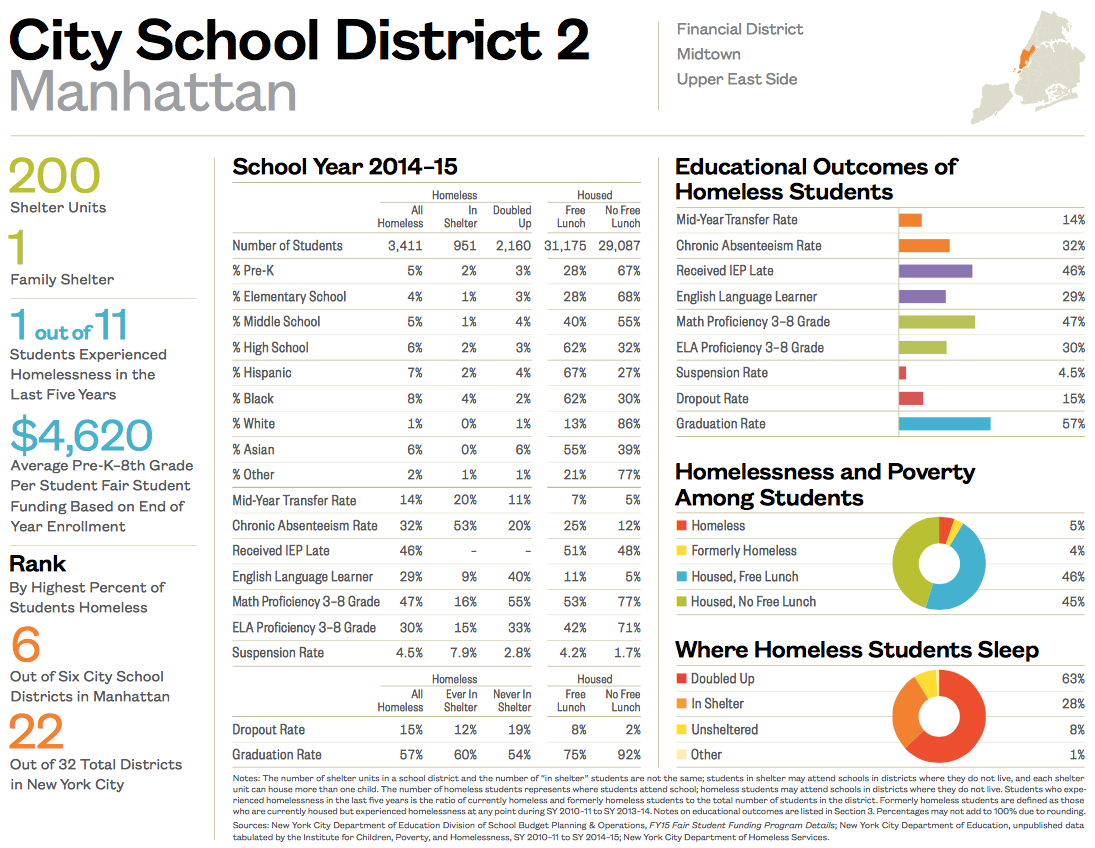
Rates of late identification also varied sharply by school district with a close to 40 percentage point difference among homeless students attending schools in two adjacent Manhattan school districts. District 1, serving the East Village and Lower East Side, had the highest rate of late IEPs with 85% of homeless students in need identified after Kindergarten. District 2, serving the Financial District, Midtown, and the Upper East Side, had the lowest rate of late IEPs among homeless students at 46%.
xxx
xxx
The Intersection of Homelessness and English Language Learners
-
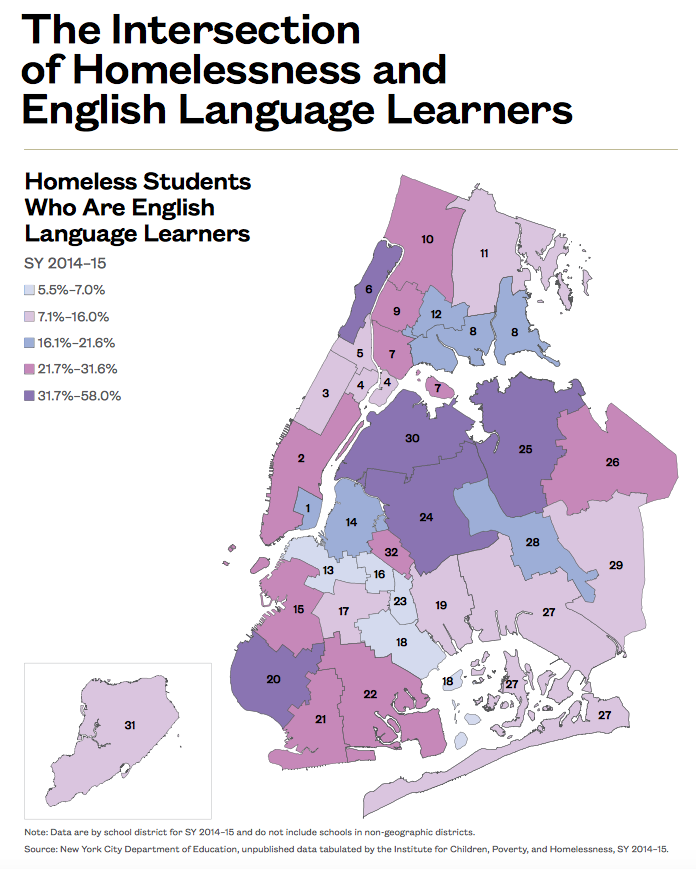
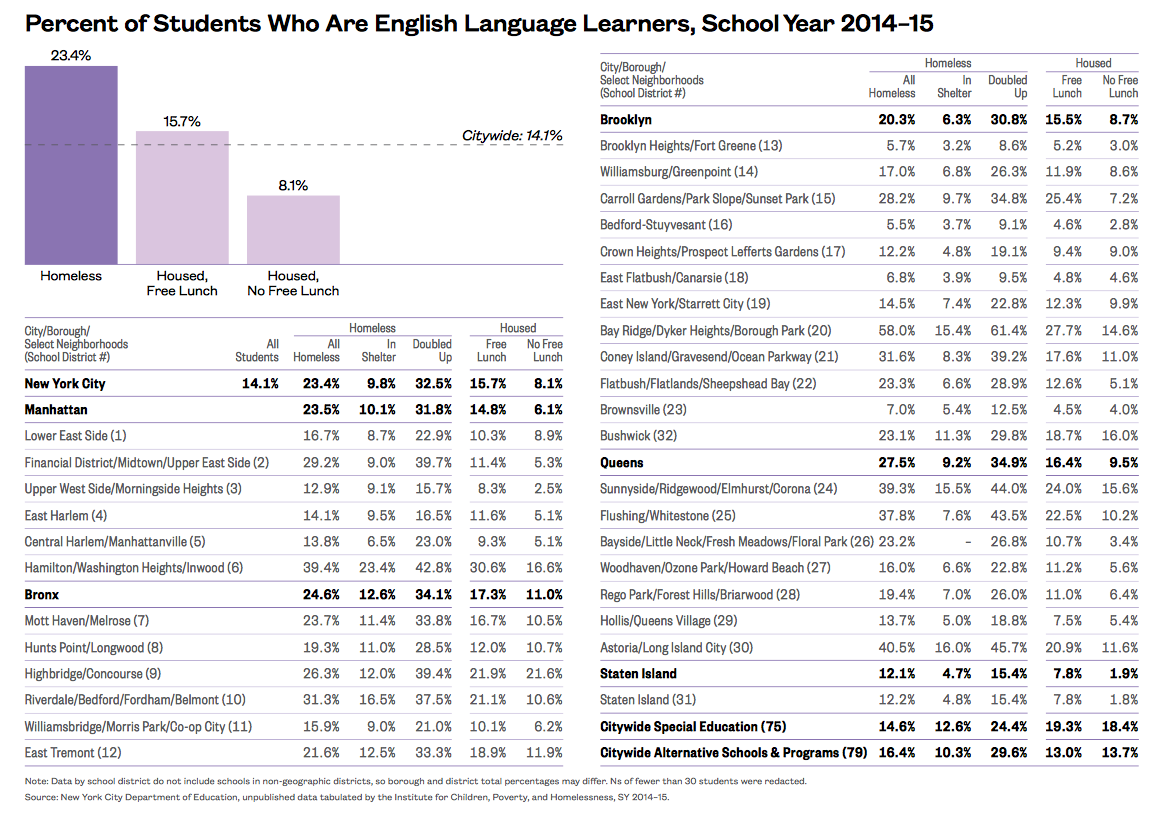
Close to one-quarter (23%) of all homeless students in New York City were English Language Learners (ELL) in SY 2014–15. By comparison, only 14% of students citywide were ELL.
-
Stark differences in prevalence of ELL also exist among homeless students. One-third (33%) of doubled-up students were ELL compared to only 10% of homeless students living in shelter.
-
The highest rate of ELL among homeless students was seen in the Bay Ridge area of Brooklyn (District 20), where 61% of all homeless students living doubled up were ELL.
xxx
xxx
Academic Achievement in English
xxx
-
The proficiency gap by income and housing status in SY 2014–15 was similar to that in SY 2013–14.
-
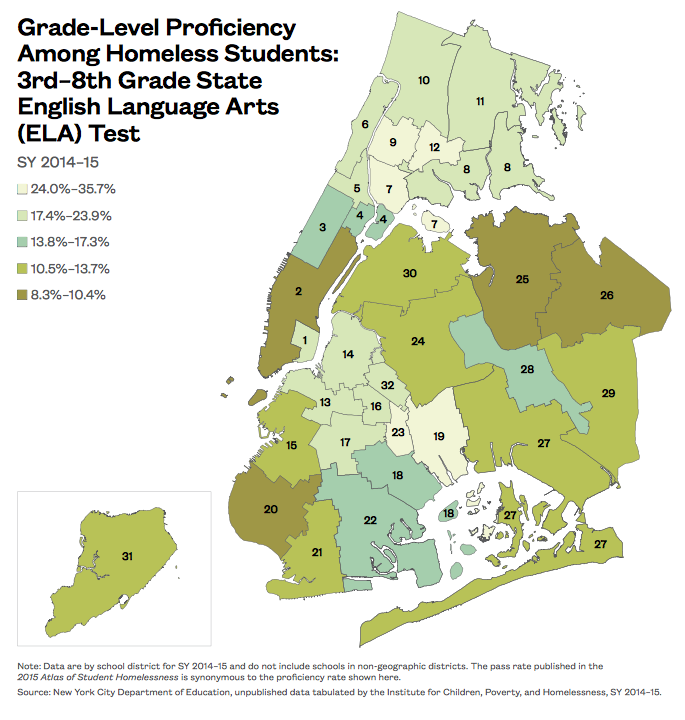
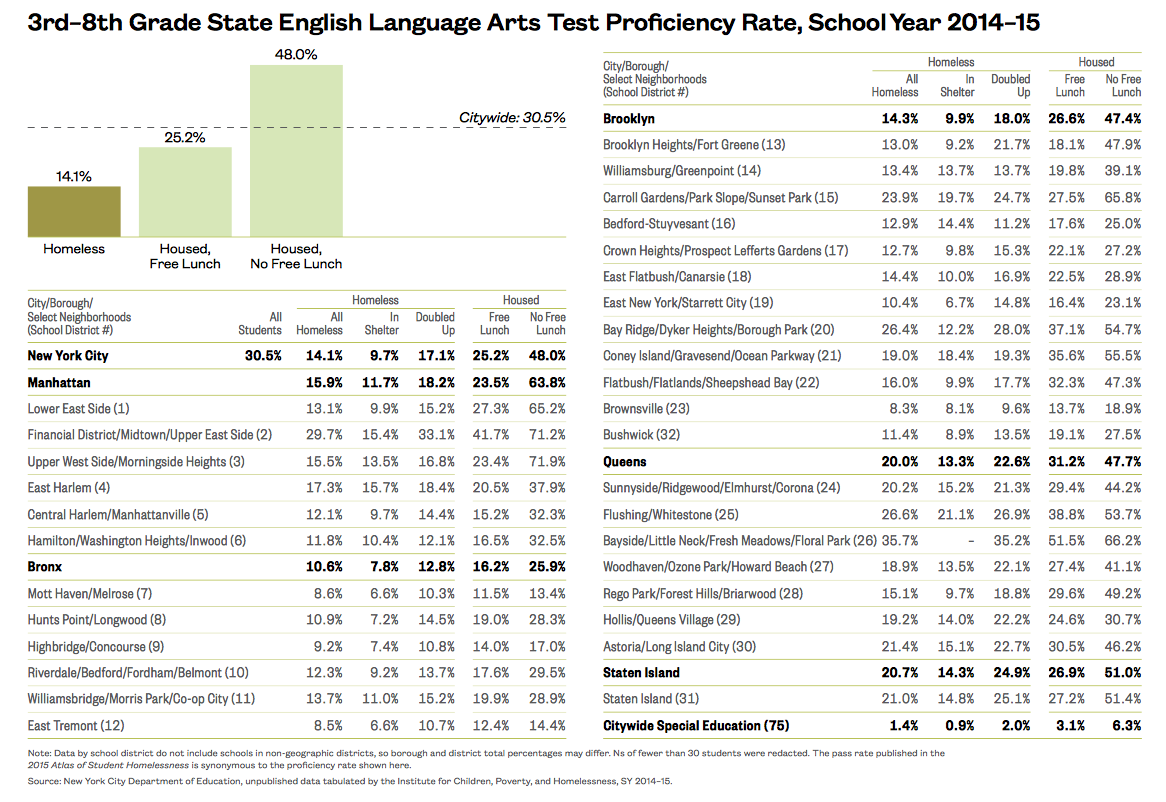
Citywide, 31% of students in 3rd–8th grade were proficient in English, meeting English Language Arts (ELA) grade-level standards in SY 2014–15.
-
Only 14% of homeless students met grade-level standards in English compared to 25% of low-income housed students and 48% of non-low-income housed students.
-
Among homeless students, differences exist by the type of homelessness a student experienced. Doubled-up students were proficient in ELA at close to two times the rate of homeless students living in shelter (17% compared to 10% respectively).
-
Differences in ELA proficiency rates varied geographically by 27 percentage points with only 8% of homeless students in Brownsville (District 23) meeting grade-level standards compared to 36% in Bayside (District 26).
xxx
xxx
Academic Achievement in Math
xxx
-
The proficiency gap by income and housing status in SY 2014–15 was similar to that in SY 2013–14.
-
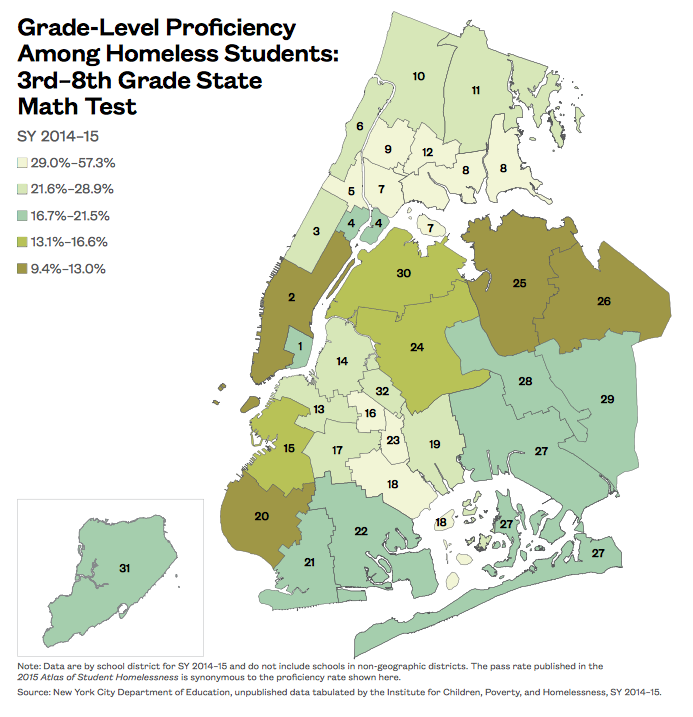
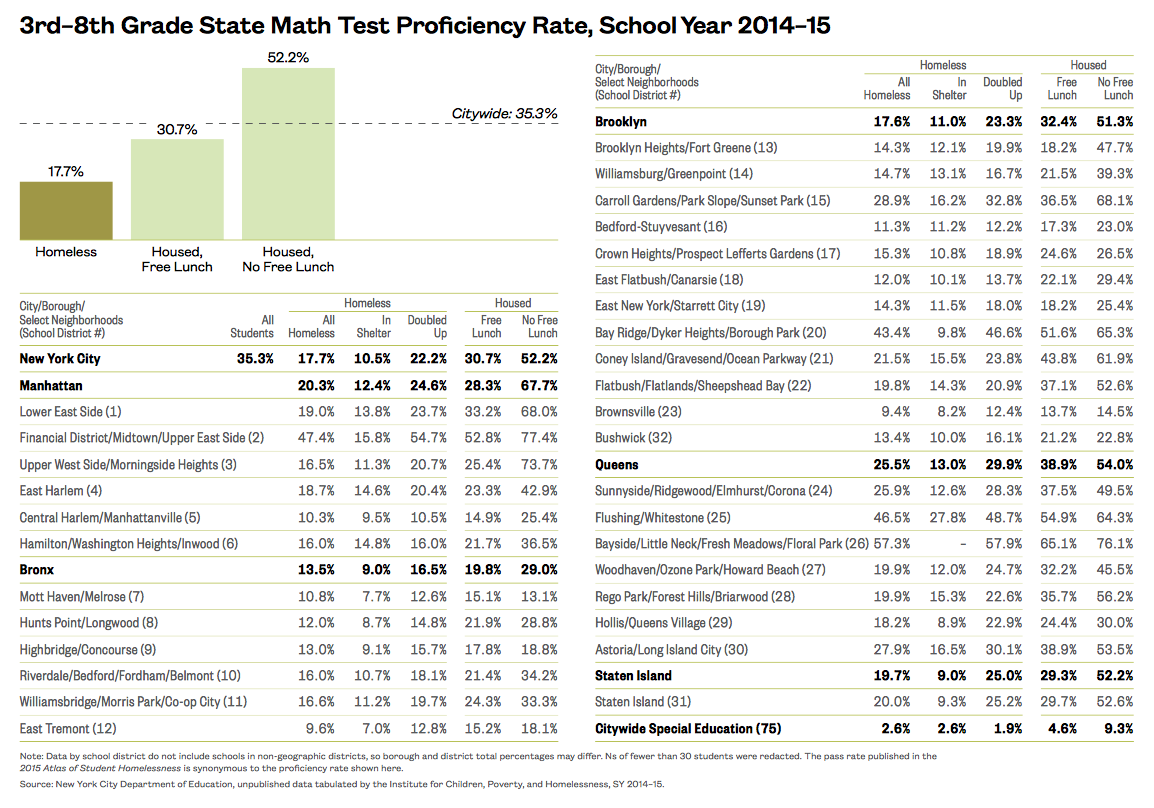
Citywide, 35% of students in 3rd–8th grade were proficient in math, meeting grade-level standards in SY 2014–15.
-
Only 18% of homeless students met grade-level standards in math compared to 31% of low-income housed students and 52% of non-low-income housed students.
-
Among homeless students, differences exist by the type of homelessness a student experienced. Doubled-up students were proficient in math at two times the rate of homeless students living in shelter (22% compared to 11% respectively).
-
Differences in math proficiency rates varied geographically by 48 percentage points with only 9% of homeless students in Brownsville (District 23) meeting grade-level standards compared to 57% in Bayside (District 26).
xxx
xxx
Aftershocks of Homelessness by District
xxx
xxx
Suspension of Homeless Students
xxx
-
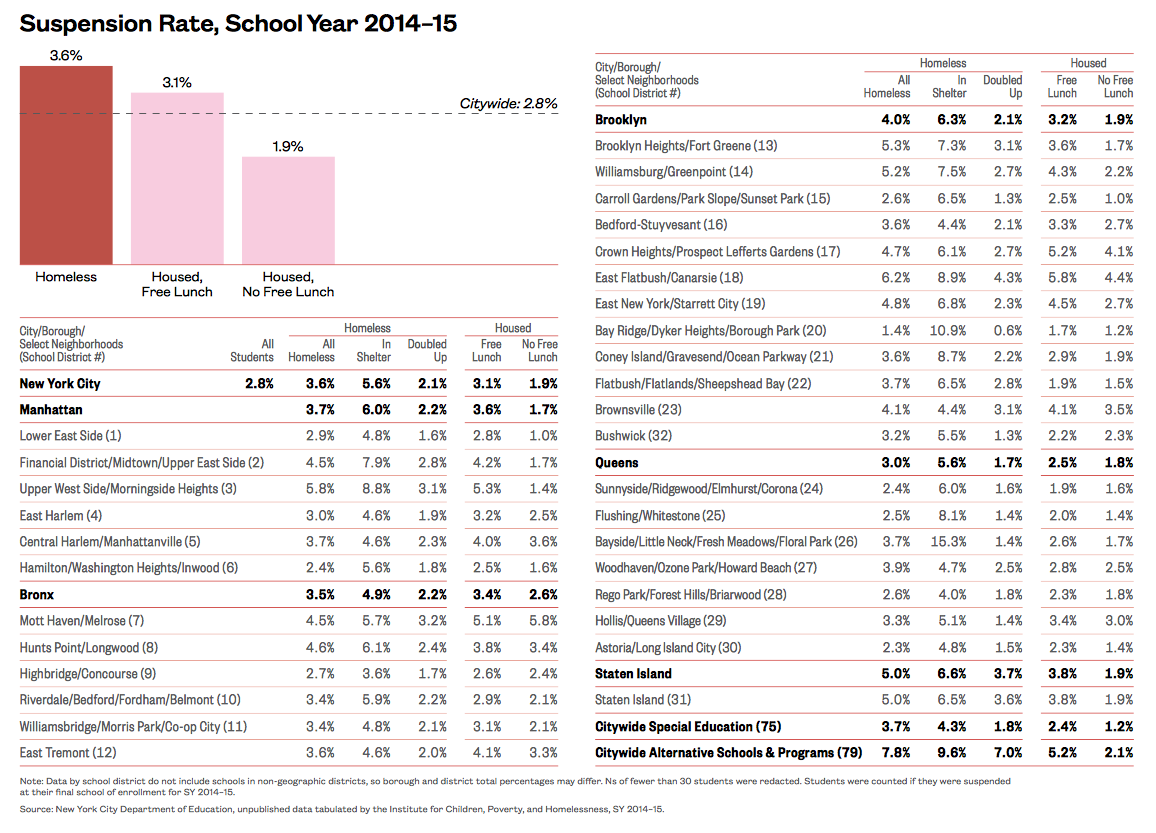
Homeless students saw a slight decline in suspensions between SY 2013–14 and SY 2014–15 from 4.3% to 3.6% respectively.
-
The average suspension rate for all students in New York City in SY 2014–15 was 2.8%, roughly the same as the year prior.
-
Homeless students continued to be suspended at overall higher rates than their low-income housed peers and their non-low-income housed peers (3.6%, 3.1%, and 1.9% respectively).
-
Homeless students living in shelter had the highest suspension rates by housing and income group with an average of 6% of homeless students living in shelter suspended in SY 2014–15.
-
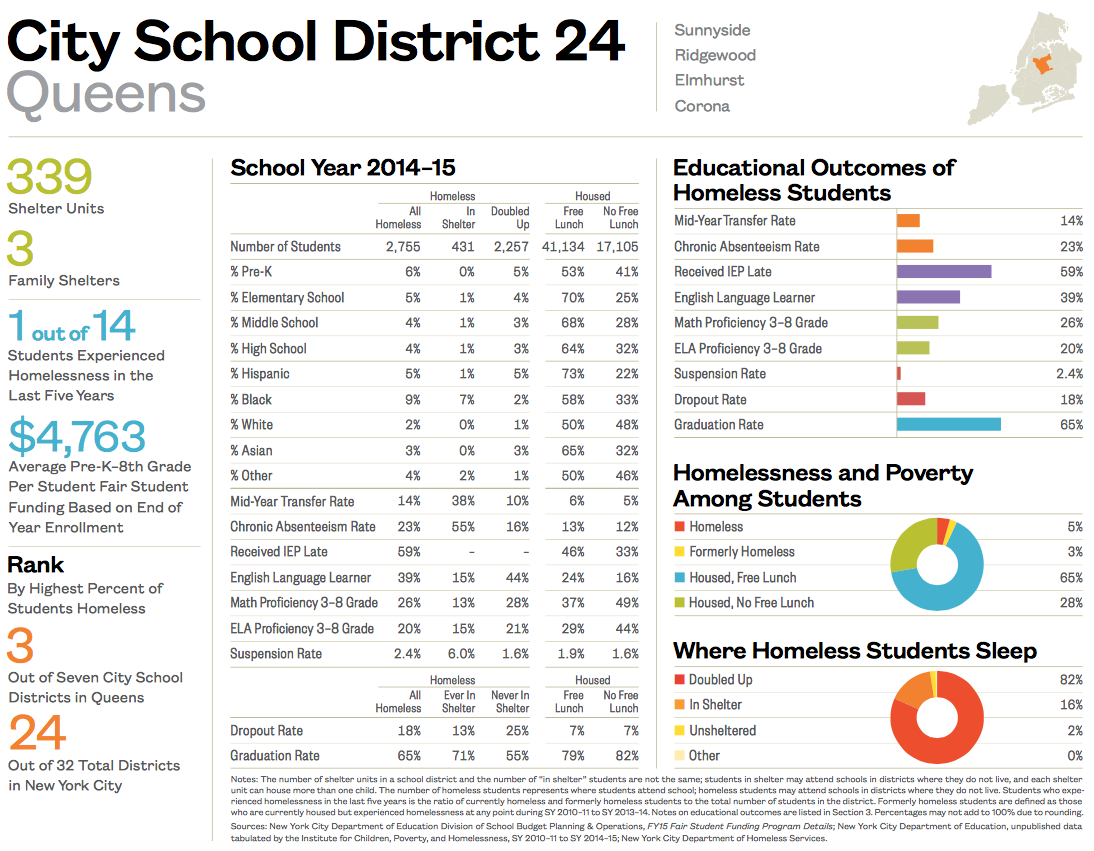
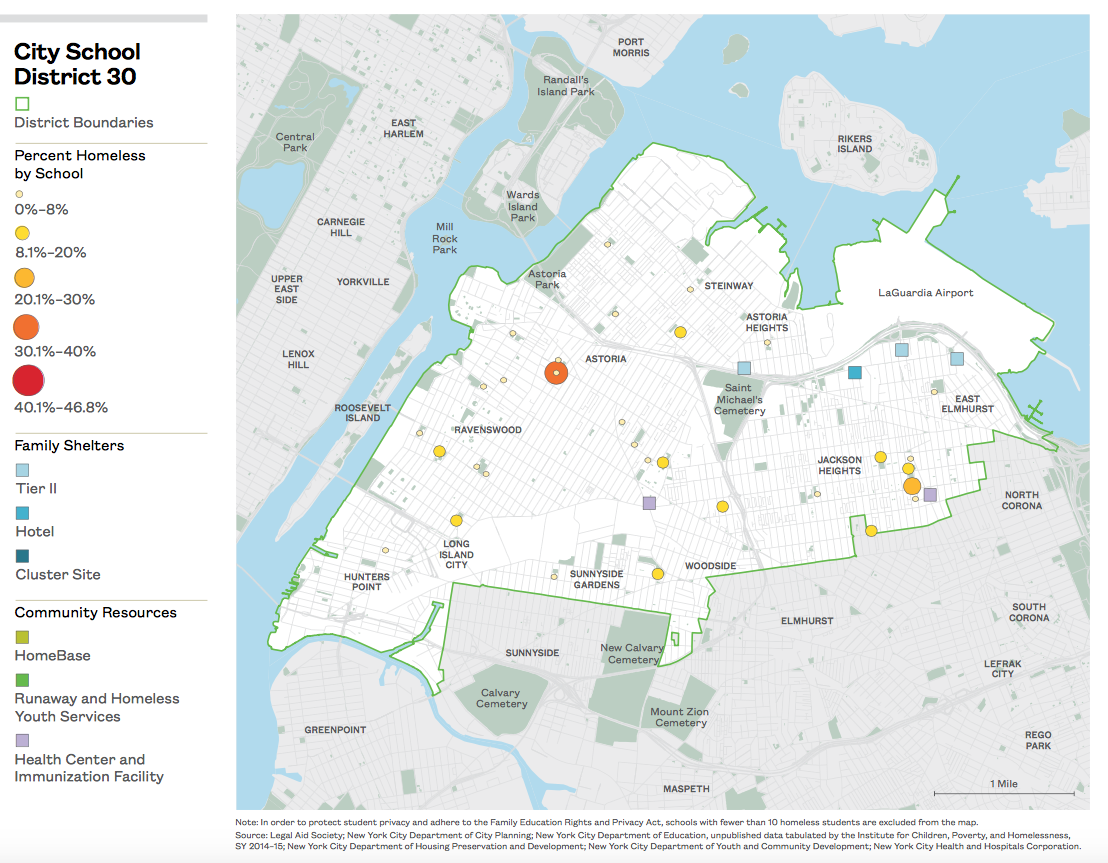
In eight school districts homeless students were suspended at rates below the citywide average of 2.8%. These districts included Washington Heights in Manhattan (District 6), Highbridge in the Bronx (District 9), Carroll Gardens and Bay Ridge in Brooklyn (Districts 15 and 20) and Sunnyside, Flushing, Rego Park, and Astoria in Queens (Districts 24, 25, 28, and 30).
-
By school district, the highest rate of suspension for homeless students living in shelter was in Bayside, Queens (District 26) where 15% were suspended.
xxx
xxx
Where Homeless Students Drop Out
xxx
-
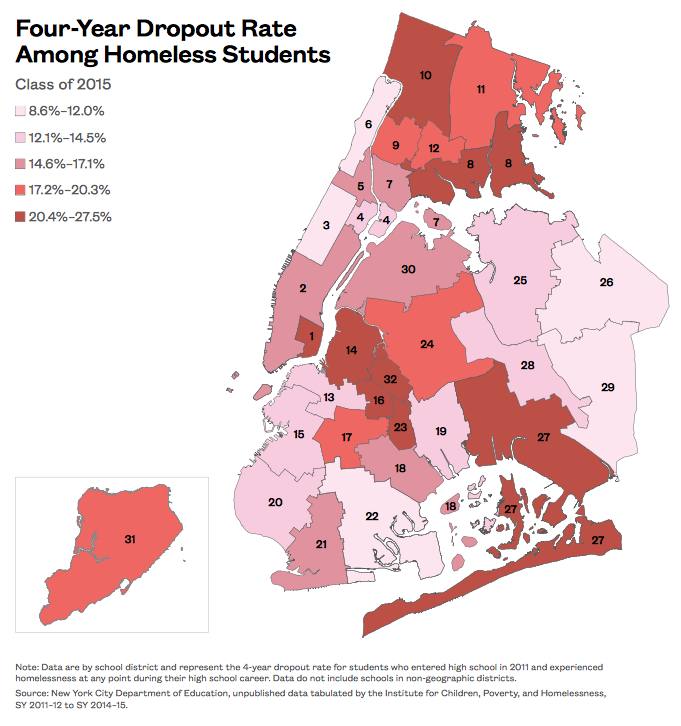
The four-year dropout rate for New York City improved slightly from 10% for the class of 2014 to 9% for the class of 2015, but the achievement gap persisted.
-
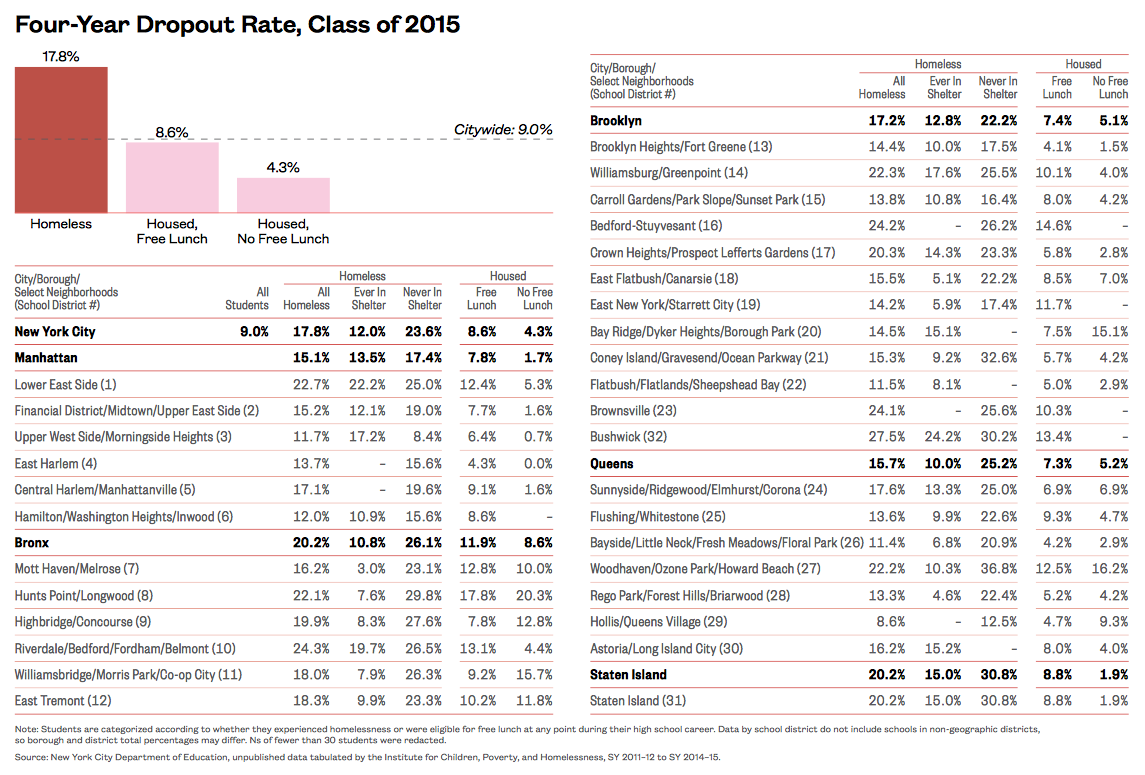
Homeless students dropped out at two times the rate of low-income housed students and over four times the rate of housed students who were not low-income (18%, 9%, and 4% respectively).
-
The dropout burden was not equal among students who experienced homelessness during high school. Close to one out of four (24%) students who experienced homelessness but had never been in shelter dropped out of school compared to just 12% of high school students who experienced homelessness and had been in shelter at some point during the four-year period.
-
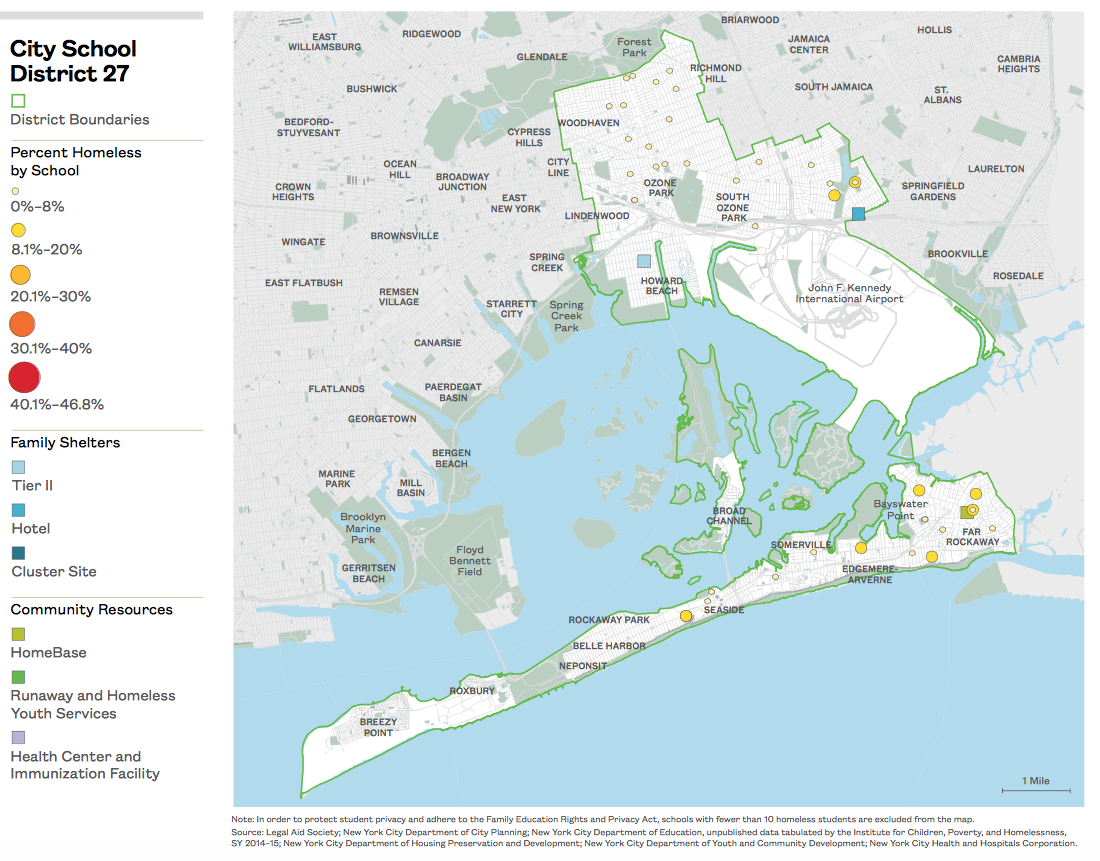
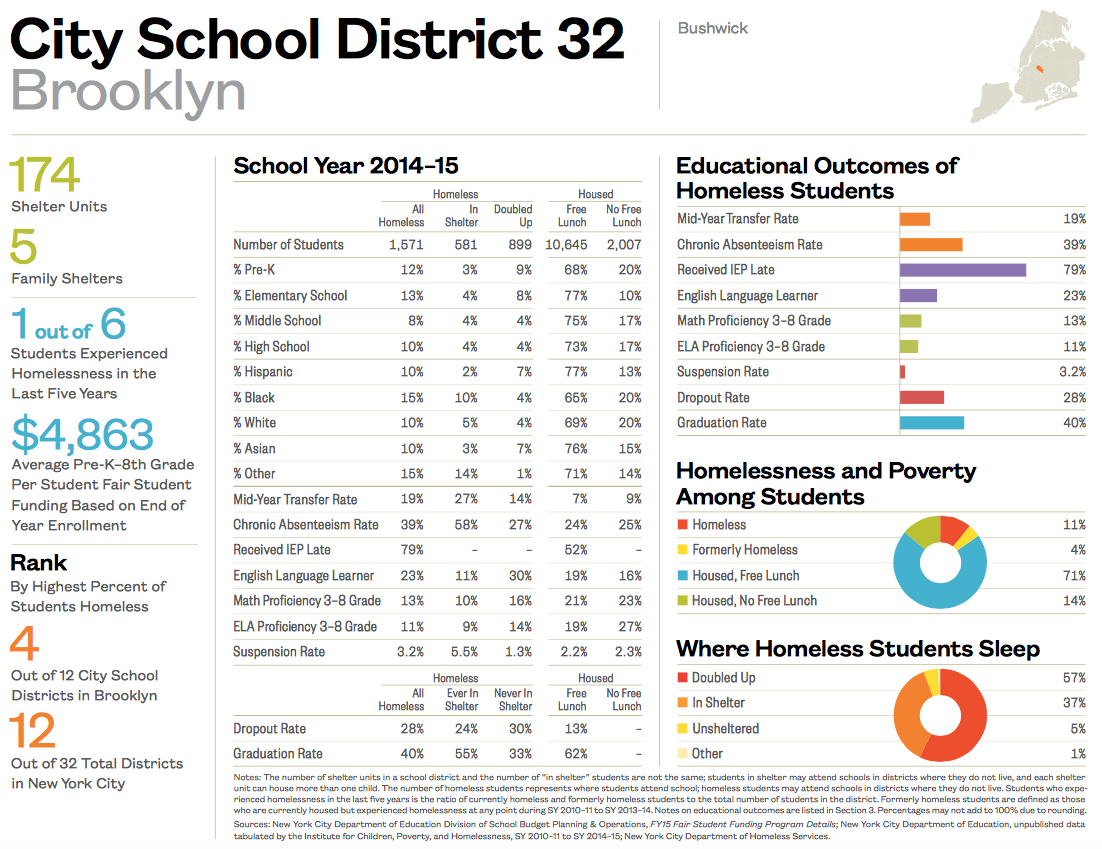
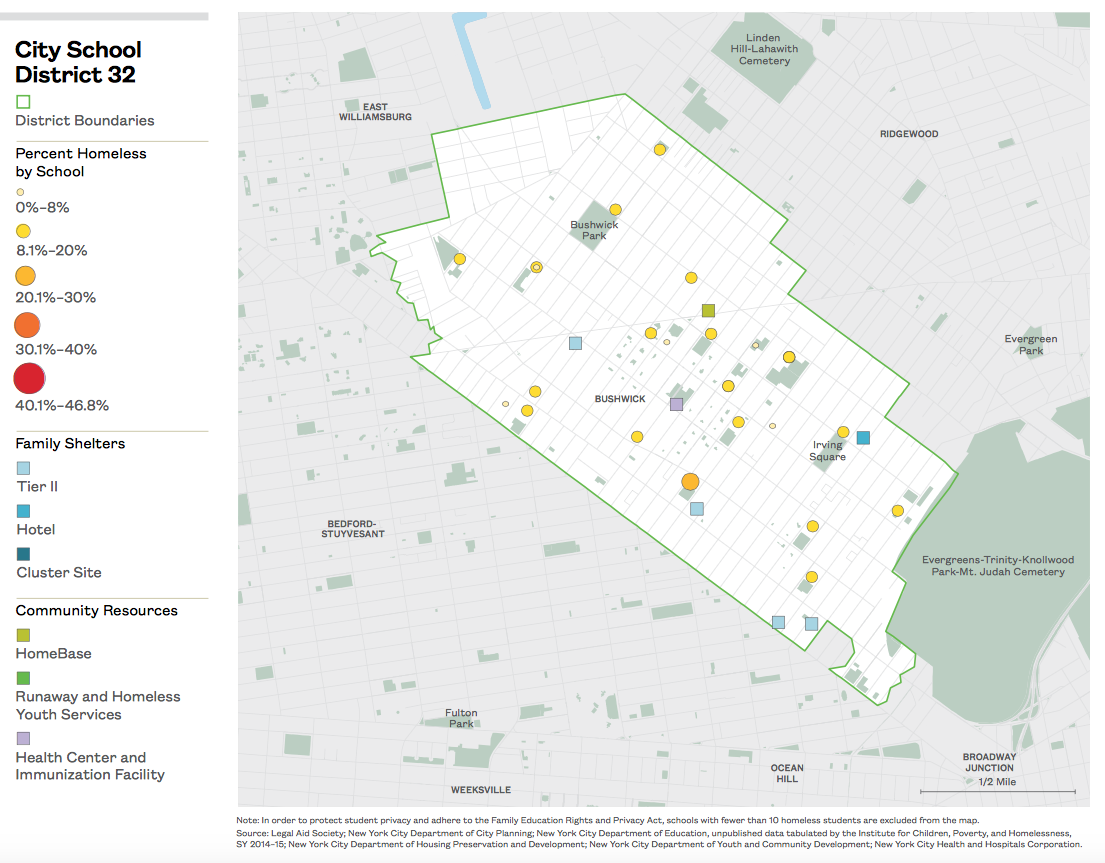
In ten districts, more than one out of five students who experienced homelessness in high school dropped out—two times the citywide rate. These districts included the Lower East Side, Hunts Point, Fordham, Williamsburg, Bedford-Stuyvesant, Crown Heights, Brownsville, Woodhaven, Staten Island, and Bushwick (Districts 1, 8, 10, 14, 16, 17, 23, 27, 31, and 32).
xxx
xxx
Graduation Rates Differ by District
xxx
-
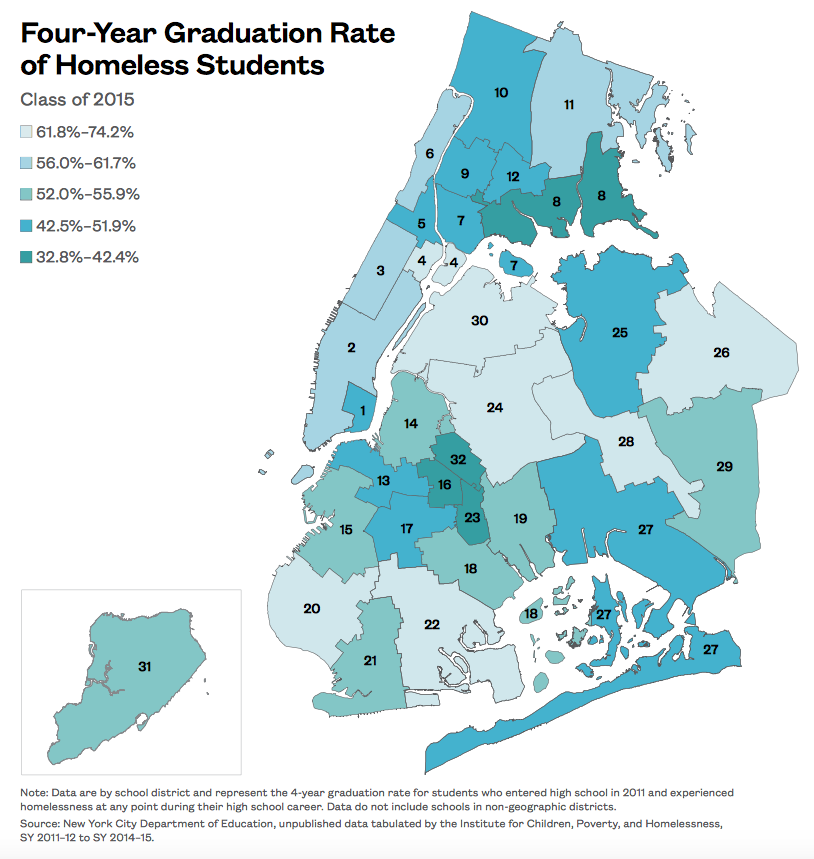
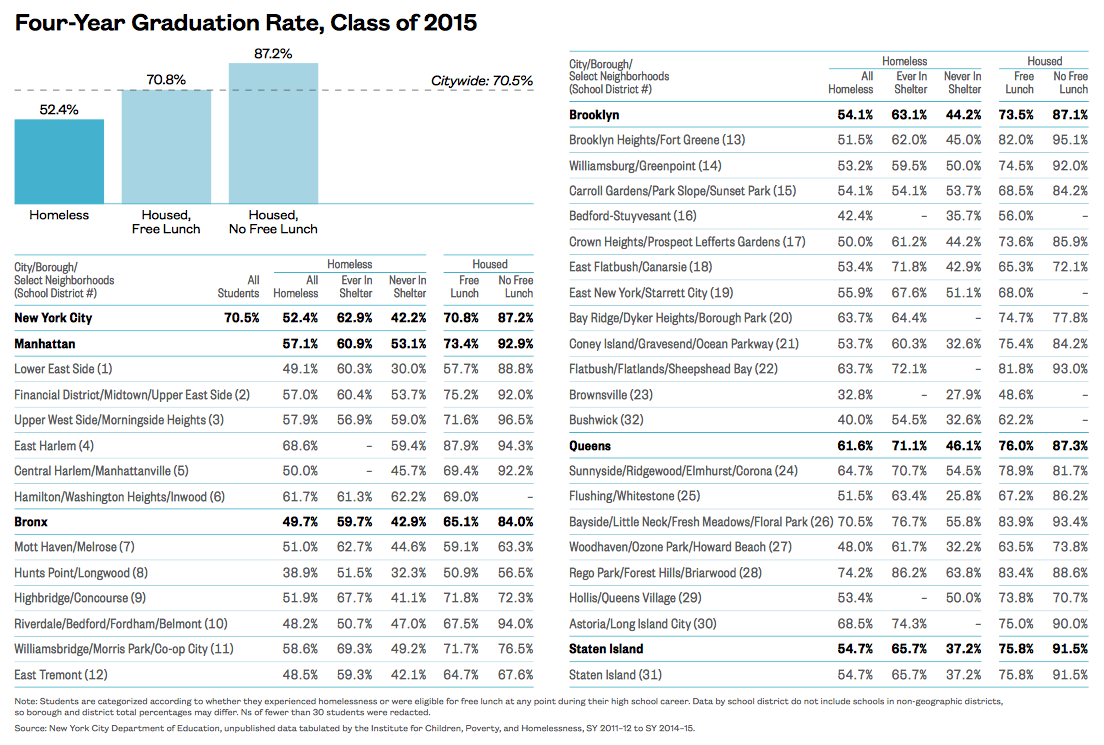
The average four-year graduation rate for New York City improved slightly from 69% for the class of 2014 to 71% for the class of 2015. While the overall achievement gap persisted, students who experienced homelessness during high school saw a four-percentage-point increase in graduation from the prior year’s cohort, while housed students saw a smaller one- to two- percentage-point increase.
-
Just over half (52%) of students who were homeless during high school graduated in four years compared to 71% of low-income housed students and 87% of housed students who were not low-income.
-
Among students who were homeless during high school, those who had lived at some point in shelter had a graduation rate that was closer to that of their low-income housed peers than their homeless peers who had never lived in shelter (63%, 71% and 42% respectively). Students who were homeless during high school who never lived in shelter had the lowest graduation rate of all groups at 42%.
-
In seven school districts more than 62% of students who experienced homelessness during high school graduated. Only East Harlem (District 4) had a similarly high graduation rate the prior year.
xxx
xxx
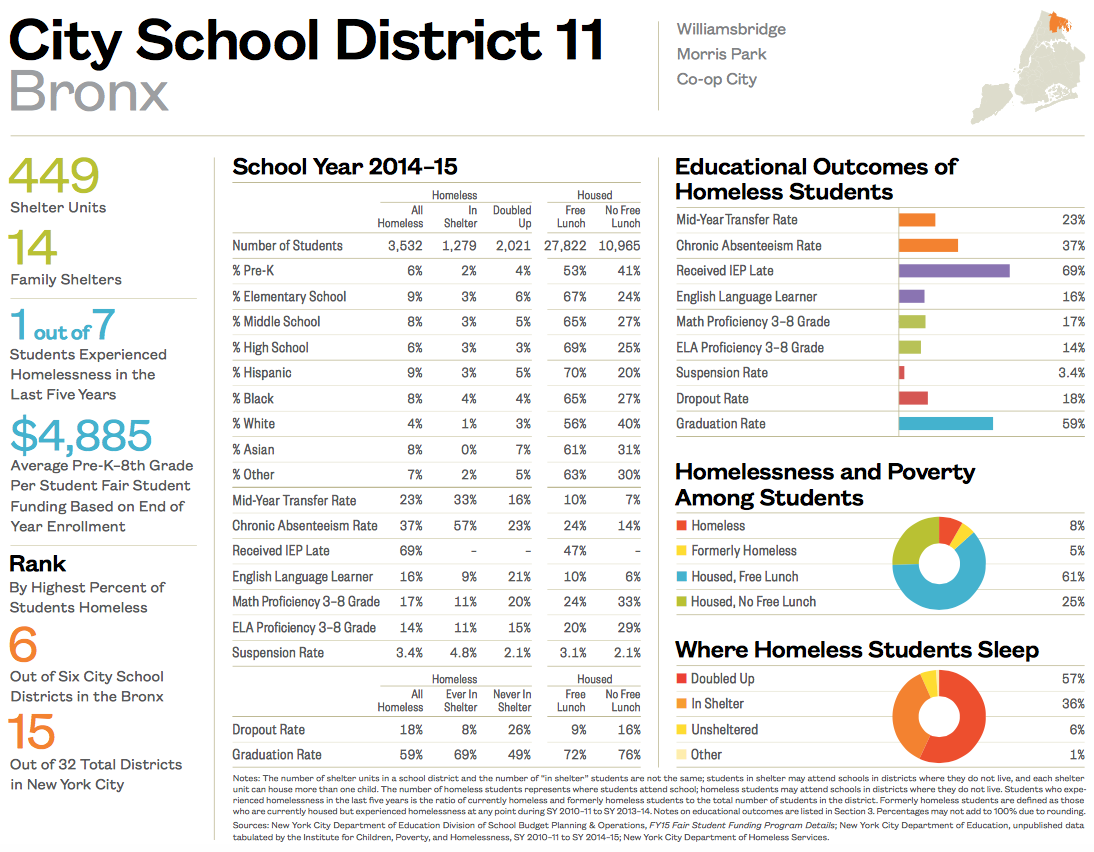
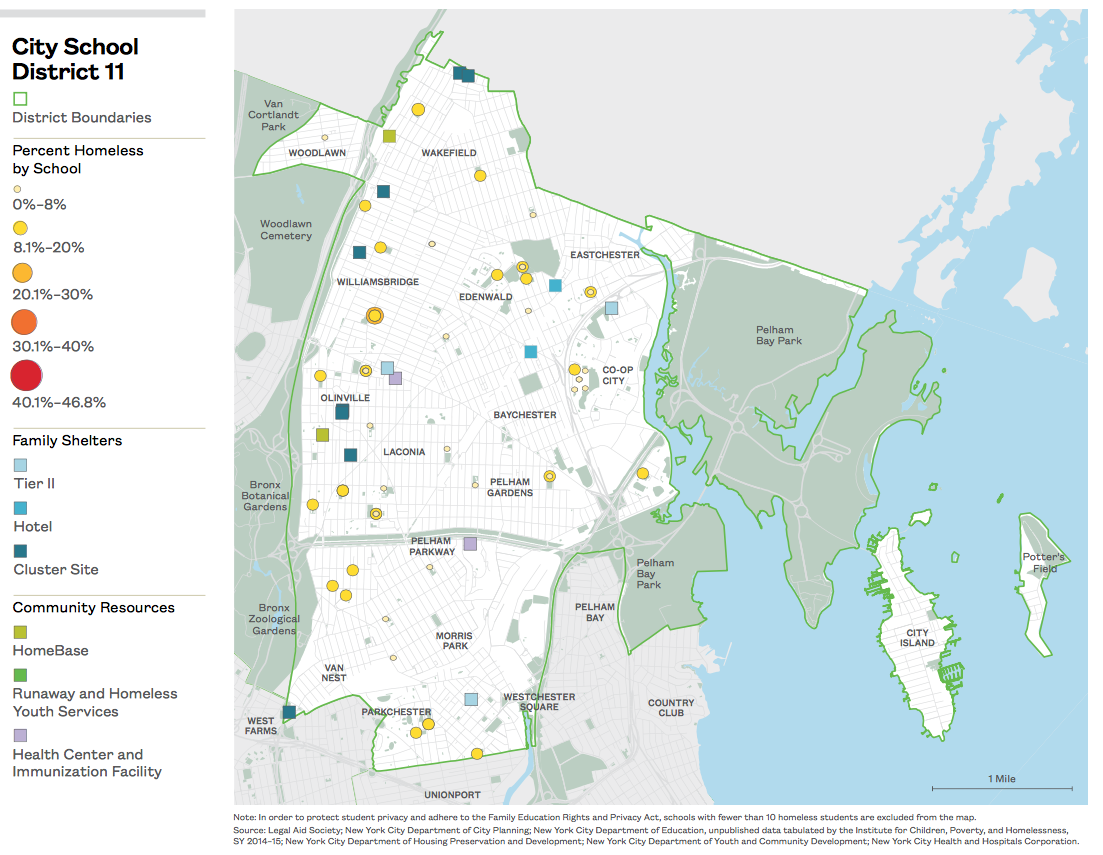
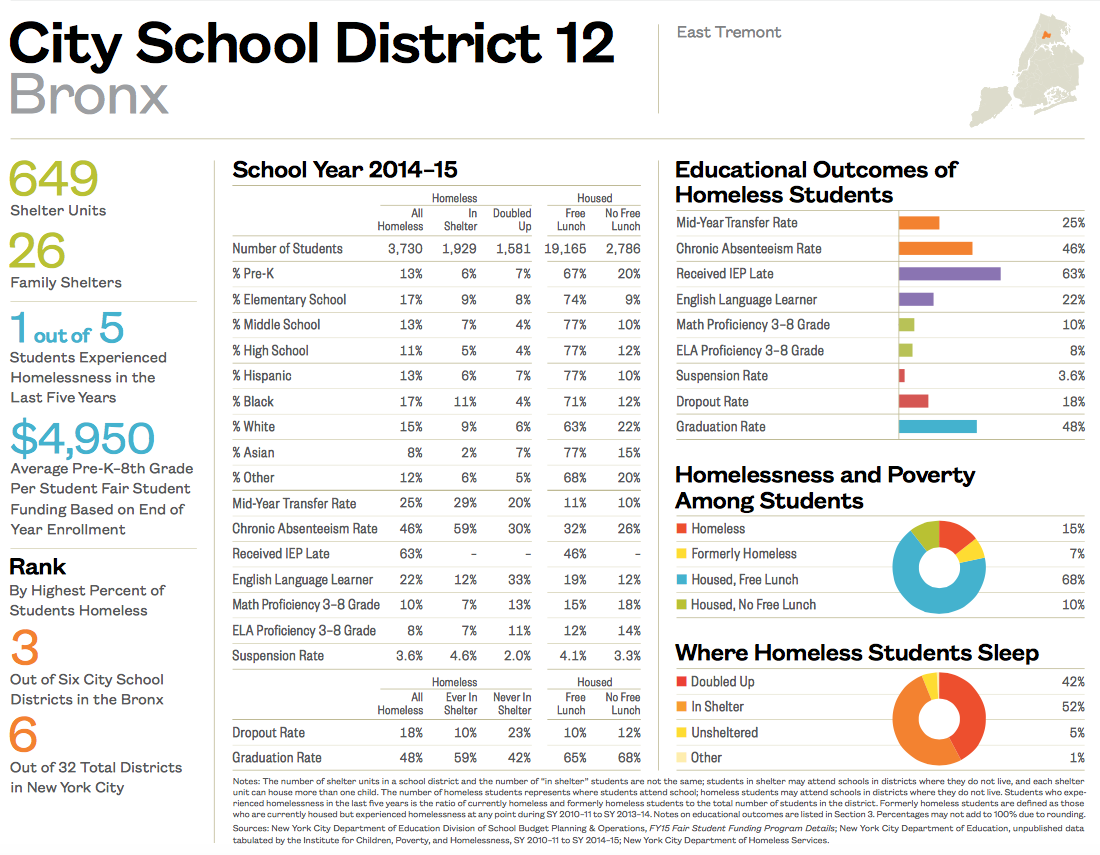
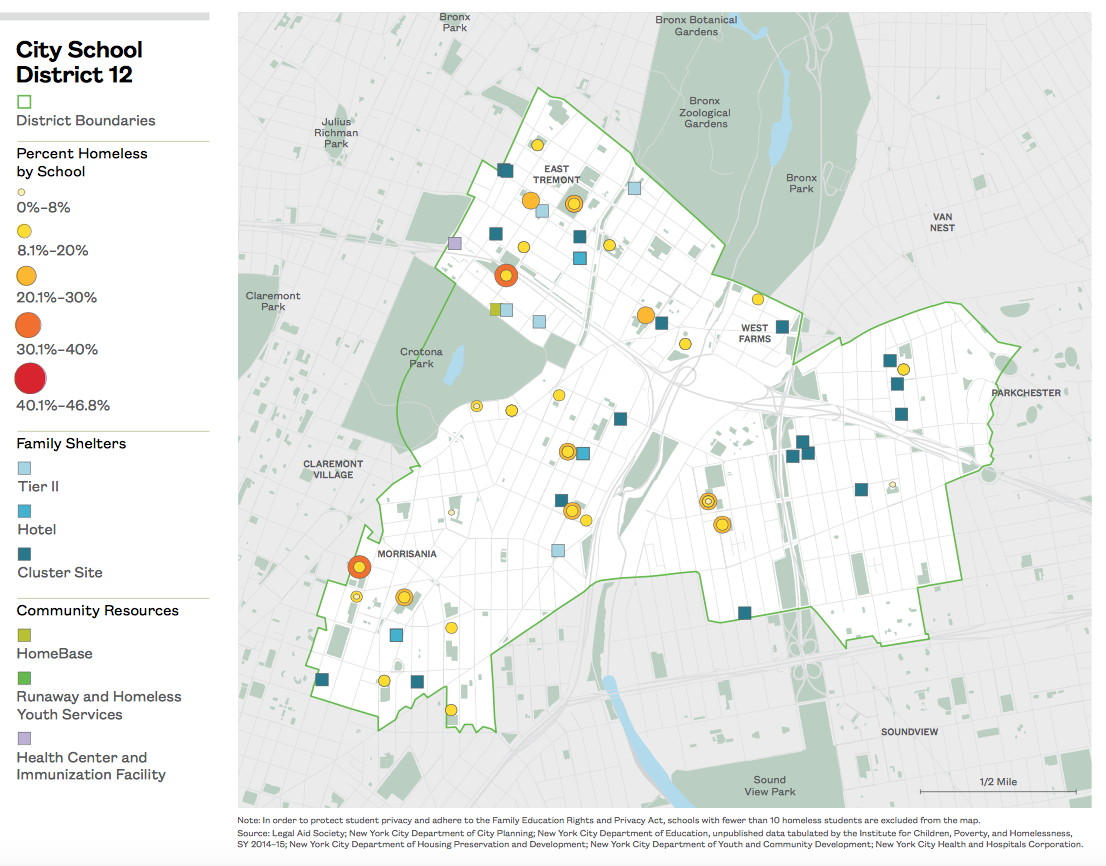
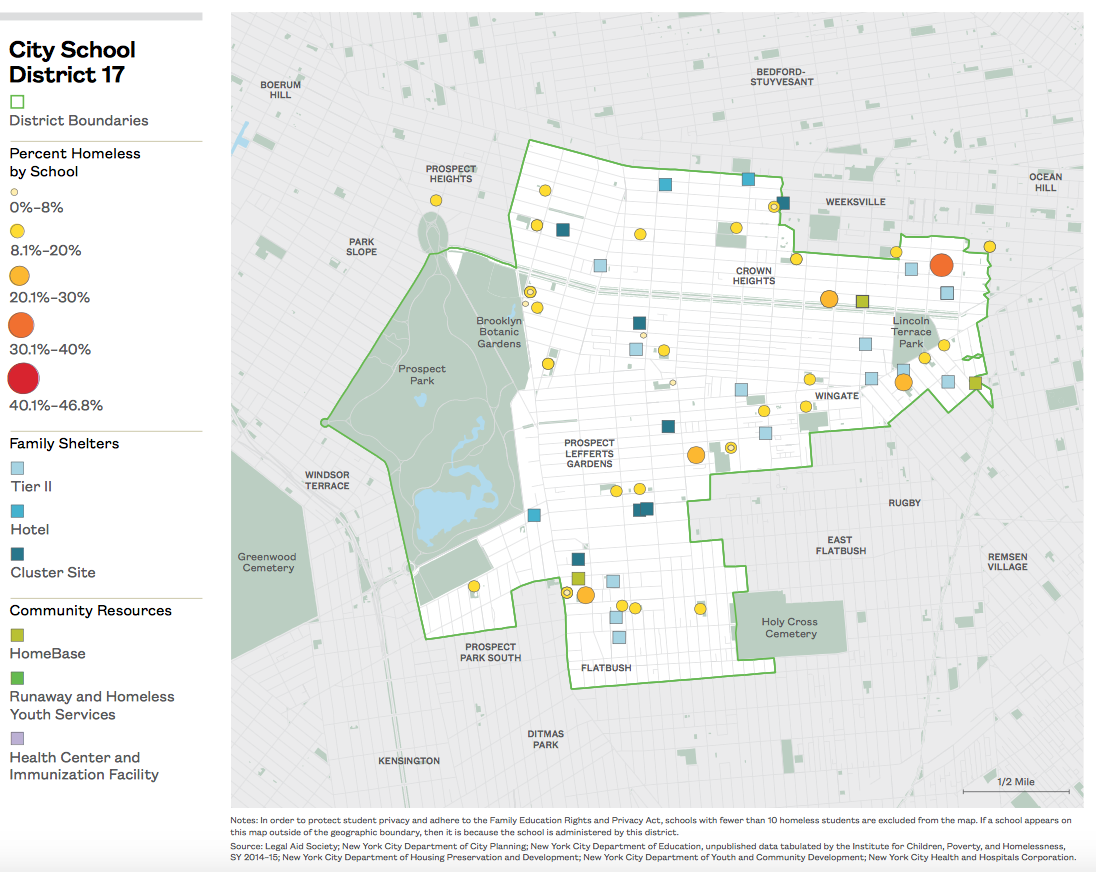
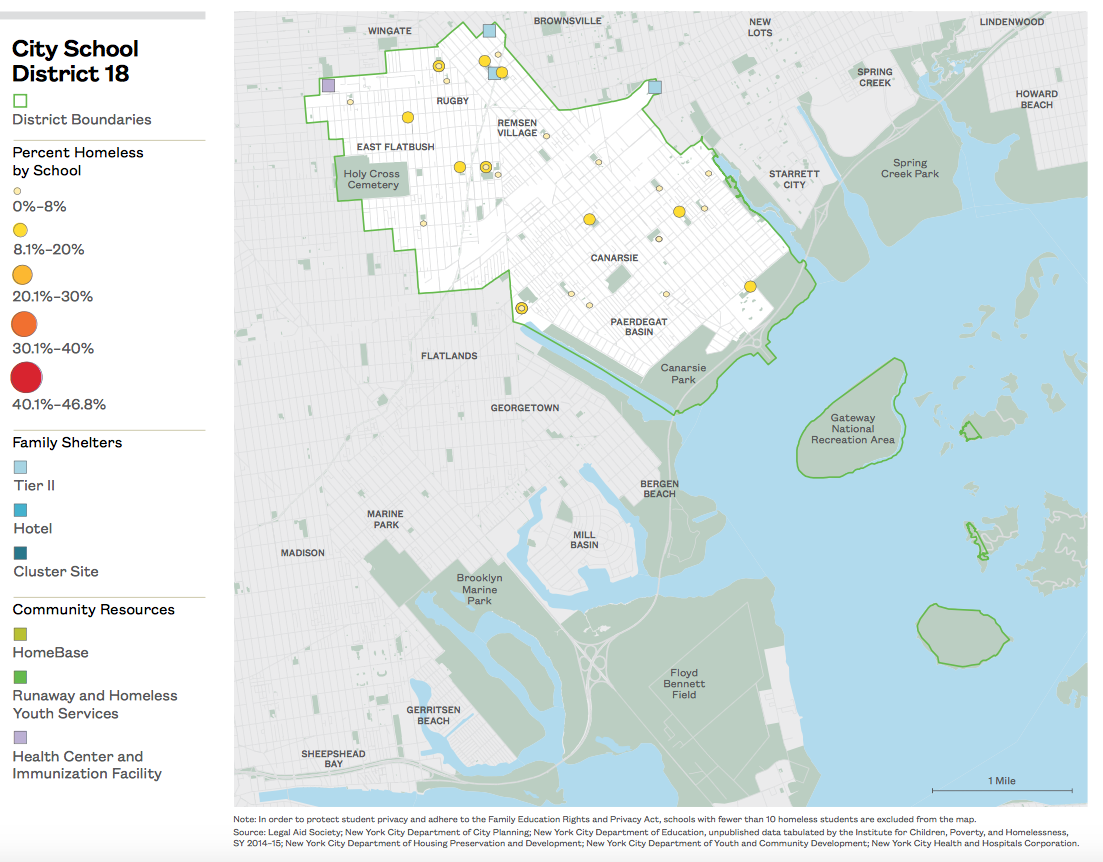
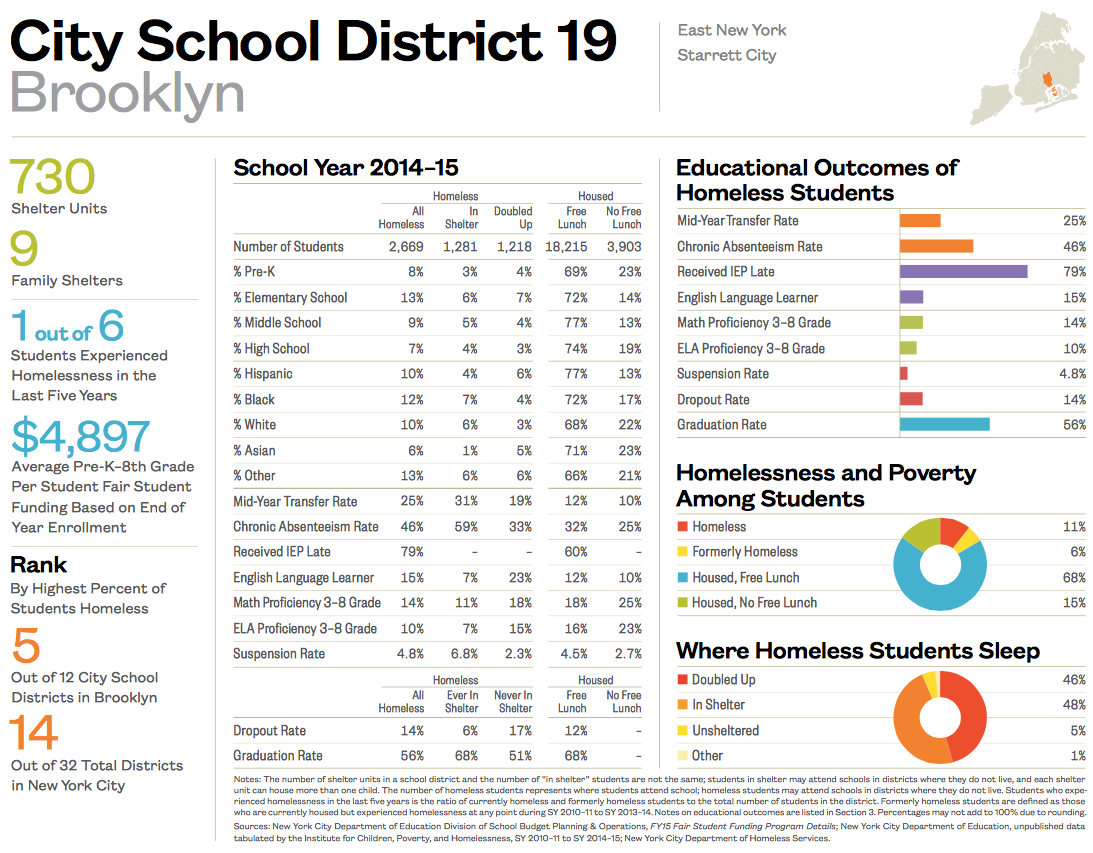
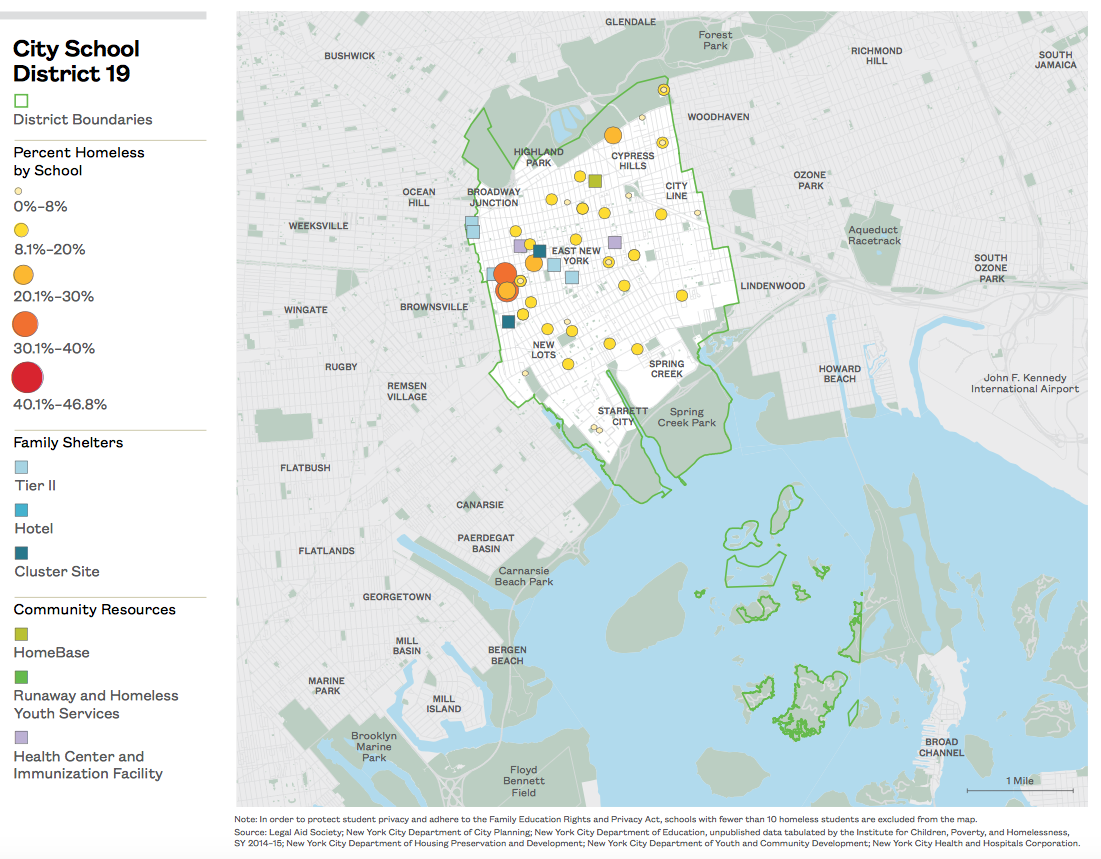
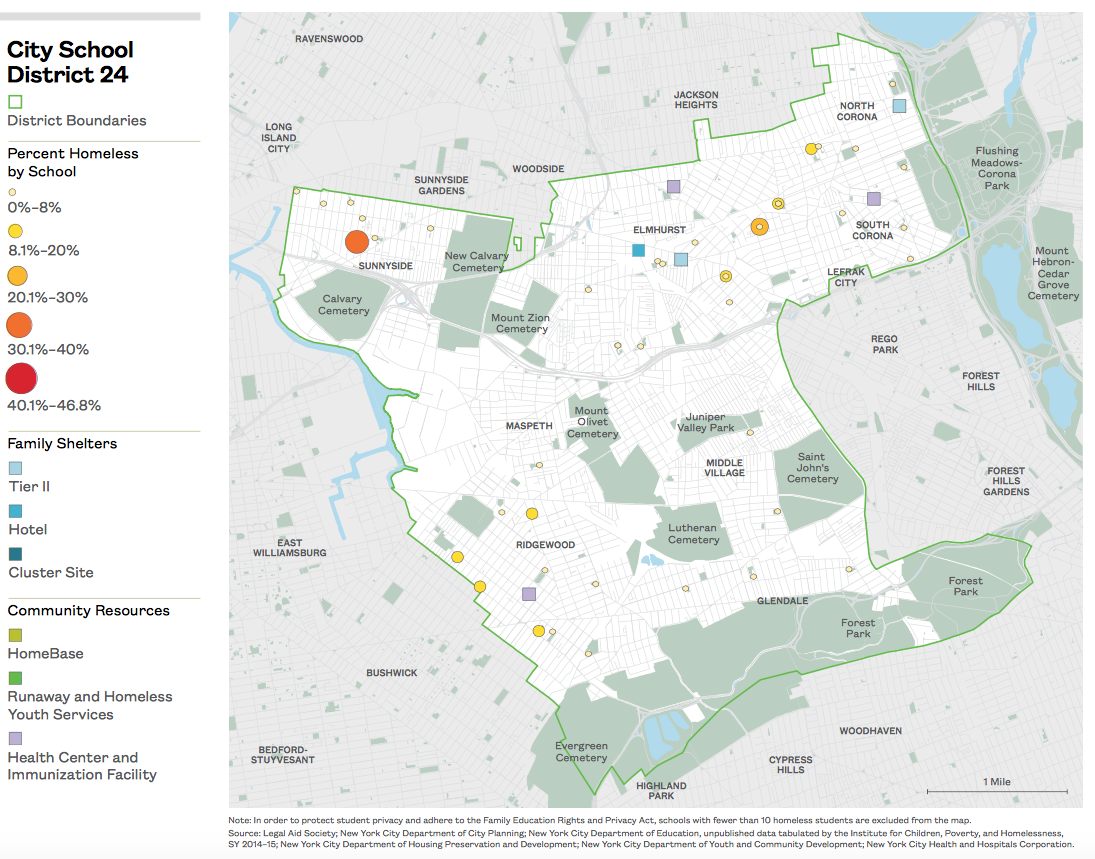
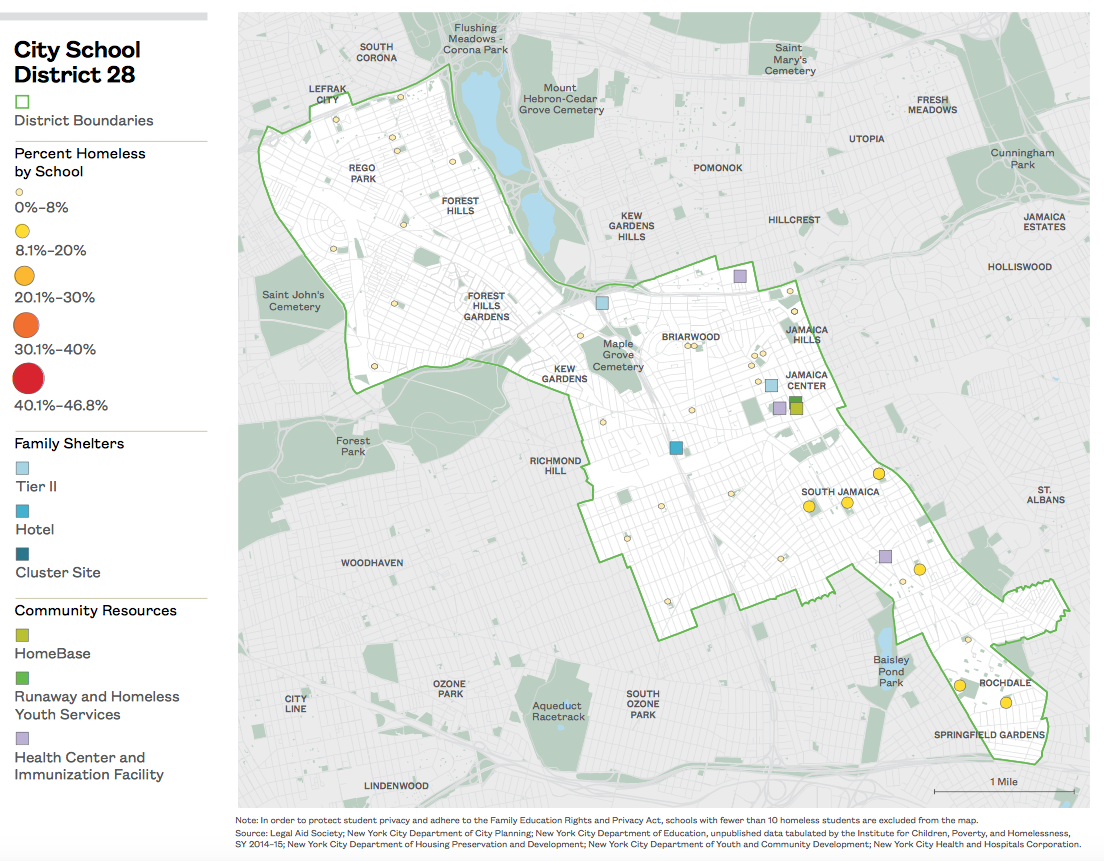
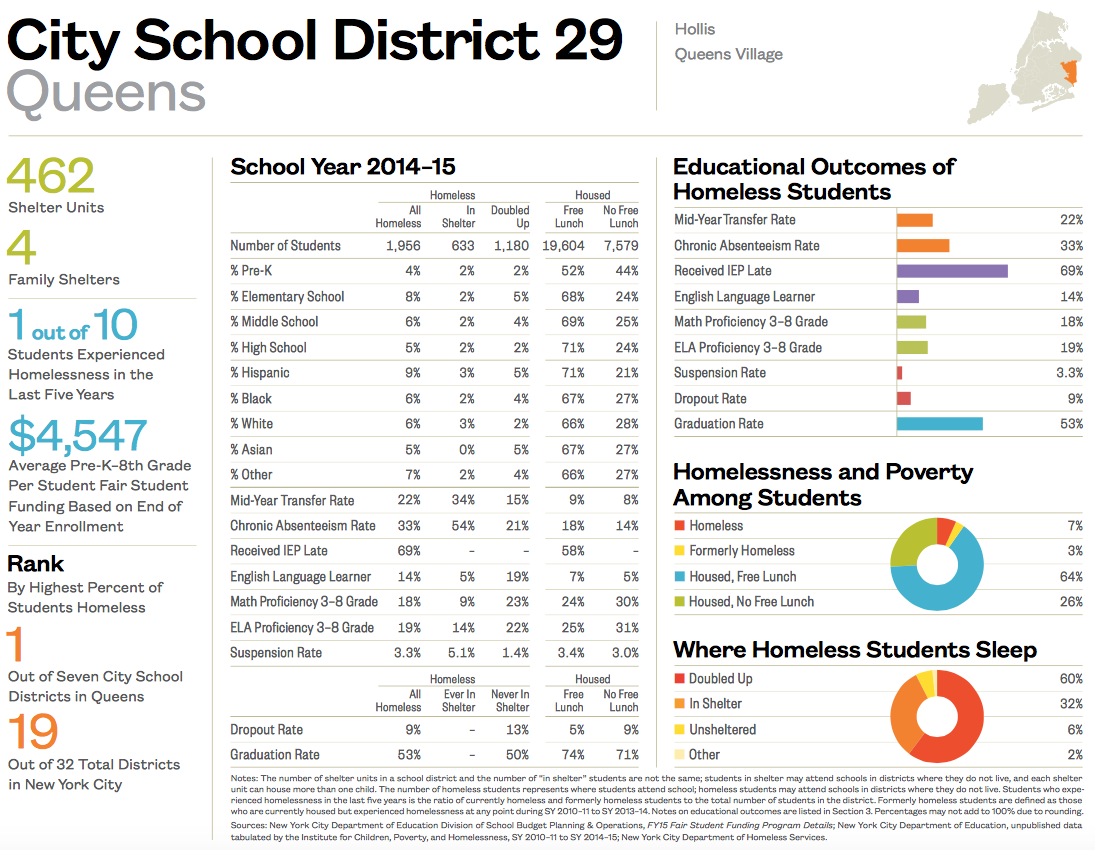
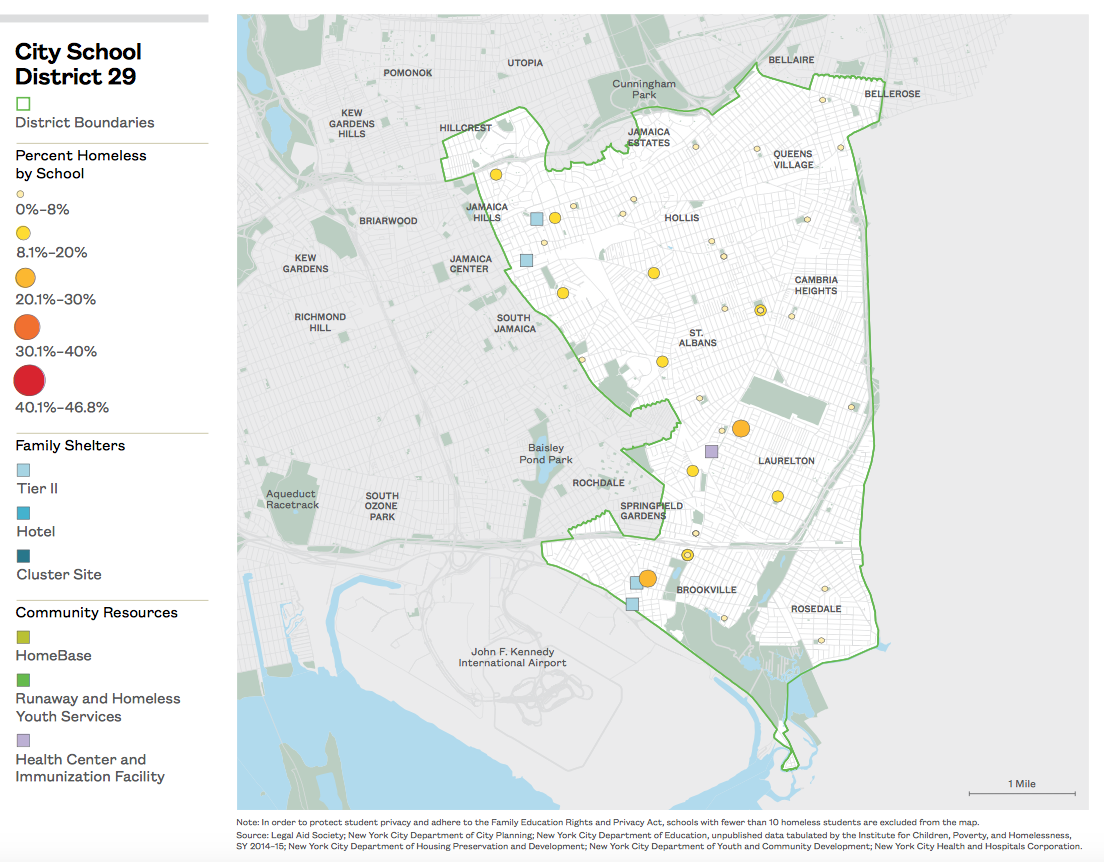
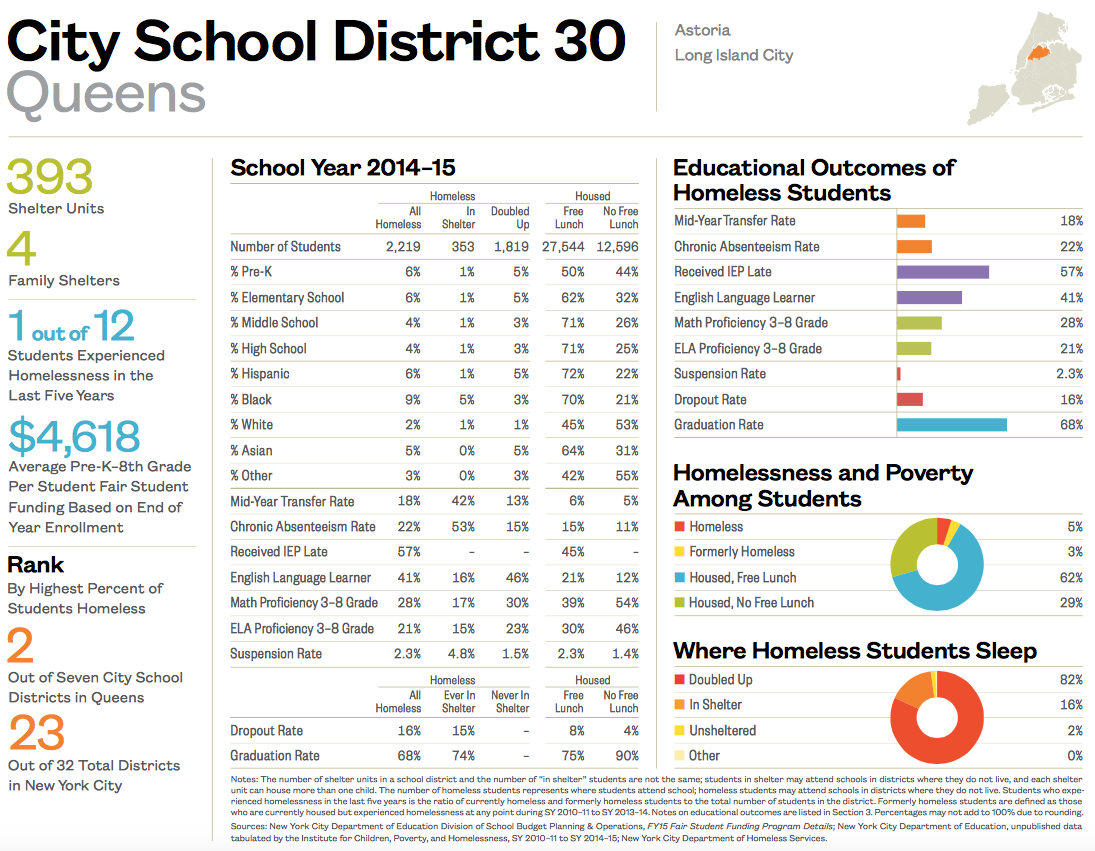
Homeless Students by School District
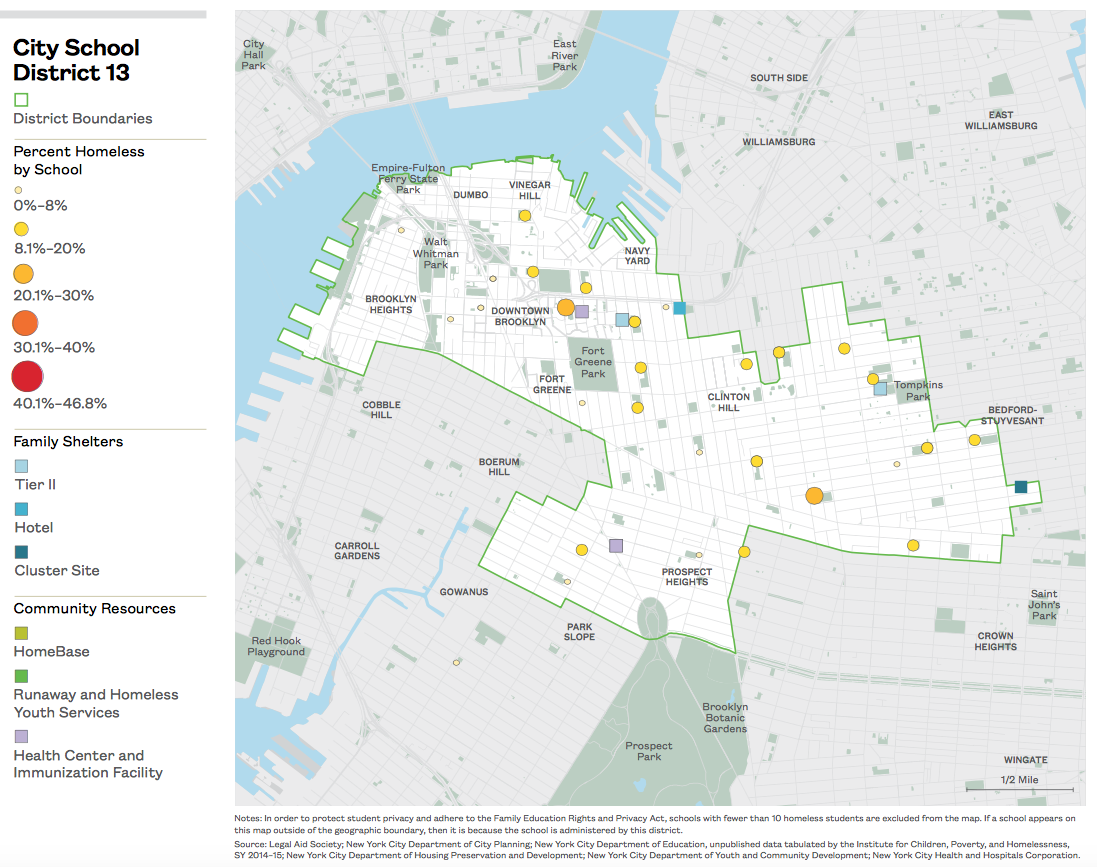
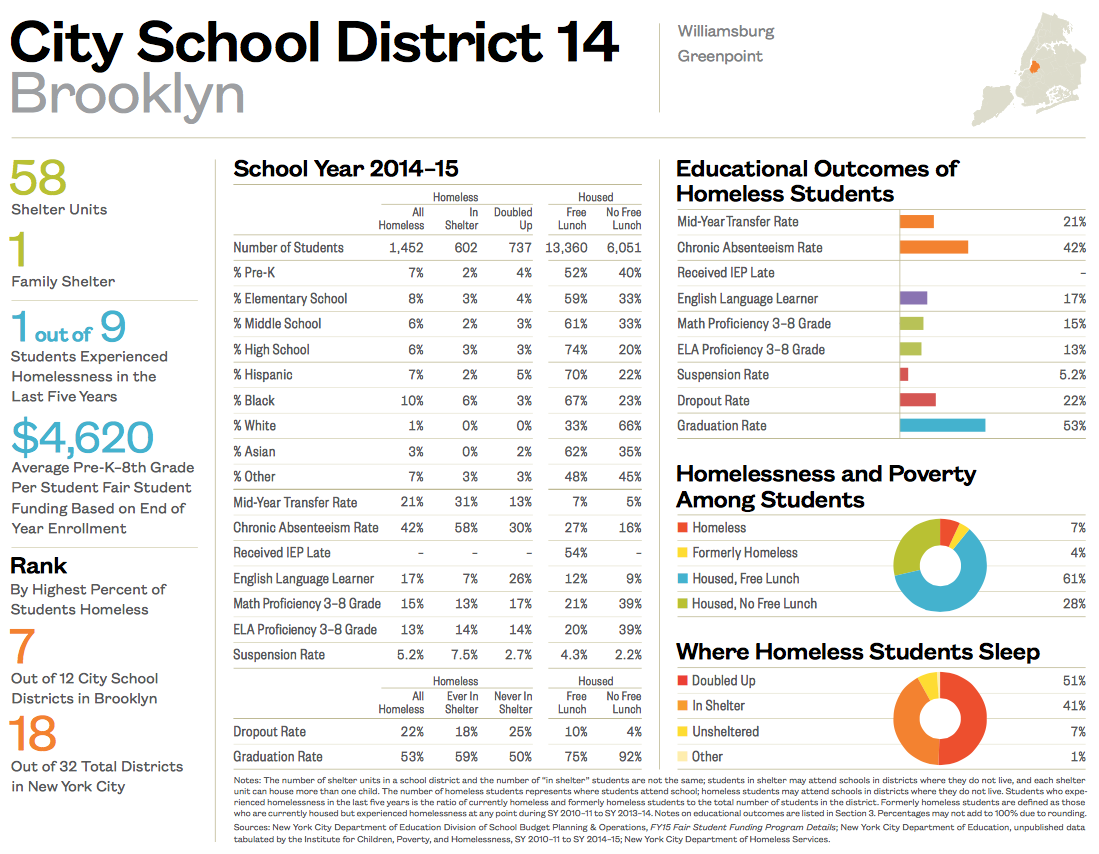
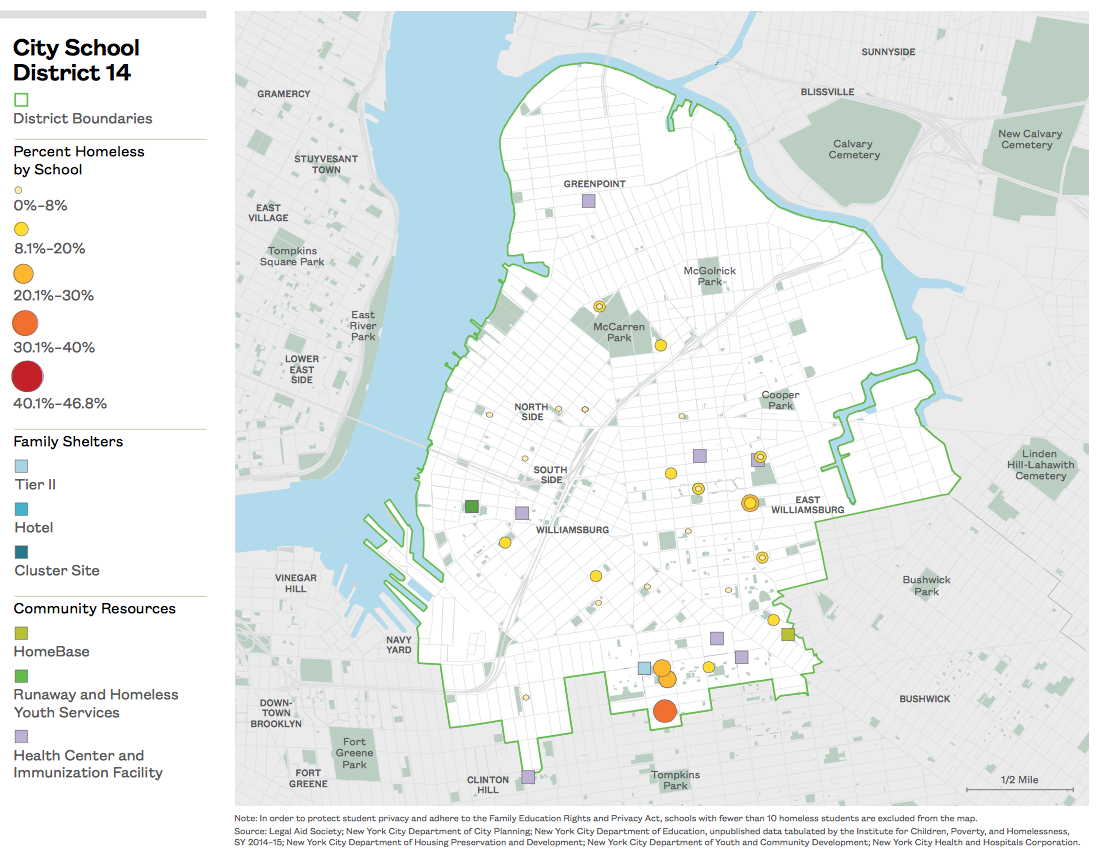
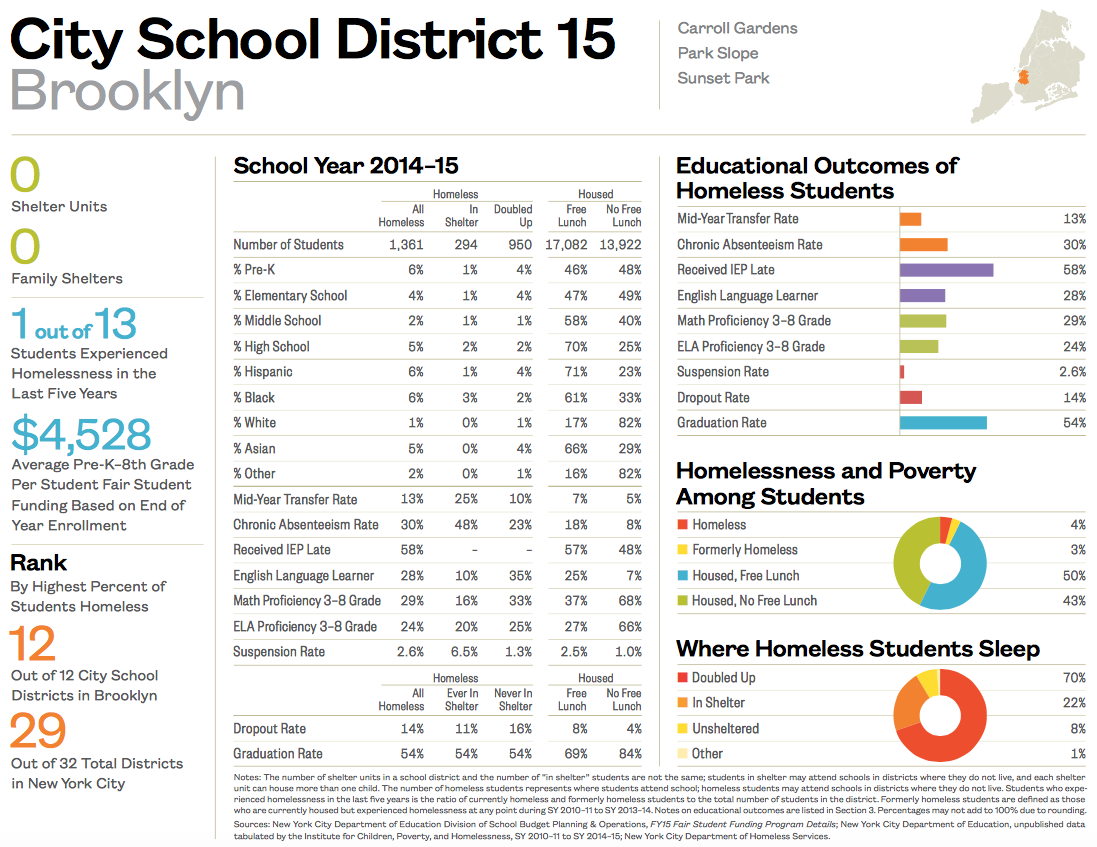
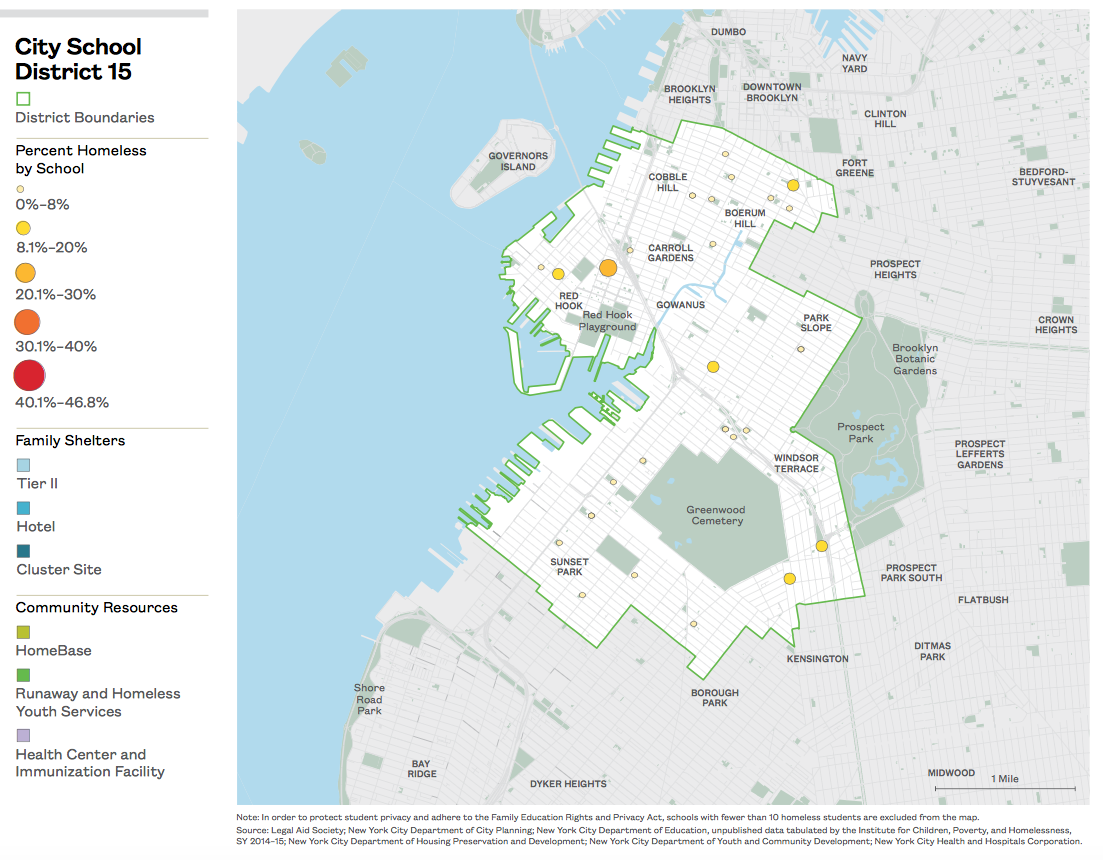
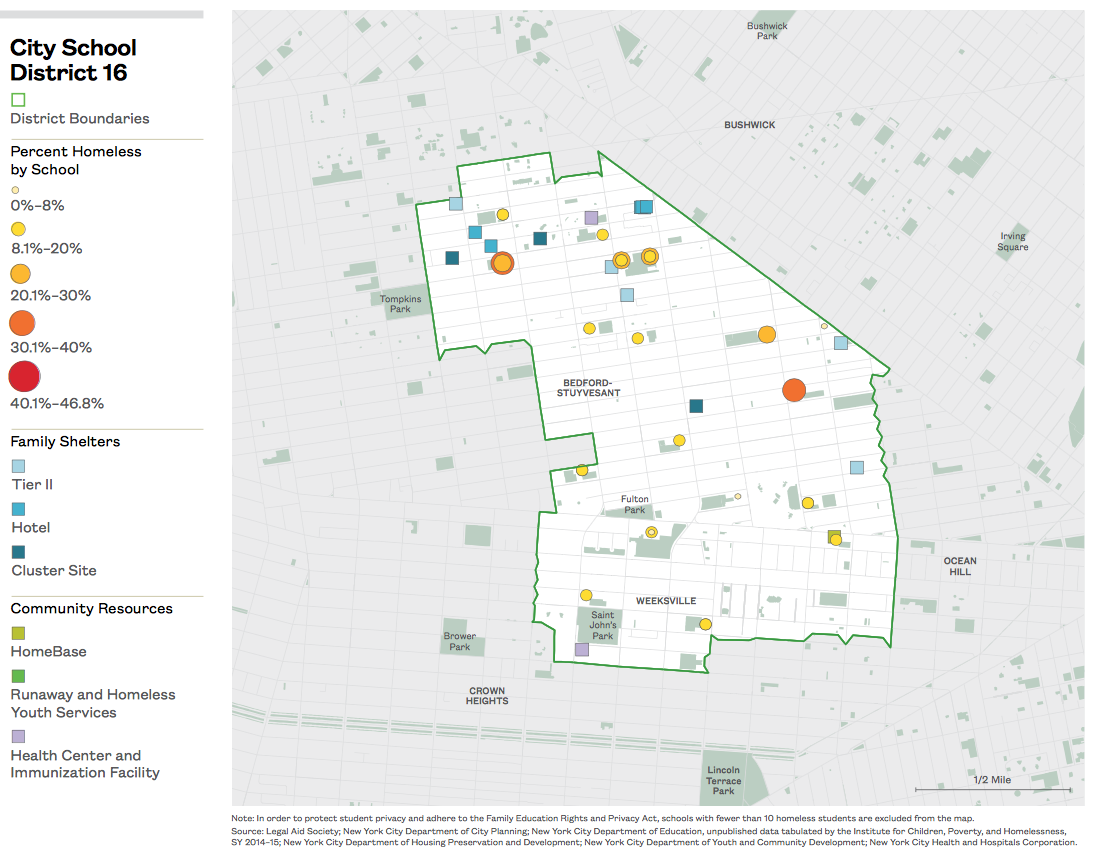
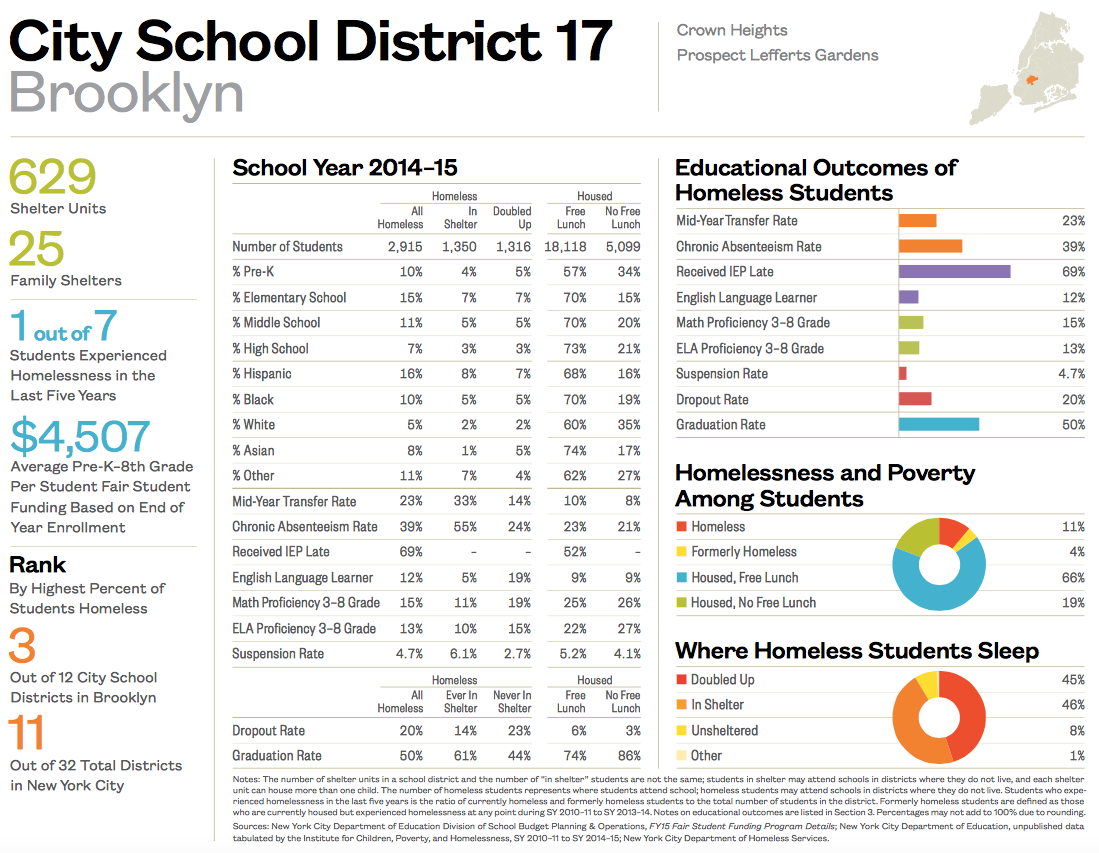
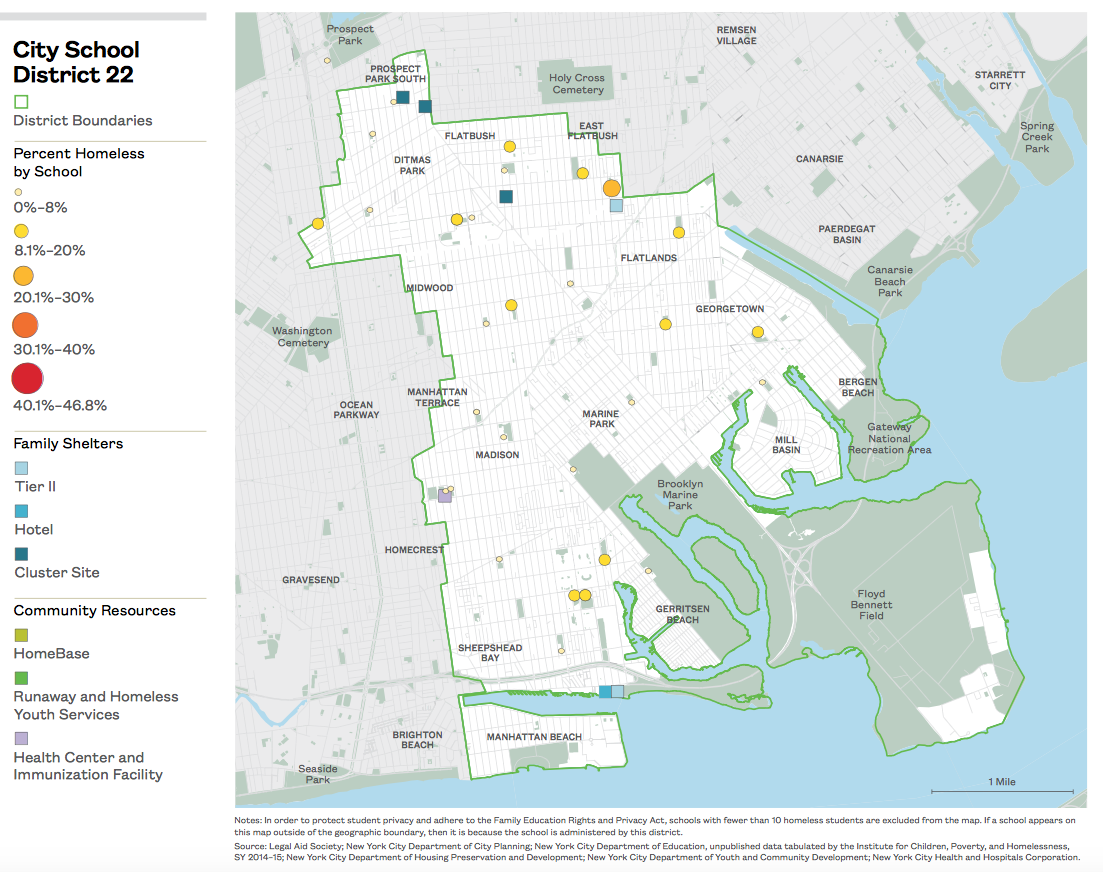
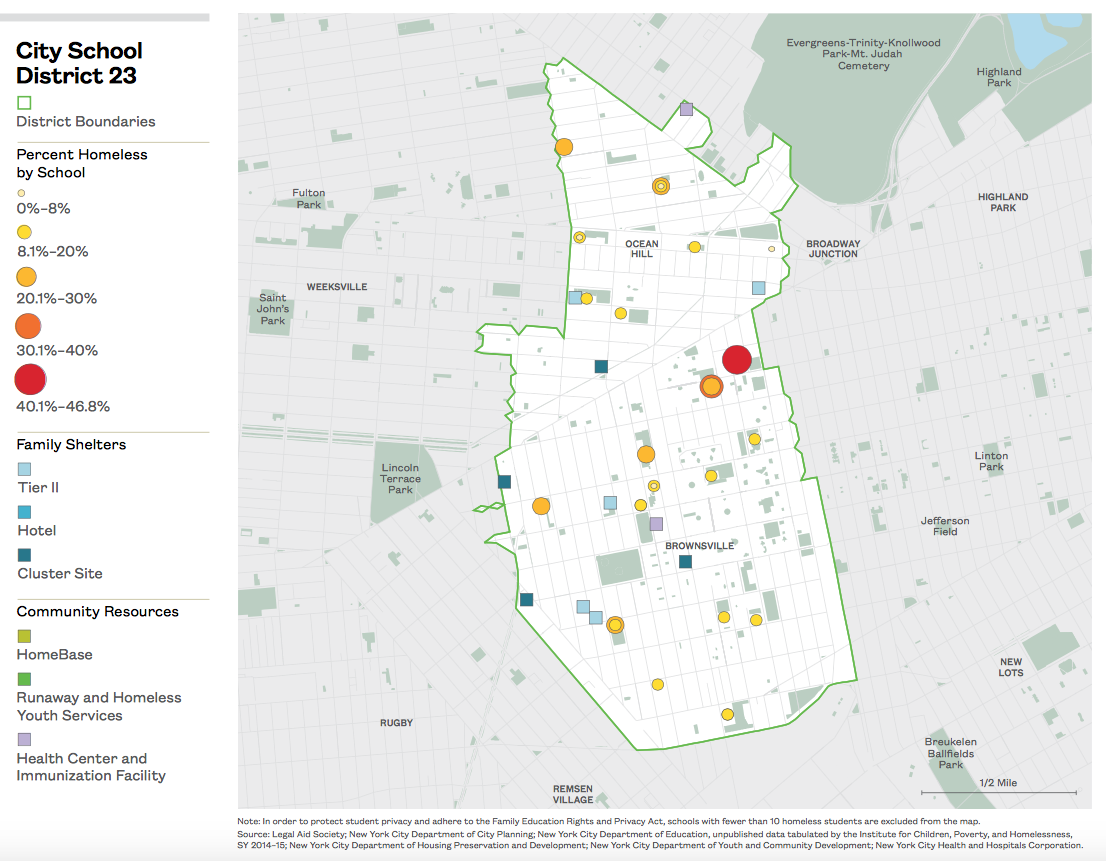
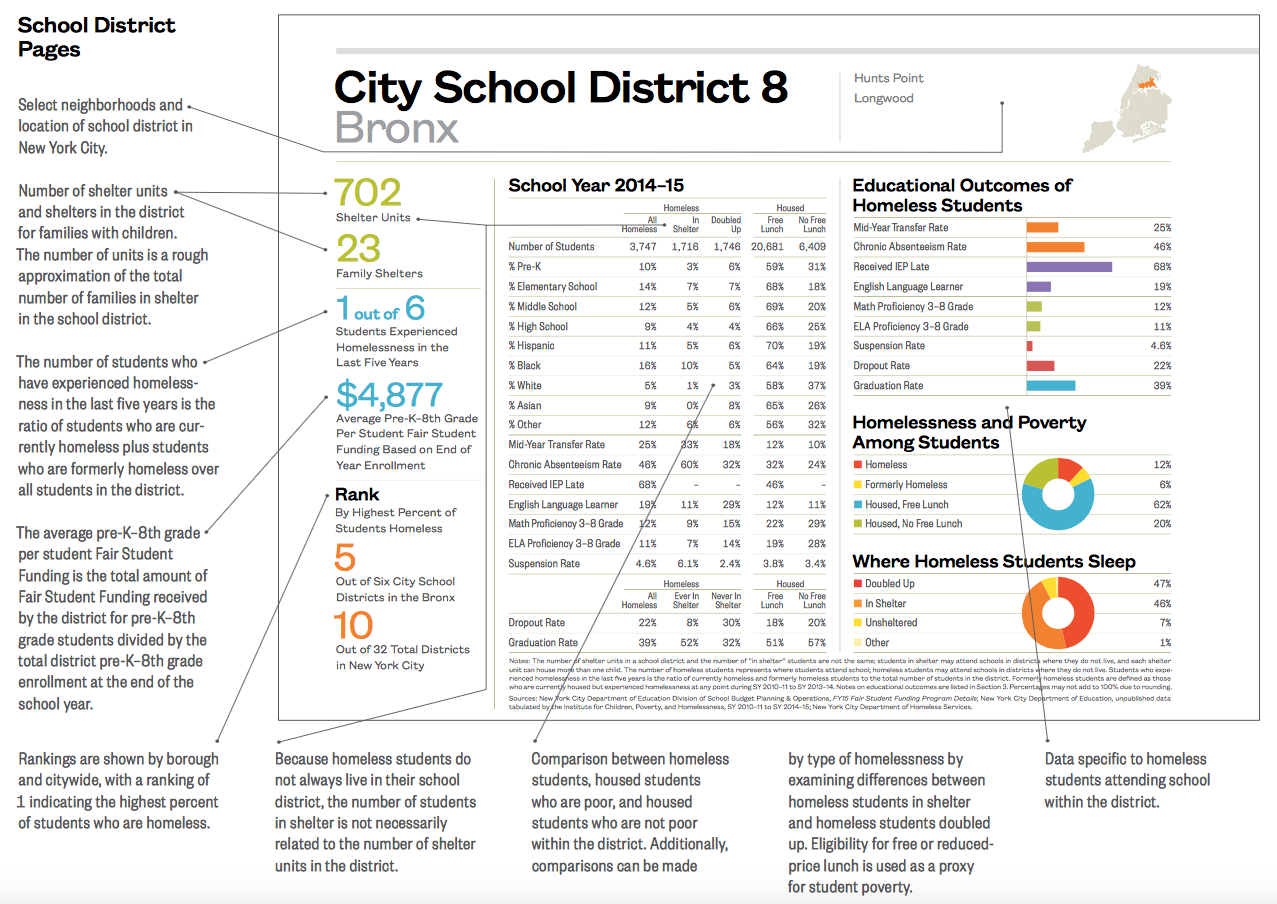
Homeless students attend school in every one of New York City’s school districts. Schools are often the first public agency to discover a child’s housing instability. Once identified, these schools provide vital supportive services to children experiencing housing instability and in some cases to their parents as well. Increasing understanding of student homelessness at the district and school levels is therefore vitally important to meeting the needs of children who are struggling with instability and at risk for poor educational outcomes.
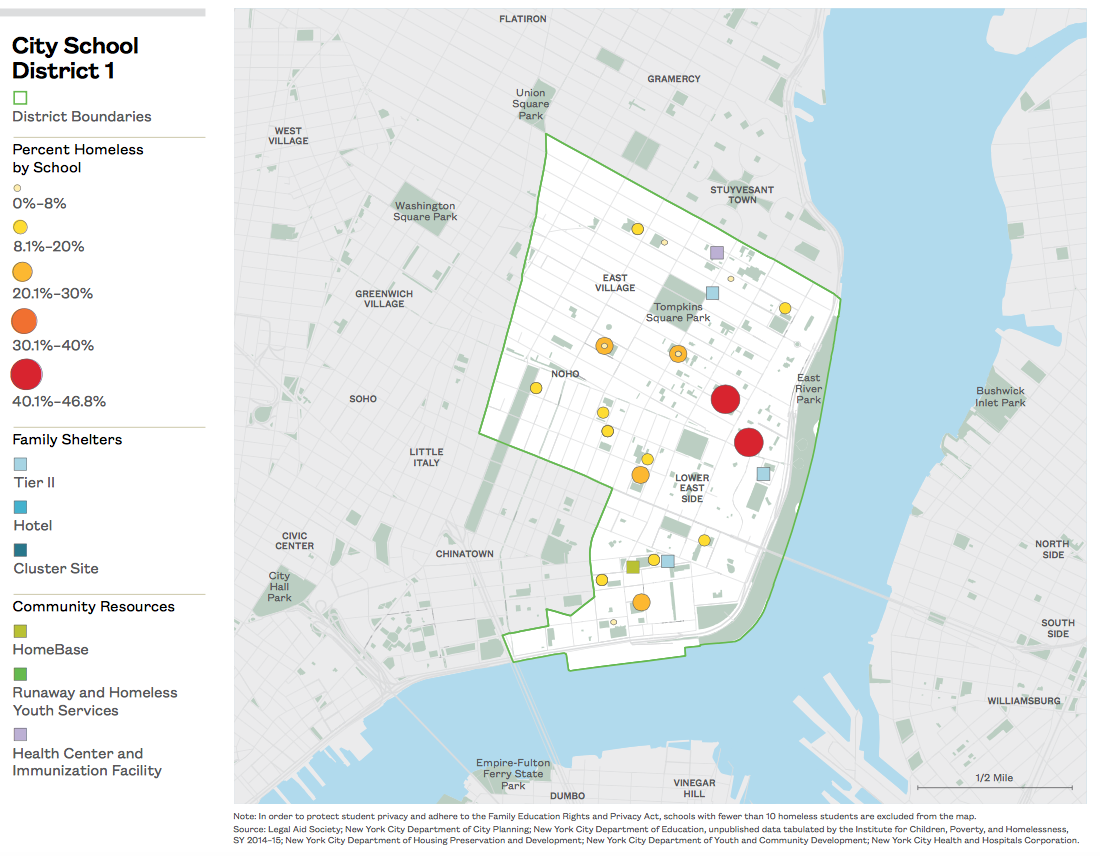
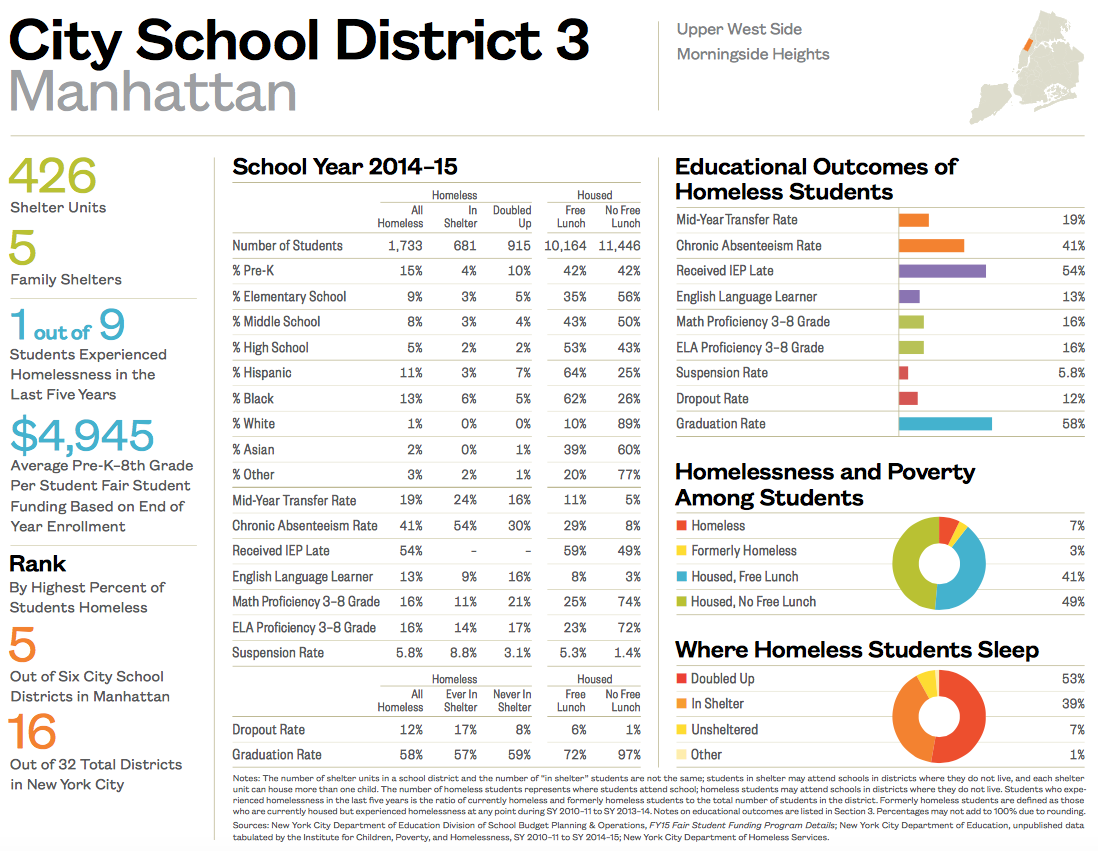
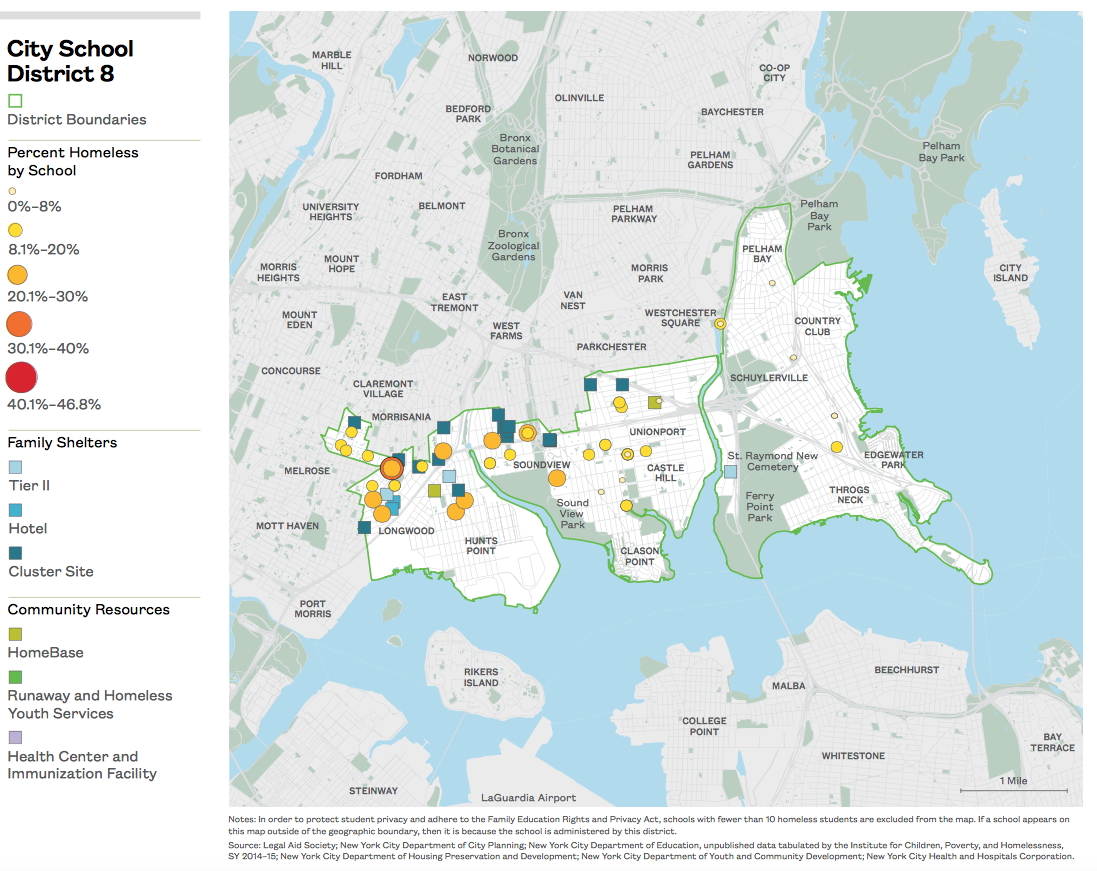
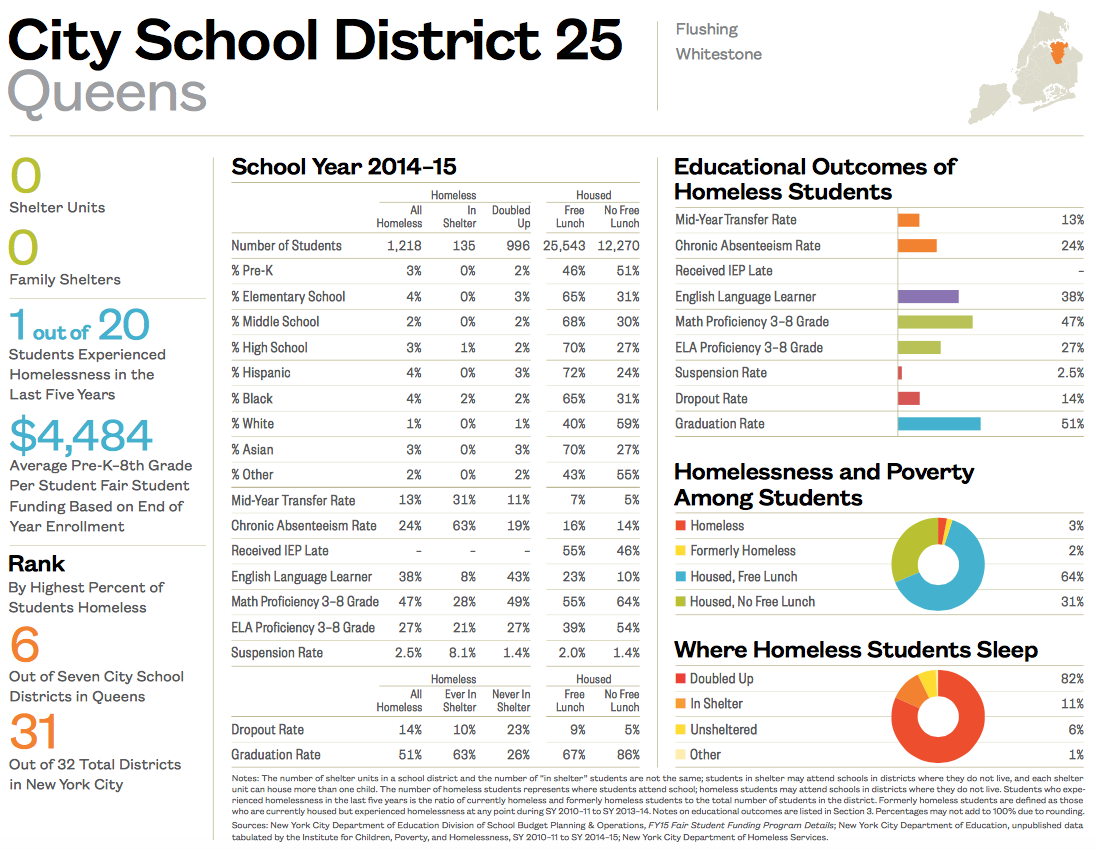
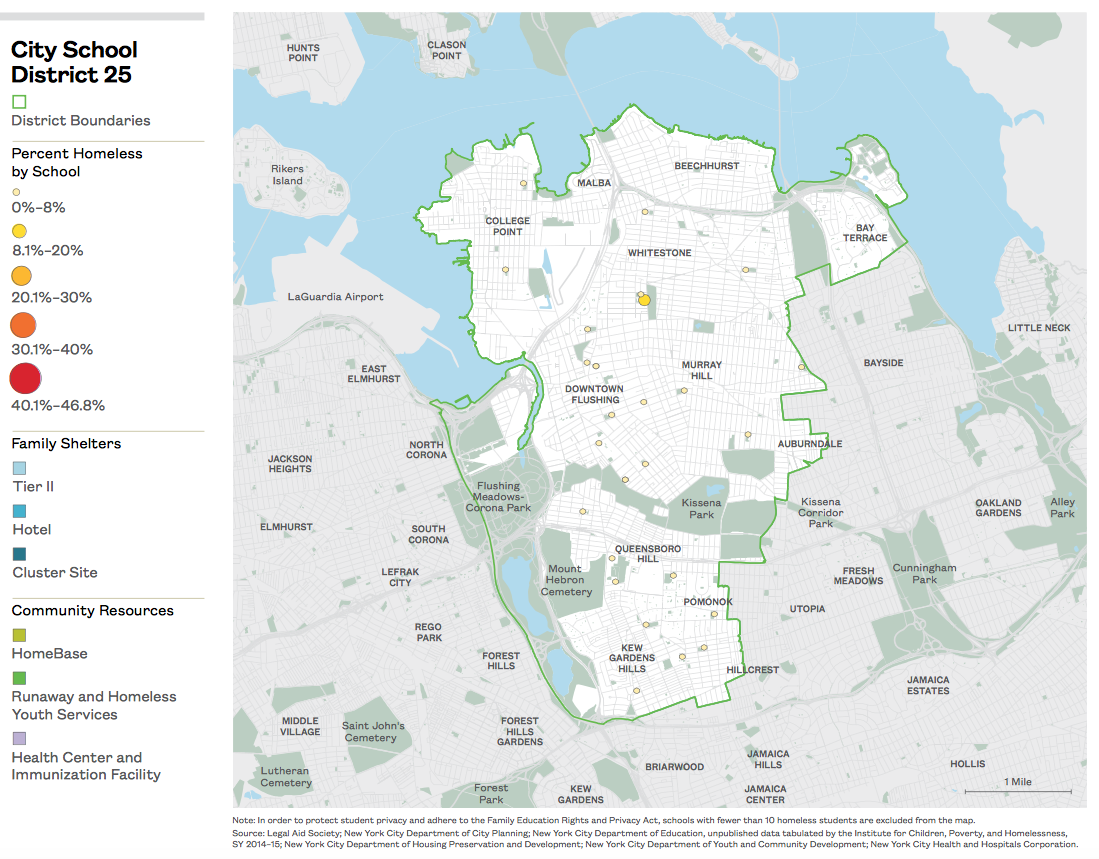
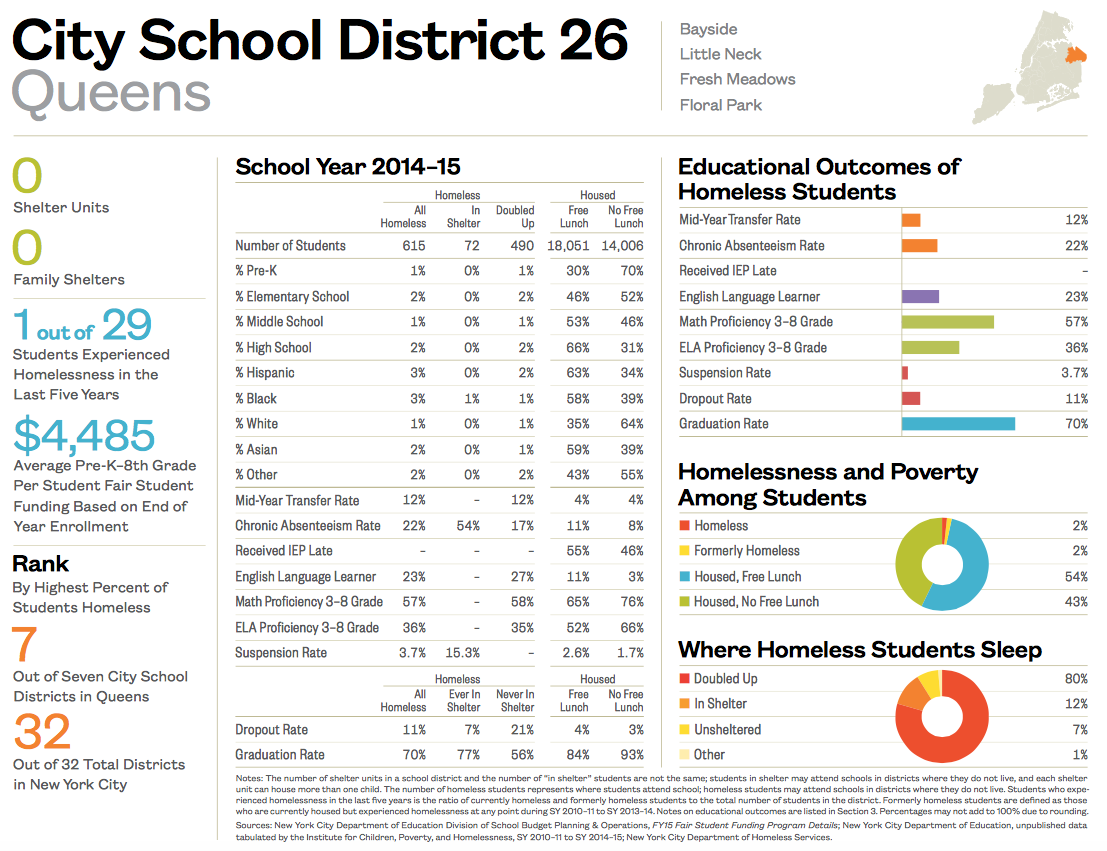
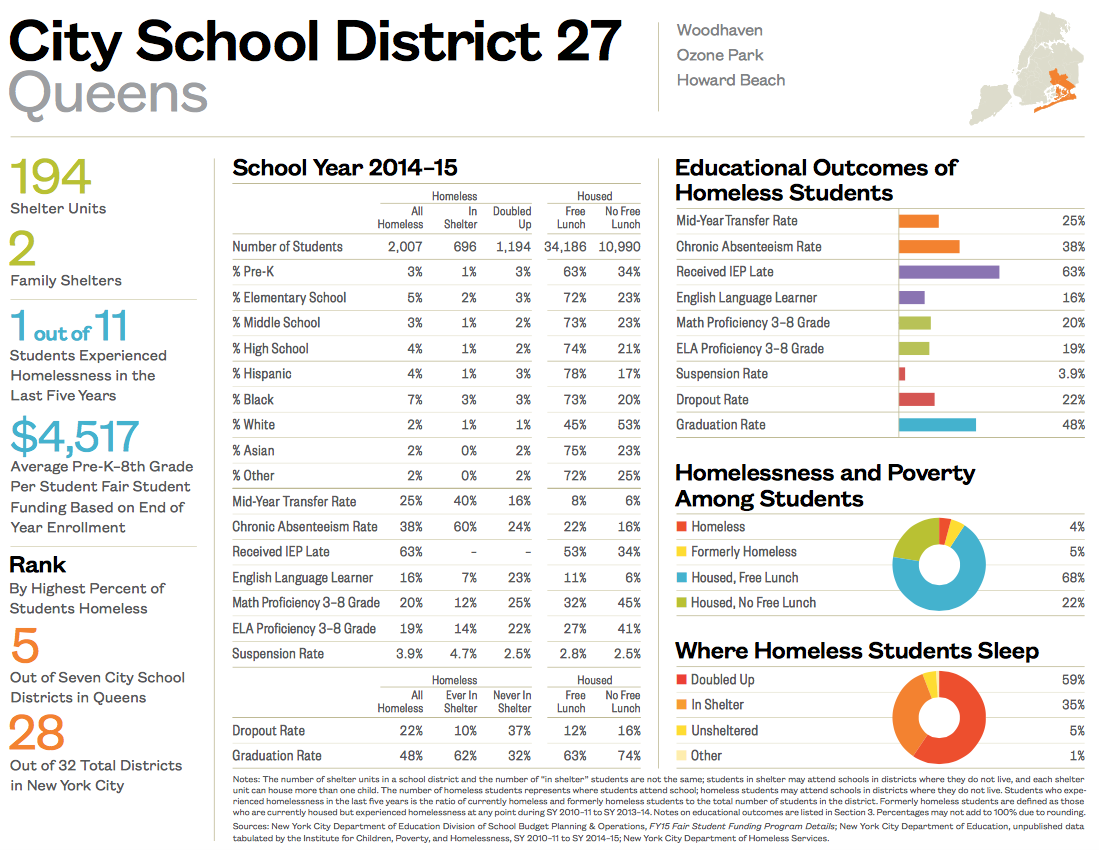
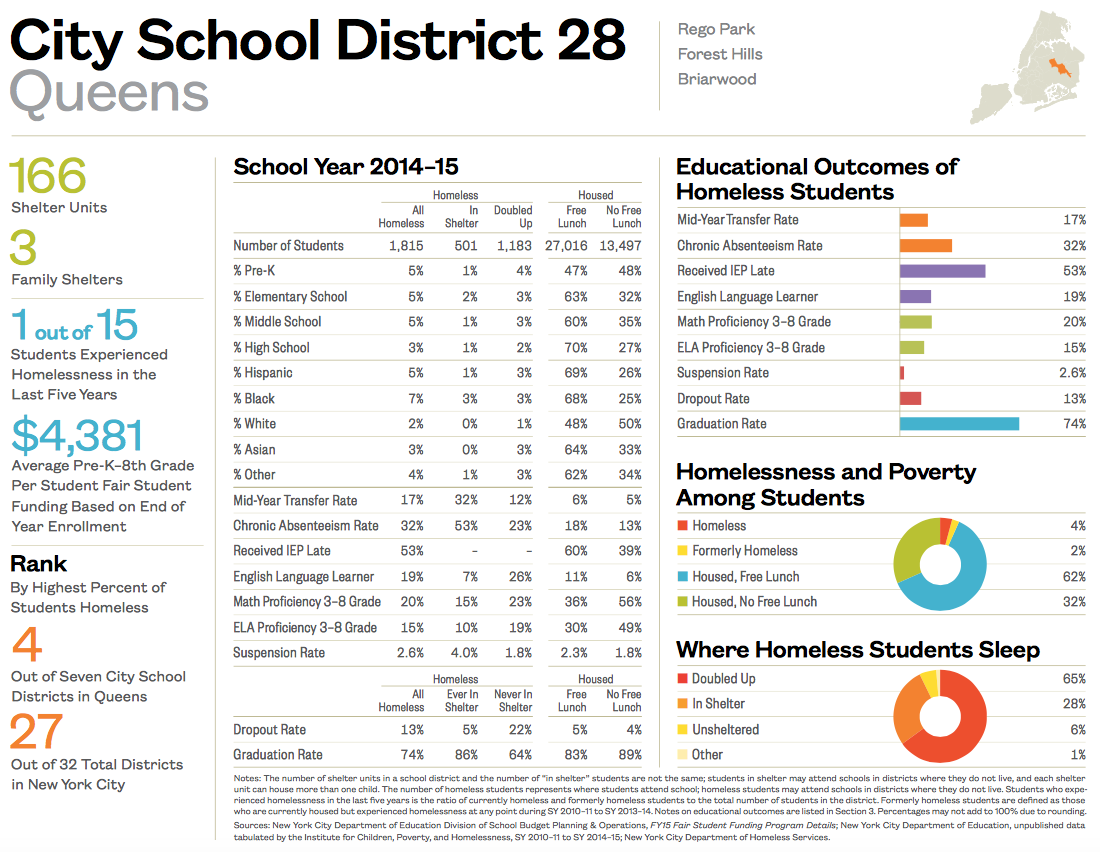
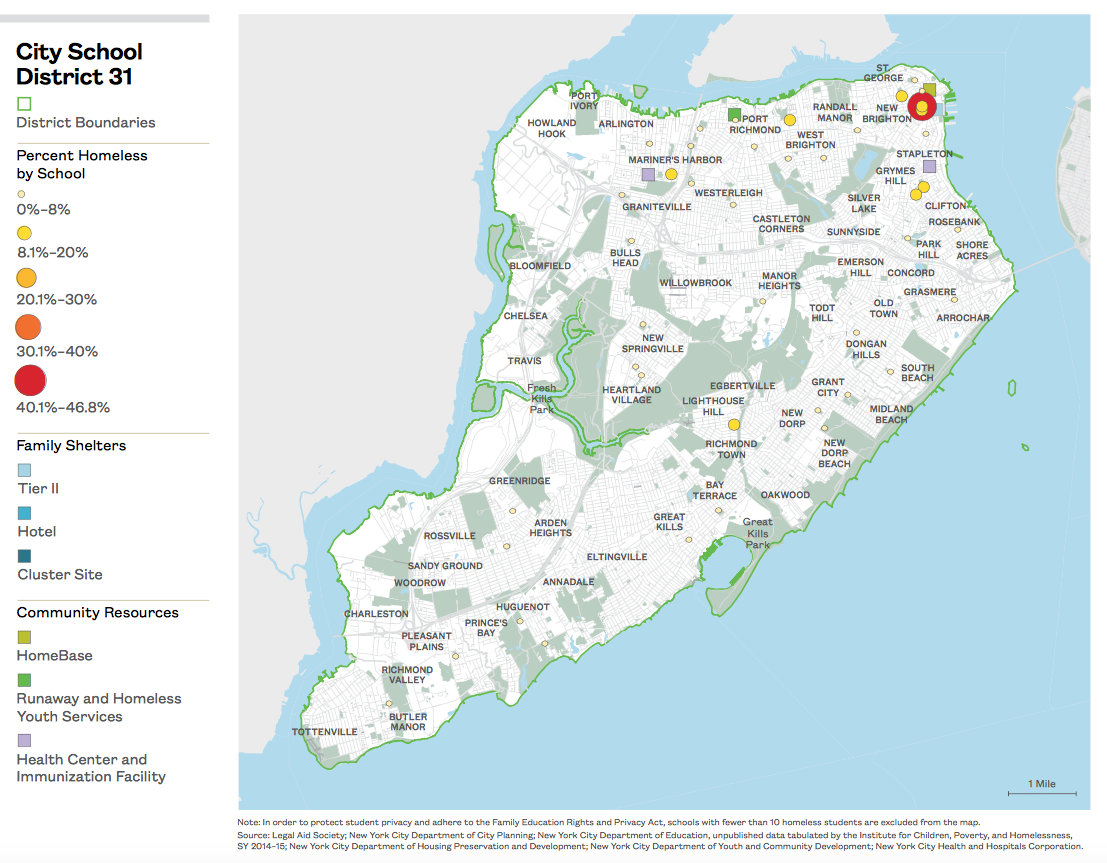
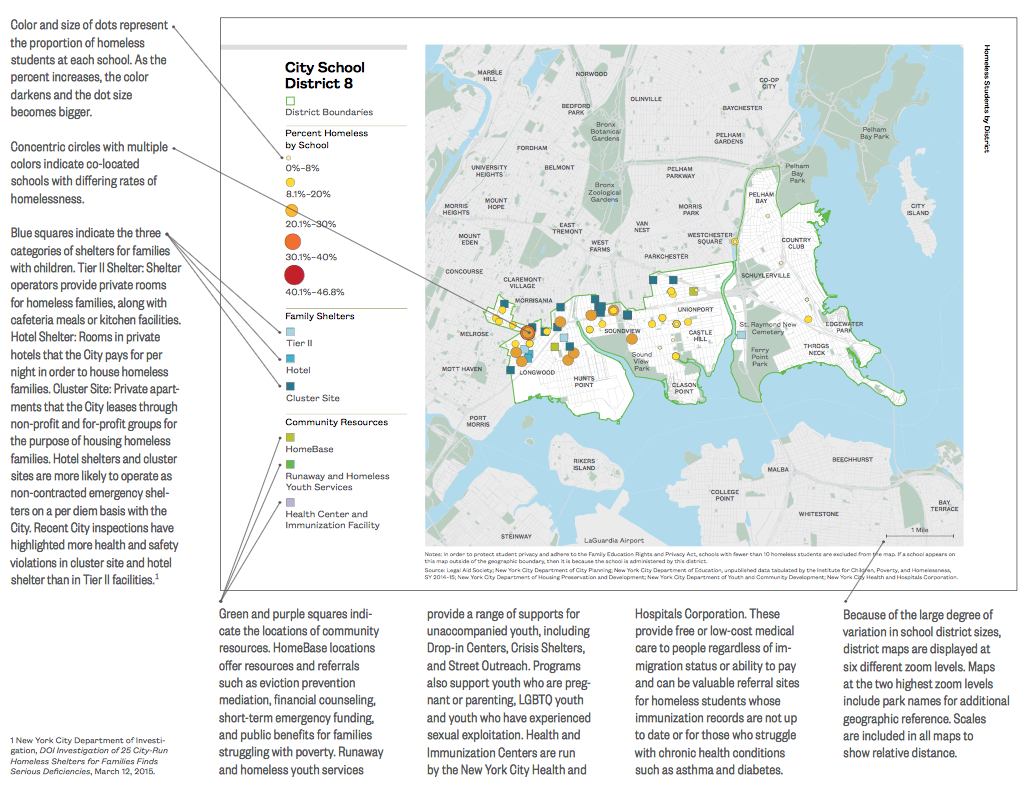
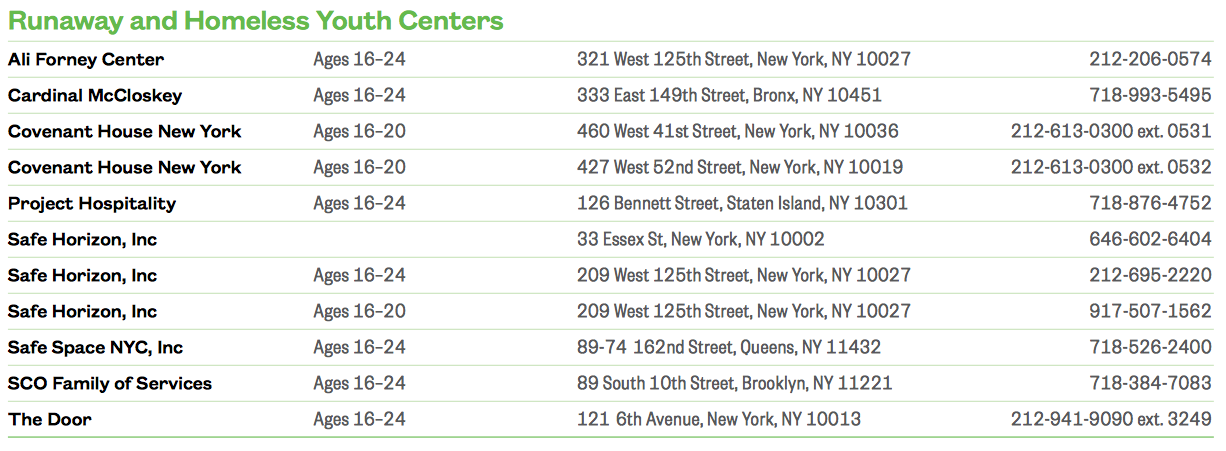
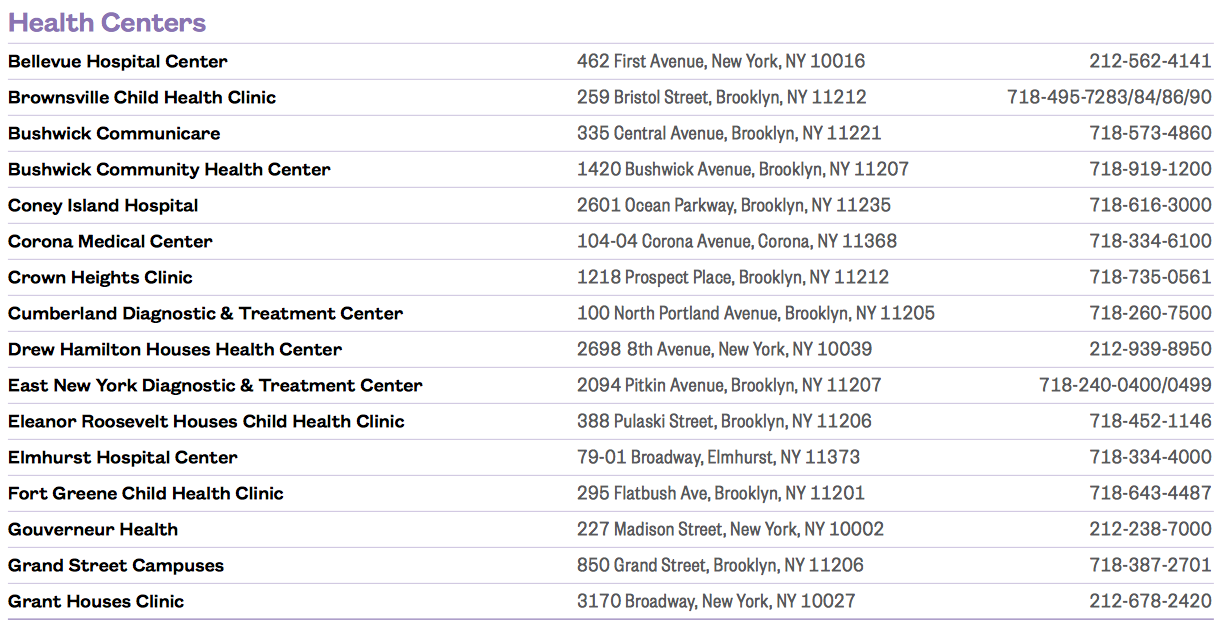
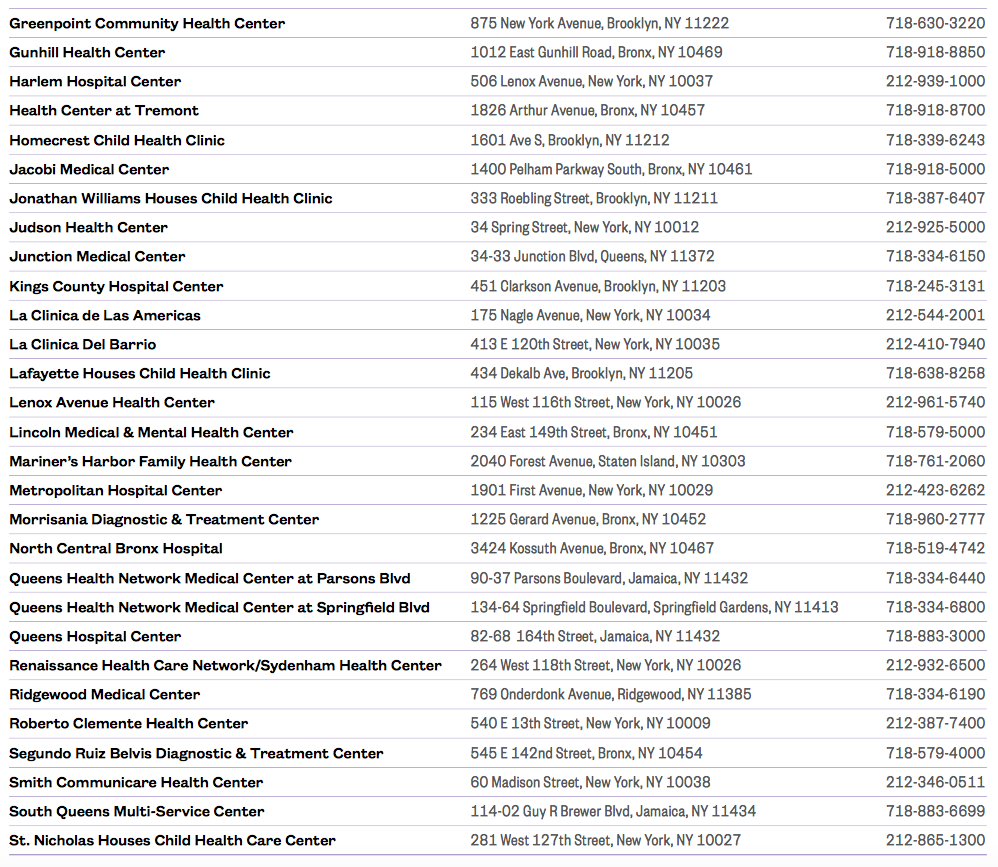
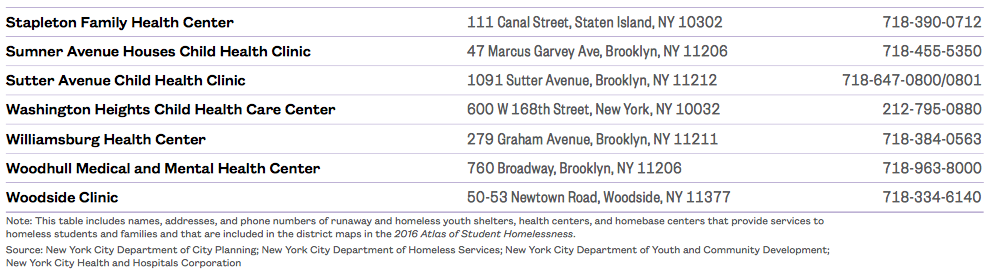
This section provides a map of each school district and includes indicators like the percentage of students who are homeless by school as well as resources such as HomeBase, City medical centers that provide free or low-cost vaccines, and homeless and runaway youth centers. The list of family shelters has been updated to include hotels and cluster sites as well as Tier II facilities. Educational outcomes for each school district provide context for how homeless students are doing compared to their housed peers, and each geographic school district is ranked by the proportion of students experiencing homelessness to provide a city- and borough-wide comparison. Additional information on this year’s district pages include the number of students who are housed but have experienced homelessness in prior school years, the proportion of homeless students who transfer mid-year, and average per student Fair Student Funding based on end-of-year enrollment.
-
In one-quarter of New York City school districts 20% or more of students had experienced homelessness within the past five school years.
-
In eleven New York City school districts, the percentage of students who had experienced homelessness was greater than the percentage of students who had always been housed and were not low-income.
-
District 9, serving the Highbridge neighborhood of the Bronx, was home to 48 shelters with capacity for over 1,700 families with children. This was more than two times the family shelter capacity of the next highest school district, District 19 (East New York), which had 730 units located in 9 different shelters.
xxx
xxx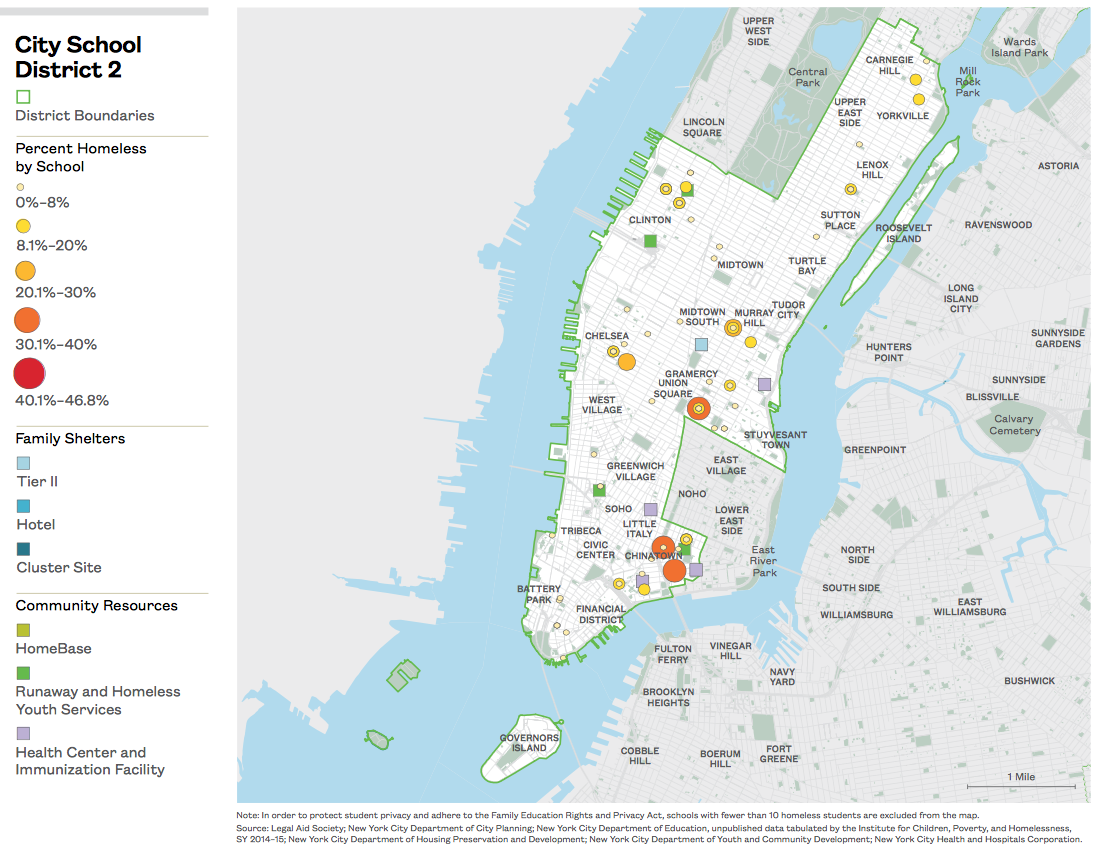
xxx
xxx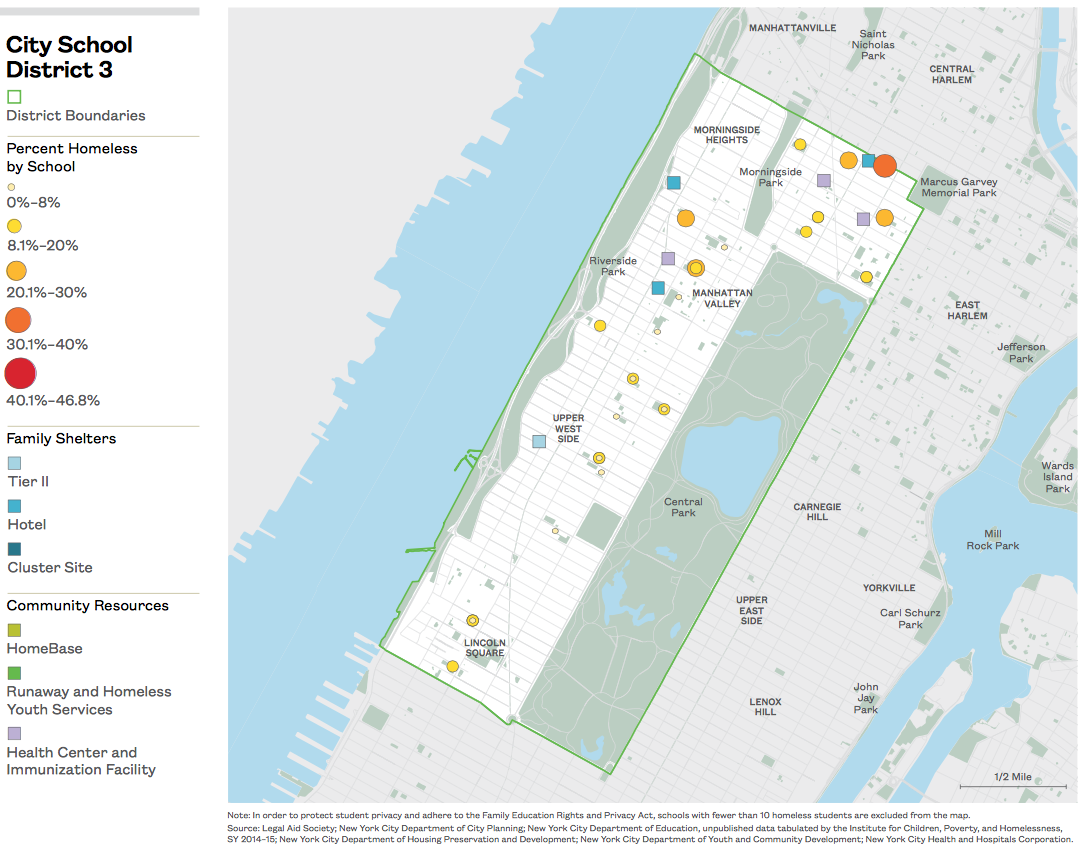
xxx
xxx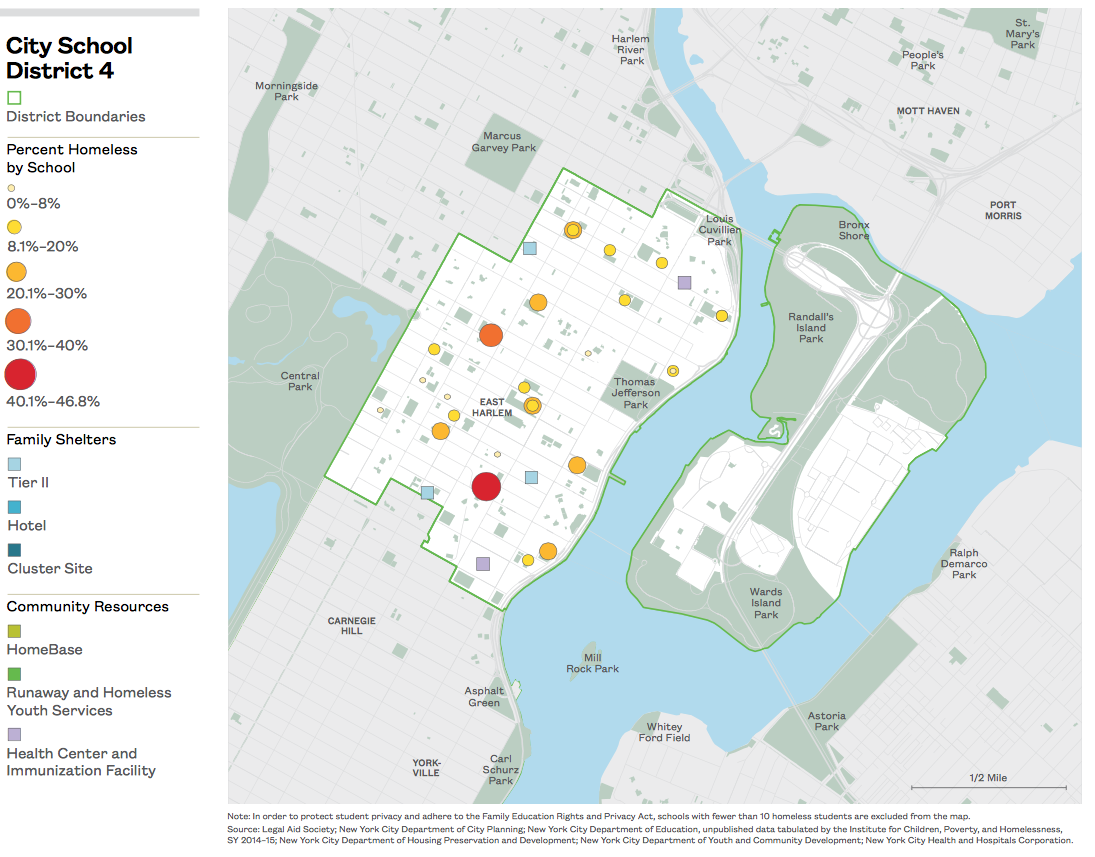
xxx
xxx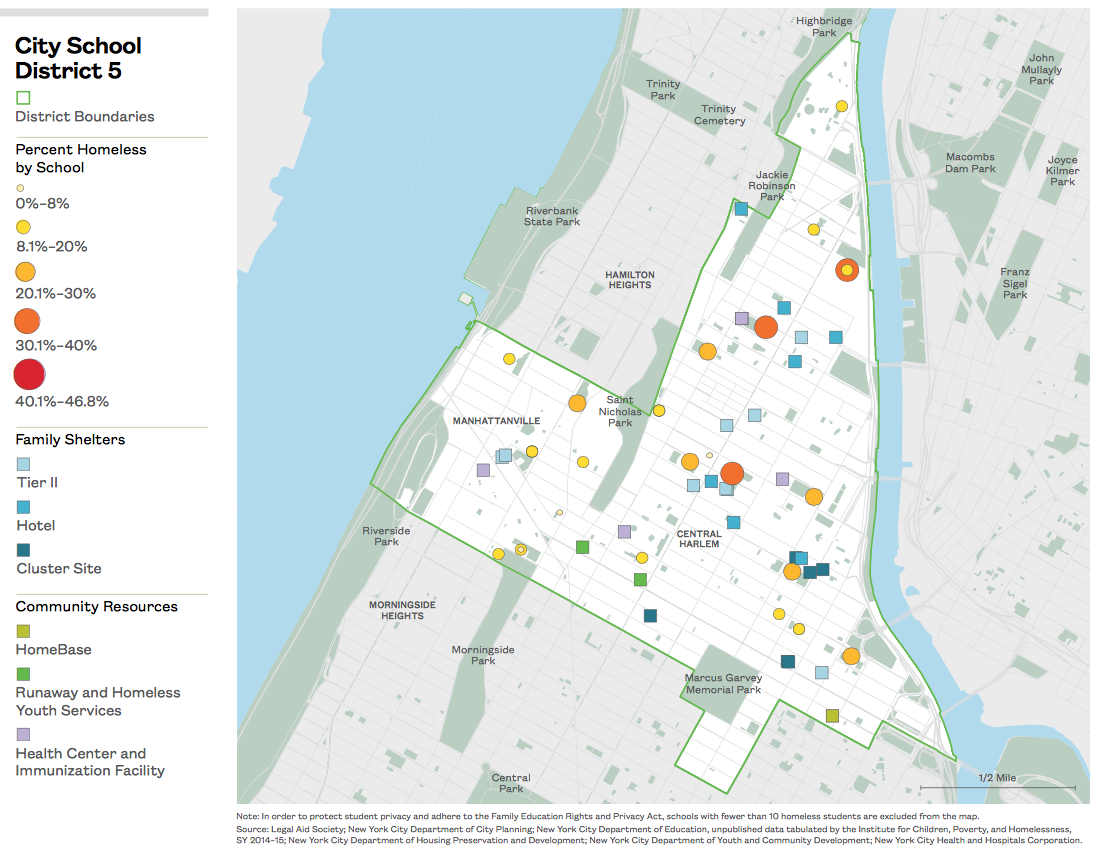
xxx
xxx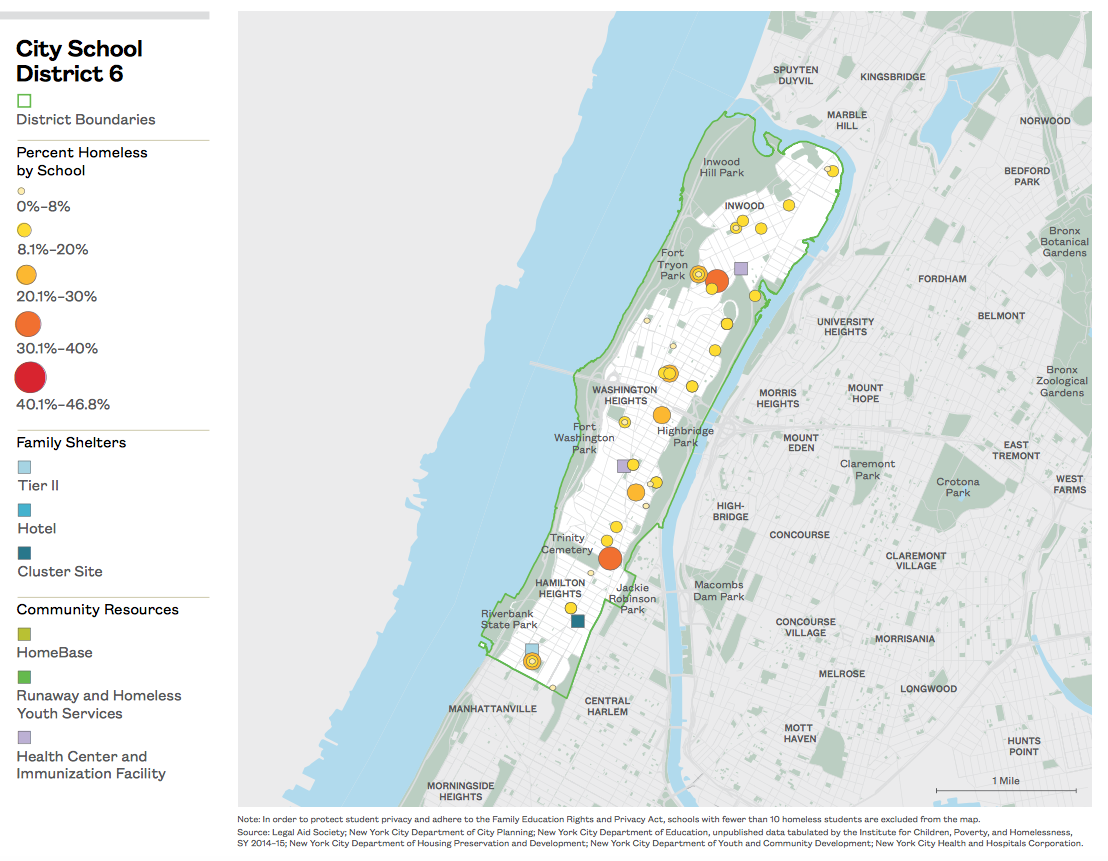
xxx
xxx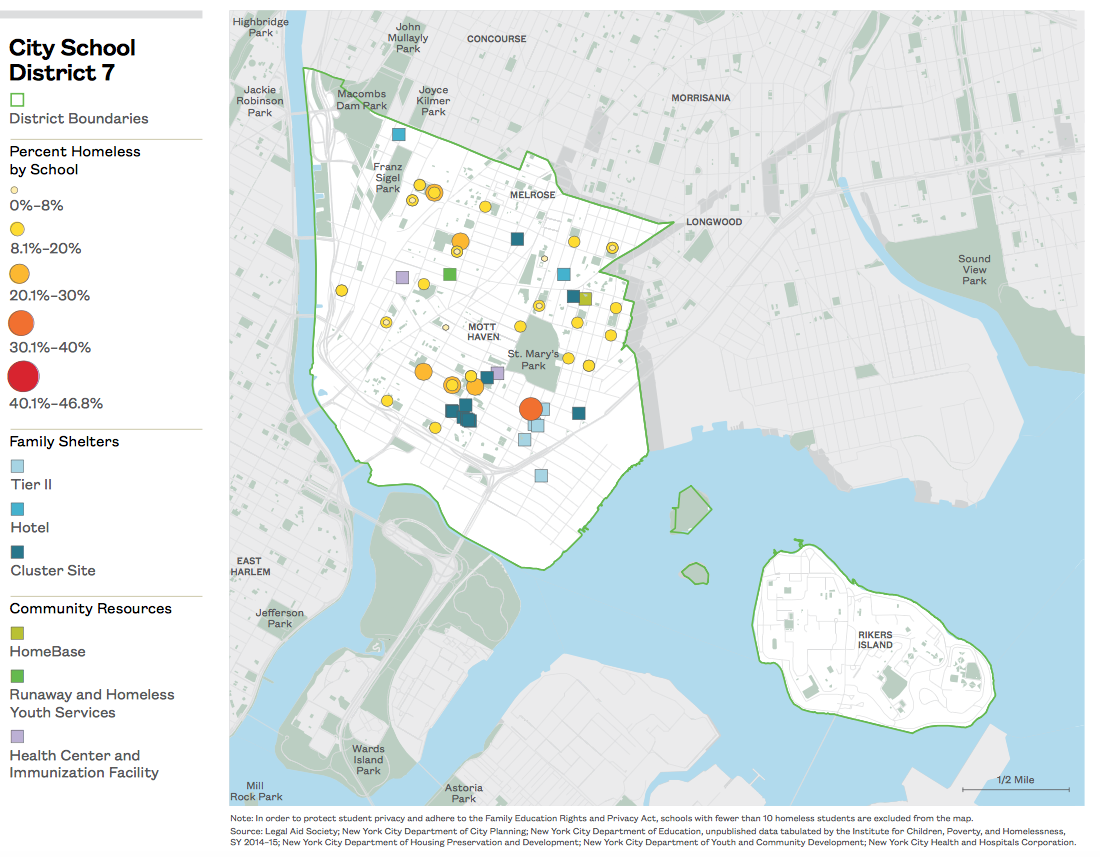
xxx
xxx
xxx
xxx
xxx
xxx

xxx
xxx
xxx
xxx
xxx

xxx
xxx
xxx

xxx
xxx
xxx
xxx
xxx
xxx
xxx
xxx
xxx
xxx
xxx
xxx
xxx
xxx
User’s Guide
The Atlas of Student Homelessness is divided into four sections. Section One provides an overview of homelessness among students in New York City. It focuses on overarching characteristics and citywide trends important to framing policies and programs for students experiencing housing instability. Section Two explores the geographic distribution of homeless students across the city, providing context for conversations concerning resources and allocation of additional supports. Section Three examines how homeless student characteristics and educational outcomes vary by school district, and Section Four provides an in-depth look at student homelessness in each school district—information critical to local program planning and priority setting. Definitions of all terms, as well as a resource list and additional tables by Community, City Council, State Assembly, and State Senate Districts, are included in the Appendix.
The data for the 2016 Atlas of Student Homelessness were provided primarily by the New York City Department of Education. Federal law entitles homeless children to certain educational rights and supports including immediate enrollment in school without the usual required documents and records, which may not be readily available. Based on their needs and district resources, homeless students receive assistance that may include school supplies, transportation, clothes, and after-school programs, as well as other supports. In New York City, schools receive technical support from the Students in Temporary Housing Unit (STH) within the Department of Education and from the New York State Technical & Education Assistance Center for Homeless Students (NYS TEACHS). Teachers and other school personnel are often the first to identify homeless children who have slipped between the cracks of the City’s support systems. This “first responder” role makes schools a vitally important link for meeting the needs of homeless children and their families.1
Citywide Maps
Citywide “heat” maps are included to enable visual comparisons across school districts. While the color of each map varies depending on the information presented, the darkest shade will generally represent the worst outcome and the lightest shade, the best outcome. Most citywide maps are accompanied by tables that enable comparison across school districts as well as by student poverty level and type of homelessness. The five groups shown in the table are: all homeless students, homeless students living in shelter, homeless students living doubled up, housed students eligible for free or reduced-price lunch, and housed students not eligible for free or reduced-price lunch. Eligibility for free or reduced-price lunch is a common proxy for low-income status. In the 2016 Atlas of Student Homelessness text, “low-income students” is often used interchangeably with eligibility for free or reduced-price lunch. All homeless students are automatically eligible for free or reduced-price lunch.
Methodology
The New York City Department of Education provided access to de-identified student-level data for all students attending New York City public schools between the school years of 2010–11 and 2014–15. These data, recorded at the end of each school year, were linked to annual student housing status information through a unique scrambled student identifier. All students were geocoded based on their last school of enrollment and their school district number. In order to protect student privacy and adhere to the Federal Education Rights and Privacy Act, all numbers and percentages that could potentially reveal fewer than 10 students have been redacted. For data reliability, all percentages calculated using fewer than 30 students have also been omitted. Shelter locations and capacity were identified using multiple sources to corroborate addresses.2 Based on the number of family shelters listed in the December 2015 Shelter Repair Squad Scorecard—Shelter Building Listing, 91% of total Tier II shelter units, 74% of total cluster site shelter units, and 83% of total hotel shelter units in New York City are included in the 2016 Atlas of Student Homelessness. The remaining shelters are not included due to missing or incomplete address information (1,887 units out of 12,839 total family shelter units citywide).
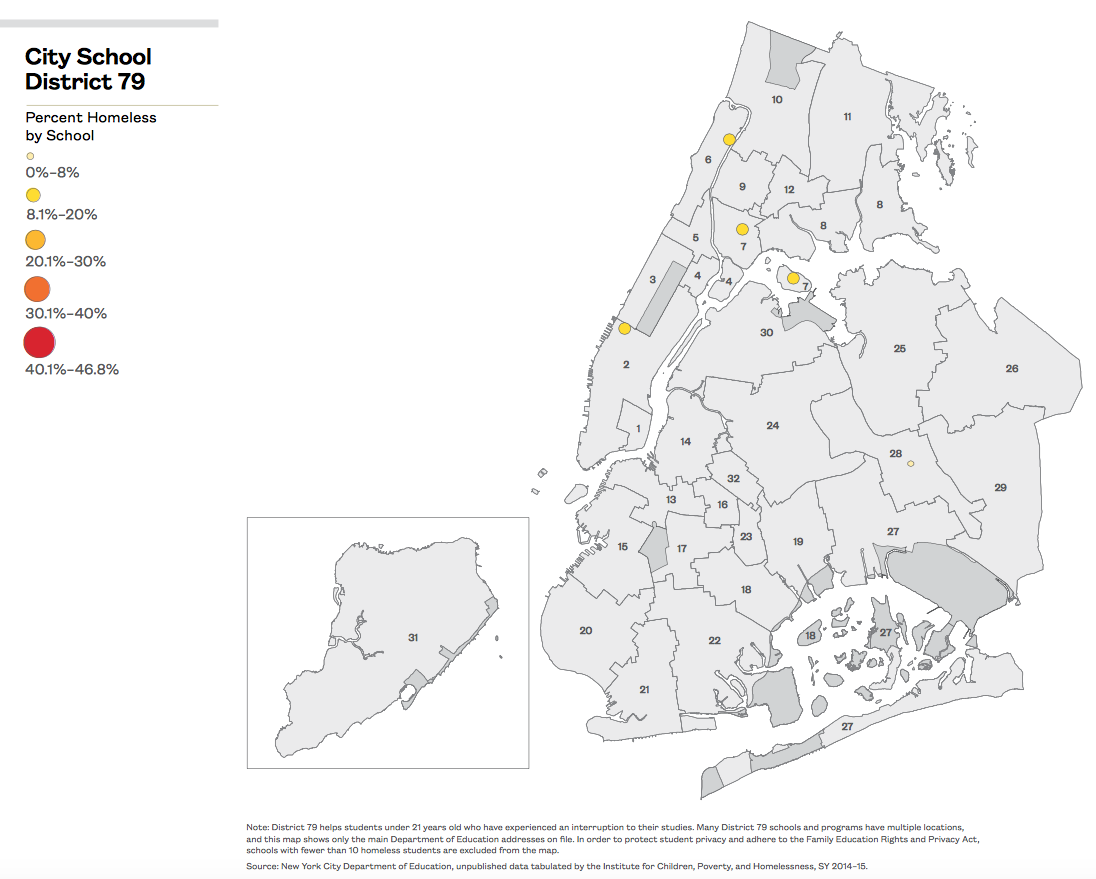
Out of 1,753 total public schools in New York City in SY 2014–15, 1,682 (96%) had a physical address and were mappable. An additional 322 schools in which fewer than 10 students were homeless were excluded to protect student privacy and one school was excluded because it was located outside of the geographic boundary of New York City, leaving 1,359 schools in the citywide map. Because of the large degree of variation in school district size, individual district maps are shown in six different scales, with the distance per inch at the bottom. Only schools that are administered by a given district are included in each map. For easy comparison, data groupings for the percentage of students homeless by school on district-level maps are matched to those used in ICPH’s 2015 Atlas of Student Homelessness. Natural breaks—a method of grouping data with similar values while maximizing the difference between groups—were used for all other maps, unless otherwise noted. Data analysis for the 2016 Atlas of Student Homelessness was conducted in Stata and geographic maps were created in ArcGIS.
Limitations
Because homeless students are eligible under the McKinney-Vento Act to remain at their school of origin or enroll in their local school, data represent where students attend school and should not be interpreted as providing information about where homeless students live.3 Information presented in the 2016 Atlas of Student Homelessness is specific to homeless students attending New York City Department of Education Public Schools and should not be generalized to New York City Charter Schools. While the total number of homeless charter school students is reported to the State annually, more detailed information on the outcomes of homeless students attending charter schools is not publicly available. Finally, information on homeless students and families is self-reported by the family. A family that does not wish to be identified as homeless may not report that status.
1 New York City Department of Education, Students in Temporary Housing, http://schools.nyc.gov/StudentSupport/NonAcademicSupport/StudentsinTemporaryHousing/default.htm (accessed July 20, 2015).
2 New York City Department of Homeless Services, Shelter Repair Squad Scorecard–Shelter Building Listing, December 2015; New York City Department of Housing Preservation and Development, HPD Building, Registration, and Violation, http://www1.nyc.gov/site/hpd/index.page (accessed May 2016); Legal Aid Society, DHS Family Shelter Facilities, http://www.legal-aid.org/en/civil/civilpractice/homelessrightsproject/materials/toc.aspx (accessed May 2016).
3 U.S. Department of Education, “Laws & Guidance: Part C–Homeless Education,” http://www2.ed.gov/policy/elsec/leg/esea02/pg116.html (accessed July 20, 2015).
Appendix
Glossary of Terms
All Homeless/Currently Homeless
Students who were homeless at any time during school year 2014–15, regardless of whether they were living doubled up, in shelter, unsheltered, or in another temporary living situation.
Always Housed
A student who has not experienced homelessness at any time between SY 2010–11 and SY 2014–15.
Awaiting Foster Care
Students who are living in a non-permanent, transitional, or emergency out-of-home foster care placement.1
Chronically Absent
Missing 20 or more days in the school year. Absences do not include days missed due to suspension or school-wide releases.
Dropout Rate (Four-Year)
The percentage of students who entered ninth grade in 2011 and within four years left high school without graduating.
Educational Outcomes
Events that take place during a student’s time in school (such as graduation, dropping out, repeating a grade, chronic absenteeism, and standardized test scores) that are recognized indicators of educational challenges and successes.
Elementary School
Kindergarten through 5th grade.
English Language Arts (ELA) Test
Every year, the New York State Education Department administers a standardized test to students in 3rd through 8th grade to assess the proficiency of students across New York State in reading, writing and comprehension.
English Language Learner (ELL)
A student who speaks a language other than English at home and scores below proficient on English assessments upon entering the New York City Public School system. Students determined to be English Language Learners receive targeted instruction in English as a Second Language, Native Language Arts, and English Language Arts.
Enrollment
Audited Register: The count of students taken every year on October 31. This is the official enrollment figure, off of which school funding is estimated.2
Biographic Register: The count of students who are enrolled in a school at any point during a particular school year.
End-of-Year Enrollment: The count of students who are enrolled in a school on the last day of a particular school year.
Late Enrollment: Students who enter a school after October 31 of a particular school year from outside of the New York City Public School system.
Ever Homeless
Students who were homeless at any point between SY 2010–11 and SY 2014–15, the years for which data were available.
Ever in Shelter
Students who lived in a shelter at any point during a specified time period. In this report, “ever in shelter” refers to students enrolled in high school who were in shelter at any point between SY 2011–12 and SY 2014–15. This term is used in this report when measuring the four-year dropout rate and graduation rate by school district.
Family Education Rights and Privacy Act (FERPA)
A federal law that protects the privacy of student education records for schools that receive applicable program funds from the U.S. Department of Education.3
Family Homelessness
Homeless families are defined by two separate categories: “families with children” are one- or two-parent households with children under 21, while “adult families” consist of couples or related family members without children under 21. Families with children and adult families have separate shelter systems and must be screened for eligibility upon applying for shelter, although the law requires that they be temporarily housed during this process. Prior to 2008, data that separate families with children and adult families were not available.
Family Homeless Shelter
Most family homeless shelters receive payments from the City but are privately owned. Shelter operators provide private rooms for homeless families, along with cafeteria meals, kitchen facilities, or restaurant vouchers. Family shelters are divided into three categories (cluster site, hotel shelter, and Tier II shelter), depending in part on the services that are available. The level and availability of social services, including childcare and case management, at each shelter location varies greatly.
Cluster Sites: DHS utilizes space in privately-owned residential buildings that house both rent-paying tenants and DHS clients or exclusively DHS clients. Cluster site apartments were found by the New York City Department of Investigations to be the worst maintained and most poorly monitored of all three types of family shelters, as well as offering the least adequate social services to families. Many cluster site apartments do not have contracts with the City.4
Hotel Shelters: DHS utilizes private hotel capacity to shelter homeless families. These hotels are for-profit institutions that do not operate under City contracts. Hotel operators provide private rooms with kitchenettes and generally limited services. In some instances, individual rooms are rented in hotels and motels on a per diem basis.5
Tier II Shelters: Typically the best maintained of all types of family shelters with the most social services to occupants. Most Tier II shelters are run by nonprofit organizations in privately-owned buildings, operate under contracts with the City, and are regulated by both the City and State. Shelter operators provide private rooms for homeless families, along with kitchen facilities or food service.6
Family Shelter Unit: A self-contained, furnished unit in a family shelter. Family shelter capacity is counted in units, which usually serve two to four people, rather than being counted as beds, as is done in the single individual homeless population.
Formerly Homeless
A student who was housed during SY 2014–15 but homeless at any point during SY 2010–11, SY 2011–12, SY 2012–13, and/or SY 2013–14.
Free Lunch
Students are eligible for free or reduced-price lunch if their family earns 185% of the Federal Poverty Level or less—$37,167 or less for a family of three in 2015.7
Funding
Fair Student Funding: Refers to funds from the Department of Education’s budget given to each school based on grade levels served, student poverty, English Language Learners, special education needs, and whether a school offers specialized programs. Not included in the funding formula is how many students at a school are homeless.8
Net Loss or Gain in Fair Student Funding: The estimated difference in funding between the beginning and end of a particular school year. The difference is based on changes in enrollment from the beginning of the school year to the end.
Per Student Fair Student Funding Based on End-of-Year Enrollment: A calculation that takes into consideration the real Fair Student Funding amount from SY 2014–15 reported by the Department of Education divided by the total number of students enrolled at the end of the school year.
Grade-Level Proficiency
English Language Arts and math test scores are recorded on a 4-point scale. A score of 3 indicates that the student has achieved grade-level proficiency in the subject, while 4 indicates above-grade-level proficiency. Although performance on assessment tests is not the only factor determining student retention, failure to pass can result in a student being retained.
Graduation Rate (Four-Year)
The percentage of students who entered ninth grade in 2011 and graduated within four years with a Local, Regents, or Advanced Regents diploma.
Health Center and Immunization Facility
Clinics run by the New York City Health and Hospitals system that provide sliding scale or no-cost health care services to uninsured and low-income New Yorkers, regardless of ability to pay or immigration status.9
High School
9th through 12th grade.
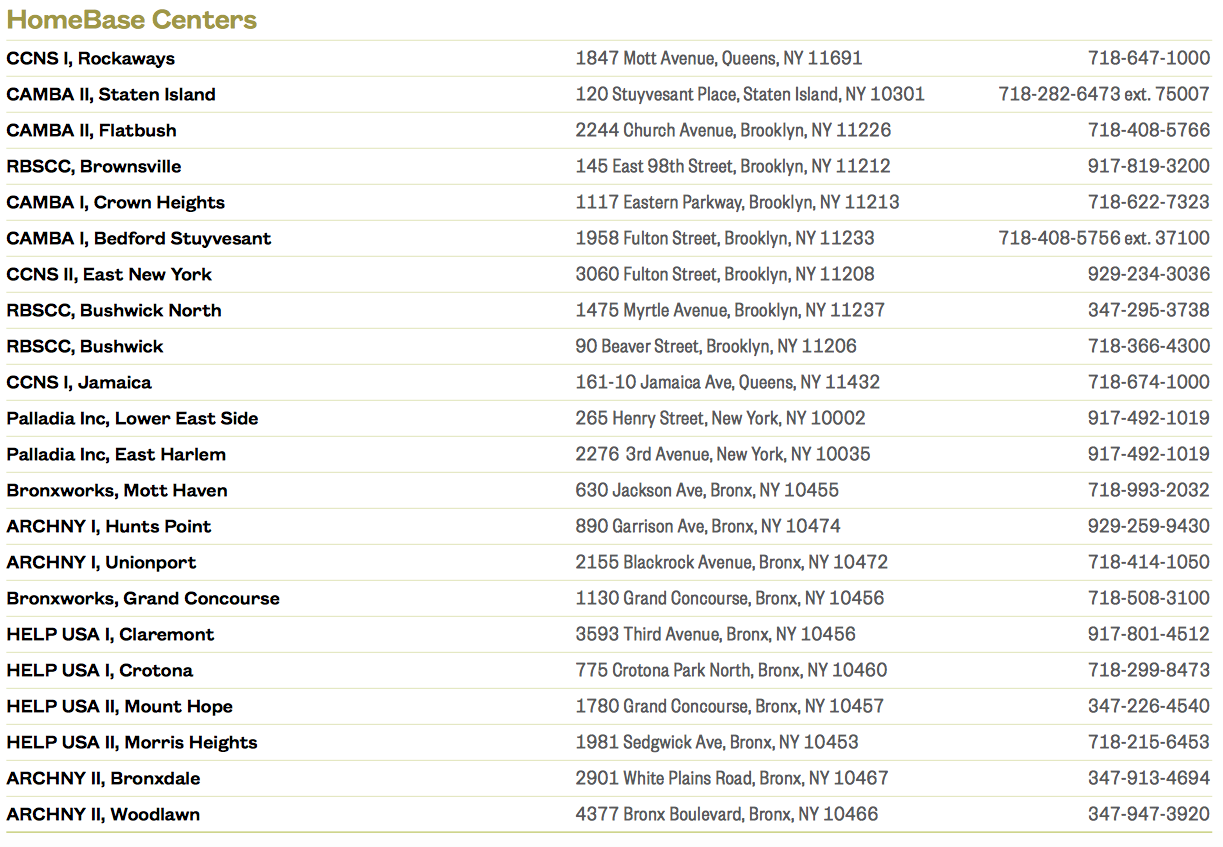
HomeBase
A program introduced citywide in 2008 by the New York City Department of Homeless Services to offer homelessness-prevention services in individual communities. Offices are operated by contracted social services providers and staffed with caseworkers offering services such as landlord mediation, emergency rental assistance, and benefits enrollment.
Homeless
The New York City Department of Education defines a student as homeless who lacks a fixed, regular, and adequate nighttime residence. Homeless students in the 2016 Atlas of Student Homelessness are divided into the following subcategories:
Doubled up: Students living with another family or other person due to loss of housing or economic hardship.
In Shelter: Students living in a City-funded or City-operated emergency or transitional shelter.
Unsheltered: Students living in a space not meant for human habitation, such as in a car, on the street, or in an abandoned building.
Other: Students living in a hotel/motel outside of the City shelter system that involves payment, and those awaiting foster care placement.
Housed/All Housed
All students not identified as homeless during school year 2014–15, including both housed students eligible for free lunch and housed students not eligible for free lunch.
Housed, Free Lunch
Students not identified as homeless whose family income meets the threshold for receiving free or reduced-price lunch. This is a proxy for students who are poor but not homeless.
Housed, No Free Lunch
Students not identified as homeless who do not receive free or reduced-price lunch. This is a proxy for students who are neither homeless nor poor.
Individual Education Plan/Program (IEP)
An Individual Education Plan is created when a student is deemed eligible for special education services through the Department of Education. This plan details the programs and services that s/he will need in order to be successful in school.
Received IEP Late: Includes all special education students who received an IEP after Kindergarten. For the purposes of this report, late IEP calculations are limited to a cohort of students who entered Kindergarten in SY 2010–11 and received an IEP at some point during the next five years.
Math Test
Every year, the New York State Education Department administers standardized tests to students in 3rd through 8th grade in the subjects of math and English Language Arts (ELA).
McKinney-Vento Homeless Education Assistance Act
A federal law that guarantees equal access to public education for homeless children and youth. As a part of the law, schools are required to identify and immediately register homeless children for school even if they do not have required documents, such as immunization records or proof of residence.10
Middle School
6th through 8th grade.
Mid-Year Transfer
Students who transfer from one school to another at any point during a school year.
Never Homeless
Students who were housed during the entire time period between SY 2010–11 and SY 2014–15.
Never in Shelter
Students who are homeless but have not lived in a City shelter at any point. In this report, “never in shelter” refers to students enrolled in high school and who did not live in shelter at any point between SY 2011–12 and SY 2014–15. This term is used in this report when measuring the fouryear dropout rate and graduation rate by school district.
New York State Technical & Education Assistance Center for Homeless Students (NYS TEACHS)
The New York State Technical Assistance Center for Homeless Students is an organization funded by the New York State Education Department. It collects data and provides services to schools and other educational agencies pertaining to homeless students and their legal rights.
Non-Geographic School Districts
While most school districts are defined by geography in New York City, a small number of districts are defined by an area of specialization. These districts include District 75 (special education), District 79 (alternative schools and programs), and District 84 (charter schools). The physical location of the schools administered under these districts can be anywhere across the city. Some categories in the 2016 Atlas of Student Homelessness are not shown for non-geographic districts due to the special nature of the districts. Because information on the outcomes of homeless students attending charter schools is not publicly available, the 2016 Atlas of Student Homelessness does not include data from District 84.
Poverty (Federal Poverty Level)
The Federal Poverty Level was first calculated to represent the minimum income an average family needed to afford food and other basic expenses. The 2015 Federal Poverty Level for a family of three was $20,090.11
Pre-K
All children who turn four before January 1st of a given school year are eligible to apply for New York City’s Universal Pre-K program. Programs are operated by both the New York City Department of Education and community-based organizations.
Retention/Held Back
When a student repeats a grade one or more times. The decision to retain a student considers multiple factors and varies across grade levels but can include standardized State testing results, portfolios of students’ work throughout the school year, and satisfactory completion of the required number of class credits.12
Runaway and Homeless Youth Services
Facilities that provide shelter and/or services to runaway youth or homeless youth. Runaway youth are those under age 18 who do not live at their legal residence and lack parental or guardian consent. Homeless youth are those under age 21 (see “Homeless”).13
School District 75
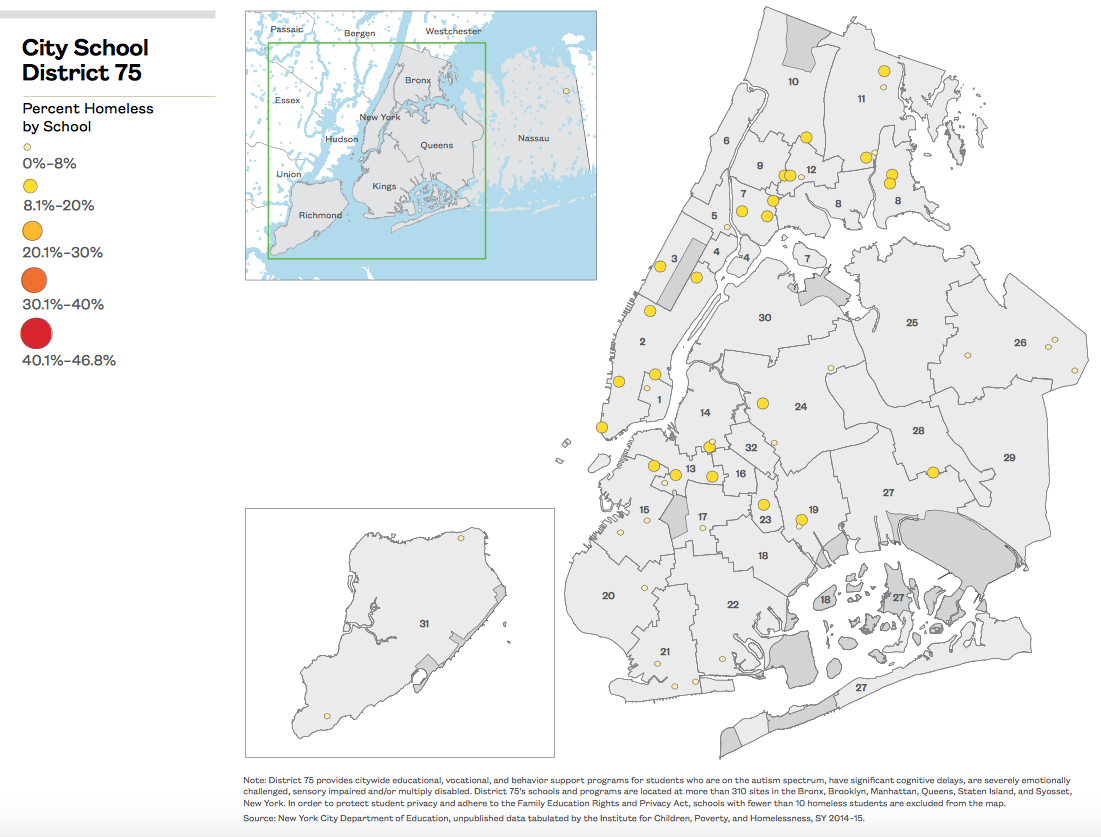
District 75 provides citywide educational, vocational, and behavior support programs for students who are on the autism spectrum, have significant cognitive delays, are severely emotionally challenged, sensory impaired, and/or multiply disabled. District 75’s schools and programs are located at more than 310 sites in the Bronx, Brooklyn, Manhattan, Queens, Staten Island, and Syosset, New York.14 Some categories in the 2016 Atlas of Student Homelessness are not shown for District 75 due to the special nature of the district.
School District 79
District 79 helps students under 21 years old who have experienced an interruption to their studies.15 Some categories in the 2016 Atlas of Student Homelessness are not shown for District 79 due to the special nature of the district.
Students in Temporary Housing Unit
A division within the New York City Department of Education responsible for maintaining records on all students’ housing statuses and providing shelter and school-based liaisons to assist homeless families with basic educational needs.
Suspension Rate
The percentage of students who received one or more suspensions during the school year. In this report, students were counted if they were suspended at their final school of enrollment for SY 2014–15. (Note: when students are suspended they are provided with an alternate school assignment and are not considered absent from school unless they do not show up for their alternate assignment.)
1 Patricia Julianelle, The McKinney-Vento Act and Children and Youth Awaiting Foster Care Placement: Strategies for Improving Educational Outcomes Through School Stability, National Association for the Education of Homeless Children and Youth, 2008.
2 New York City Department of Education Division of Finance, June 2016, Fair Student Funding and School Budget Resource Guide FY 2016.
3 U.S. Department of Education, “Laws & Guidance: Family Educational Rights and Privacy Act (FERPA),” http://www2.ed.gov/policy/gen/guid/fpco/ferpa/index.html (accessed July 15, 2015).
4 New York City Department of Investigation, DOI Investigation of 25 City-Run Homeless Shelters for Families Finds Serious Deficiencies, March 12, 2015.
5 Ibid.
6 Ibid.
7 Department of Health and Human Services, Annual Update of the HHS Poverty Guidelines, January 22, 2015.
8 New York City Department of Education Division of Finance, June 2016, Fair Student Funding and School Budget Resource Guide FY 2016.
9 Nina Bernstein, “De Blasio to Propose $2 Billion for New York City’s Hospital System,” New York Times, April 25, 2016.
10 U.S. Department of Education “Laws & Guidance: Part C–Homeless Education,” http://www2.ed.gov/policy/elsec/leg/esea02/pg116.html (accessed July 20, 2015).
11 Department of Health and Human Services, Annual Update of the HHS Poverty Guidelines, January 22, 2015.
12 New York City Department of Education, 2013–2014 Promotion Guide.
13 New York City Department of Youth and Community Development, Subpart 182-1. Runaway and Homeless Youth Regulations for Approved Runaway Programs, October 22, 2014.
14 The Institute for Children, Poverty, and Homelessness, “City School District 75: Citywide Alternative Schools and Programs,” December 2015.
15 Institute for Children, Poverty, and Homelessness, “City School District 79: Citywide Special Education,” December 2015.
Community Resources
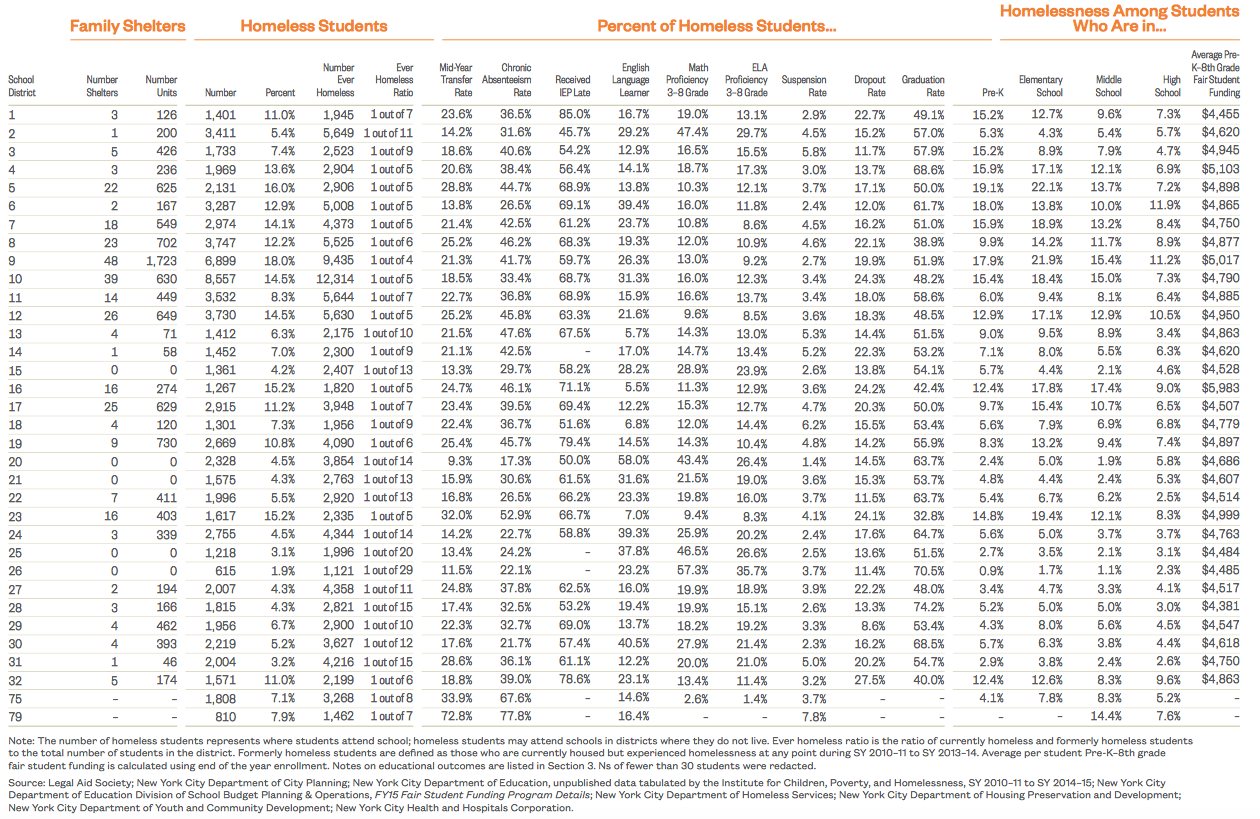
Homeless Students by School District
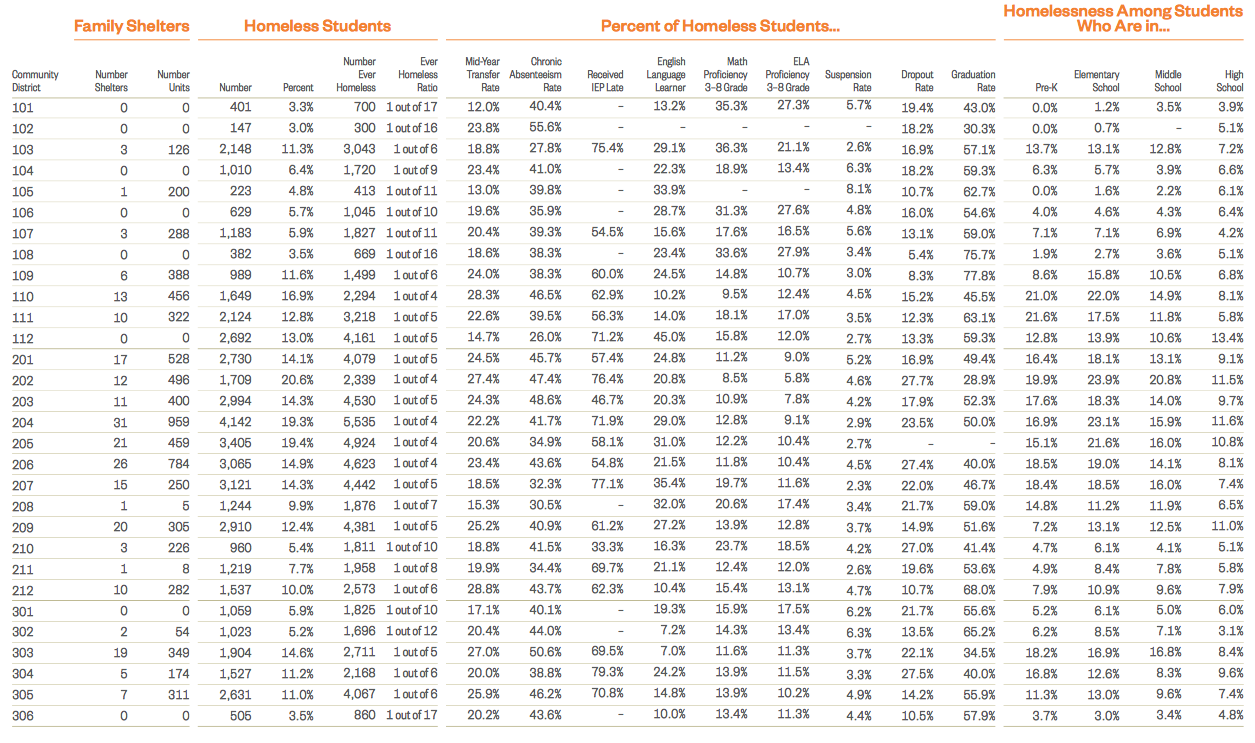
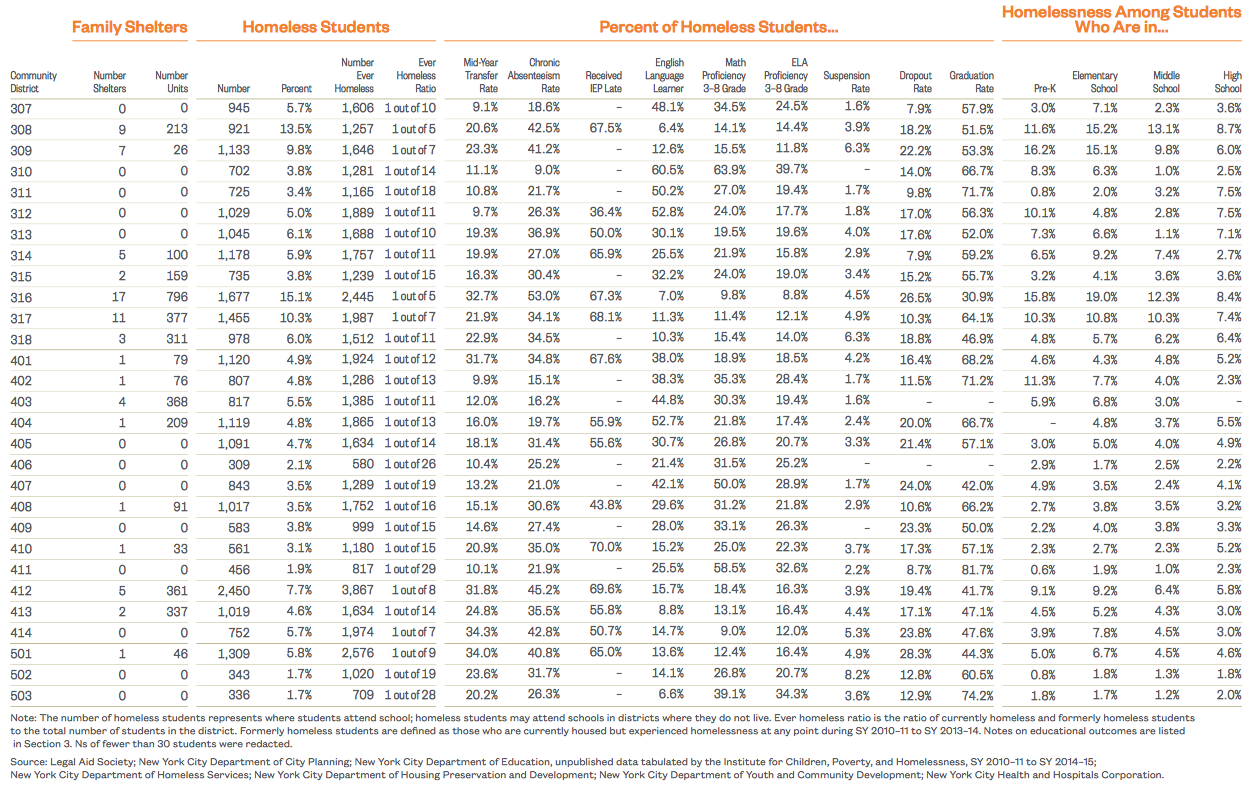
Homeless Students by Community District
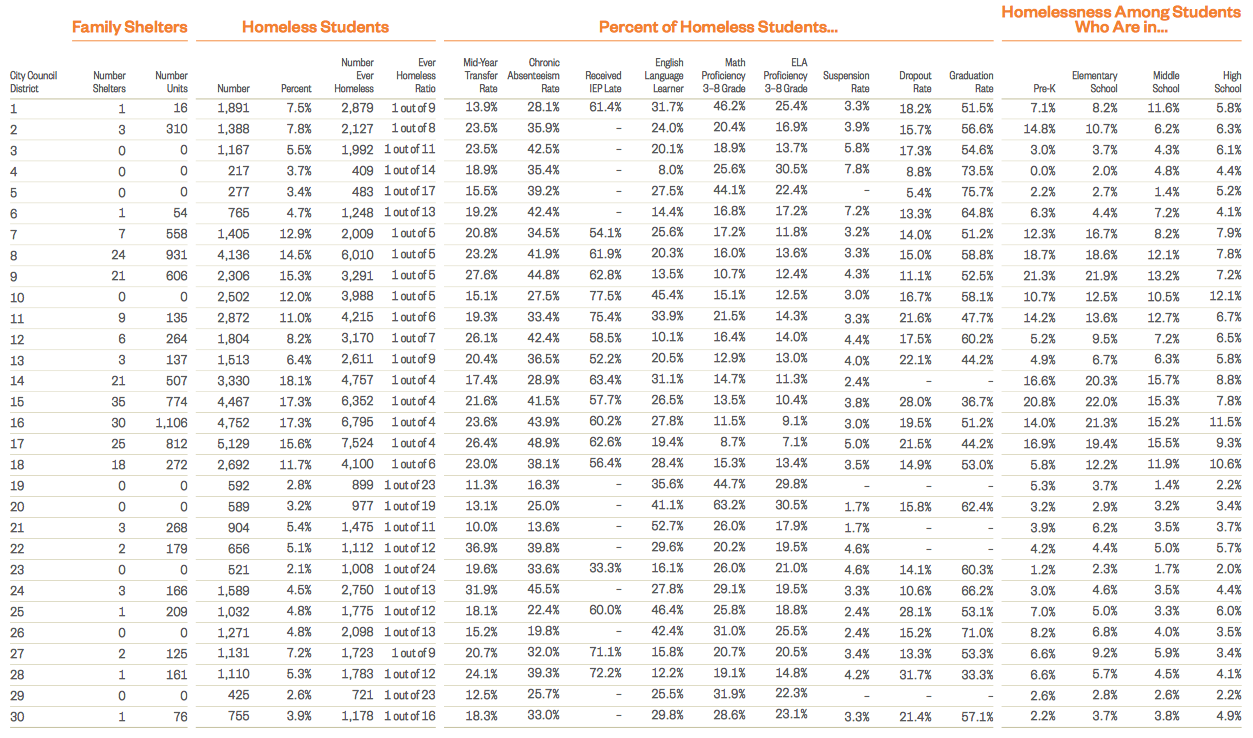
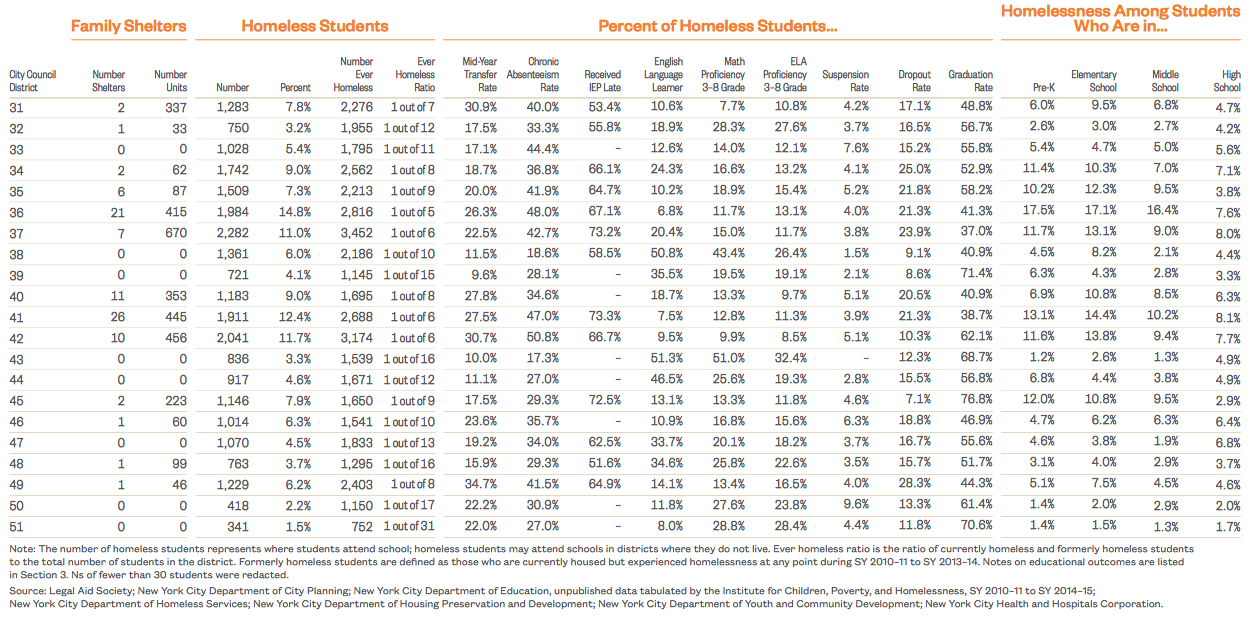
Homeless Students by City Council District
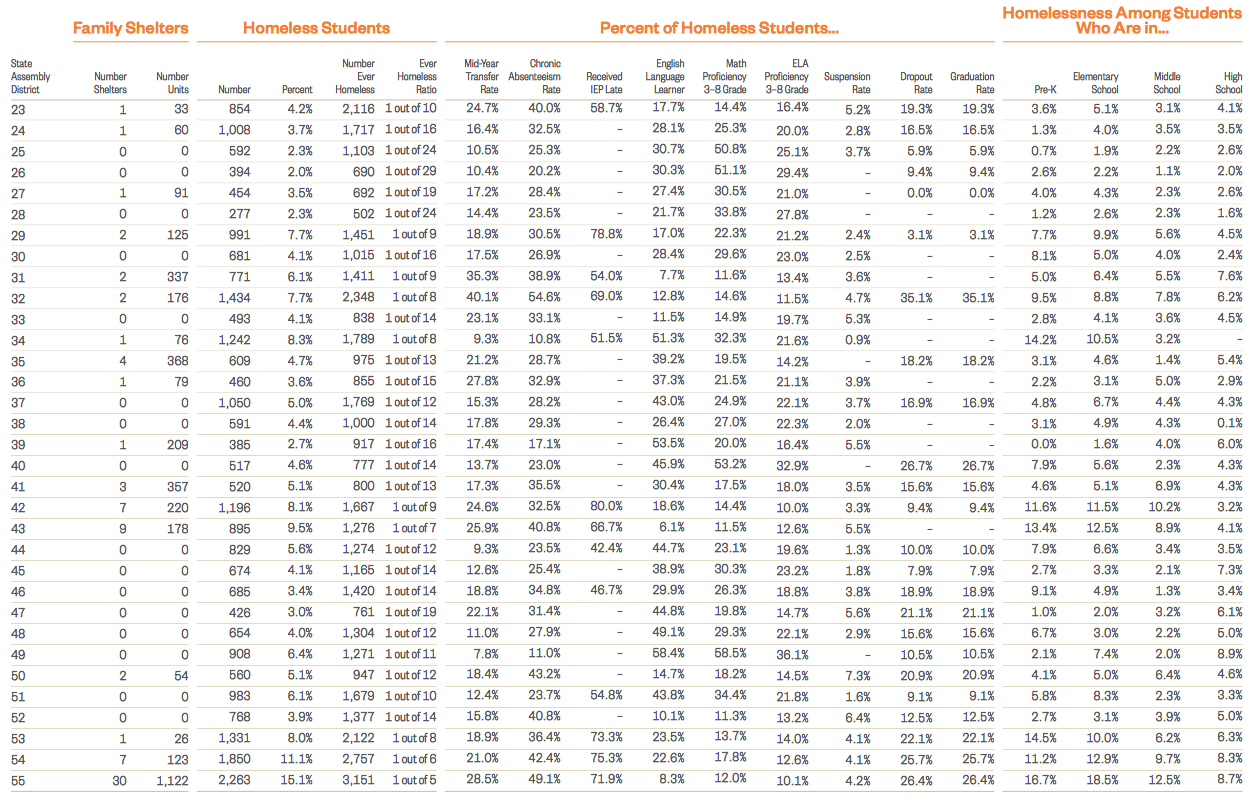
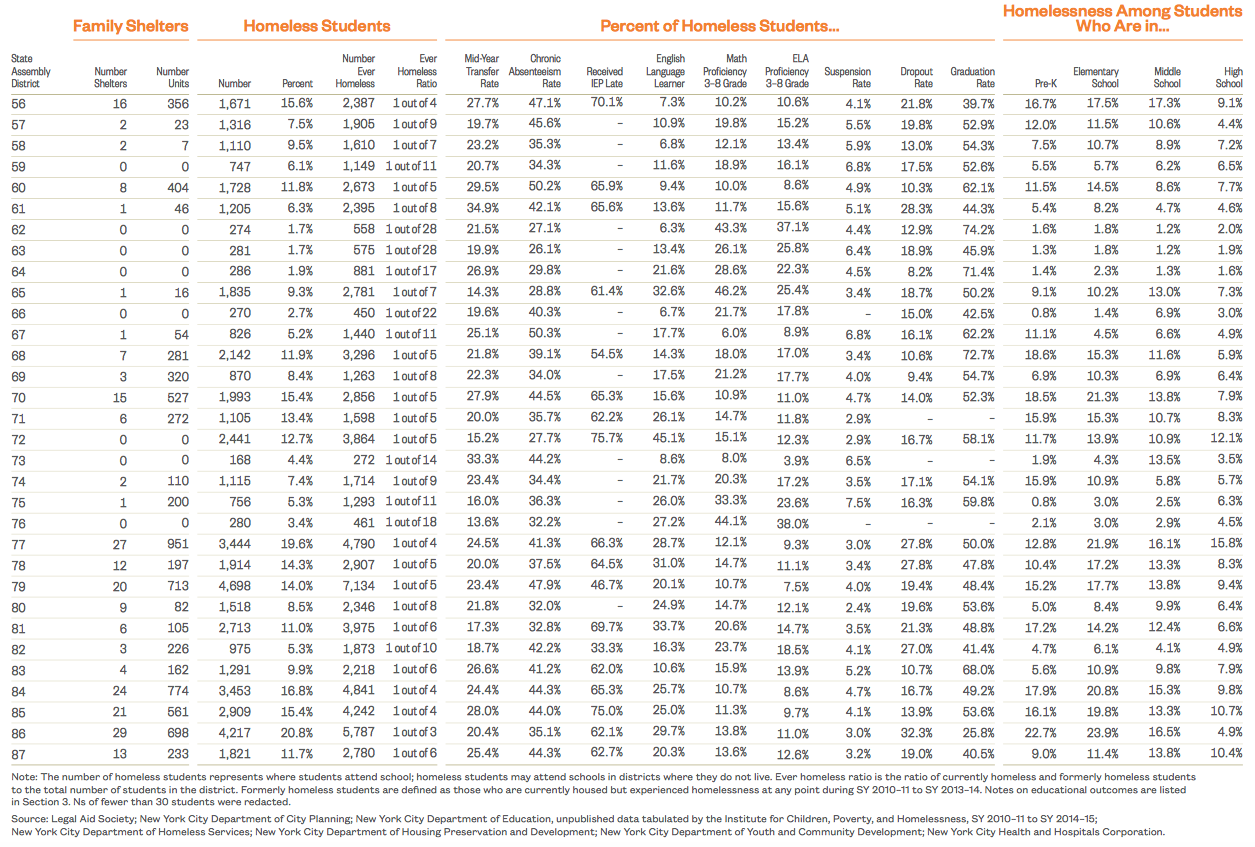
Homeless Students by State Assembly District
Homeless Students by State Senate District