August 2018
The Geography of Homelessness
Over 105,000 students in New York City’s public schools—nearly 1 in 10—were homeless during the 2016–17 school year (SY). This number does not include the over 7,000 homeless students attending charter schools. An additional 48,000 students were formerly homeless, which is defined as being housed that year but having at least one episode of homelessness since SY 2010–11, the first year of available data. All told, approximately 150,000 students have experienced homelessness in the past six years.
Even a single experience of housing instability can negatively impact a student’s education for years. A family’s housing and economic instability, along with symptoms such as chronic absenteeism, can impede a child’s ability to learn at the same pace as their housed classmates. In this first section of the 2018 Atlas of Student Homelessness in New York City, ICPH explores the fundamental questions surrounding the crisis of student homelessness: who these students are, where do they go to school, and how has this mounting crisis evolved in recent years.
Key Findings
- Overall, the rate of student homelessness—9.9% of the total student population of 1.1 million—has remained stable between SY 2015–16 and SY 2016–17. The majority (72%) of students identified as homeless in SY 2016–17 had experienced housing instability in a previous school year. Over 8,000 students were identified as homeless in seven consecutive years dating back to SY 2010–11, the first year for which data is available.
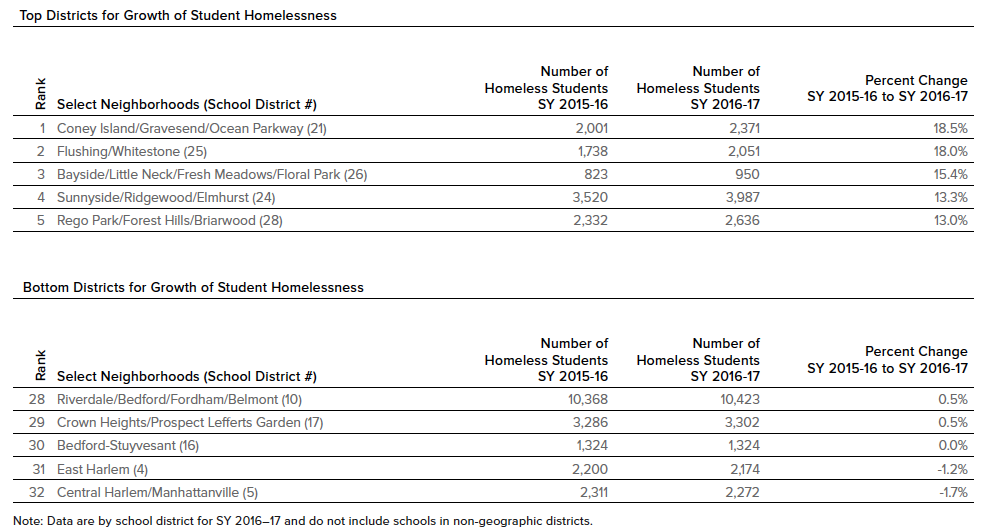
- Three school districts—Coney Island, Flushing, and Bayside—saw student homelessness increase by more than 15% since the 2015–16 school year (Districts 21, 25, and 26). Only two districts, East Harlem and Central Harlem, had percentage-point decreases in the number of homeless students attending school in the district (Districts 4 and 5).
- Enrollment of homeless students in the city’s charter schools remained steady, at 6.7%, compared to the previous year. Charter enrollment of homeless students is two-thirds the rate of student homelessness seen in traditional public schools, 9.9% in SY 2016–17.
Data Considerations
- Increases in student homelessness rates are always a combination of the growing number of students experiencing housing instability and changes to how schools are identifying these students. This means that the actual proportion of the total student population that is homeless may be higher than the available data indicates.
- As family homelessness becomes more prevalent throughout the city, schools and local service providers, such as shelters, can benefit from improved data collection and communication practices. For example, improving the availability of data on the length of the homelessness episode a student is currently experiencing or their previous history of housing instability can help teachers and counselors more appropriately serve these students.
Homeless Students in New York City Public Schools
by Type of Homelessness
SY 2010–11 to SY 2016–17
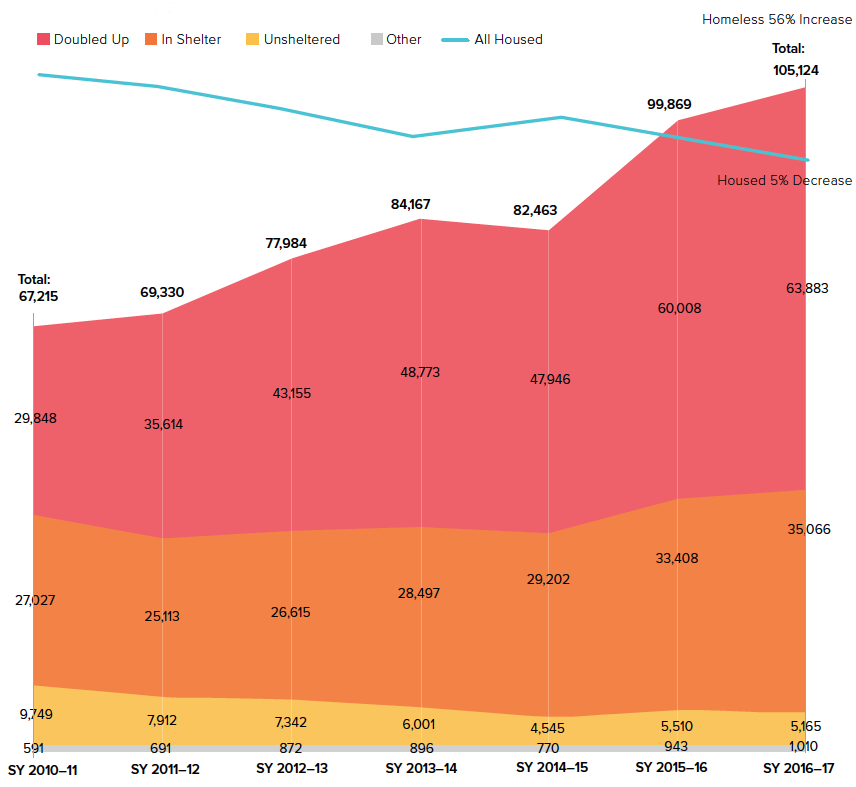
- Out of 1.1 million public school students, more than 105,000 homeless students attended New York City public schools in SY 2016–17—a 5% increase from the previous year and a 56% increase from SY 2010–11. This number does not include the over 7,000 homeless students in charter schools.
- The number of students living doubled up has increased by 114% over the past seven years.
- While the number of homeless students living in shelter, doubled up, or in another temporary housing situation increased by at least 5% from SY 2015–16 to SY 2016–17, the number of unsheltered students decreased by 6%. Unsheltered students live in a space not meant for human habitation.
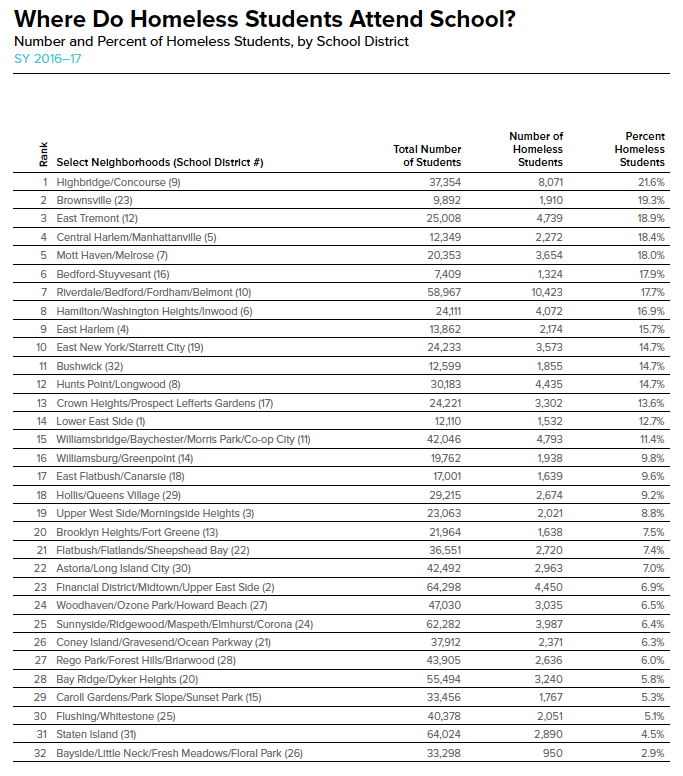
Where Do Homeless Students Attend School?
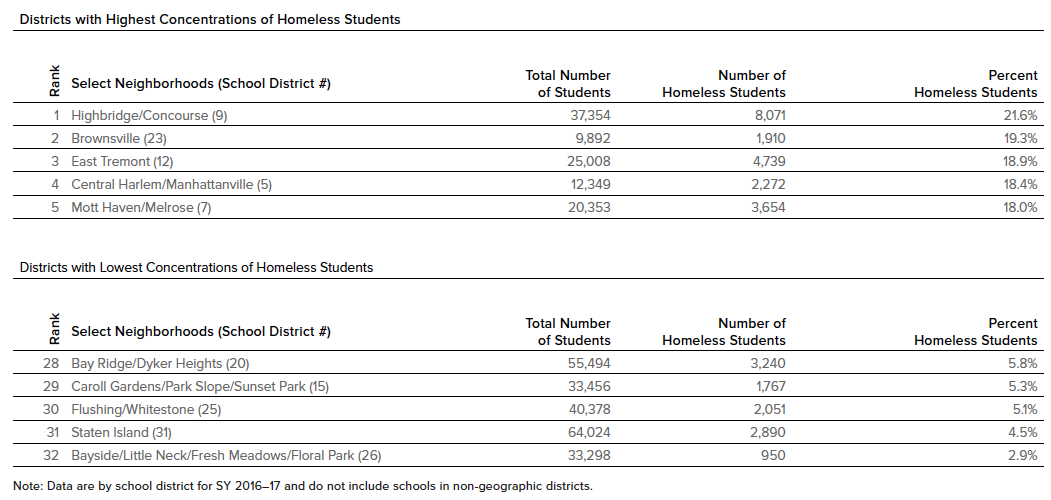
Number and Percent of Homeless Students, by School District
SY 2016–17
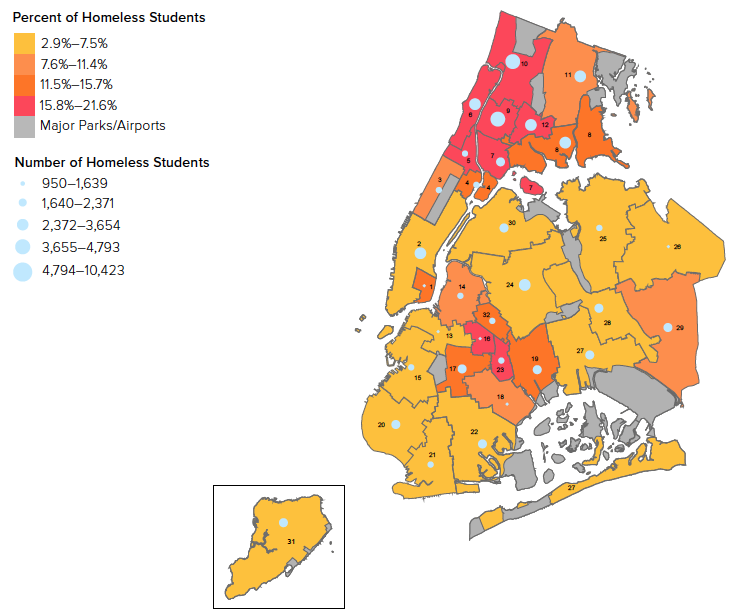
Note: Data are by school district for SY 2016–17 and do not include schools in non-geographic districts.
- In half of New York City’s school districts, at least one in ten students had experienced homelessness in SY 2016–17.
- Bayside continued to have the lowest percentage of homeless students in the city (2.9%) while Highbridge/Concourse had the highest concentration (21.4%). These two districts have represented the highest and lowest concentrations in the past four consecutive school years (Districts 26 and 9).
- Although Bayside had the lowest percentage of homeless students in SY 2016–17, the district experienced one of the largest increases in the number of homeless students from 388 to 950 between SY 2015–16 and SY 2016–17 (District 26).
- Riverdale/Bedford had the largest number of homeless students with over 10,400 students (17.7% of all students) (District 10).
Where Do Homeless Students Attend School?
Number and Percent of Homeless Students, by School District
SY 2016–17
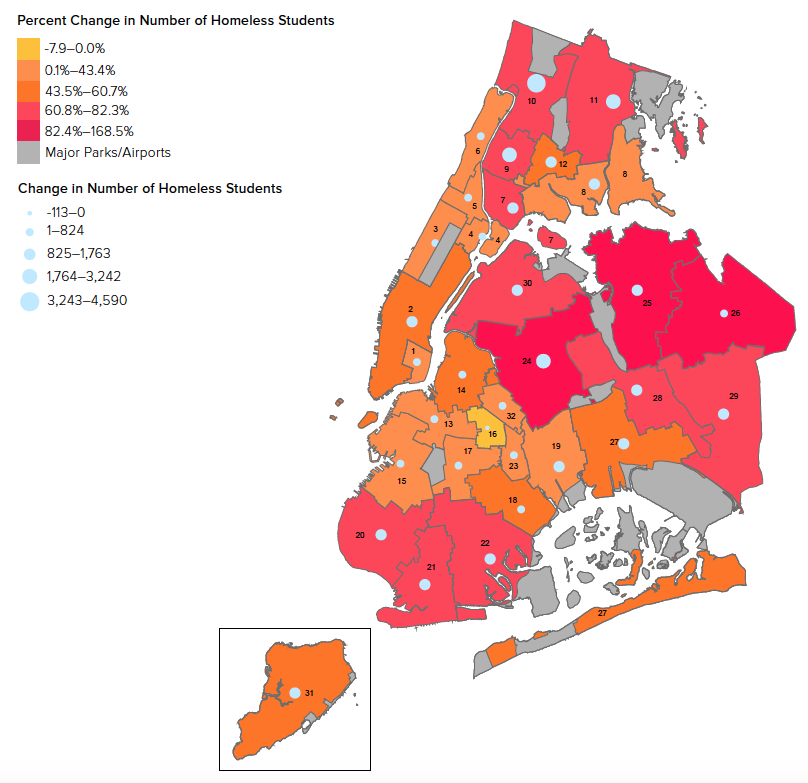
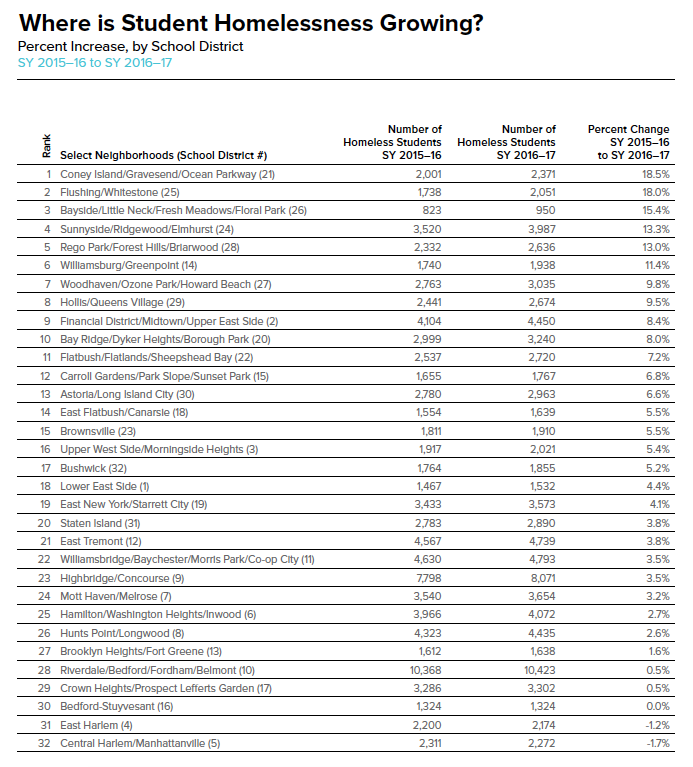
Where is Student Homelessness Growing?
Percent Increase in Student Homelessness, by School District
SY 2015–16 to SY 2016–17
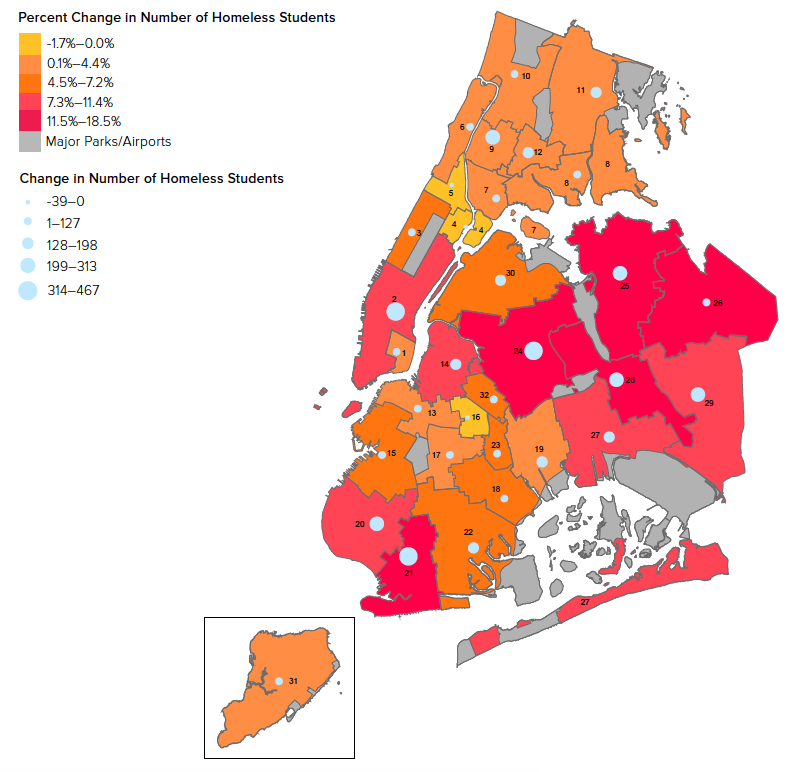
Note: Data are by school district for SY 2016–17 and do not include schools in non-geographic districts.
- Coney Island/Ocean Parkway (+370), Flushing/Whitestone (+313), and Bayside (+127) each saw an increase in student homelessness of more than 15% from the previous year (Districts 21, 25, and 26).
- Two school districts saw a decrease in homelessness between SY 2015–16 and SY 2016–17—Central Harlem/Manhattanville (-1.7%) and East Harlem (-1.2%) (Districts 5 and 4).
Identification vs. Growth
A district’s growth rate is a combination of the increase in the number of homeless students and the effectiveness of local identification practices. For example, a high growth rate may indicate that school staff are doing a better job of identifying students who were already homeless, and a low growth rate may indicate that many homeless students in the district remain unidentified and not connected to support services.
Where is Student Homelessness Growing?
Percent Increase, by School District
SY 2015–16 to SY 2016–17
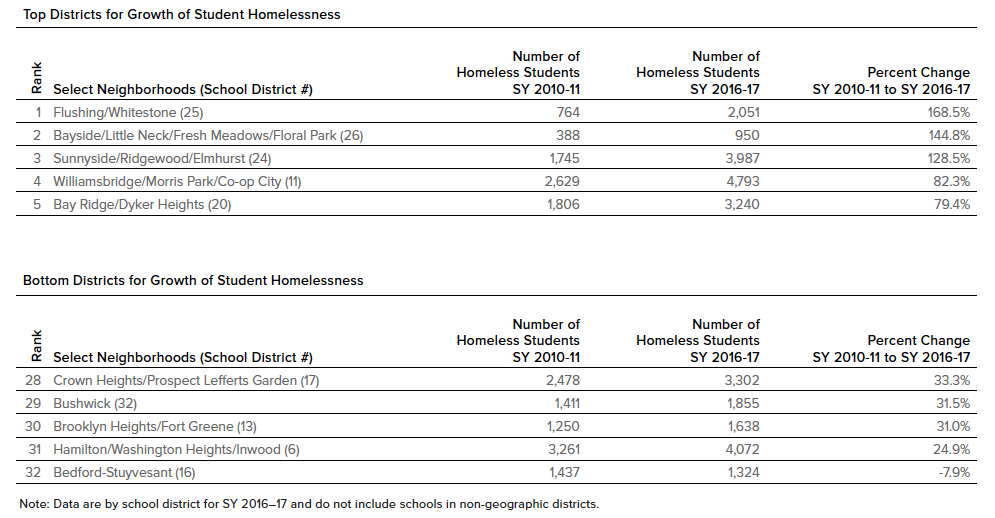
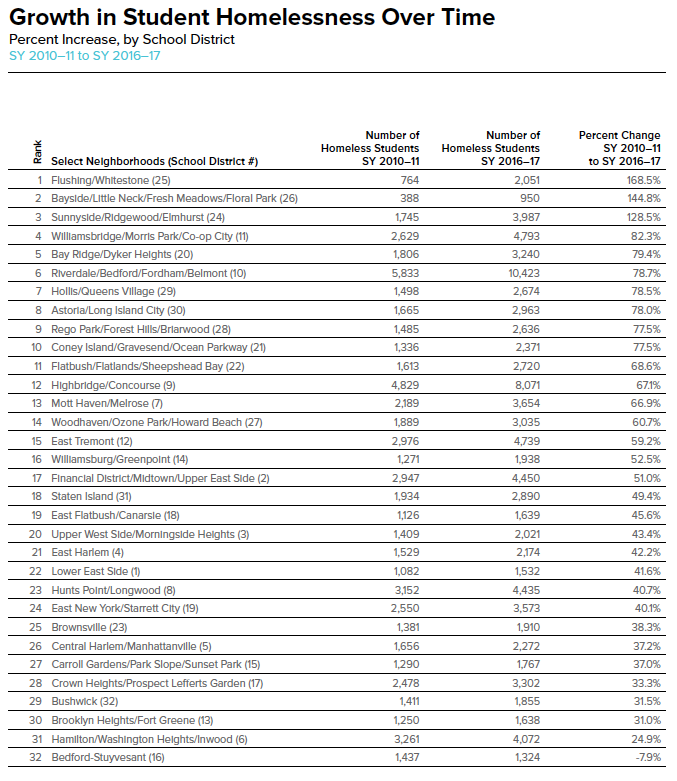
Growth in Student Homelessness Over Time
Percent Increase of Student Homelessness, by School District
SY 2010–11 to SY 2016–17
Note: Data are by school district for SY 2016–17 and do not include schools in non-geographic districts.
- 17 school districts out of 32 citywide (53%) experienced more than 50% growth in student homelessness over the last seven years.
- Over the last seven years, Flushing/Whitestone, Bayside, and Sunnyside (Districts 25, 26, and 24) in Queens have seen substantial growth in student homelessness, each increasing by over 120% between SY 2010–11 and SY 2016–17.
Growth in Student Homelessness Over Time
Percent Increase, by School District
SY 2010–11 to SY 2016–17
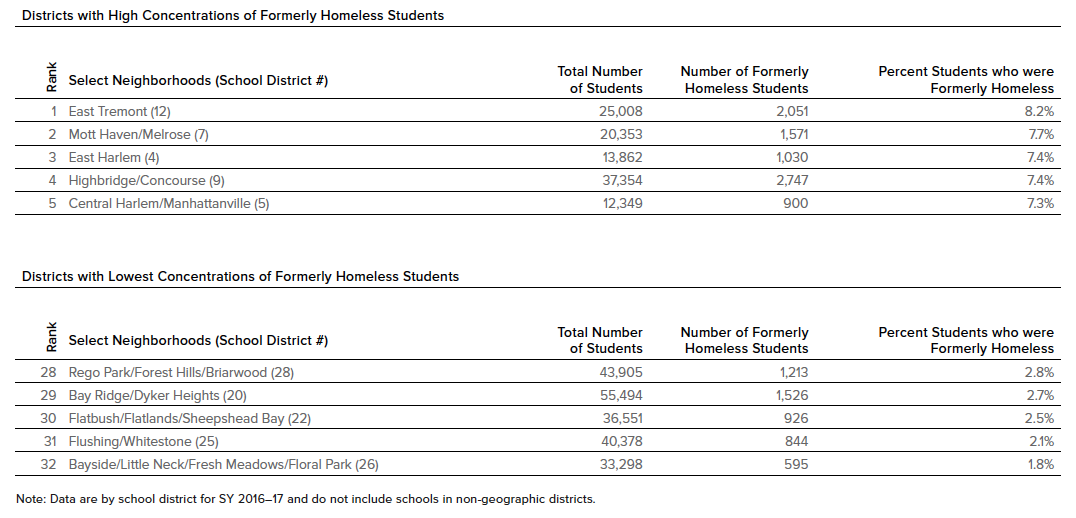
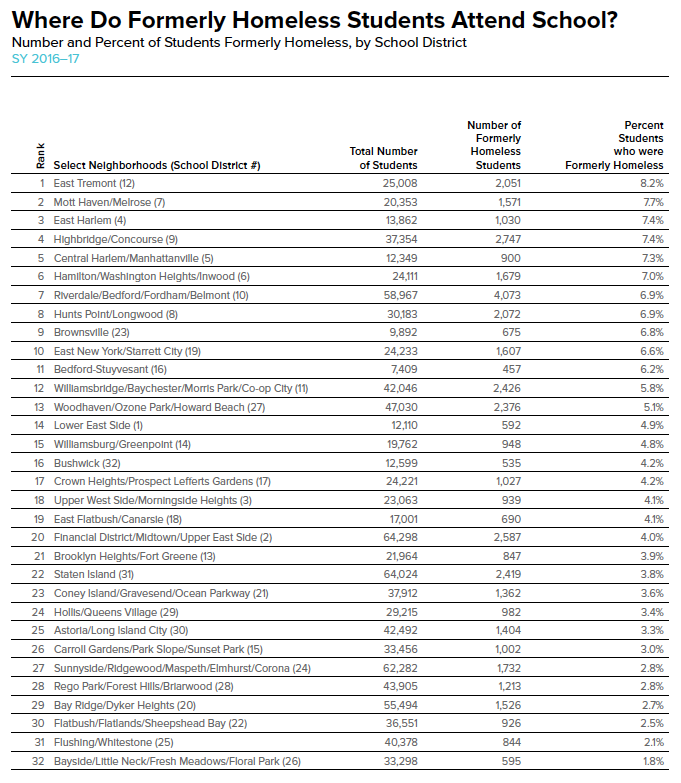
Where Do Formerly Homeless Students Attend School?
Number and Percent of Students Formerly Homeless, by School District
SY 2016–17
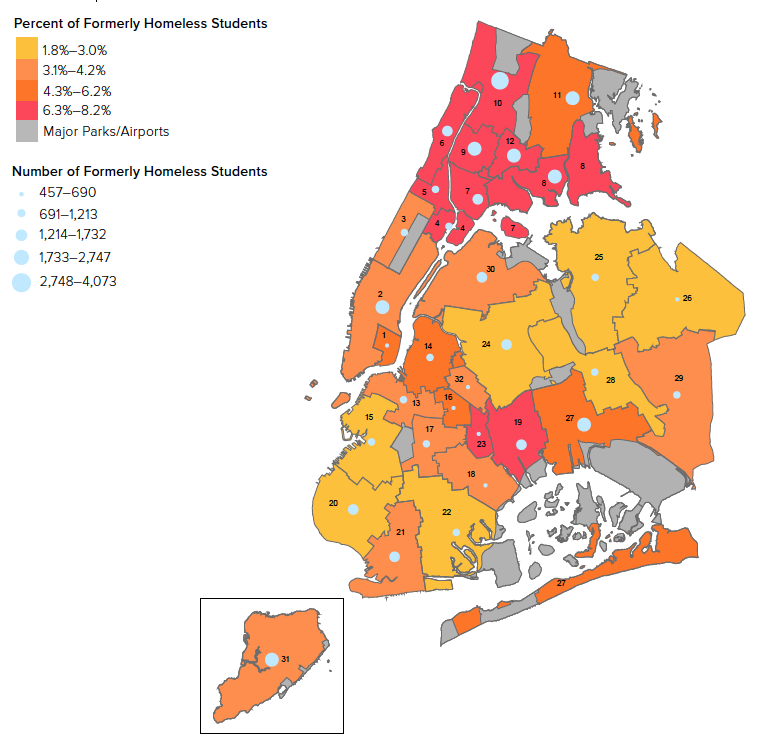
Note: Data are by school district for SY 2016–17 and do not include schools in non-geographic districts.
- In addition to the 9.9% of students who were homeless, 4.5% had experienced homelessness at some point since SY 2010–11. This represents a total of over 150,000 students or 14.4% of the NYC public school student population.
- East Tremont had the highest concentration of formerly homeless students (8.2%), while Bayside had the lowest concentration (1.8%) in SY 2016–17 (Districts 12 and 26).
- The number of formerly homeless students increased in six districts by over 20% between SY 2015–16 and SY 2016–17. Hunts Point/Longwood in the Bronx had the largest increase at 25% (District 8).
- In SY 2016–17, 20 school districts out of 32 (63% of districts), citywide had over 1,000 formerly homeless students. Over 4,000 formerly homeless students attended school in Riverdale/Bedford in the Bronx (District 10).
Where Do Formerly Homeless Students Attend School?
Number and Percent of Students Formerly Homeless, by School District
SY 2016–17
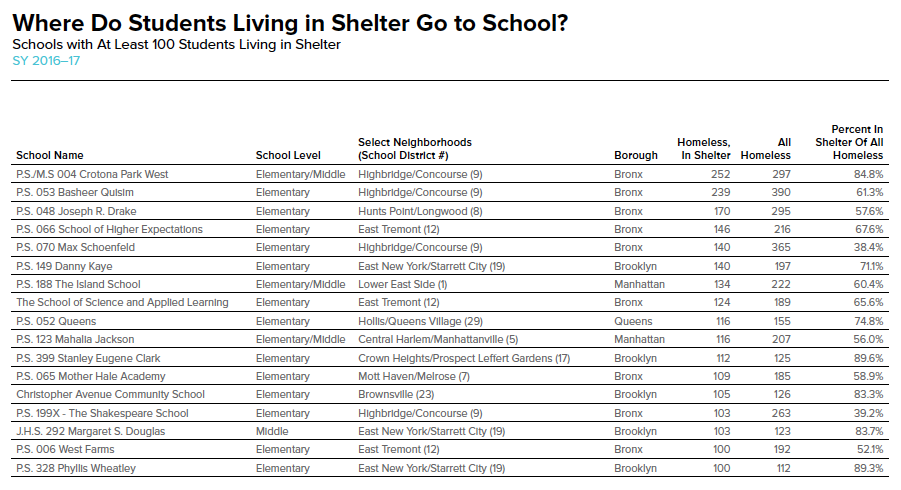
Where Do Students Living in Shelter Go to School?
Number of Students in Shelter, by School
SY 2016–17
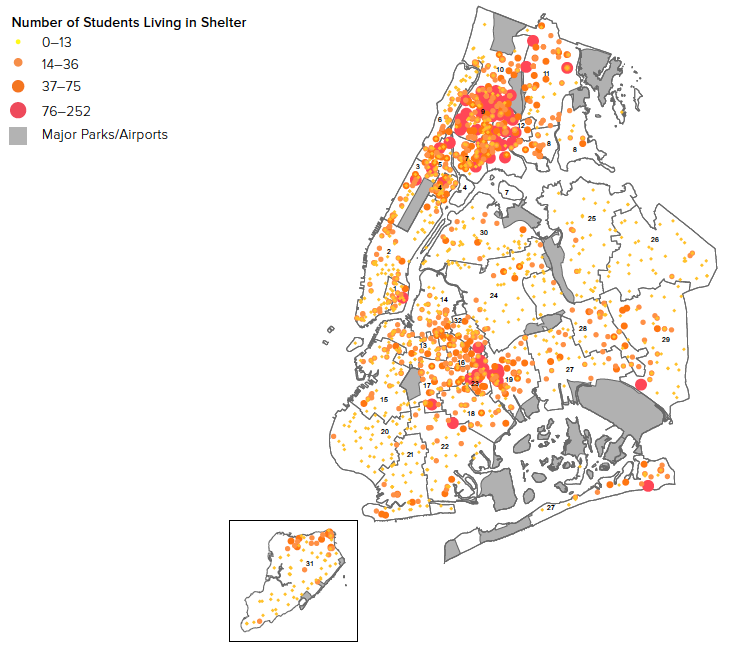
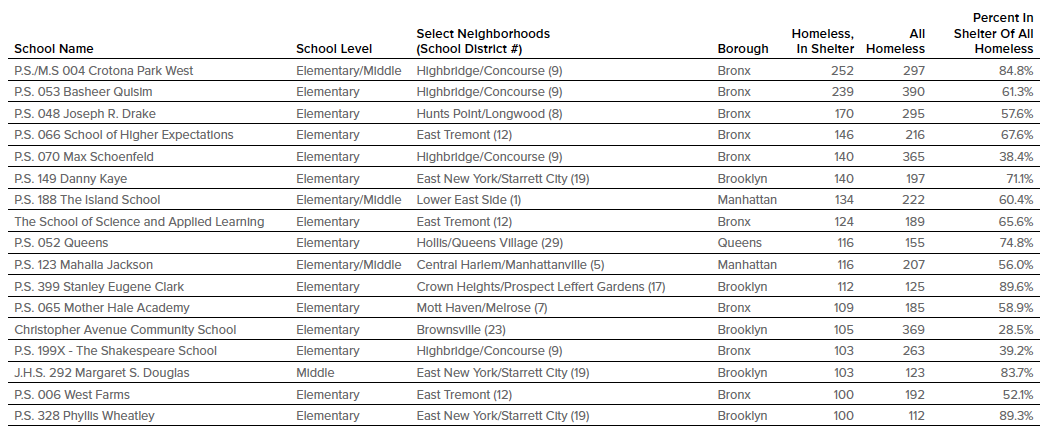
- Over 35,000 homeless students—3.3% of the total student population, or 33.4% of homeless students—lived in city-operated shelters in SY 2016–17.
- P.S./M.S. 004 Crotona Park West and P.S. 053 Basheer Quisim in Highbridge/Concourse in the Bronx had the largest number of students living in shelter (252 and 239). These have been in the top three schools for four consecutive years (District 9).
- Eighteen public schools—10 in the Bronx, five in Brooklyn, two in Manhattan, and one in Queens—had over 100 students living in shelter during SY 2016–17.
- The top ten schools for the largest number of students living in shelter in SY 2016–17 saw an average 5.3% increase from the previous year.
Types of Shelters
New York City uses three types of shelter for homeless families:
- Tier II–Tier II shelters are the most commonly used type of shelter, housing 58% of homeless families. They are highly regulated and monitored by state and local agencies, and typically offer the most comprehensive services. Most are run by non-profits that operate under contracts with NYC.
- Hotels– In order to expand the capacity of the shelter system, NYC currently shelters 19% of homeless families in private hotel rooms, for which the city pays a per-diem rate. These hotels are for-profit, do not operate under City contracts, and offer limited services.
- Cluster Sites–Cluster-site housing refers to the practice of utilizing apartments in privately-owned residential buildings to shelter homeless families. There are limited regulations at these locations and they offer the fewest services. 23.2% of homeless families are sheltered in cluster sites.
Where Do Students Living in Shelter Go to School?
Top 10 Schools for Students Living in Shelter
SY 2016–17
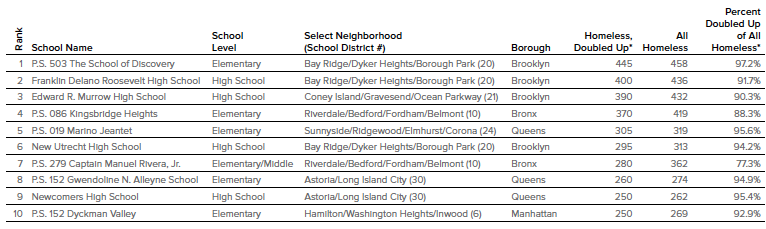
Where Do Students Living Doubled Up Go to School?
Number of Doubled-Up Students, by School
SY 2016–17
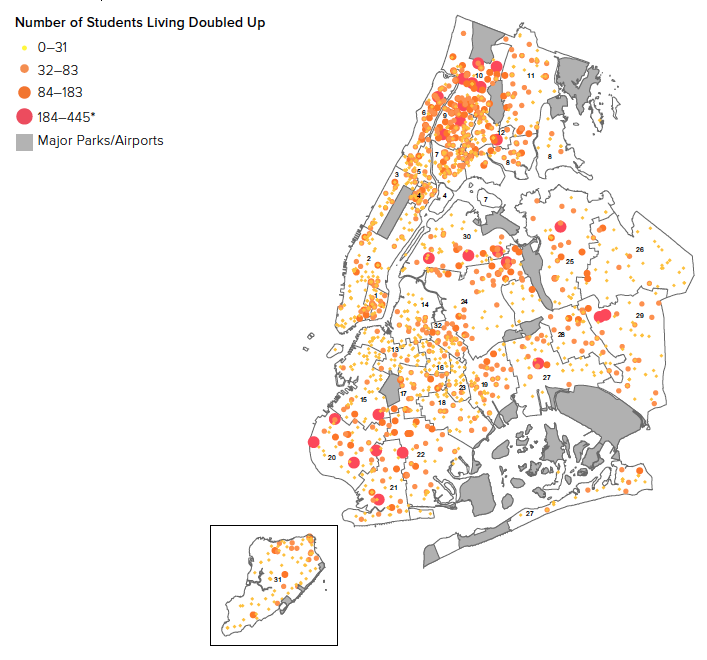
Note: Numbers of doubled-up students are rounded down in order to protect student privacy and adhere to the Family Education Rights and Privacy Act.
- In SY 2016–17 nearly 64,000 homeless students—6.0% of the total student population, or 60.8% of homeless students—lived doubled up.
- Homeless students living doubled up attended school in every district in the city, including areas with no family shelters. The top ten schools for number of homeless students living doubled up saw an average 14.2% increase between SY 2015–16 and SY 2016–17.
- The school with the largest number of doubled-up homeless students was P.S. 503 The School of Discovery, an elementary school in Bay Ridge (District 20). Over 445 doubled-up students were enrolled—over 97% of all homeless students at the school. District 20 is one of the two school districts in the city with no shelters. The other is Bayside—District 26.
- Edward R. Murrow High School in Coney Island had an over 400% increase in doubled-up homeless students, from 77 in SY 2015–16 to over 390 in SY 2016–17 (District 21).
Who is a doubled-up student?
Doubled-up students are homeless students who are living temporarily with friends or family due to loss of housing, economic hardship, or a related reason.
Where Students Living Doubled Up Go to School?
Top 10 Schools for Students Living Doubled Up
SY 2016–17
Note: Numbers of doubled-up students are rounded down in order to protect student privacy and adhere to the Family Education Rights and Privacy Act.
How Long Are Students Homeless?
Number of Years Students Have Been Homeless
SY 2016–17
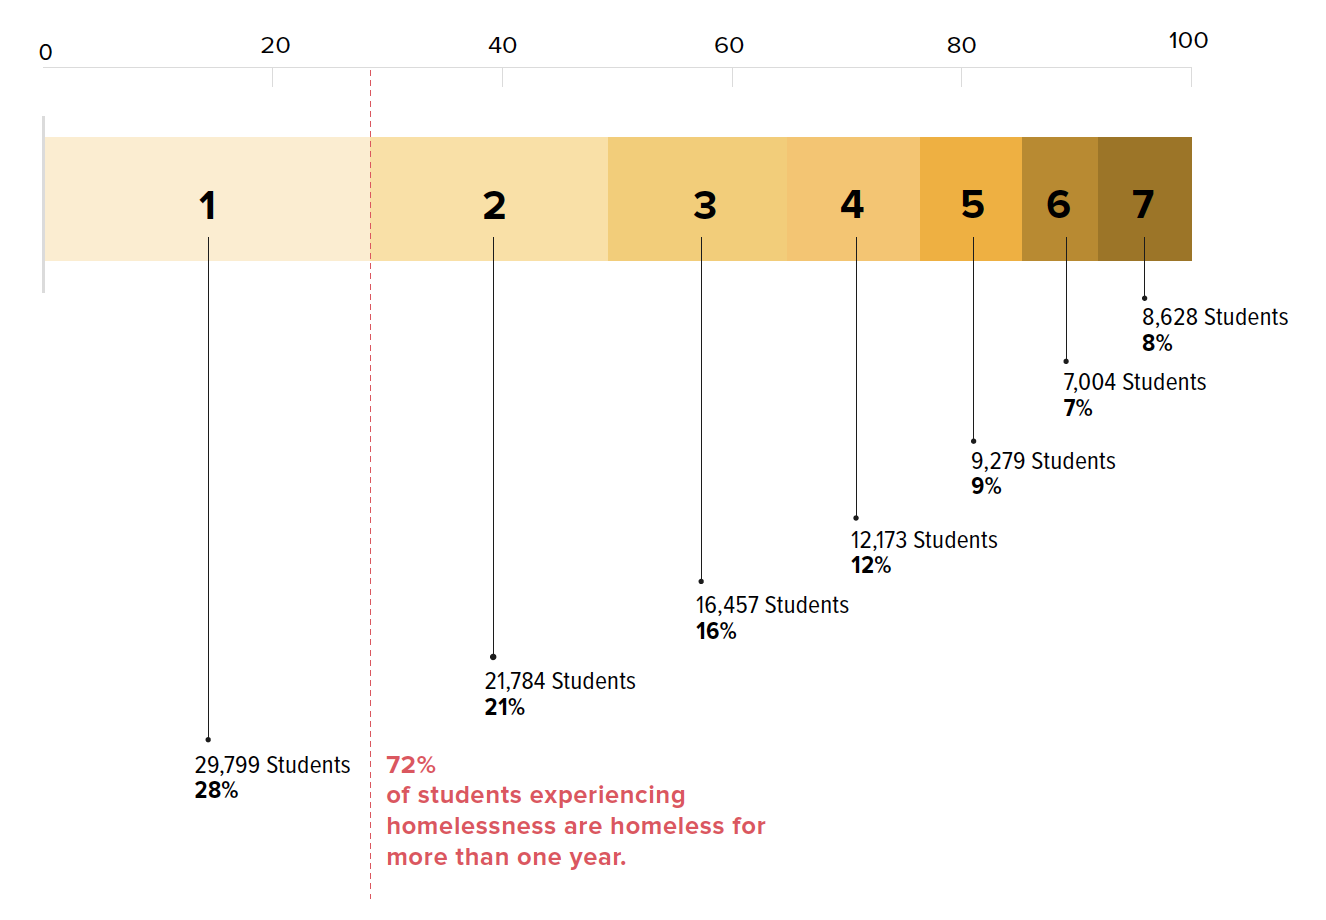
- The majority (72%) of students identified as homeless in SY 2016–17 had experienced housing instability in a previous school year.
- Over 8,000 students were identified as homeless in seven consecutive years dating back to SY 2010–11, the first year for which data is available.
Recording Housing Status
Because a student’s housing status is only recorded once per year, it is not possible to know if students were homeless continuously over a period of multiple years, or had temporary episodes of homelessness in these years.
Race and Ethnicity of Homeless Students
SY 2016–17
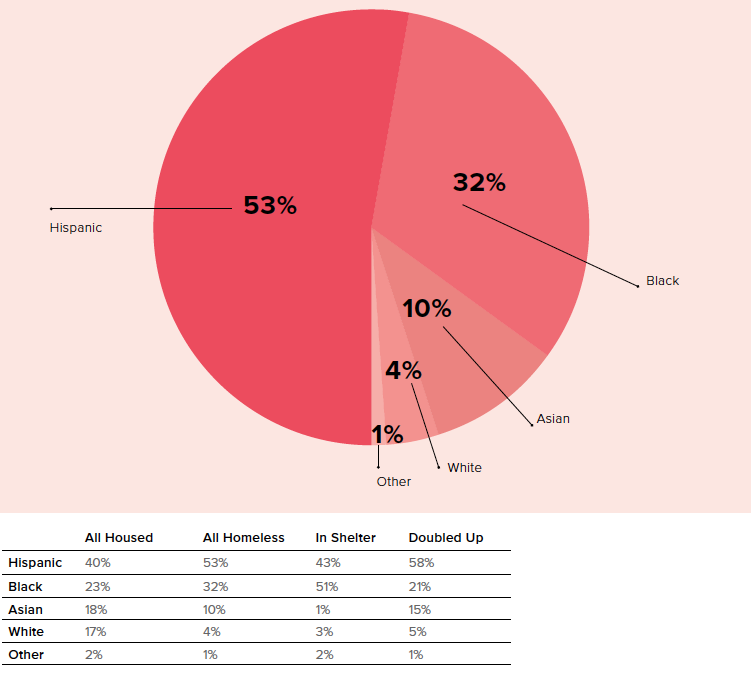
- The racial and ethnic make-up of homeless students enrolled in public schools in SY 2016–17 remained the same as the previous year.
- Black and Hispanic students continue to be over-represented among homeless students. Half (53%) of homeless students in New York City are Hispanic, while 40% of housed students are. One third (32%) of homeless students are black, but black students make up only one quarter (23%) of housed students.
- Black students were more likely to be living in shelter than doubled up (51% and 21%), while Hispanic students were more likely to be living doubled up than in shelter (58% and 43%).
How Are Homeless Students Distributed Across Grade Level?
SY 2016–17
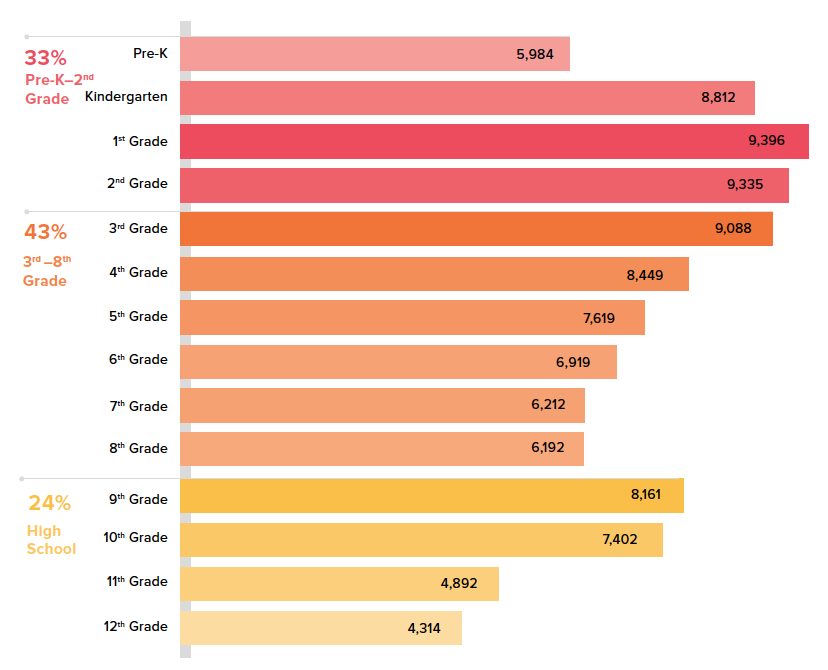
- The number of homeless students in each grade level from second grade through high school increased from SY 2015–16 to SY 2016–17. The greatest increase was in 11th grade with a 21.2% increase from 4,035 to 4,892.
- The gap between the number of homeless Kindergarten and homeless pre-K students has grown from 2,600 in SY 2015–16 to over 2,800 in SY 2016–17, suggesting that about one-third of homeless children eligible for pre-K did not enroll in Universal Pre-K programs in New York City.
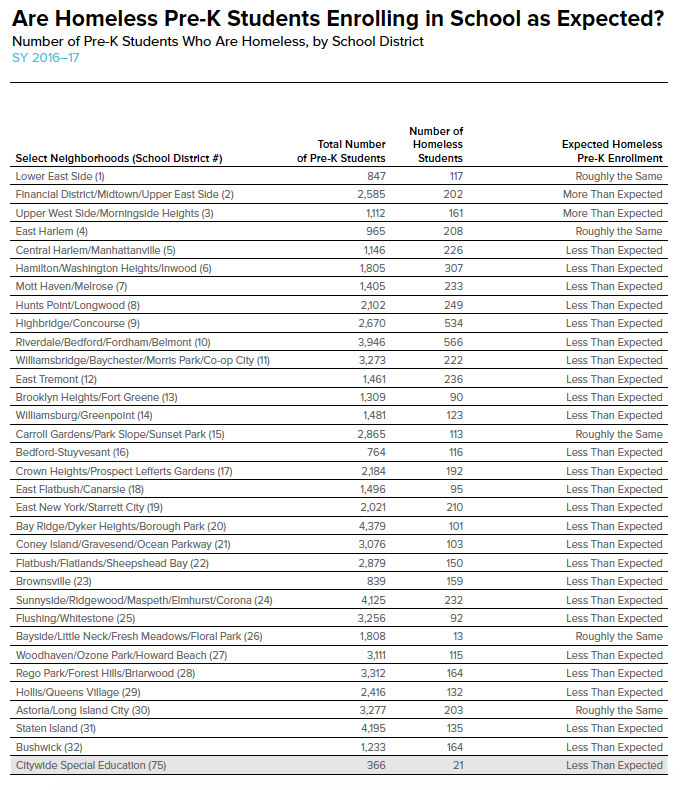
Are Homeless Pre-K Students Enrolling in School as Expected?
Percent of Pre-K Students Who Are Homeless, by School District
SY 2015–16 to SY 2016–17
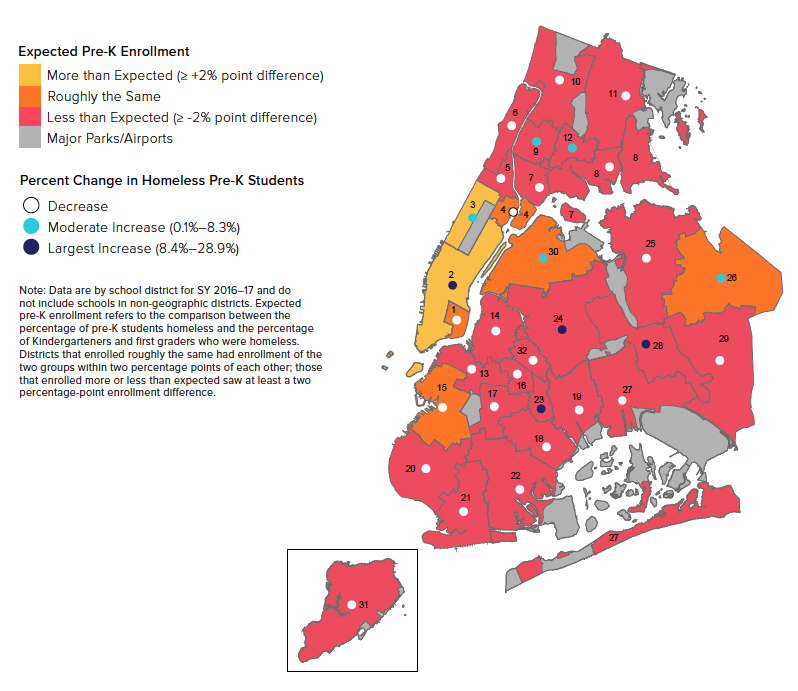
Note: Data are by school district for SY 2016–17 and do not include schools in non-geographic districts. Expected pre-K enrollment refers to the comparison between the percentage of pre-K students homeless and the percentage of Kindergartners and first graders who were homeless. Districts that enrolled roughly the same had enrollment of the two groups within two percentage points of each other; those that enrolled more or less than expected saw at least a two percentage-point enrollment difference.
- 23 out of 32 school districts (72%) saw decreases in SY 2016–17 from the previous year, while only 3 districts saw a decrease in SY 2015–16 from the previous year.
- The number of homeless students enrolled in pre-K decreased by 7.1% from SY 2015–16 to SY 2016–17, compared to 17% increase between SY 2014–15 and SY 2016–17.
- 20 of the city’s 32 school districts (over 60%) enrolled a lower percentage of homeless pre-K students than would be expected based on percentage of homeless students enrolled in low elementary grades in the districts.
Are Homeless Pre-K Students Enrolling in School as Expected?
Percent of Pre-K Students Who Are Homeless, by School District
SY 2016–17
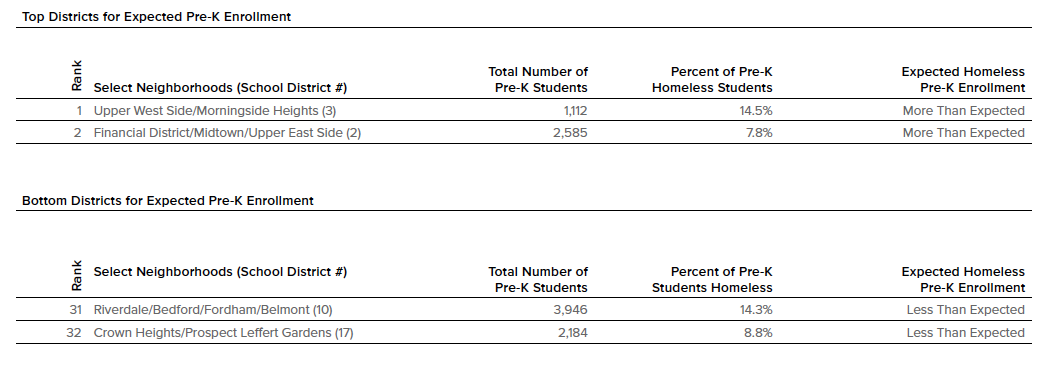
Note: Data are by school district for SY 2016–17 and do not include schools in non-geographic districts. Expected pre-K enrollment refers to the comparison between the percentage of pre-K students homeless and the percentage of Kindergartners and first graders who were homeless. Districts that enrolled roughly the same had enrollment of the two groups within two percentage points of each other; those that enrolled more or less than expected saw at least a two percentage-point enrollment difference.
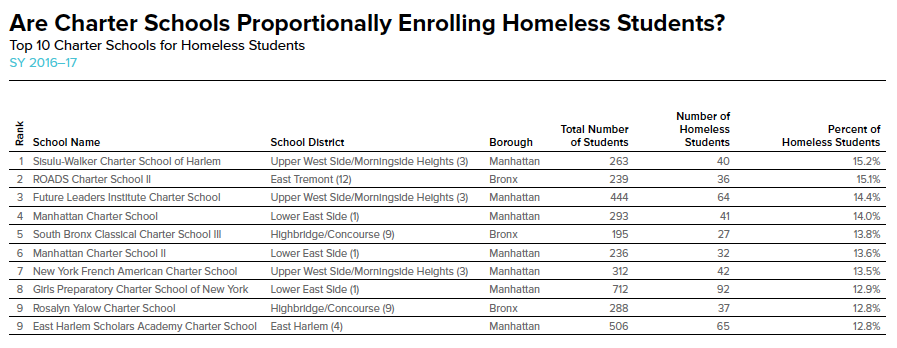
Are Charter Schools Proportionally Enrolling Homeless Students?
Percent of Homeless Students, by Charter School
SY 2016–17
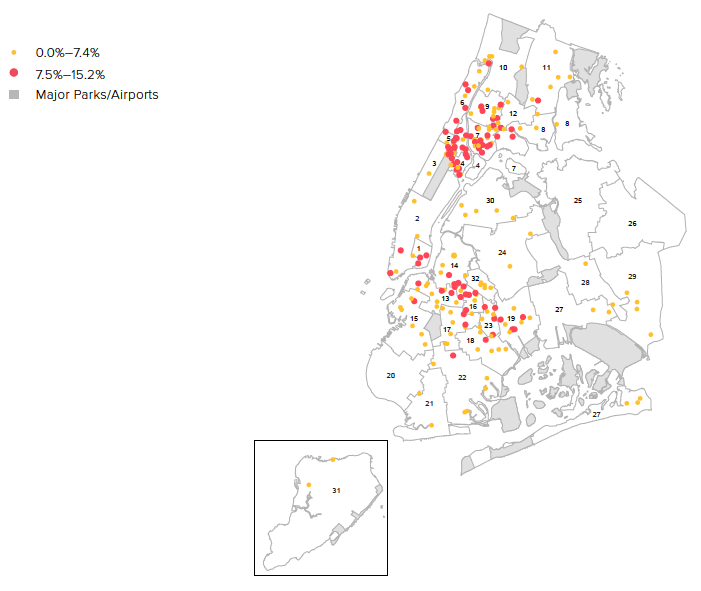
- There are over 200 charter schools in New York City. Three percent do not have any homeless students enrolled.
- In New York City charter schools, 6.7% of students were homeless in SY 2016–17, roughly the same as the previous year (6.6%). This represents about two-thirds the rate of public school enrollment (9.9%)
- Over 20% of charter schools have a rate of student homelessness higher than 9.9% seen across traditional public schools.
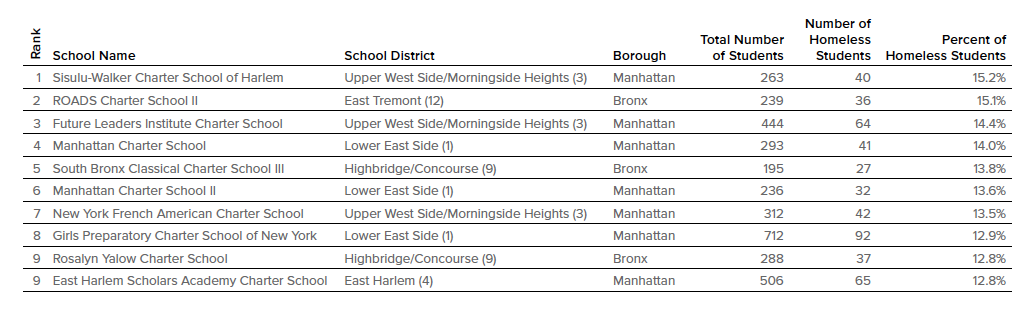
- Over 30 charter schools had ten or fewer homeless students enrolled. Sisulu-Walker Charter School of Harlem had the highest percentage of homeless students in a charter school citywide (15.2%) in SY 2016–17 for the second consecutive year.
What Are Charter Schools?
Charter schools are public schools that operate under their own not-for-profit Boards of Trustees, and are given more autonomy than traditional public schools. Because charters do not have the same requirements for reporting data as public schools, their numbers have to be examined separately and in less detail.
Are Charter Schools Proportionally Enrolling Homeless Students?
Top 10 Charter Schools for Homeless Students
SY 2016–17
Appendix
Complete List of Tables
The data for this Atlas were provided primarily by the New York City Department of Education. Unless otherwise noted, the source is the New York City Department of Education, unpublished data tabulated by the Institute for Children, Poverty, and Homelessness, SY 2010–11 to SY 2016–17.
CORRECTIONS:
At initial posting of Section I of this report on August 23 2018, there was a numeric error in appendix table “Where Do Students Living In Shelter Go To School?” (posted: September 20, 2018).
The original version of the appendix table “Are Homeless Pre-K Students Enrolling In School As Expected?” contained a labeling error that has been updated (posted December 11, 2018).
The original version of the chart “How Long Are Students Homeless?” contained a coding error that led to incorrect results being reported and has been updated (posted August 28, 2019).
We regret these errors and in the interest of transparency and continued improvement have made the relevant table and protocol updates.
Ralph da Costa Nunez, PhD, President and CEO
Aurora Zepeda, Chief Operating Officer
Katie Linek Puello, Digital Communications Manager
Project Team:
Josef Kannegaard, Principal Policy Analyst
Amanda Ragnauth, Senior Policy Analyst
Kristen MacFarlane, Senior GIS Analyst
Kaitlin Greer, Policy Analyst
Hellen Gaudence, Graphic Designer
Waqas Sheikh, GIS Intern