Overview
For many homeless students, school is not only a place to develop knowledge and skills for the future, but a much-needed source of stability in an otherwise unstable life. In addition to a student’s educational attainment, school provides consistency and the opportunity for students to form critical social connections with teachers, staff, and classmates.
Unfortunately, disruptions that often coincide with the experience of housing instability, such as mid-year transfers and chronic absenteeism, can threaten this educational stability. These school instability factors may, in turn, adversely impact academic performance and harm a student’s ability to graduate.
Addressing chronic absenteeism and mid-year transfers can go a long way to ensuring that homeless students can fully experience the same educational opportunities as their housed peers. However, the first step is to identify these students and their specific needs so they can be supported.
About Student Homelessness in New York City
One in 10 NYC public school students were identified as homeless during the 2016-17 school year. Given the prevalence of homelessness among school-aged students, educators and policymakers need to understand the specific educational challenges that students experiencing homelessness face and be aware of the resources and opportunities that exist to help these students reach their potential.
Student Homelessness in New York City sheds light on the more than 140,00 NYC public school students who have experienced homelessness over the past seven years. The Student Homelessness in New York City series explores the geography of student homelessness; the prevalence of school instability factors like chronic absenteeism and mid-year school transfers; whether the additional educational needs of language learners and students with special education needs are being met on time; the disproportionate rate of suspensions among students experiencing homelessness; and academic outcomes like graduation rates and test scores.
1.0 | School Instability Factors: Mid-Year School Transfers
Mid-Year Transfers
Students who transfer from one school to another at any point during the school year.
Understanding the prevalence of school transfers, which schools and districts have the highest transfer rates, and which students are at higher risk of experiencing transfers, are key to minimizing the negative impact of transfers on the lives of those students who experience them.
Homeless students are three times as likely to transfer schools mid-year as their housed classmates. One in four homeless elementary school students transfers to a new school during the year, and more than 2,000 change schools more than once every school year.
Students experiencing homelessness face frequent moves, often resulting in a choice between traveling long distances to reach their school of origin or transferring to a closer one, breaking the supportive ties they had developed with teachers and classmates.
The impacts of mid-year transfers are many, from the trauma of lost social ties to academic setbacks. Students must also adjust to new classroom rules, teachers, and unfamiliar transportation routes, while their families may be required to buy new school supplies and uniforms.
Every mid-year school transfer is estimated by the U.S. Department of Education to set a student back academically by up to six months. For students who transfer two or more times, they are set back up to a full school year. This leaves homeless students struggling to catch up to their peers for years to come.
1.1 What Is the Mid-Year Transfer Rate for Homeless Students?
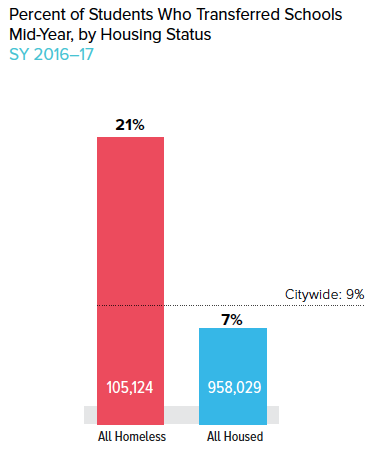
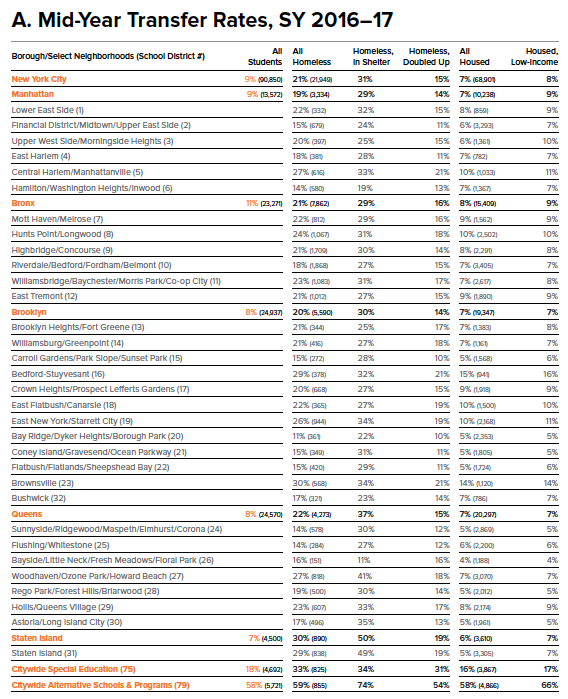
- In SY 2016-17, homeless students were three times as likely to transfer schools mid-year as their housed peers (21% vs. 7%).
- The high rate of transfers among homeless students meant that one out of every four students – or 24% – who transferred was homeless, despite homeless students making up only 10% of the student population.
- Staten Island had the highest transfer rate among boroughs, with 30% of homeless students either transferring into a borough school there or moving to a different school within the borough. All other boroughs had transfer rates between 19% and 22% for homeless students.
- At more than 1,200 schools – or 72% of all schools citywide– homeless students transferred at rates above the citywide average of 9%.
KEY TERMS
All Homeless
Students who were identified at any point during SY 2016–17 by the New York City Department of Education as meeting the McKinney-Vento definition of homelessness. This includes students in shelter, doubled-up, in hotel/motels, or other temporary arrangements.
All Housed
Students who lived in a fixed, regular, and adequate housing situation.
Formerly Homeless
Students who were not identified as homeless in SY 2016–17, but had been homeless at some point from SY 2010–11 to SY 2015–16.
Low-Income
Students who were eligible for free or reduced-price lunch, or identified by the NYC Human Resources Administration as receiving certain types of public assistance.
Homeless students were also far more likely to transfer schools than low-income housed students (21% vs. 8%). This suggests that increased school instability is correlated with homelessness specifically, rather than simply poverty.
Formerly homeless students had a transfer rate of 13%, nearly double that of other housed students. While now housed, the higher rate of transfers for formerly homeless students suggests that these students may still be experiencing instability as their family attempts to maintain permanent housing.
1.2 How Many Homeless Students Transfer More Than Once in a Year?
- Homeless students were more than four times as likely as their housed peers to experience multiple transfers in the same year (3.4% vs. 0.8%).
- Among homeless students who transferred, 16% changed schools more than once. By comparison, among housed students, 11% had multiple transfers.
- Homeless students in Staten Island were the most likely to have two or more transfers. They were about ten times as likely to transfer multiple times as housed students (5.3% vs. 0.5%). Homeless students in Manhattan – while the least likely to transfer multiple times – still transferred at more than three times the rate of housed students (3.1% vs. 0.9%).
- Across geographic districts, both homeless and housed students in Bedford-Stuyvesant (District 16) were most likely to transfer two or more times (6.1% and 1.8%, respectively). Students in the Special Education District (District 75) had even higher rates of multiple transfers for both homeless and housed students (7.5% and 2.6%, respectively).
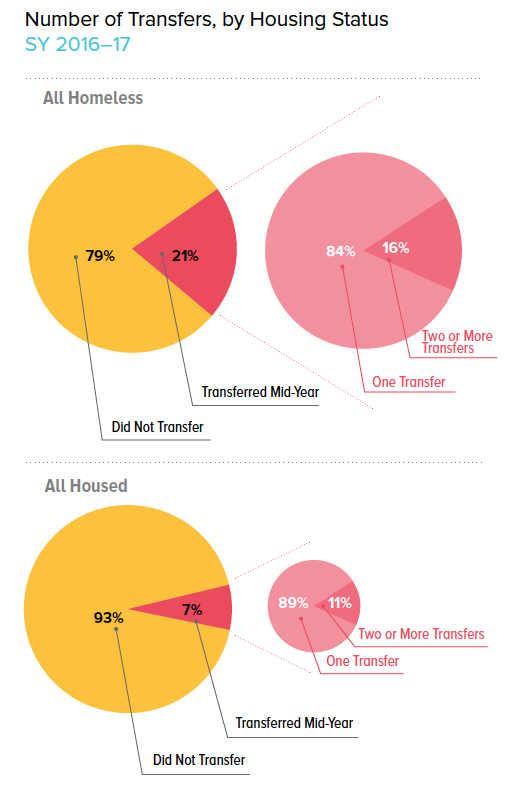
Data shown here are for the 105,124 homeless students and 958,029 housed students with transfer data.
Frequent school transfers are associated with
lower educational attainment for transferring
students and can hamper their ability to form
supportive relationships with classmates and
teachers.
1.3 How Have Transfer Rates Changed Over Time?
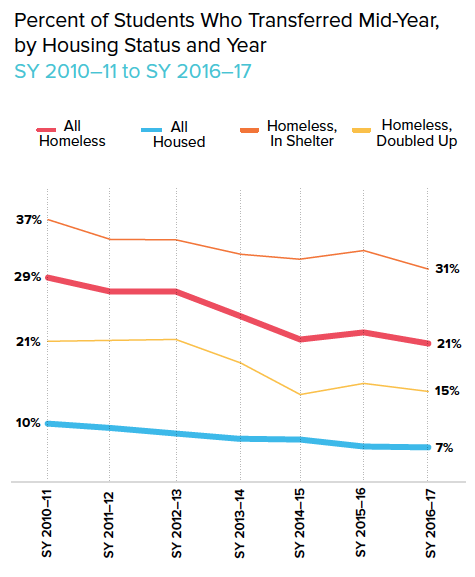
- Since SY 2010–11, mid-year transfers decreased among all groups. Despite the overall decline, homeless students continue to transfer at much higher rates than their housed peers in SY 2016–17 (21% vs. 7%).
- Among homeless students, those living in shelter were twice as likely to transfer in SY 2016–17 than those living in temporary doubled-up arrangements (31% vs. 15%).
- Although transfer rates among sheltered and doubled-up students decreased, the number of students who transferred increased, from about 9,900 sheltered students and 6,300 doubled-up students in SY 2010–11 to roughly 10,800 sheltered students and 9,600 doubled-up students in SY 2016–17.
- Over the same period, the number of housed students transferring declined from about 104,300 to 68,900.
KEY TERMS
All Homeless
All students who were identified at any point during SY 2016–17 by the New York City Department of Education as meeting the McKinney-Vento definition of homelessness.
All Housed
Students who lived in a fixed, regular, and adequate housing situation.
Homeless, In Shelter
Students who lived in emergency or transitional shelter.
Homeless, Doubled Up
Students who have found temporary accommodations with another family or other person due to loss of housing or economic hardship.
Click here for the complete table of school
districts and transfer rates.
1.4 In Which Grade Levels Are Students Most Likely to Transfer?
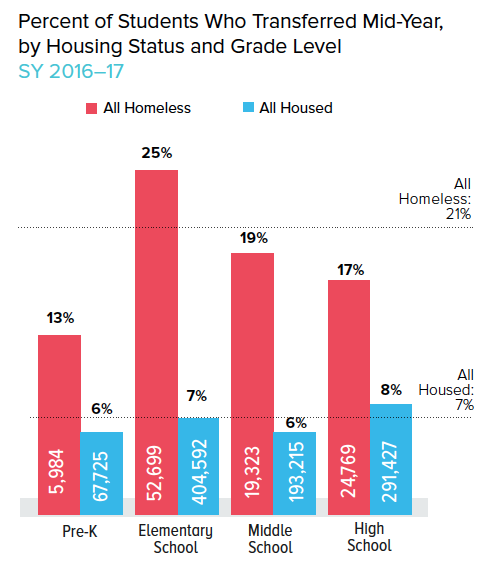
- At all grade levels, homeless students were two to three times as likely to transfer as housed students.
- Homeless students transferred at rates of 13% to 25%, depending on grade level. For housed students, transfer rates were relatively stable at 6% to 8%.
- The largest disparity in transfer rates was among elementary school students—one in four (25%) homeless elementary students transferred mid-year, over three and a half times the rate of housed elementary students (7%)
- Homeless students in middle school were also more than three times as likely to transfer as their housed peers (19% vs. 6%). The disparity was smaller in pre-K and high school, though homeless students were still twice as likely as housed students to transfer in pre-K (13% vs. 6%) and high school (17% vs. 8%)
- Elementary and middle schools in Staten Island had the highest transfer rates for homeless students in the city (34% and 29%, respectively). In pre-K, transfer rates for homeless students were highest in Brooklyn and Staten Island (15%). In high school, transfer rates were highest in Queens (25%).
Having to change schools once the school year
is underway can have multiple consequences for
homeless students. In addition to being associated
with lower academic achievement, mid-year
transfers can impact access to support services
such as special education or English Language
Learner (ELL) programs, and affect a student’s
ability to attend class regularly and on time by
increasing their commute time. Cross-borough
transfers can require a commute of up to two hours
each way.
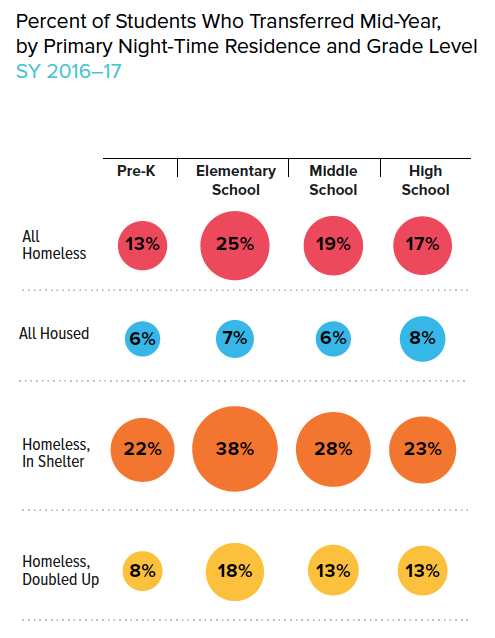
1.5 Do Transfer Rates Vary by Students’ Primary Night-Time Residence?
- Regardless of a homeless student’s primary night-time residence, mid-year transfer rates for homeless students were higher than for their housed classmates.
- Transfer rates for homeless students who were doubled up were lower than for students in shelter at all grade levels. For doubled-up students, the transfer rate remained at 13% between middle school and high school, while for students in shelter, transfer rates went from 28% in middle school to 23% in high school.
- Among homeless students, those in elementary school were most likely to transfer, with 38% of elementary students living in shelter transferring mid-year. This was over twice the rate for doubled-up elementary students (18%).
- The disparity in transfer rates between elementary school students in shelter and those living doubled up was highest in Staten Island, with 58% of students in shelters and 21% of doubled-up students changing schools.
1.6 In Which Districts Are Transfer Rates for Homeless Students the Highest?
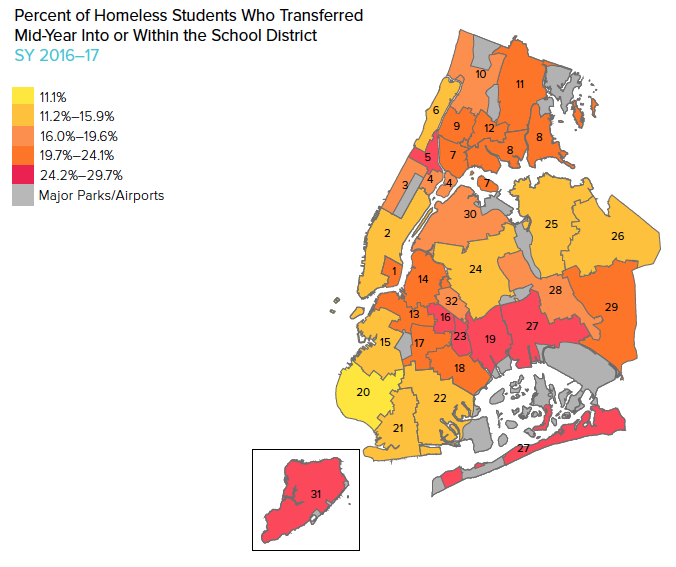
- Mid-year transfers were common for homeless students across the city. Even in Bay Ridge (District 20), the district with the lowest mid-year transfer rate, more than one in ten homeless students transferred (11%).
- In districts with the highest transfer rates, approximately 1 in 4 homeless students transferred mid-year (24.2%–29.7%). Three of these six highest districts were in Brooklyn (Districts 23, 16, and 19). The remaining three were located in Queens (District 27), Manhattan (District 5), and Staten Island (District 31).
Click here for the complete table of school districts
and transfer rates.
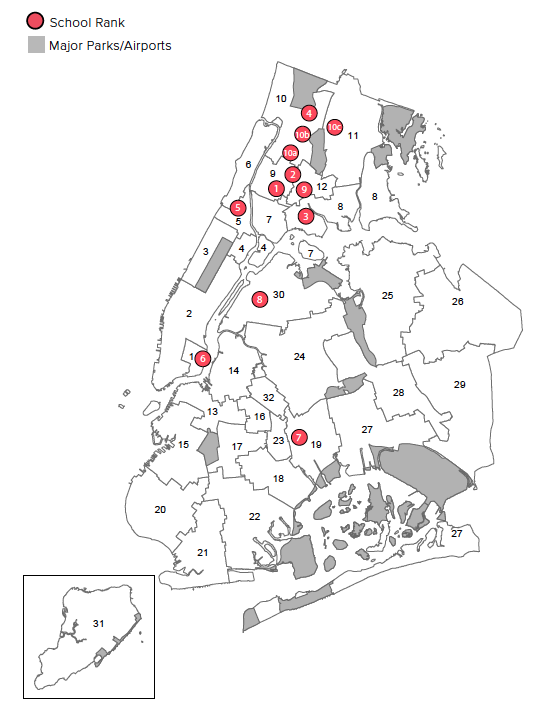
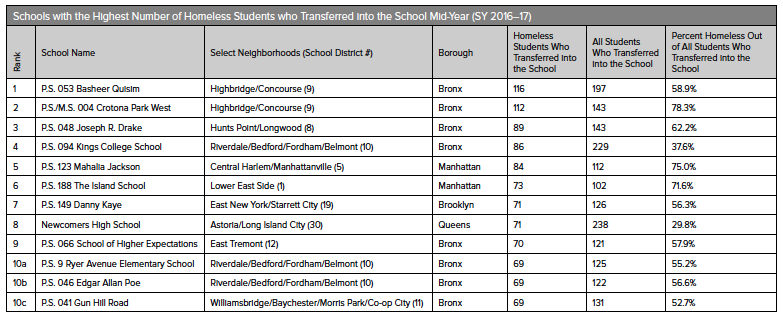
1.7 Which Schools Had the Highest Number of Incoming Mid-Year Transfers?
- The majority of schools with the most homeless students transferring in were located in the Bronx, an area with many family shelters. In total, schools in the Bronx accounted for 36% of transfers by homeless students, and eight of the top 12 schools for homeless transfers were in the Bronx.
- P.S. 53 Basheer Quisim in Highbridge/Concourse (District 9) had the largest number of homeless students transfer into the school mid-year (59% of all incoming transfers).
- In 109 schools across the city, at least half of all incoming transfer students were homeless. These schools received five to 116 homeless students in SY 2016–17.
2.0 | School Instability Factors: Chronic Absenteeism
Chronic Absenteeism
Missing more than 10%, or more than 18 days, of a 180-day school year.
For homeless students, housing instability can often result in missing large portions of the school year. During the 2016–17 school year, more than a third of homeless students were chronically absent, and half of all homeless students missed almost three weeks of class time over the course of the year.
The reasons why a homeless student may miss school include transportation challenges, shelter-intake and eligibility policies, health- and safety-related absences, or one of the many other realities of their unstable housing situation. When students consistently miss school, they are more likely to fall behind, disengage from their education, and possibly even drop out.
Recognizing the prevalence of chronic absenteeism in the lives of homeless students, identifying which schools and districts have the highest rates of absenteeism, delineating which students are at higher risk of missing school, and understanding the impact of chronic absenteeism on the academic outcomes of students is the best way to target interventions that address school instability factors, and offset the impact of housing instability in the academic lives of homeless students.
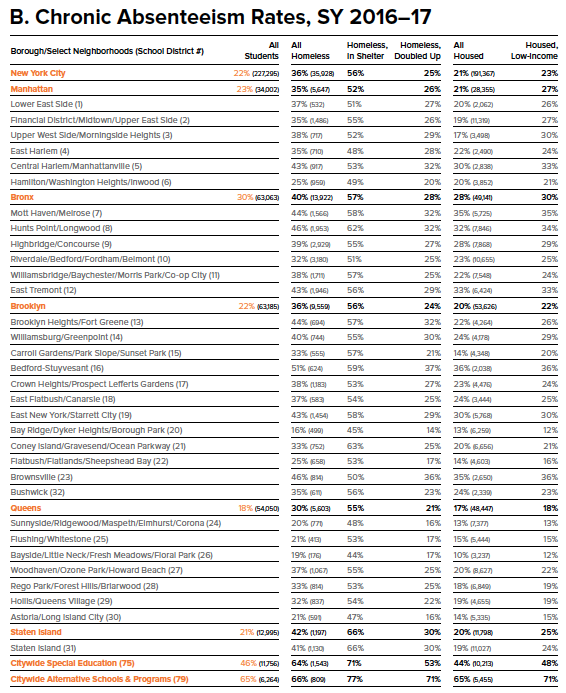
2.1 What Is the Chronic Absenteeism Rate Among Homeless Students?
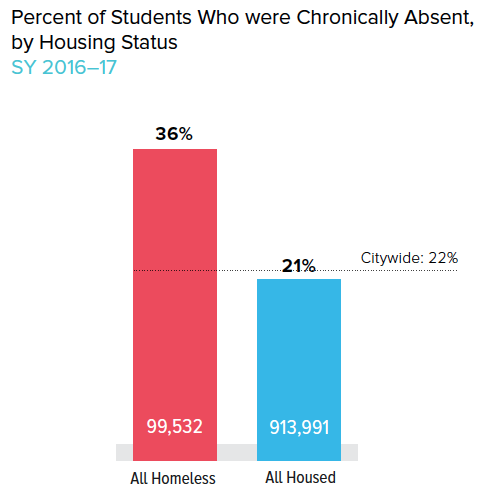
- Over one-third of homeless students (36%) were chronically absent during SY 2016–17. These students missed more than 18 days of school in one year, or more than 10% of the school year.
- Homeless students were more than 1.5 times as likely to be chronically absent as housed students.
- Homeless students in Staten Island were the most likely to be chronically absent, with 42% of students missing over 10% of the year. Queens had the lowest rate of all boroughs, though its 30% chronic absenteeism rate for homeless students was still above the citywide average of 22% for all students.
- Among geographic school districts, homeless students were most likely to be chronically absent in Bedford-Stuyvesant (District 16, 51%), followed by Hunts Point (District 8, 46%) and Brownsville (District 23, 46%).
- Chronic absenteeism rates for homeless students were highest in the city’s specialized school districts. About two in three homeless students were chronically absent in Alternative Schools and Programs (District 79, 66%) and the Special Education District (District 75, 64%).
KEY TERMS
All Homeless
Students who were identified at any point during SY 2016–17 by the New York City Department of Education as meeting the McKinney-Vento definition of homelessness. This includes students in shelter, doubled-up, in hotel/motels, or other temporary arrangements.
All Housed
Students who lived in a fixed, regular, and adequate housing situation.
Formerly Homeless
Students who were not identified as homeless in SY 2016–17, but had been homeless at some point from SY 2010–11 to SY 2015–16.
Formerly homeless students had a chronic
absenteeism rate of 35%. The similarity between
rates of absenteeism between currently and
formerly homeless students suggests that these
students may still be experiencing instability
as their family attempts to remain permanently
housed.
2.2 How Many School Days Do Homeless Students Miss?
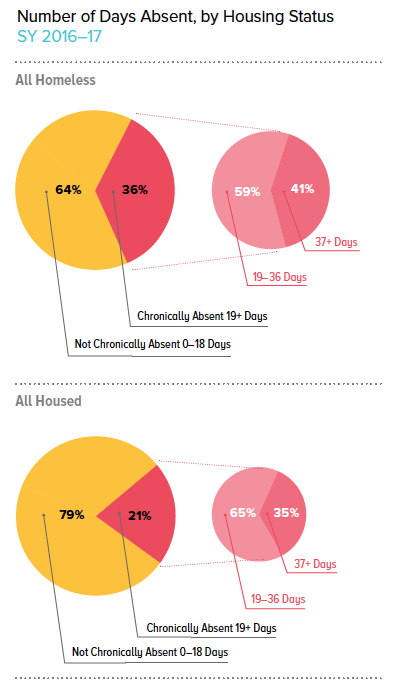
- Not only were homeless students more likely to be chronically absent, but they were also more likely to miss close to two months of school. Homeless students missed 37 or more days, or more than 20% of the school year, at twice the rate of housed students (15% vs. 7%).
- Among homeless students who were chronically absent, 41% missed 37 or more days of school. In comparison, 35% of housed students who were chronically absent missed 37 or more days of school.
- One in five homeless students who attended school in Staten Island missed 37 or more days of school (19%) – a rate three times as high as their housed peers in the borough (6%). Homeless students in Queens were least likely to miss 37 or more days of school (12%) – though still twice the rate of their housed classmates in Queens (6%).
- Among geographic school districts, homeless students in Bedford-Stuyvesant were most likely to miss 37 or more days of school (District 16, 22%), and those in Bay Ridge were least likely (District 20, 6%). Homeless students in Alternative Schools and Programs (District 79) and the Special Education District (District 75) were even more likely to miss 37 or more days of school (49% and 35%, respectively).
Data shown here are for the 99,532 homeless students and 913,991 housed students with absenteeism data.
Homeless students missed an average of 20 days
and a median of 13 days of school, or almost 3
weeks of class time. This was 63% higher than
the median of 8 days for housed students. The
difference between the average and the median
number of days missed was due to a relatively
small number of students missing a very large
number of days.
2.3 How Have Absenteeism Rates Changed Over Time?
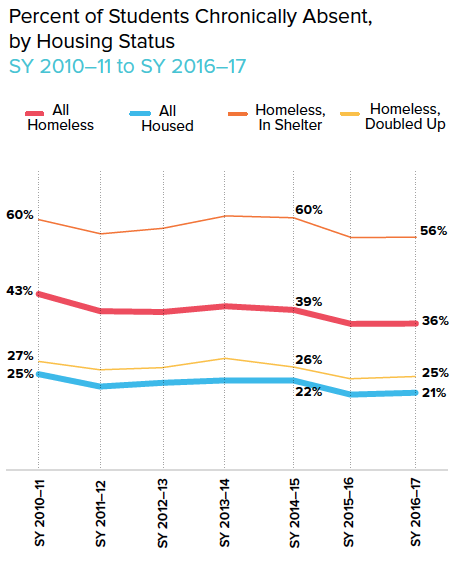
- Among both homeless and housed students, chronic absenteeism rates declined since SY 2010–11. However, the decline among homeless students was primarily due to an increase in the proportion of doubled-up students. These students had significantly lower chronic absenteeism rates compared to students in shelter (25% vs. 56%).
- Despite the percentage decrease, the number of homeless students who were chronically absent increased. Over 10,000 more homeless students were chronically absent in SY 2016–17 than in SY 2010–11. At the same time, the number of chronically absent housed students declined by more than 47,000.
- Queens saw the largest decrease in its absenteeism rate among homeless students, dropping from 39% to 30%. Manhattan, by contrast, had the smallest change, from 38% to 35%.
- In two school districts, chronic absenteeism rates for homeless students actually increased after SY 2010–11. In Midtown Manhattan (District 2), rates rose from 34% to 35%, representing an additional 590 homeless students being chronically absent. In Williamsburg (District 14), rates rose from 39% to 40%, and an additional 290 homeless students were chronically absent.
KEY TERMS
All Homeless
All students who were identified at any point during SY 2016–17 by the New York City Department of Education as meeting the McKinney-Vento definition of homelessness.
All Housed
Students who lived in a fixed, regular, and adequate housing situation.
Homeless, In Shelter
Students who lived in emergency or transitional shelter.
Homeless, Doubled Up
Students who have found temporary accommodations with another family or other person due to loss of housing or economic hardship.
In 2014, the New York City Department of
Education launched the “Every Student, Every
Day” campaign as part of the Community Schools
Initiative to improve chronic absenteeism rates.
The campaign emphasizes the importance of
tracking attendance rates and provides resources
and encouragement to chronically absent students
based on their needs.
2.4 In Which Grade Levels Are Students Absent Most Often?
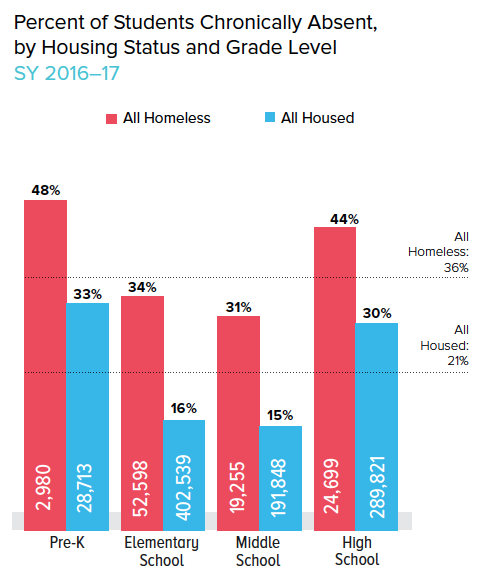
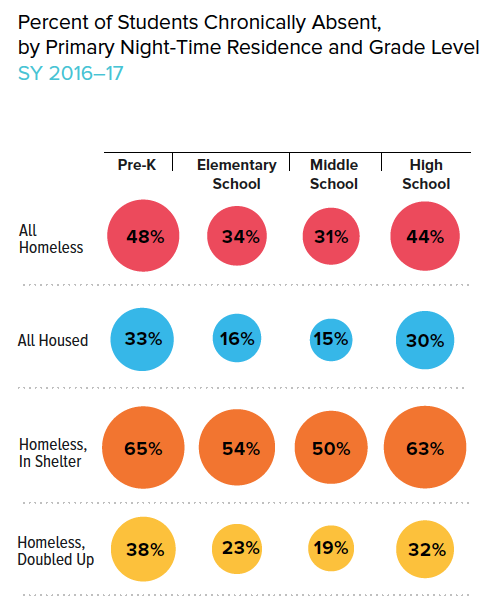
- Across all grade levels, homeless students were 1.5 to 2 times as likely to be chronically absent as their housed classmates. This disparity was widest in elementary school, where 34% of homeless students, and only 16% of housed students, missed over 18 days of school.
- Almost half (48%) of all homeless pre-K students were chronically absent, missing an average of 23 days out of the school year. Rates of chronic absenteeism in pre-K were highest in the Bronx, where 52% of homeless pre-K students were chronically absent.
- For high school students, the widest disparity in absenteeism rates was seen in Staten Island, where 48% of homeless and 25% of housed students were chronically absent.
- For both homeless and housed students, chronic absenteeism rates displayed the same U shaped pattern, with pre-K rates being the highest, then dropping by nearly half during elementary and middle school, and rising again in high school. Nevertheless, rates for homeless students were still 50% higher than for their housed peers.
Note: Pre-K absenteeism data shown here do not include New York City Early Education Centers (NYCEEC).
Students who are chronically absent, meaning they
miss more than 10% of the school year, are more
likely to fall behind their classmates in learning at
the appropriate grade level. When students miss
large amounts of class time in early grades, these
effects can accumulate over time and lead to
lower test scores, grade retention, and inability to
graduate on time, if at all.
2.5 Does a Student’s Primary Night-Time Residence Affect Attendance?
- Homeless students, regardless of primary night-time residence and grade level, were more likely to be chronically absent than their housed classmates.
- Among homeless students, those living in shelter were at a higher risk of being chronically absent. At least half of homeless students in shelter were chronically absent across grade levels, with rates over 60% in pre-K and high school.
- The disparity in chronic absenteeism rates between students in shelter and those living doubled up was greatest in middle school, with students in shelter being 2.5 times as likely to be chronically absent as doubled-up students (50% vs. 19%).
- Among pre-K students in shelter, about two in three of those attending school in Brooklyn, the Bronx, or Manhattan were chronically absent (67%, 66%, and 63%, respectively), while roughly half of students in Queens were chronically absent (54%). For high school students in shelter, absenteeism rates were highest in Staten Island (75%), and lowest in Manhattan (57%).
Across all grade levels, doubled-up students were
chronically absent at approximately the same rates
as low-income housed students. This suggests
that circumstances unique to students in shelter,
such as inadequate transportation or shelter
intake policies, could be a significant factor driving
absenteeism rates for homeless students as a
whole.
2.6 In Which Districts Are Absenteeism Rates the Highest?
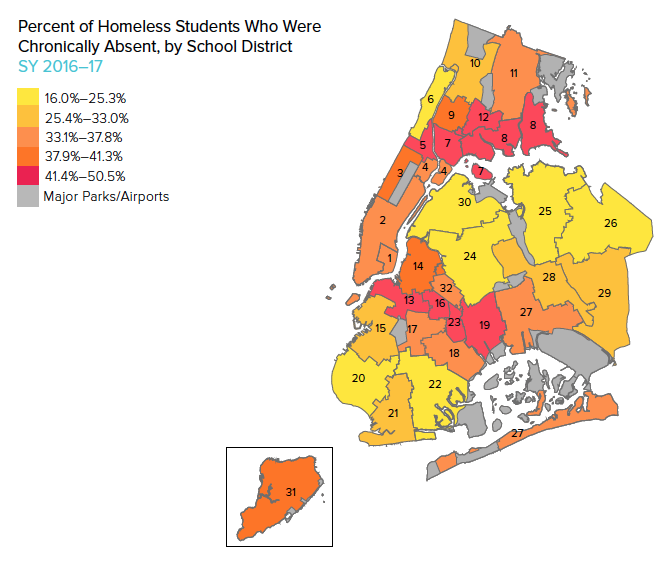
- Throughout New York City, chronic absenteeism is prevalent among homeless students, with rates ranging from 16% to nearly 51% by school district.
- In over 60% of school districts (20 of 32), at least one out of three homeless students was chronically absent.
- Eight districts have chronic absenteeism rates of at least 41.4%—almost twice the citywide rate. Four of these districts are in Brooklyn (Districts 13, 16, 23, and 19) and three are in the Bronx (7, 8, and 12). More than one in three homeless students in Brooklyn and the Bronx were chronically absent (36% and 40%, respectively).
- Bedford-Stuyvesant (District 16) had the highest rate of chronic absenteeism among homeless students (50.5%), and Bay Ridge (District 20) had the lowest (16%).
Click here for the complete table of school districts
and chronic absenteeism rates.
2.7 Which Schools Had the Highest Absenteeism Rates?
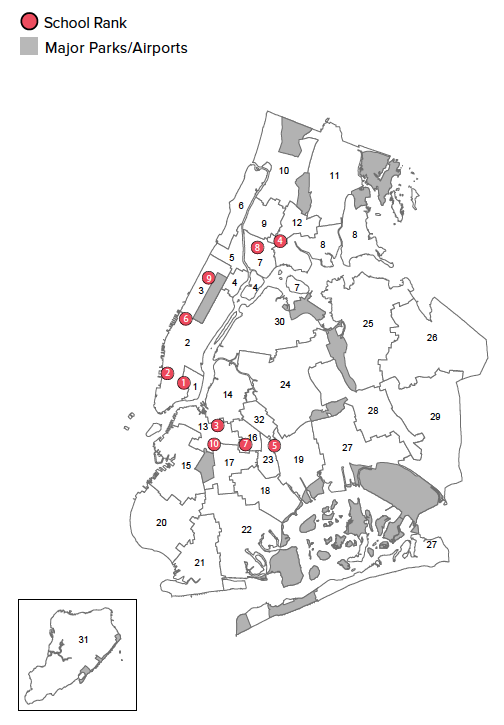
- Nearly 1,200 schools – 72% of all schools citywide– had chronic absenteeism rates for homeless students that were above the citywide average of 22%.
- The schools with the highest chronic absenteeism rates were all high schools. Among the top ten schools, both housed and homeless students had very high rates of chronic absenteeism.
- Four of the top ten schools were located in Manhattan, four were in Brooklyn, and the remaining two were in the Bronx.
- At Cascades High School on the Lower East Side (District 1), where 13% of its almost 300 students were homeless, every homeless student was chronically absent. Students in shelter missed an average of 84 days, or nearly half the school year, and doubled-up students missed an average of 58 days. Cascades is a transfer high school for under-credited students ages 16–21 to work towards graduation with a high school diploma.

Appendix
The data for the Student Homelessness in New York City series were provided primarily by the New York City Department of Education. Unless otherwise noted, the source is the New York City Department of Education, unpublished data tabulated by the Institute for Children, Poverty, and Homelessness, SY 2010–11 to SY 2016–17.
The following appendices allow for comparisons of the prevalence of instability factors across different housing statuses and geographic boundaries. Rates of mid-year transfers and chronic absenteeism are shown at citywide, borough, and school district levels.
The numerators and rates are provided for several categories, including all students, all homeless students, and all housed students, at each geographic level. Additionally, the rates of these instability factors for subpopulations of homeless students – those living in shelter and those living doubled up – are shown, along with housed students who are low-income.
In addition to this resource, the New York City Interactive Map of Student Homelessness allows users to view data specific to their district.
Note: Data by school district do not include schools in non-geographic districts, so borough and district total percentages may differ. Ns of fewer than 30 students were redacted.
Note: Data by school district do not include schools in non-geographic districts, so borough and district total percentages may differ. Ns of fewer than 30 students were redacted.
Ralph da Costa Nunez, PhD, President and CEO
Aurora Zepeda, Chief Operating Officer
Project Team:
Andrea Pizano, Chief of Staff
Josef Kannegaard, Principal Policy Analyst
Kristen MacFarlane, Senior GIS Analyst
Amanda Ragnauth, Senior Policy Analyst
Rachel Barth, Senior Policy Analyst
Kaitlin Greer, Policy Analyst
Mukta Ramola, GIS Analyst
Katie Linek Puello, Content Manager
Hellen Gaudence, Senior Graphic Designer
Marcela Szwarc, Graphic Designer