Executive Summary
While Seattle is known for its tech titans, cycling enthusiasts, and progressive values, it is also home to over 3,600 homeless students. Ninety-seven percent of all public schools in Seattle serve at least one homeless student; 71% serve more than 10. In this publication, we at the Institute for Children, Poverty, and Homelessness, through a partnership with Seattle Public Schools (SPS), illustrate just how pervasive and far-reaching the issue of student homelessness is across the city. These students face unique challenges to their education, and in the pages to follow we analyze the ways in which homelessness impacts their academic experience even beyond the effects of race or poverty.
The crisis of child and family homelessness continues to grow in Seattle. In late 2015, the city declared a state of emergency on family homelessness, enacting a plan to expand services and funding across multiple city agencies, including SPS. Increased attention has brought with it increased identification, as more homeless families and children are connected with services they need. Finding more of the “hidden homeless” only highlights the need for an even stronger response to the obstacles faced by thousands of schoolchildren every day.
Obstacles such as a student’s housing status should not define their life outcomes. Education is the key to minimizing the potential negative impact that homelessness has on a child. By ensuring that students are able to thrive academically as they cope with housing instability, teachers and schools can equip them with the necessary skills to break the cycle of poverty that can often plague families for generations.
This is why schools remain a critical component in the fight against homelessness. Not only do they provide benefits to students, they also play an essential role in helping craft new solutions. One way they do this is through the data schools provide the Department of Education about “doubled-up” students. By law, the U.S. Department of Education defines homelessness to include students who are “doubled-up,” meaning they are staying temporarily with another household due to economic hardship.
Including these students—as opposed to only those living in a shelter—provides a fuller and more accurate picture of family homelessness across any jurisdiction. At the same time, we must recognize that not all homeless students are the same and that factors such as a student’s race and ethnicity, or whether they live in a shelter or on the street, are going to shape which solutions are most likely to help.
The purpose of The Seattle Atlas of Student Homelessness is not to pass judgment on any policy initiative or program, but to provide an in-depth look at the educational risks and outcomes of homeless students. Homelessness can impact a student’s ability to succeed academically in a variety of ways—from literally keeping them out of the classroom with frequent moves and transfers, to trauma-induced behavioral issues that can impede their learning. This report explores these and other ways that homeless students can be disadvantaged relative to their classmates and where in Seattle these issues are most prevalent.
Our ability to conduct this research was limited only by the availability of data. SPS could not provide student-level information to identify low-income students, so in many cases we are unable to compare the outcomes of homeless students with their low-income peers who have never been homeless. We also do not know where these students are living, so this report focuses on where they attend school. Homeless children have the right under federal law to remain enrolled in a school even if they move outside the catchment area or district, and we simply do not have the information to report on how many homeless students in Seattle are living in the neighborhoods in which they go to school.
We hope Seattle will come together to unpack our findings, which show that homeless students have significantly different experiences than their classmates—such as the fact that one out of every five black students is homeless, over 30% of homeless students missed more than a month of school, and over 40% of homeless students in grades 3–8 scored in the lowest possible category on the state assessment—and will use this analysis to chart a path forward. This report is not the final word, but rather a launch point for deeper conversations and action to support homeless students as the work to end homelessness continues.
Key Findings
- Homelessness is growing across Seattle. Since the 2012–13 school year, homelessness has increased in schools across every neighborhood in Seattle, with the exception of Beacon Hill. Rates of growth have been highest in areas to the east, including
Rainier Valley, Capitol Hill, Lake City, and Seward Park. - Interagency Academy, a network of alternative high schools, enrolls many of the city’s homeless students. Thirteen percent of homeless students were in Interagency Academy during SY 2015–16, and 36% of all students within the network were identified as homeless that year. Interagency Academy locations were also consistently among the schools with the highest transfer rates for homeless students.
- A student’s type of homelessness presents unique challenges. Only 37% of homeless students were sleeping in a shelter during SY 2015–16. Being doubled up was associated with a much higher likelihood of chronic absenteeism for homeless high school students, while students in shelter were less likely to meet grade-level standards on 3rd-8th grade English Language Arts exams.
- Housing instability compounds known racial and economic disparities. When measured using standardized state assessments, the “opportunity gap” faced by low-income students and students of color is even wider if a student is also homeless. Similarly, the disparity in how often students of color receive school suspensions is also increased when housing status is considered.
- Many homeless students have support needs beyond housing. Fifty-three percent of students homeless in SY 2015–16 had been homeless in at least one of the previous three years. Close to 20% of homeless students had an IEP, and these students were not only more likely to be cited for disciplinary offenses than other homeless students, but more likely to engage in severe behaviors rated as “Exceptional Misconduct.”
Section 1
The Demographics of Student Homelessness in Seattle
Over 3,600 public school students, or one out of every 16 children, experienced homelessness in Seattle during the 2015–16 school year. This is over 6% of the total student body in Seattle Public Schools and represents a growth of 55% since SY 2012–13. These students are predominantly black and Hispanic and come from all grade levels. Most are staying in unstable “doubled-up” living conditions rather than in a shelter, and a majority have experienced housing instability over multiple years. There is also significant overlap between homelessness and a student’s need for additional supports, with many homeless students having an Individualized Education Plan (IEP) or enrolled in a bilingual program. This section explores the overarching trends that define student homelessness in Seattle: who these students are, where they attend school, and where in the city homelessness is growing the fastest.
Key Findings
- Rainier Valley, the Central Area, and Delridge had the most homeless students in the city.
- Since the 2012–13 school year, Capitol Hill, Rainier Valley, and Lake City saw the largest percent increases in number of homeless students.
- Thirteen percent of homeless students in SY 2015–16 attended Interagency Academy, a network of alternative high schools for struggling students.
Policy Considerations
- Although Seattle declared a state of emergency on homelessness in 2015, many homeless students are not eligible to be connected with the housing resources available through Family Housing Connections. This is due to the narrower definition of homelessness used by some federal agencies.
- Much of the growth in student homelessness and related indicators are signs of improved identification and expanded services. Newly identified students are not necessarily newly homeless and would benefit most from additional funding and services that address the long-term challenges of poverty and housing instability.
Student Homelessness Is Growing in Seattle
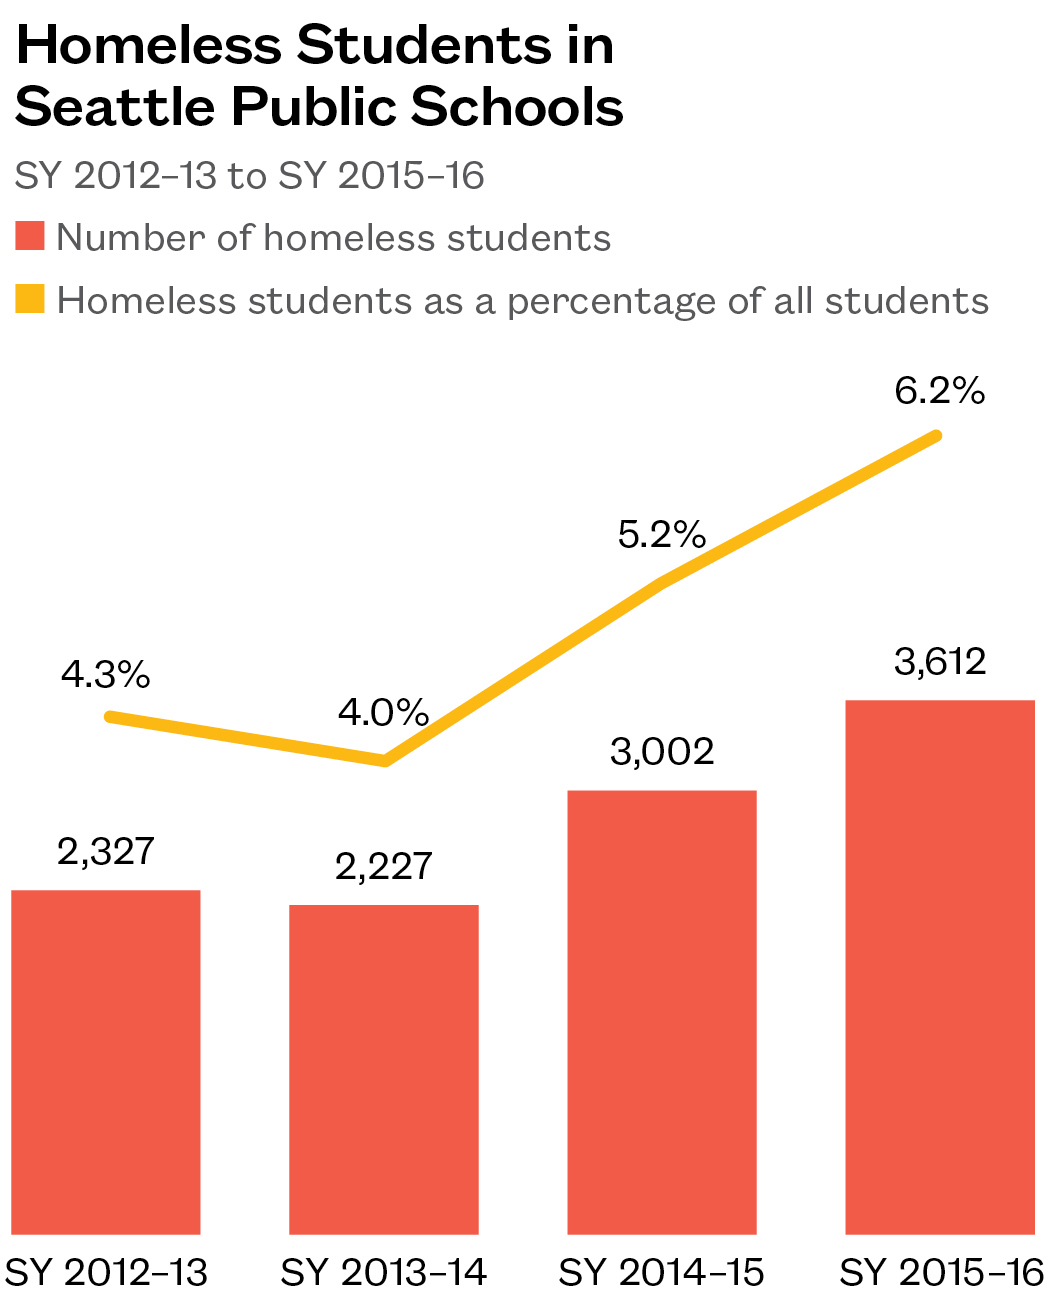
- Since SY 2012–13, the number of homeless students increased by 55%, to 3,612. Over the same period, total enrollment rose by only 7%. The percentage of students identified as homeless also increased, to 6.2%.
- Ninety-seven percent of SPS schools that enrolled students in SY 2015–16 had homeless students.
- The increase is likely due in part to improved identification practices. In 2015, the City of Seattle declared a state of emergency on homelessness, providing additional funds and developing a response plan with SPS to better connect homeless students with services.
Homeless Students Are in Every Grade
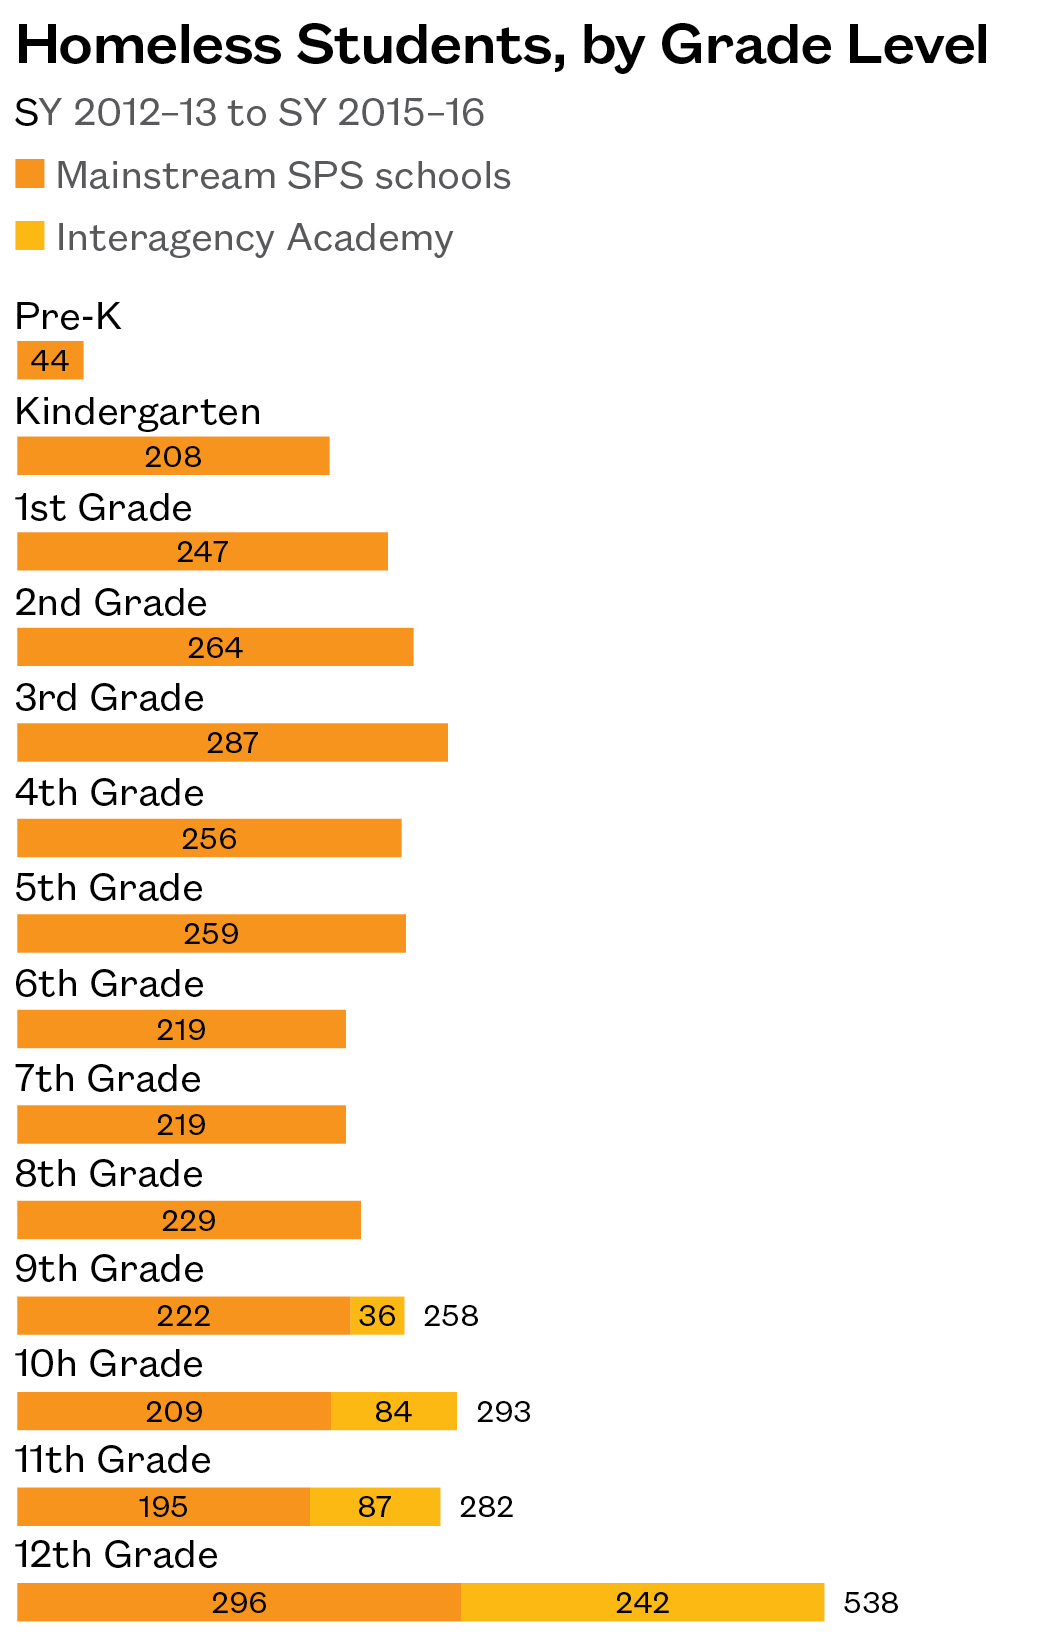
- Homeless students represented between 4–8% of the student population in all grades except preschool (2%) and 12th grade (13%). Pre-K enrollment of homeless students will likely rise as programs continue to expand.
- Interagency Academy, a network of alternative high schools, enrolled over 450 homeless students across Seattle. These students represented 36% of Interagency Academy’s total enrollment in SY 2015–16.
Black and Hispanic Students Are Over-Represented among Homeless Students
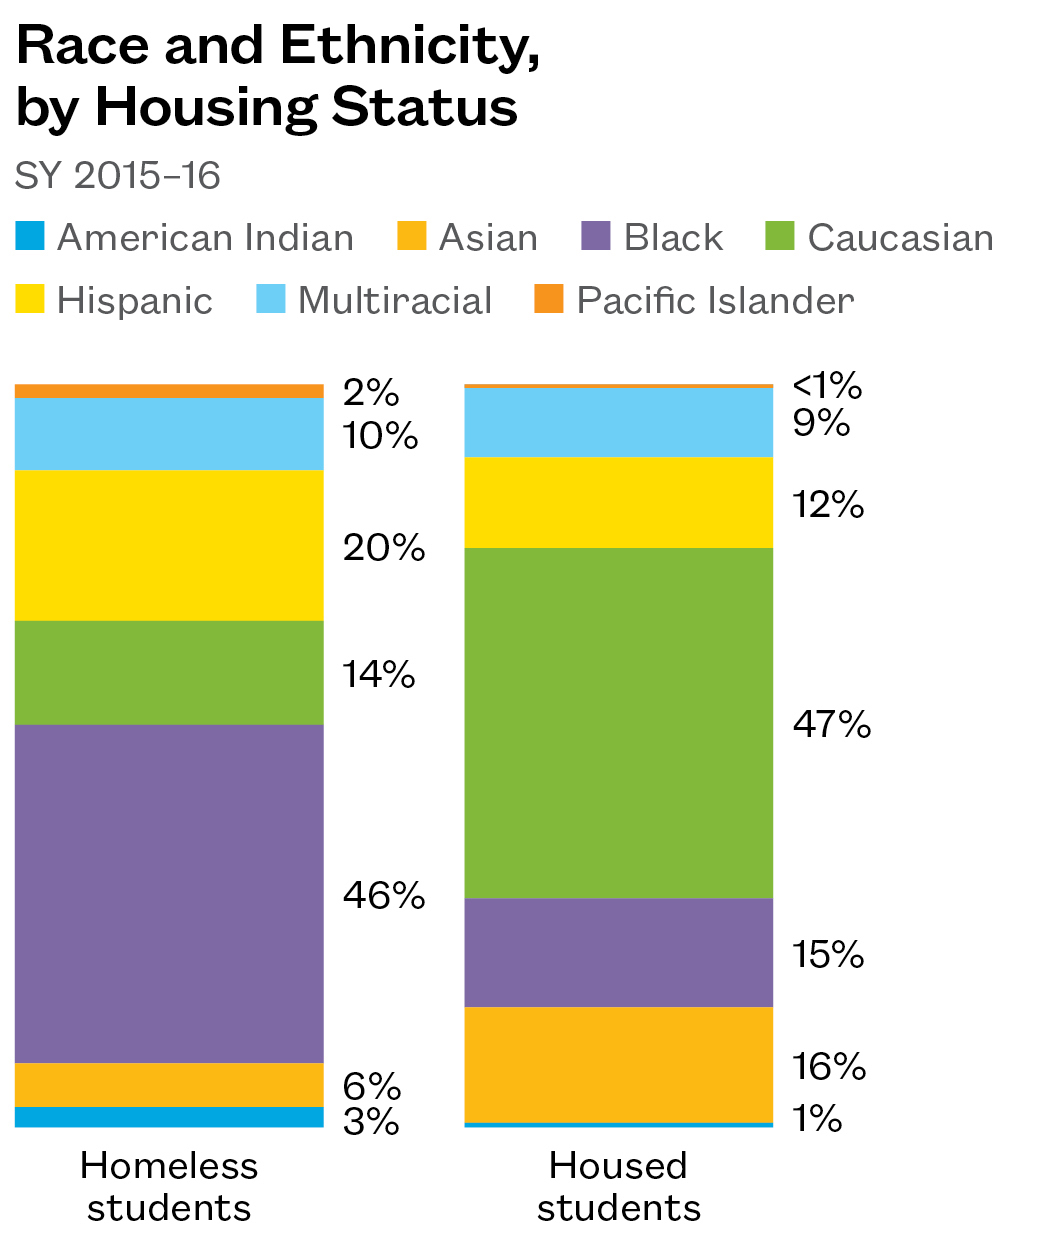
- Black and Hispanic students were over-represented among the homeless population, making up a combined 66% of homeless students despite being only 31% of the total student population.
- Twenty-three percent of all Pacific Islander and American Indian students were identified as homeless in SY 2015–16, along with 17% of black and 10% of Hispanic students.
Less Than Half of Homeless Students Are in Shelter
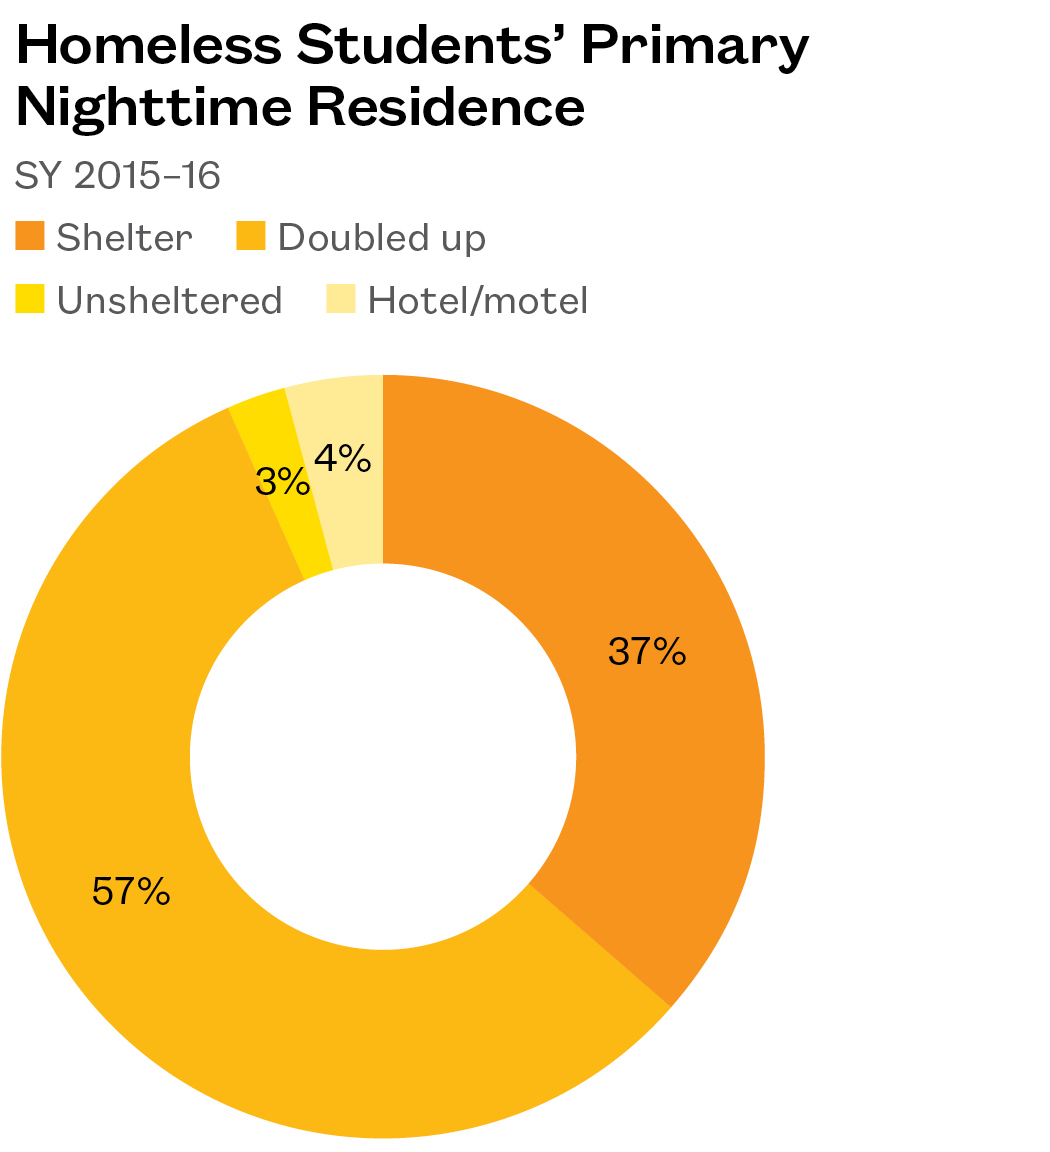
- The majority of homeless students (57%) slept in unstable “doubled-up” living situations. Thirty-seven percent were in a shelter, and ~7% were unsheltered or in a hotel or motel.
- Doubled-up students are not eligible for many of the same housing resources as other homeless students, such as those available through Family Housing Connections, due to differing federal definitions of homelessness.
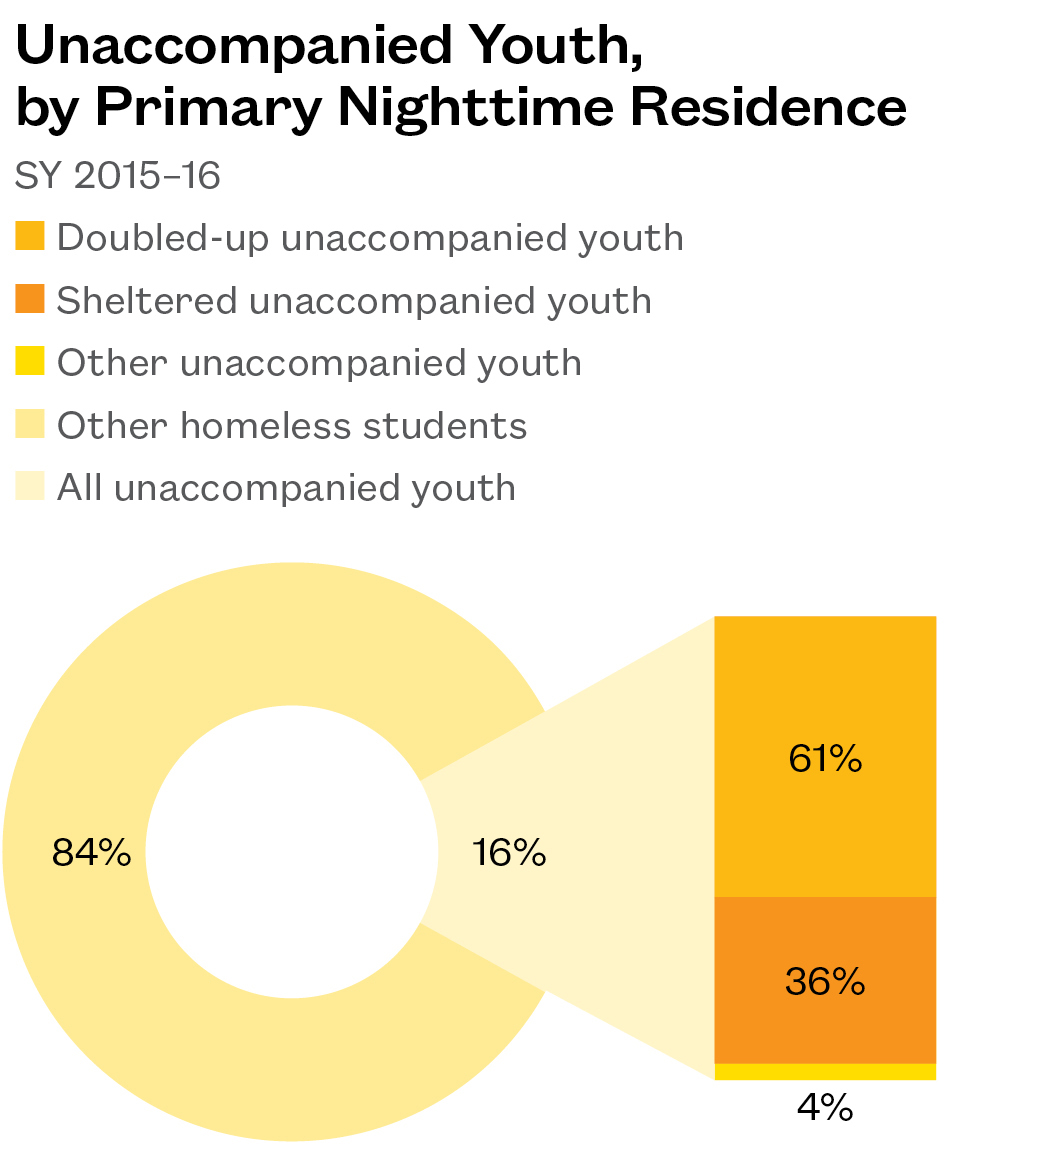
Unaccompanied Youth Are More Likely to Stay Doubled-up
- Five hundred seventy-seven students, or 16% of all students who were homeless in SY 2015–16, were unaccompanied youth who did not live with a parent or guardian. One hundred fifty-nine of them (28%) were age 18 or older at the start of the school year.
- Of all unaccompanied youth in SY 2015–16, 61% lived doubled up with another household, 36% were in a shelter, and 4% lived in a hotel or motel or were unsheltered.
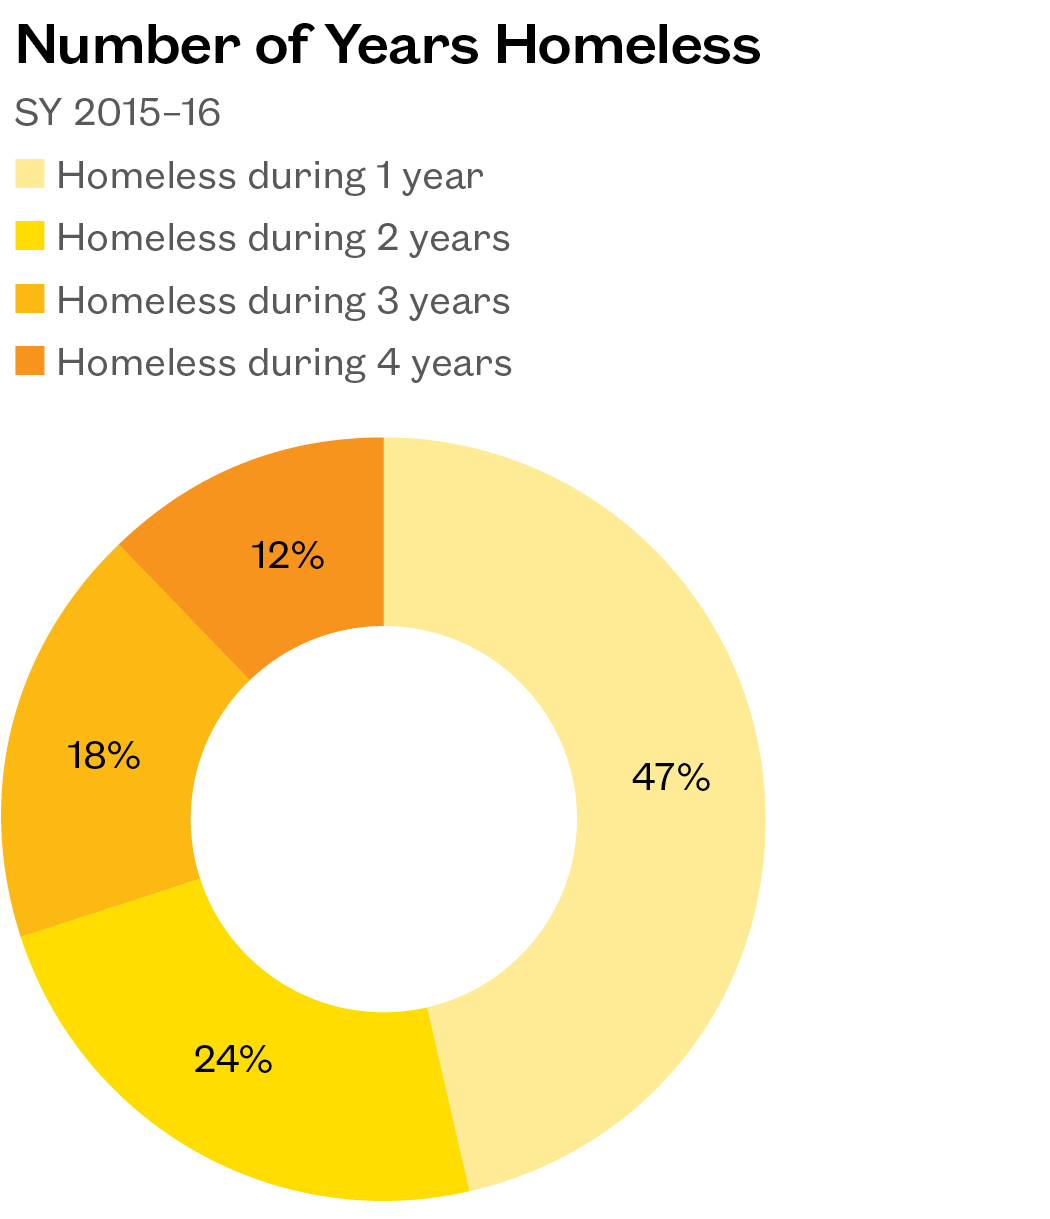
Most Students Are Homeless Longer Than One Year
- Fifty-three percent of students who were homeless during SY 2015–16 had been identified as homeless in previous years. Over one in 10 homeless students had been homeless in every year since SY 2012–13, although not necessarily continuously.
- Of the 3,612 students identified as homeless in SY 2015–16, 953 (26%) were enrolled in SPS for the first time that year. Twenty-two percent of these students were in either preschool or kindergarten, while 13% were in 12th grade.
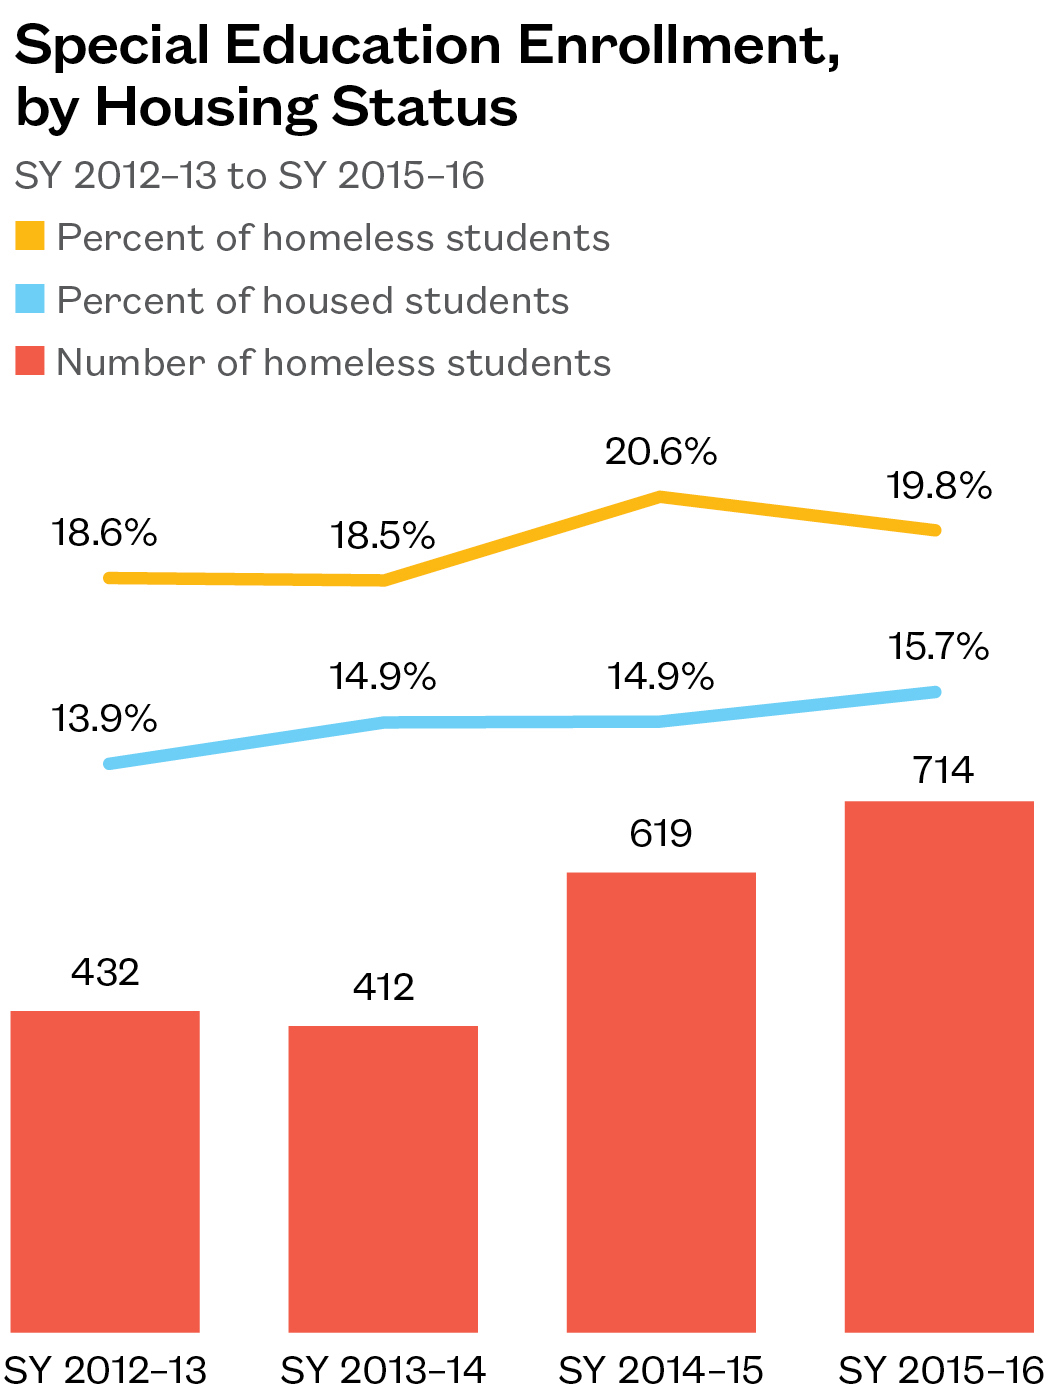
More Homeless Students Are in Special Education
- Close to one in five homeless students received special education services in SY 2015–16. The number of homeless students has increased 65% since SY 2012–13, more than the overall growth in homelessness during that time.
- The age at which a homeless student receives an IEP has been shown to have an effect on later educational achievement. The high mobility of homeless students represents a unique challenge during the IEP identification process.
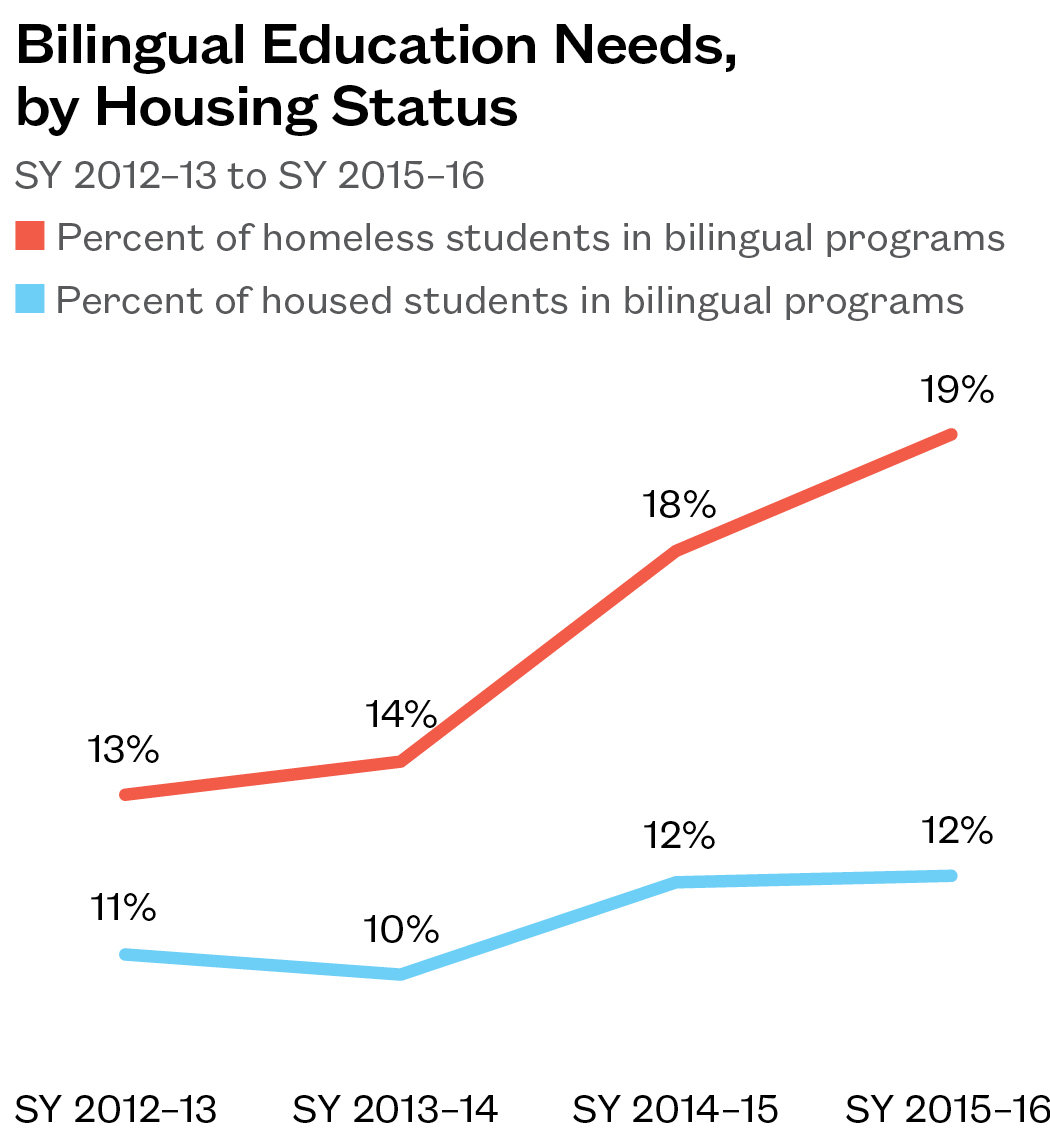
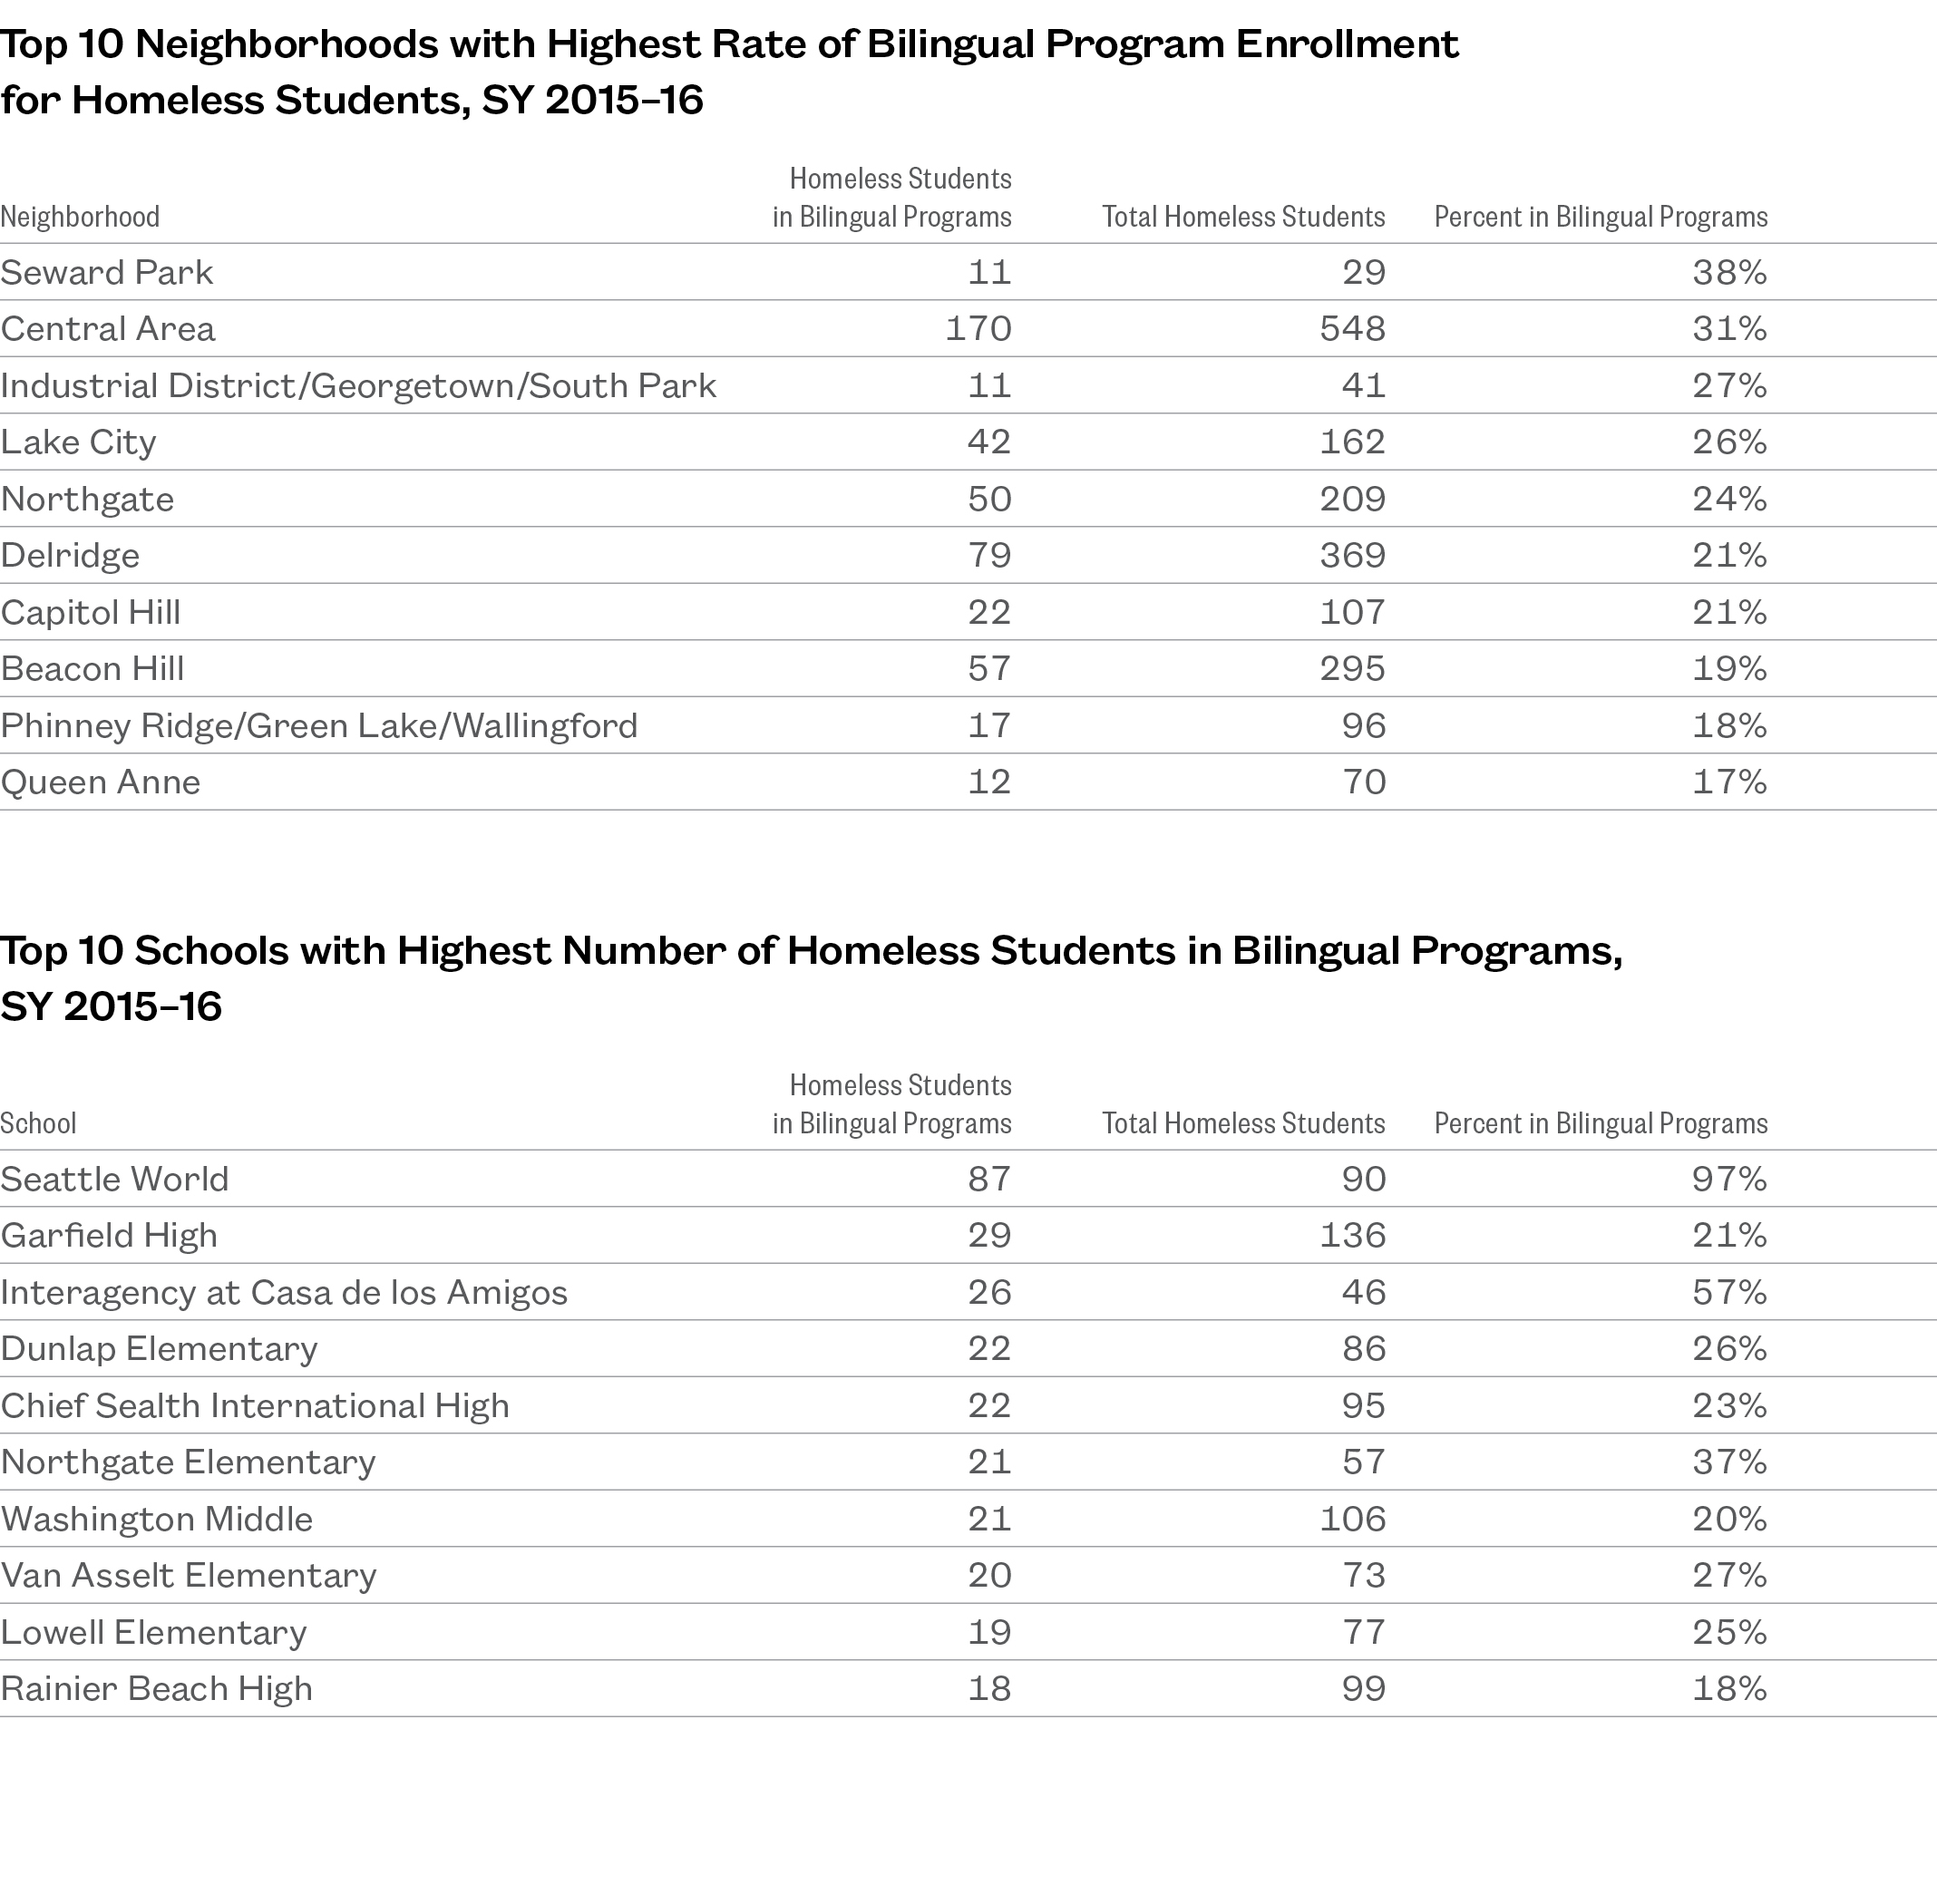
One in Five Homeless Students Is in a Bilingual Program
- Between SY 2012–13 and SY 2015–16, the number of homeless students in bilingual programs more than doubled and represented close to one in five of all students. Over the same period, the number among housed students rose by 17%, to slightly less than one in eight of all students.
- Ten percent of homeless students reported Spanish as their primary language. Somali, Tigrinya, and Amharic were also common among homeless students, with over 100 speakers each.
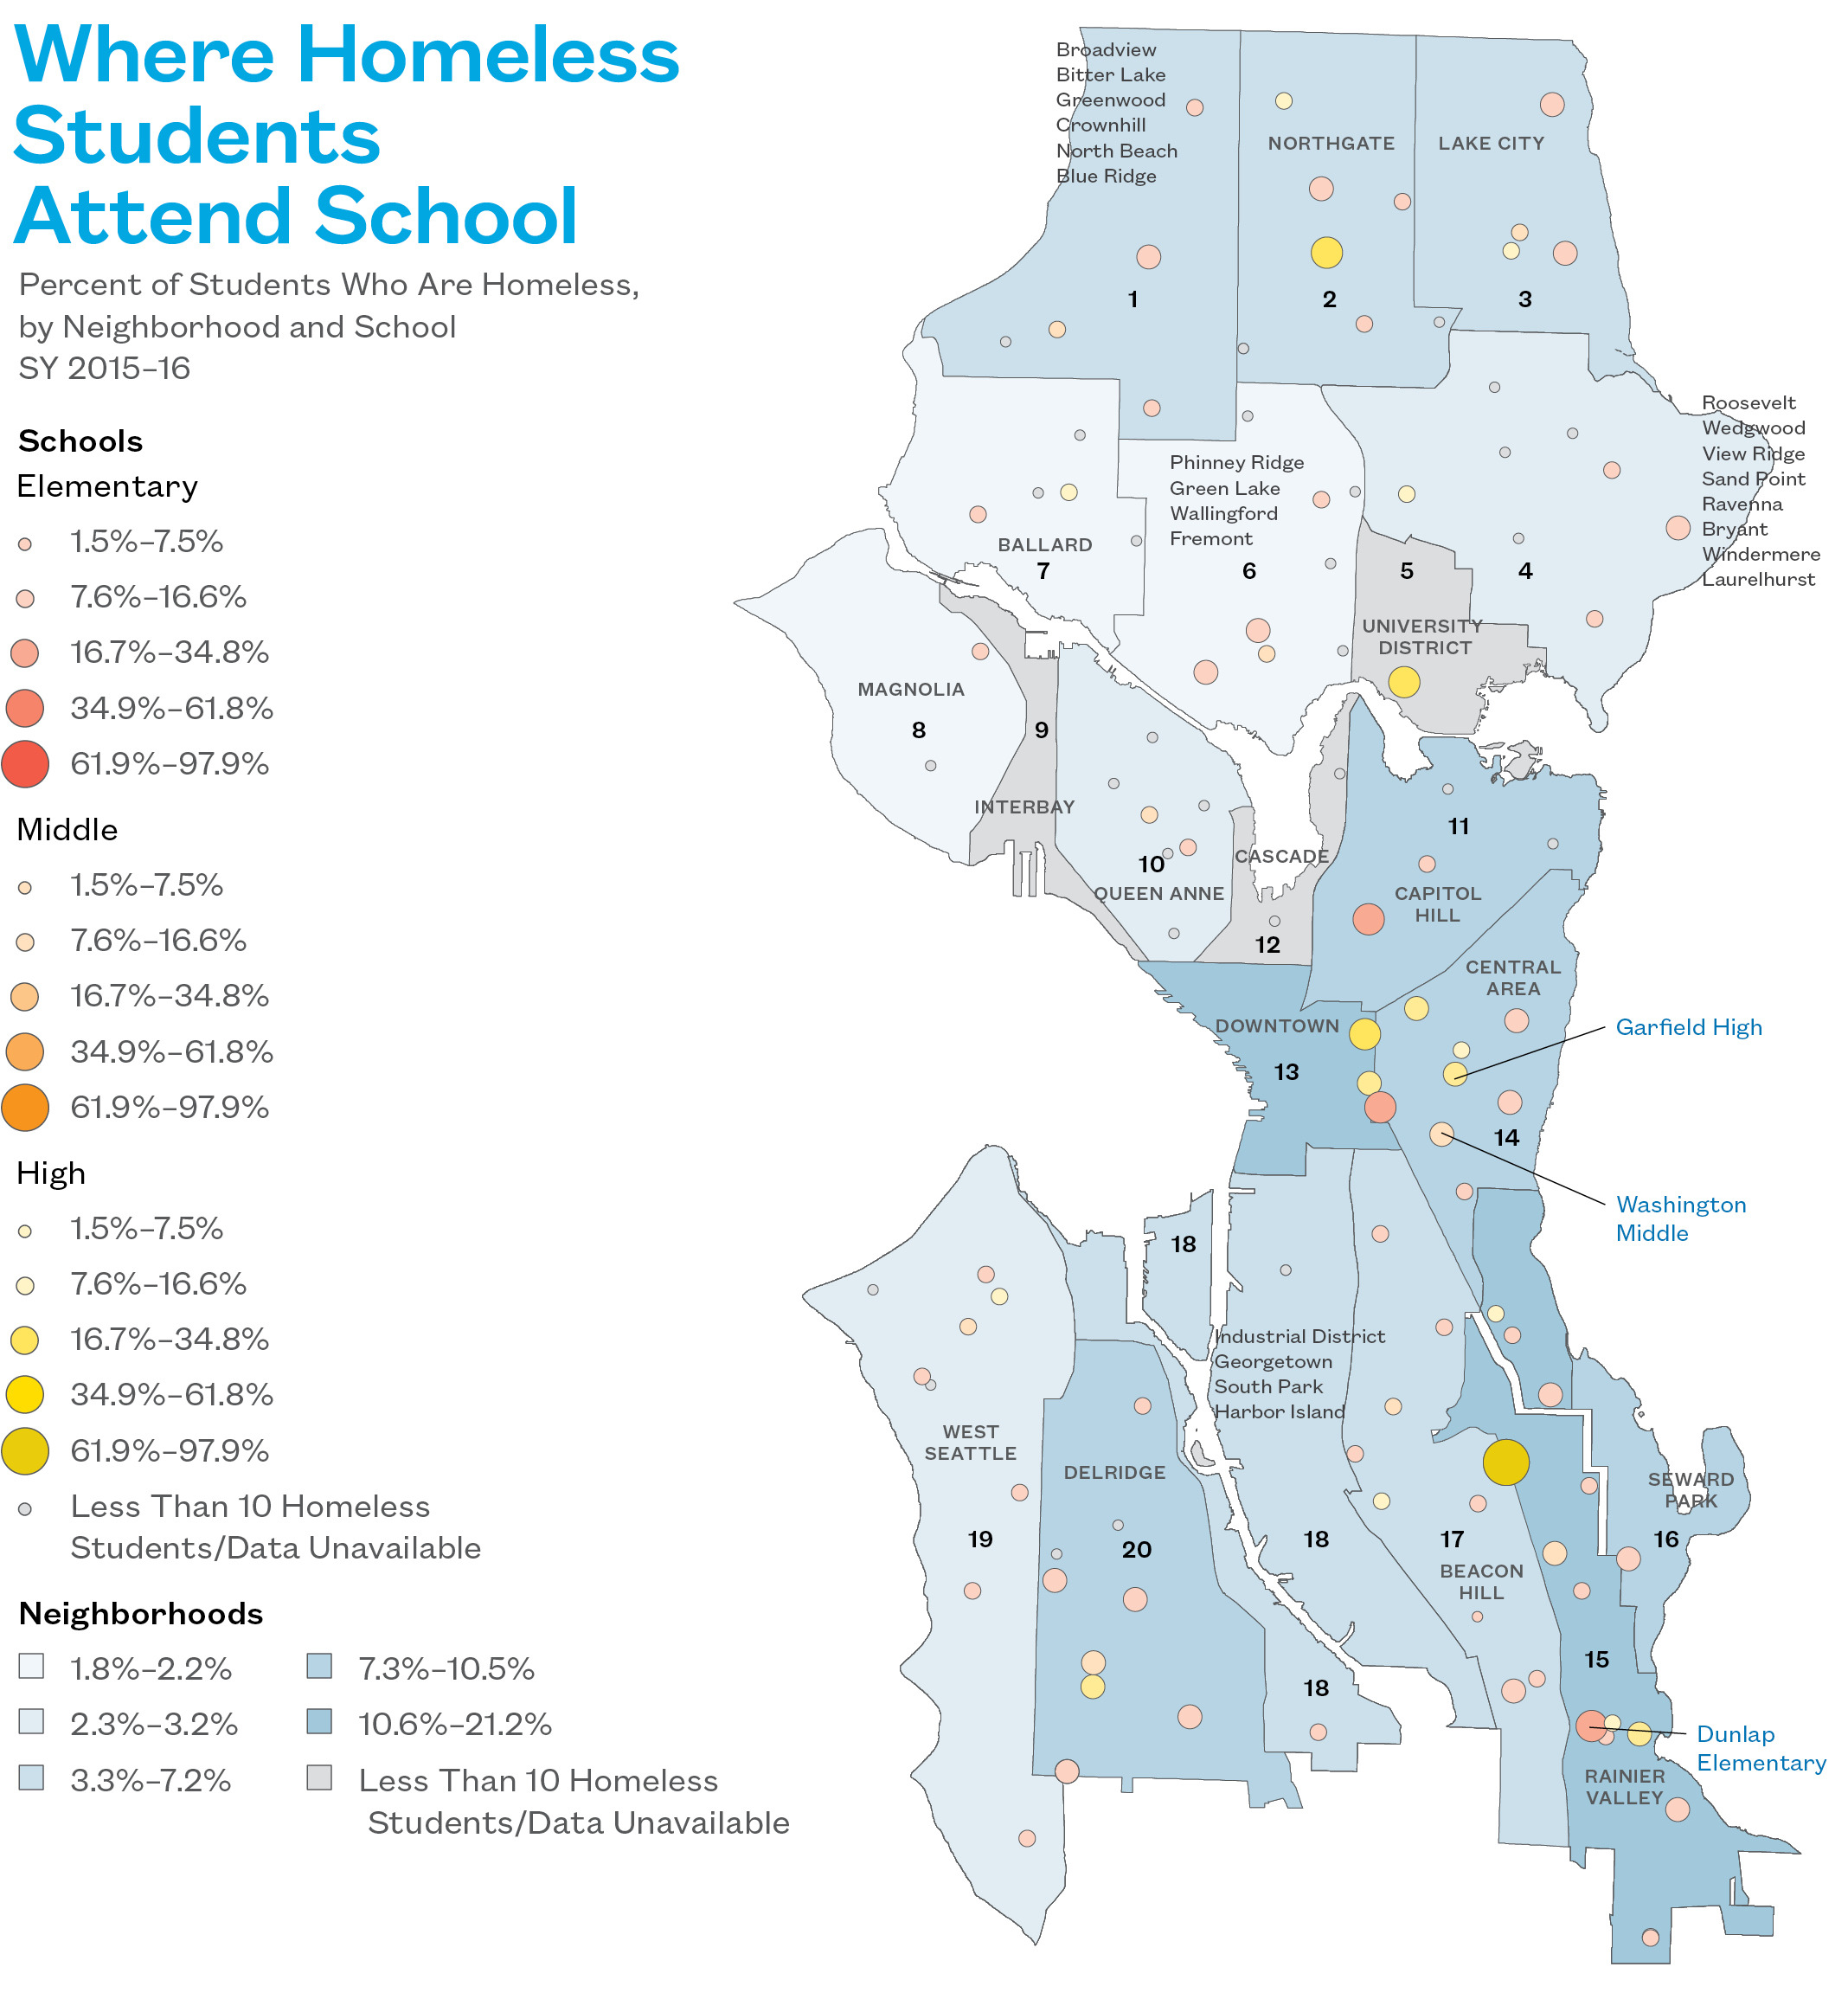
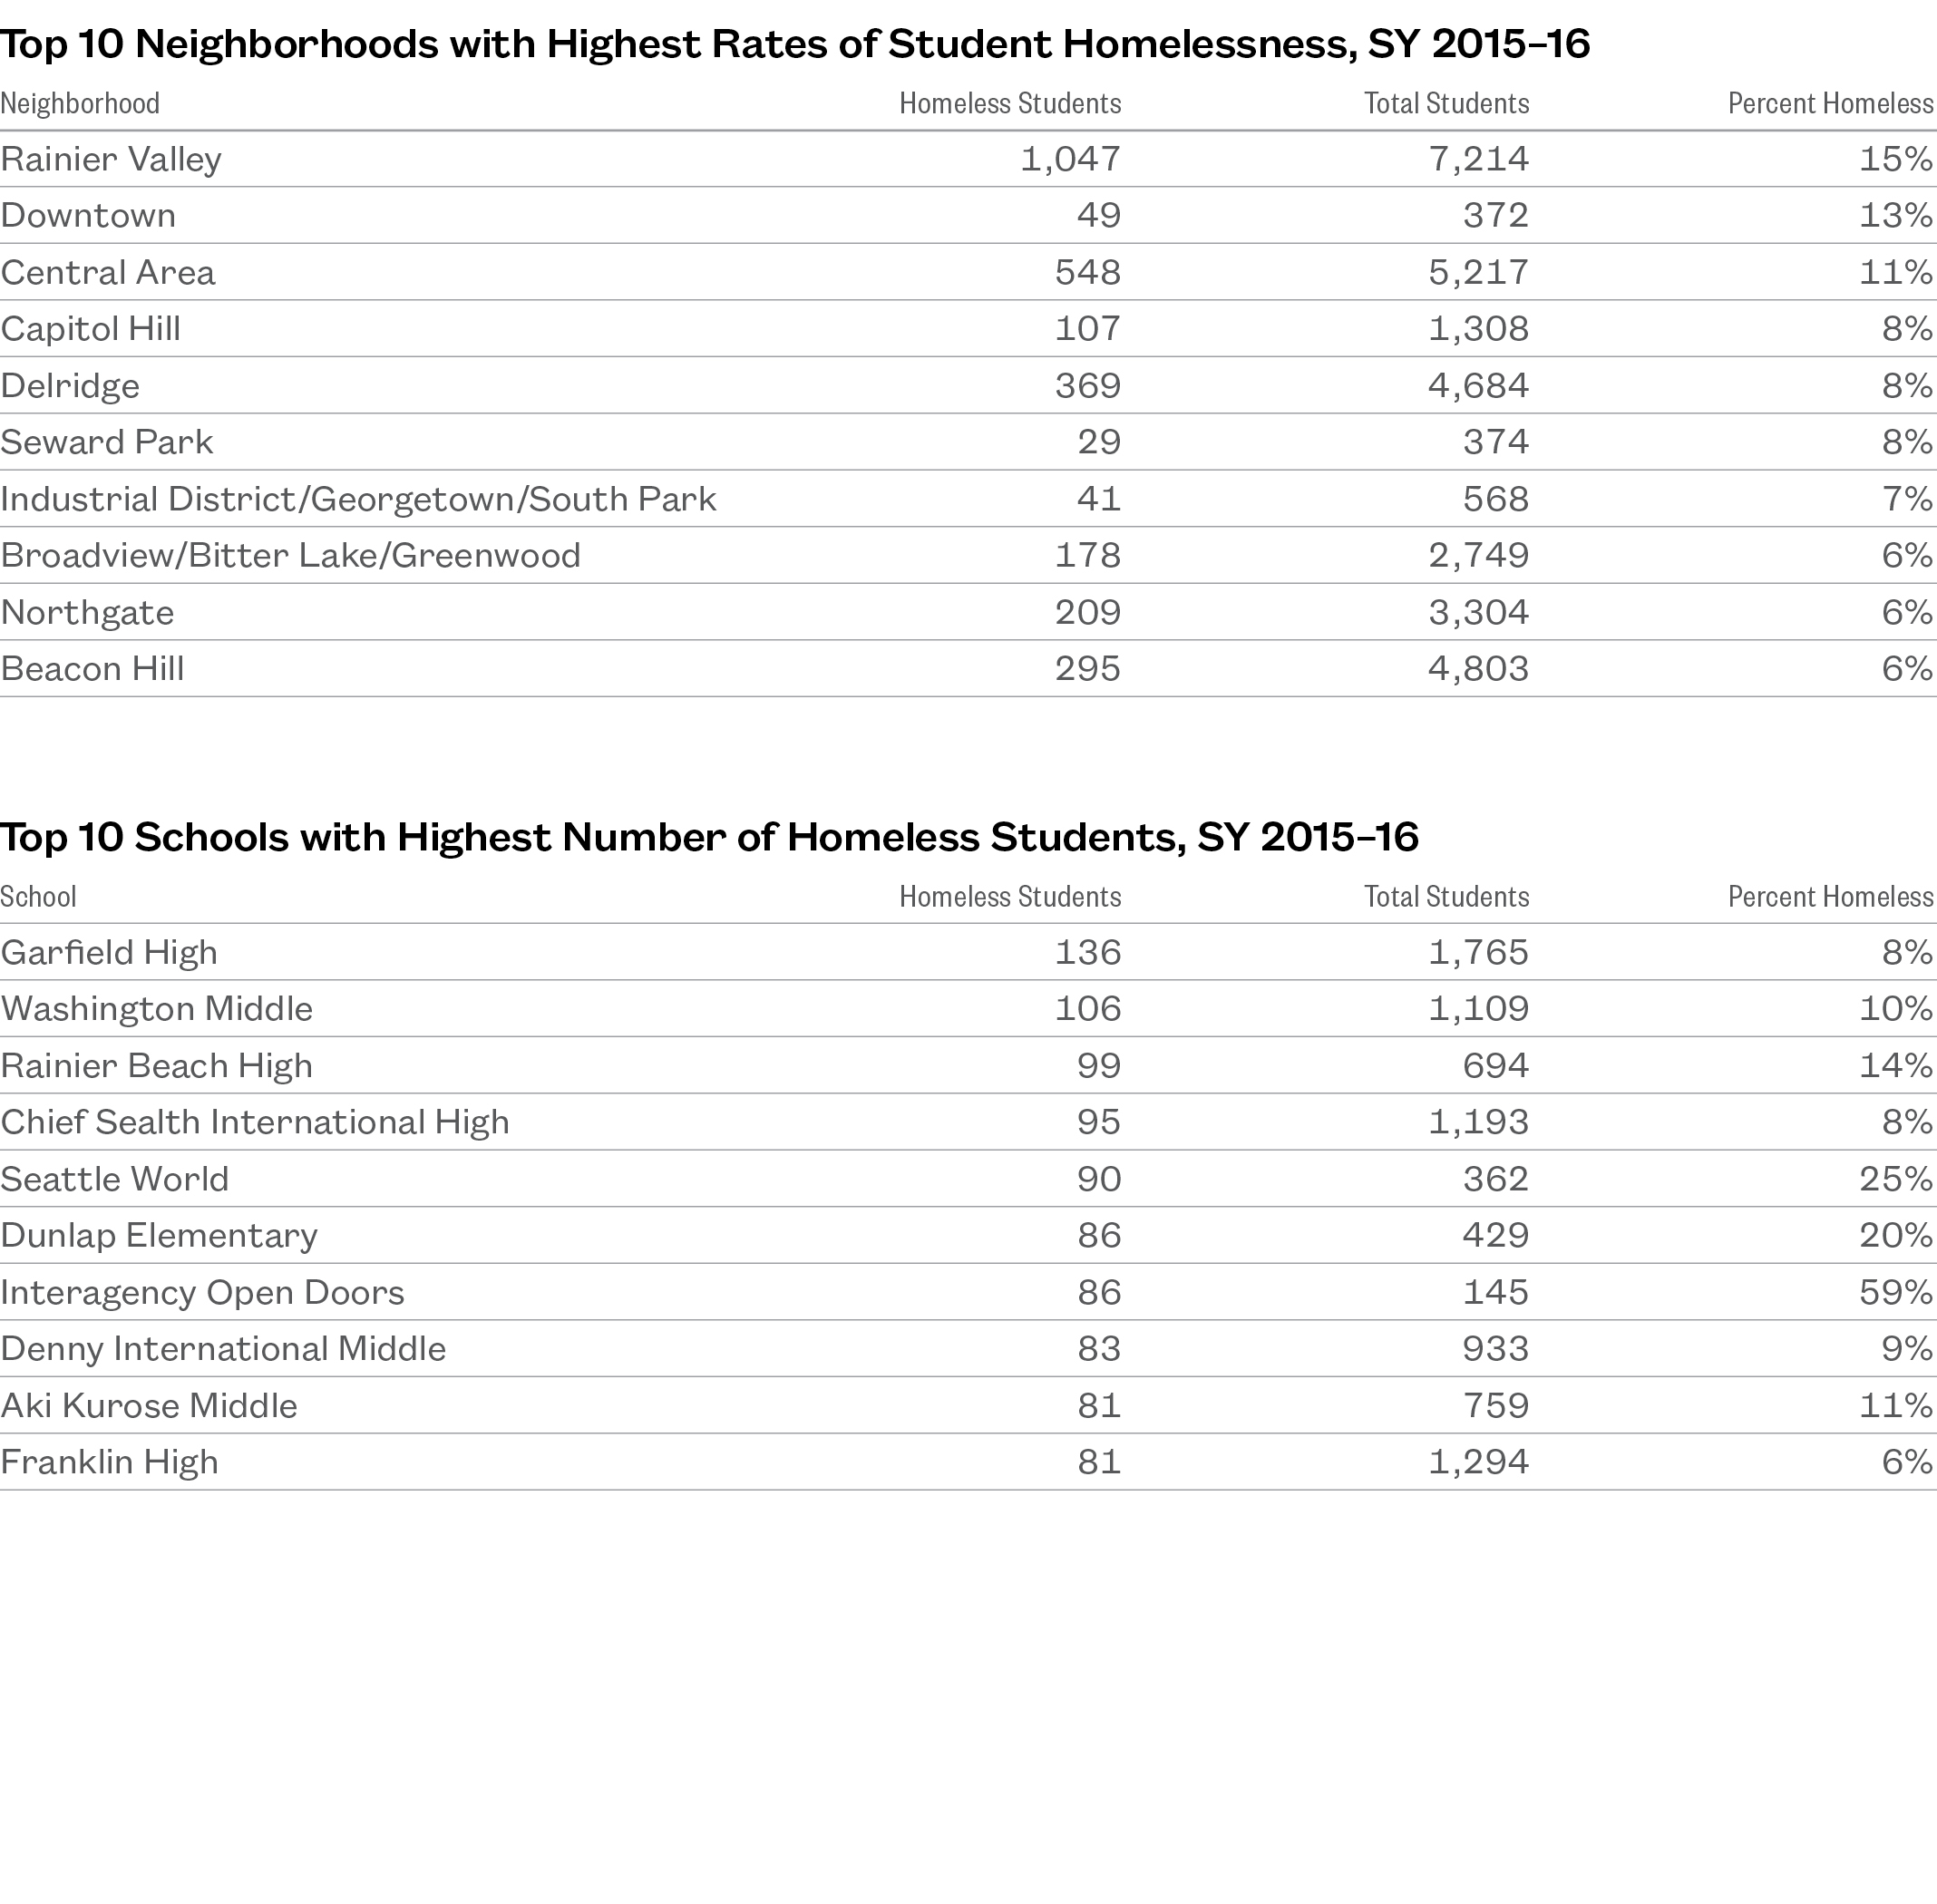
- Rainier Valley, Downtown, and the Central Area neighborhoods had the highest rates of student homelessness.
- Rainier Valley and the Central Area had the highest raw numbers of homeless students, with 1,047 and 548 respectively.
- Garfield High had the most homeless students, with 136. Among elementary and middle schools, Dunlap Elementary and Washington Middle had the most homeless students, with 86 and 106, respectively.
See Methodology section for full explanation of neighborhood boundaries and names.
Where Homeless Students Attend School
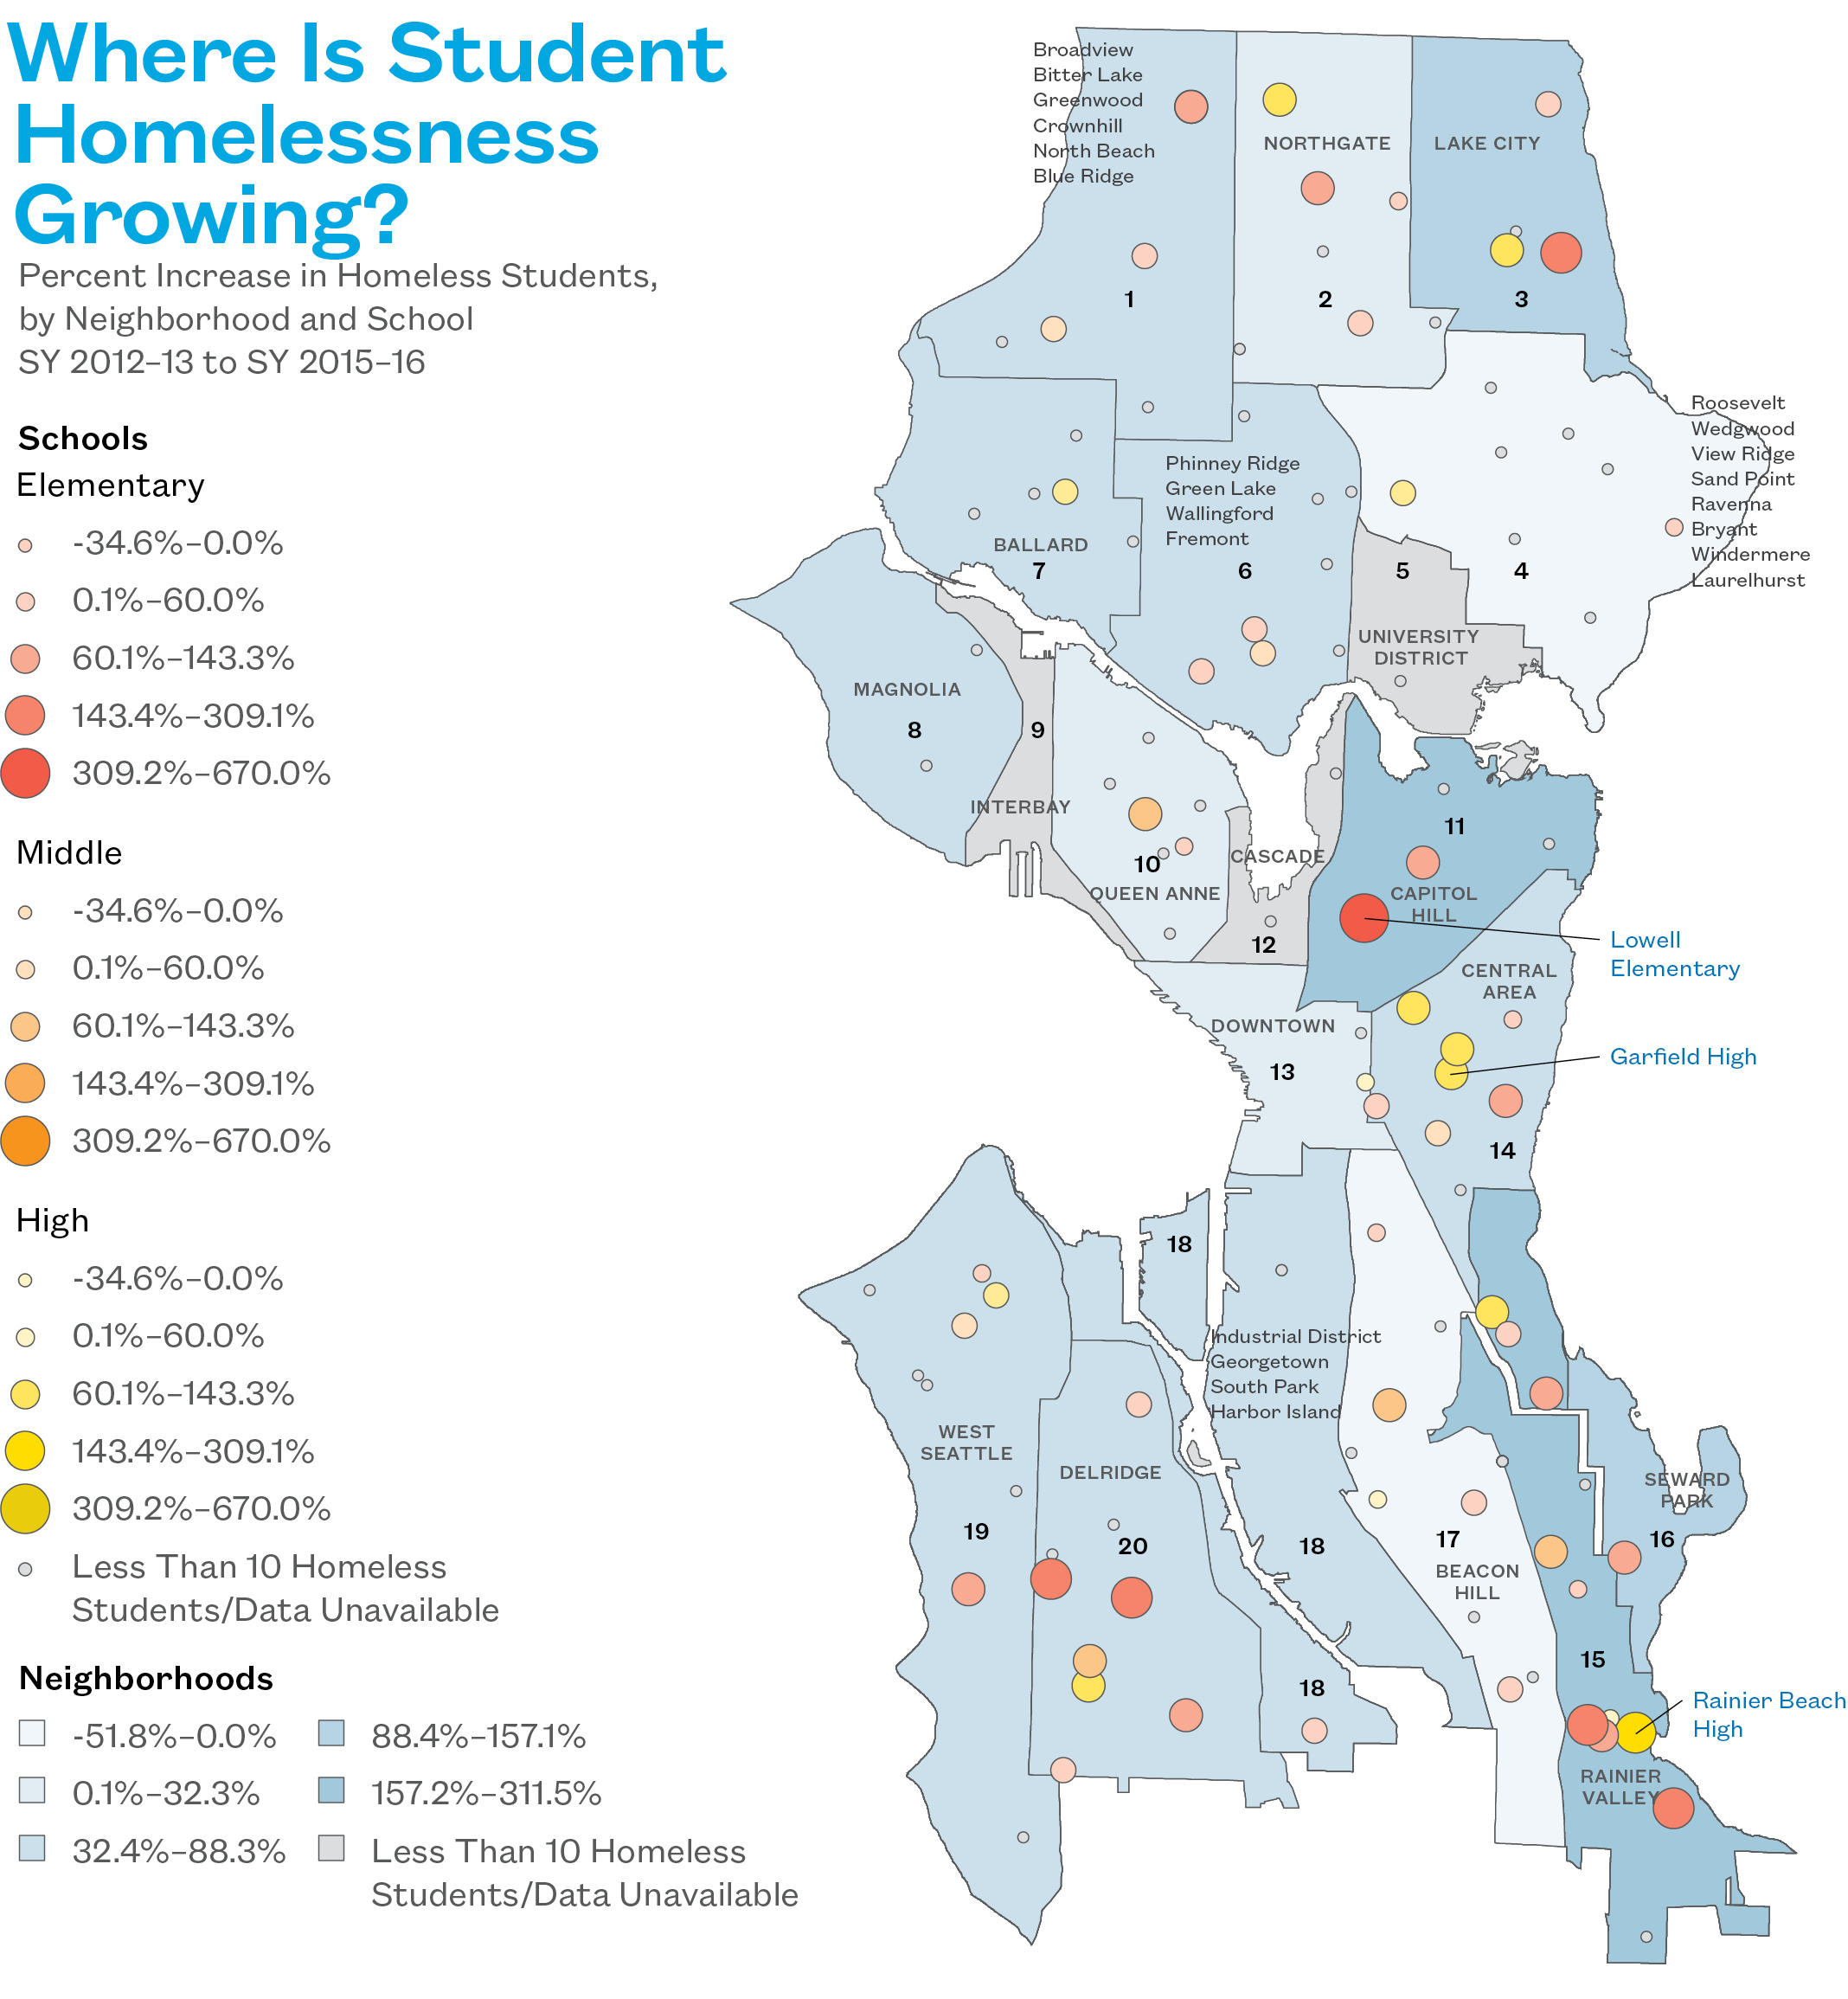
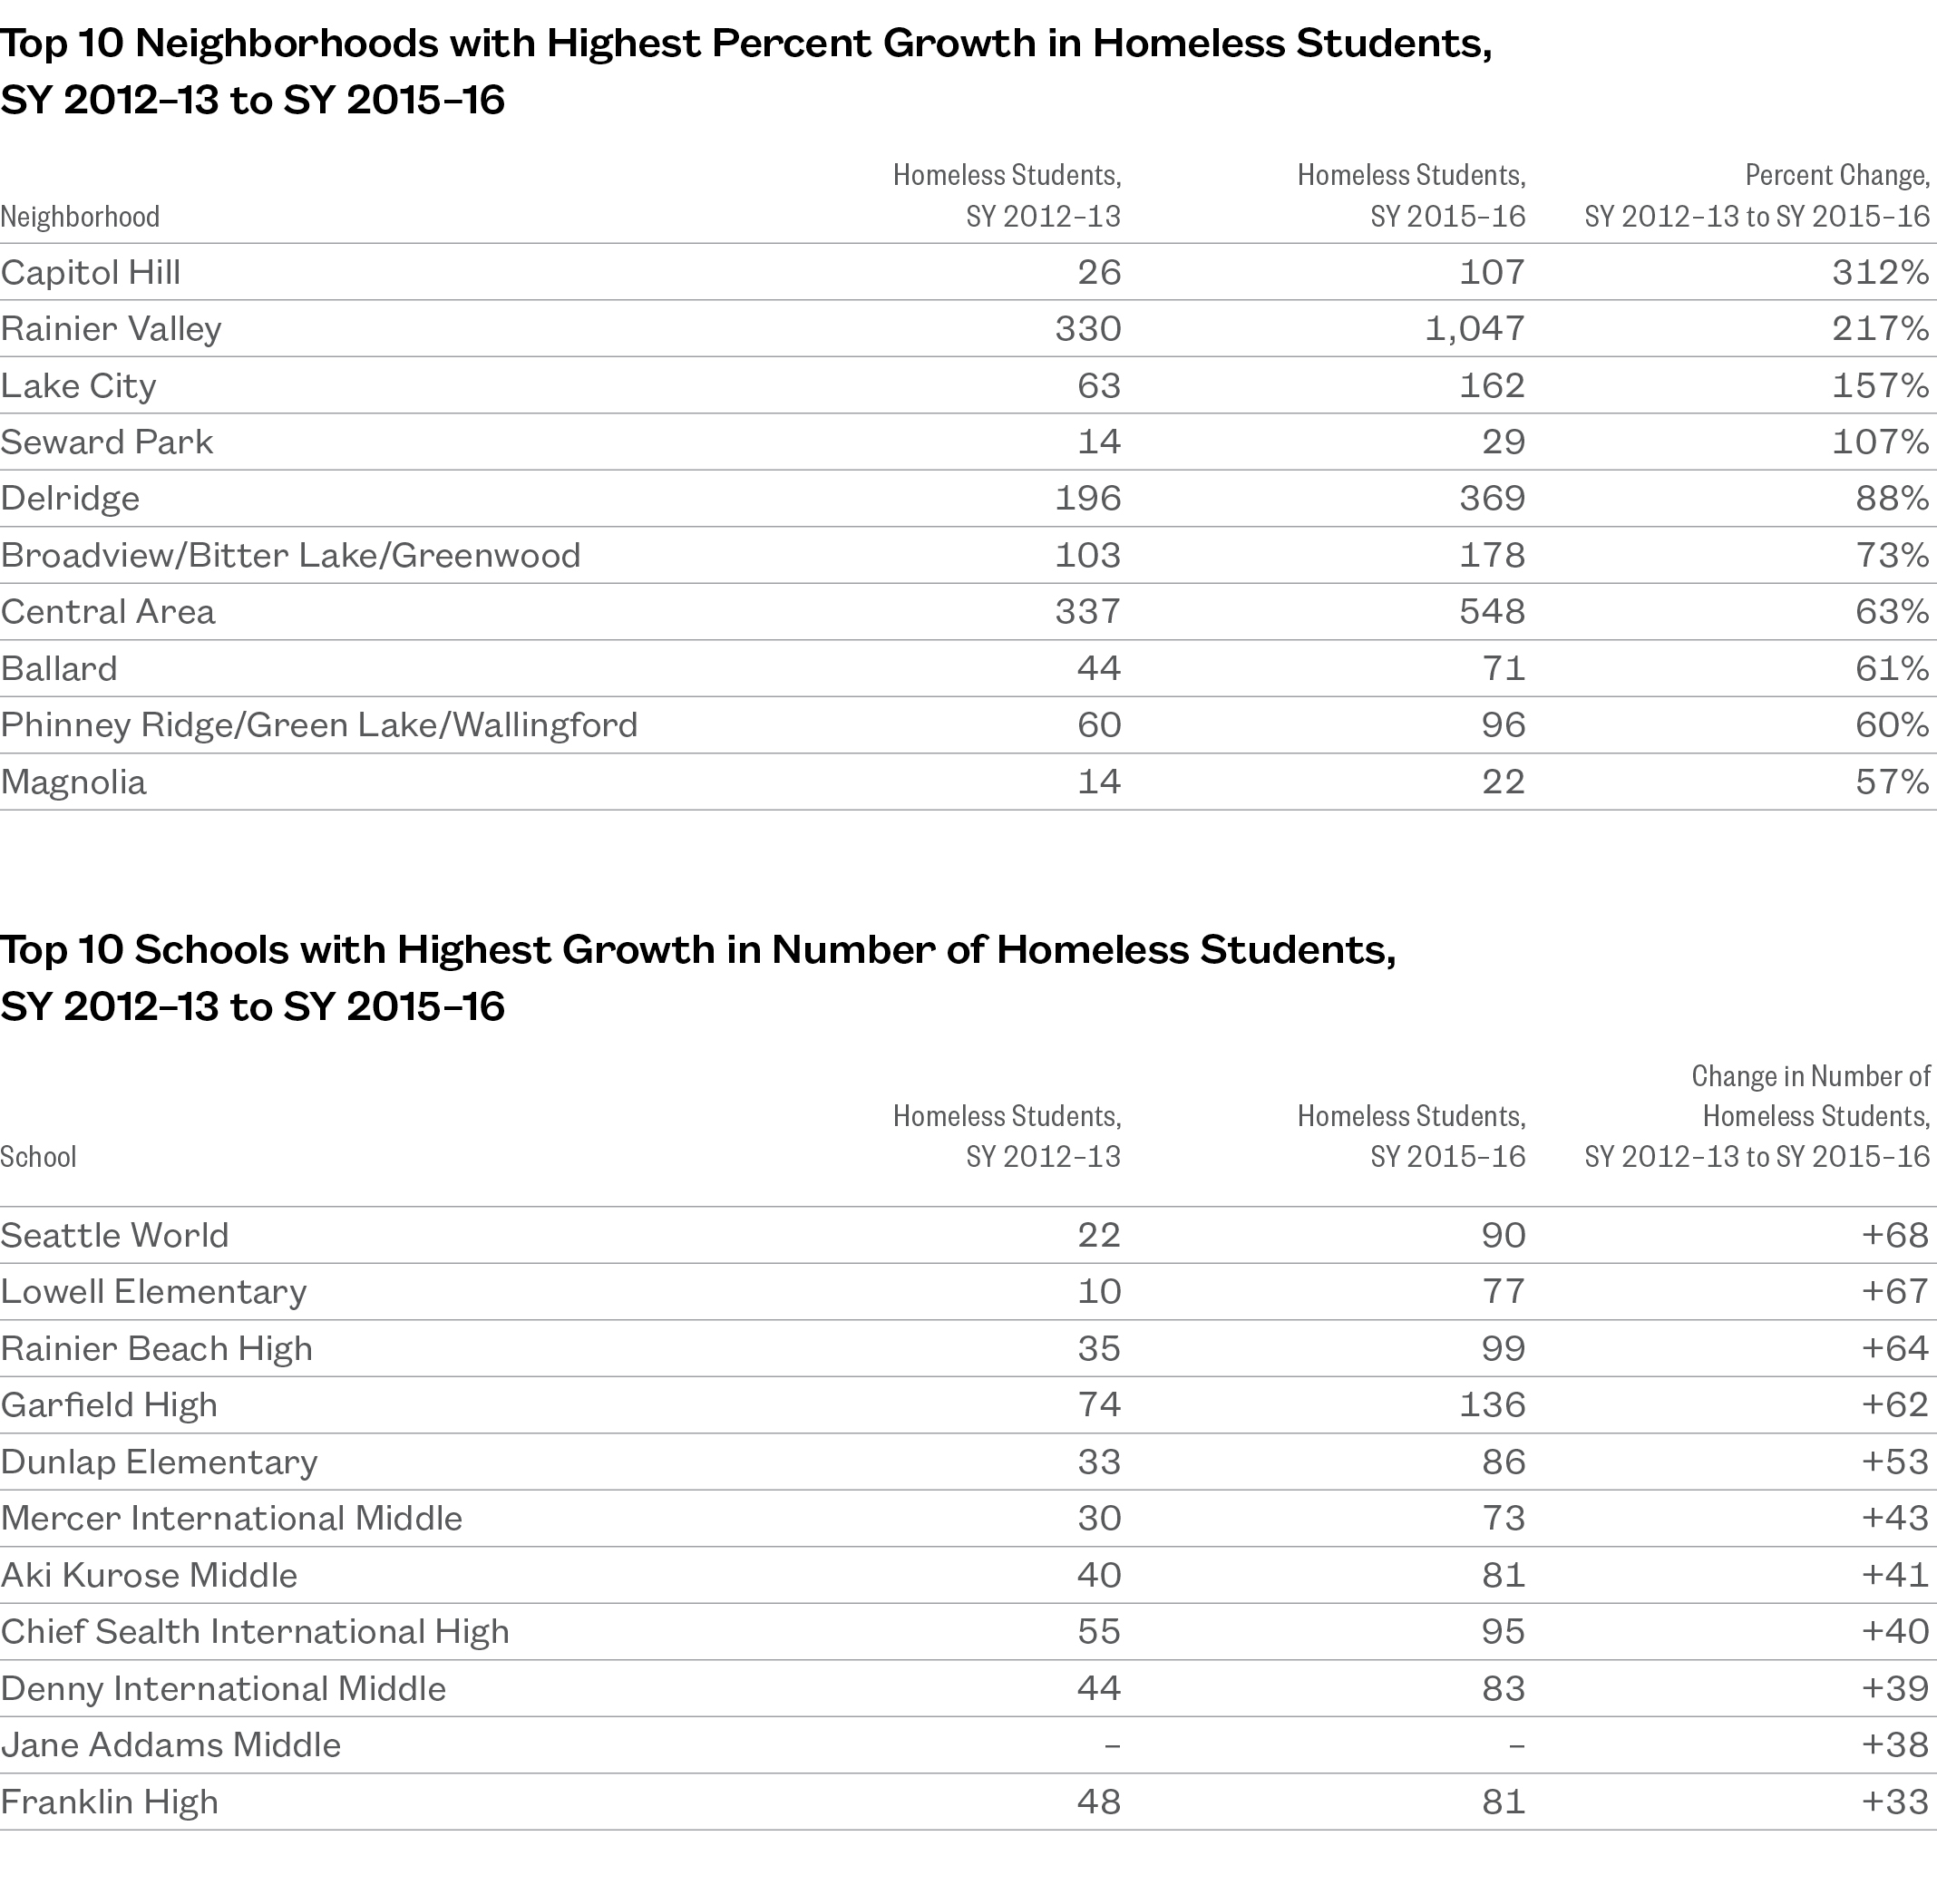
- Since SY 2012–13, Capitol Hill and Rainier Valley saw homelessness grow the most, with percent increases of 312% and 217%, respectively. Beacon Hill was the only area with a decline in student homelessness.
- Among mainstream schools, Lowell Elementary, Rainier Beach High, and Garfield High had the highest increases in homelessness, with each having 60 more homeless students in SY 2015–16 than in SY 2012–13. Lowell Elementary is the assigned school for students in downtown shelters.
Where Is Student Homelessness Growing?
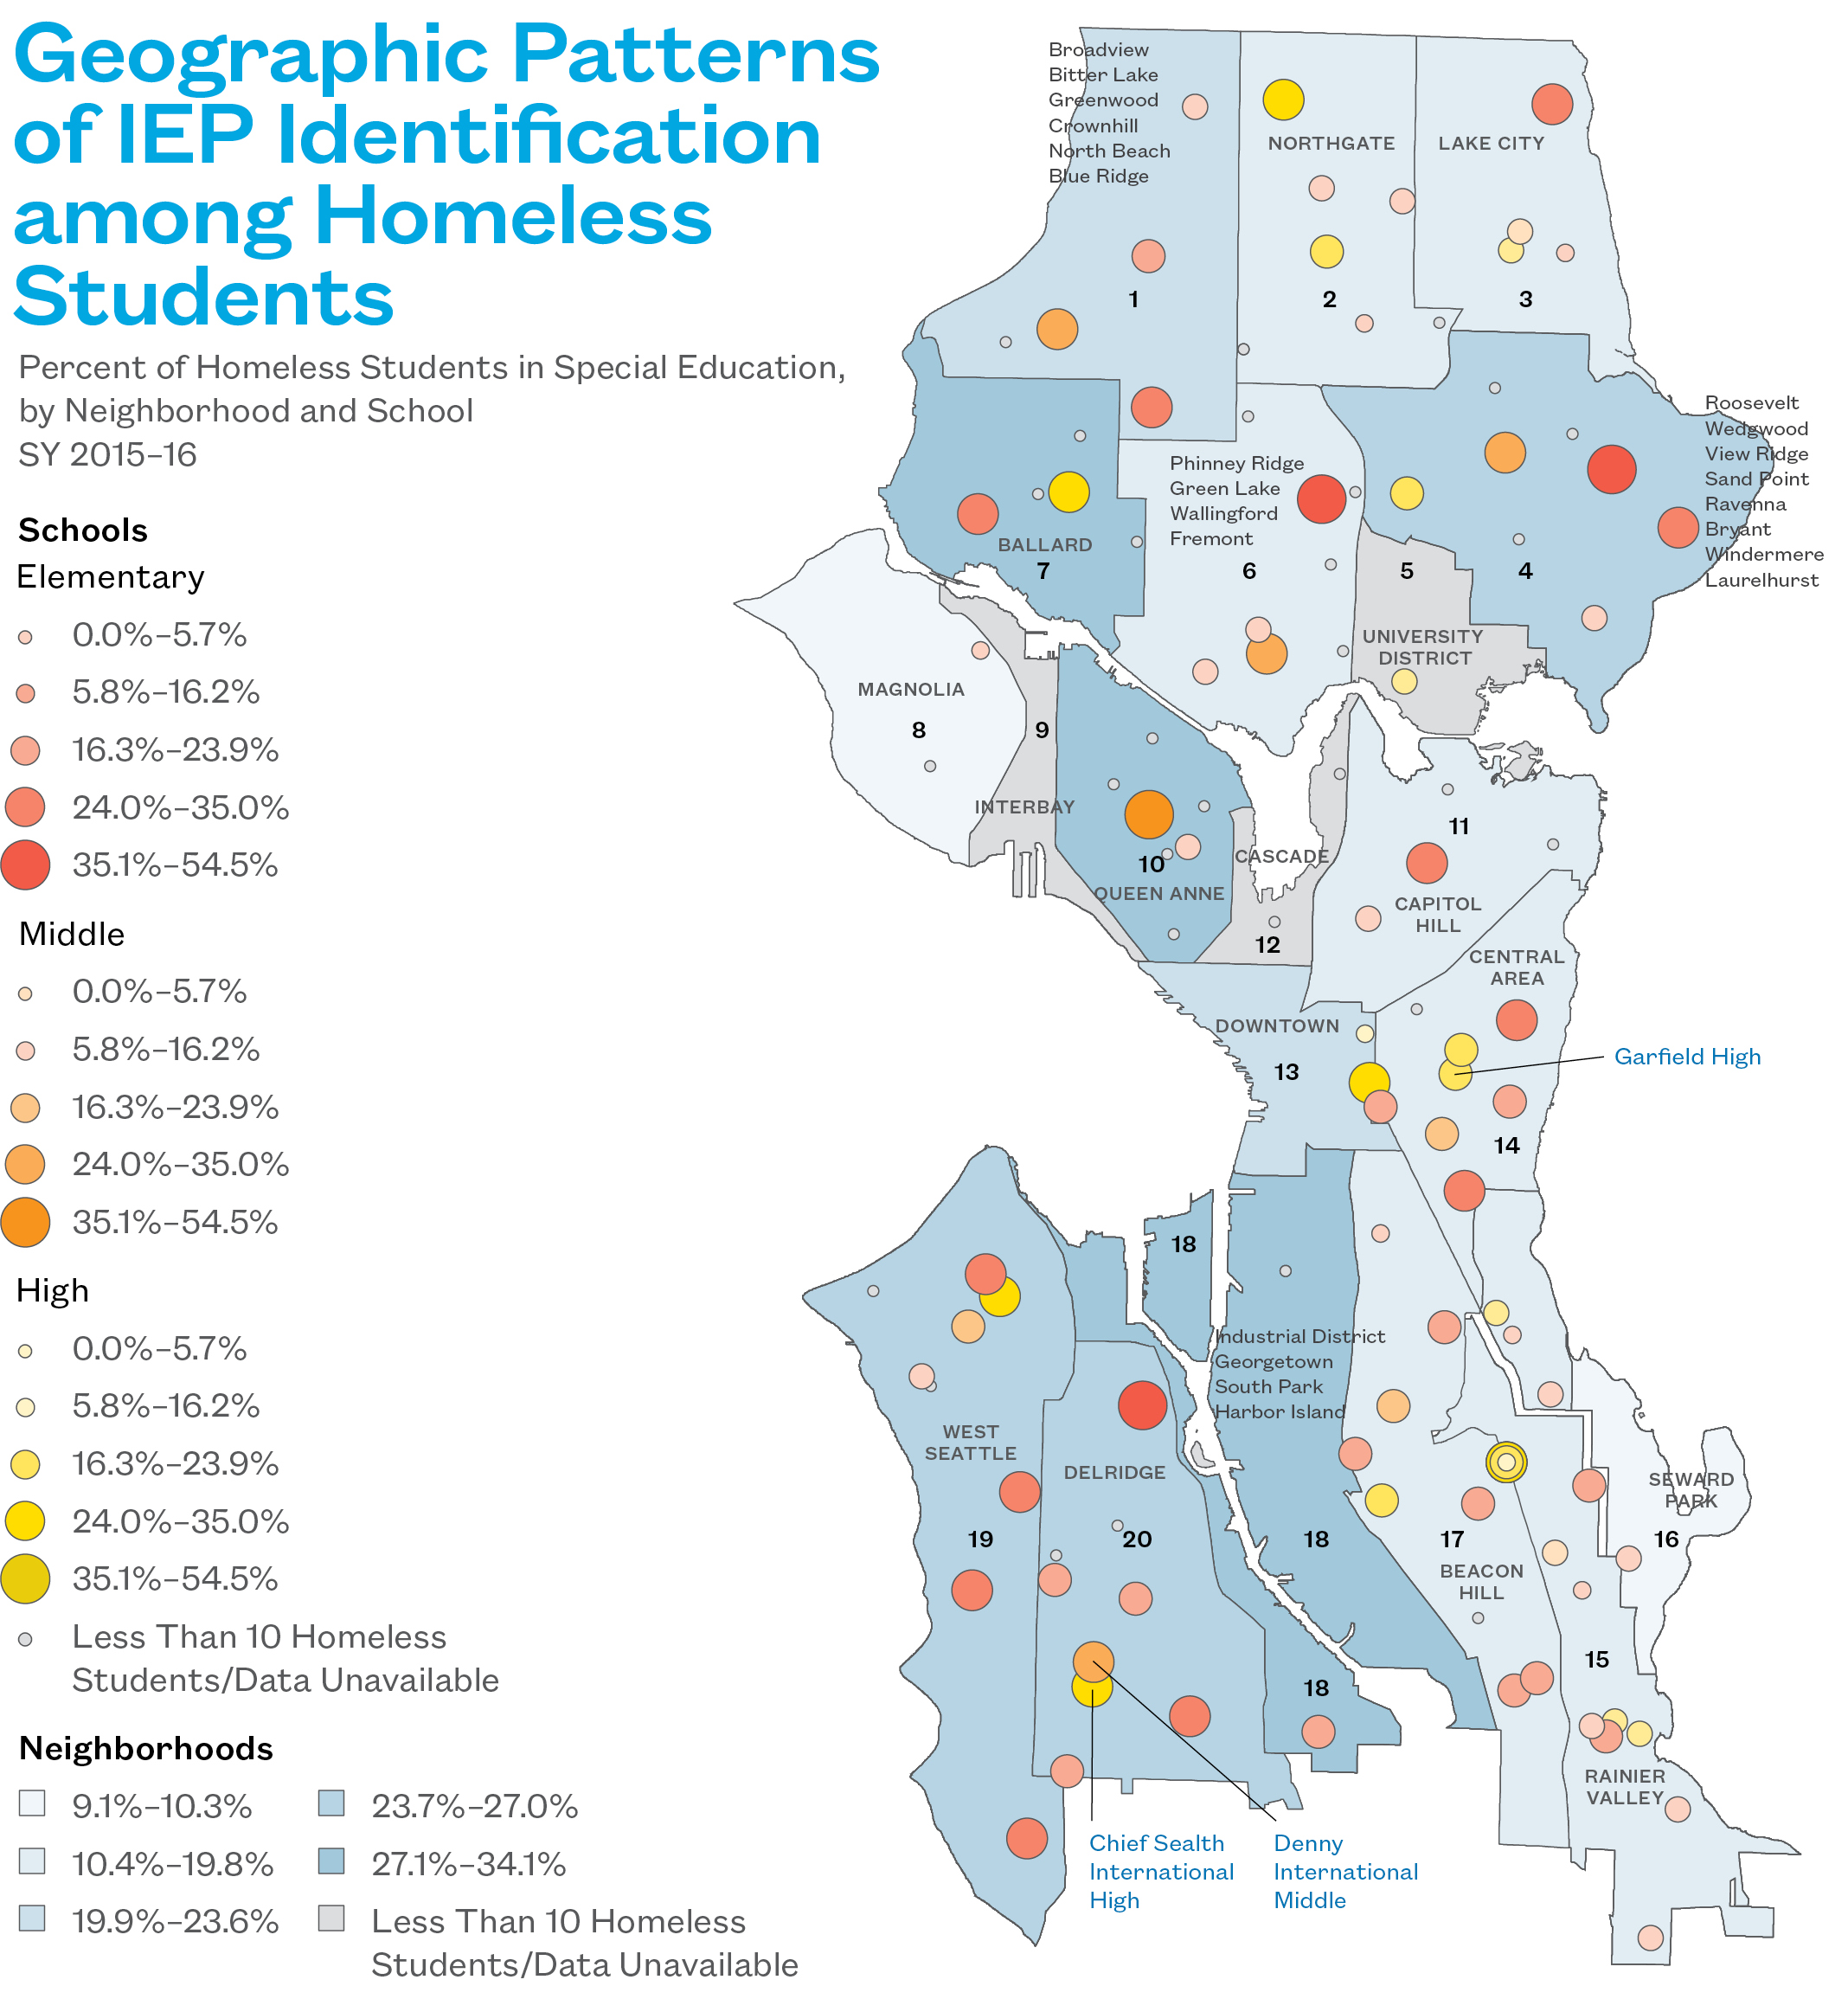
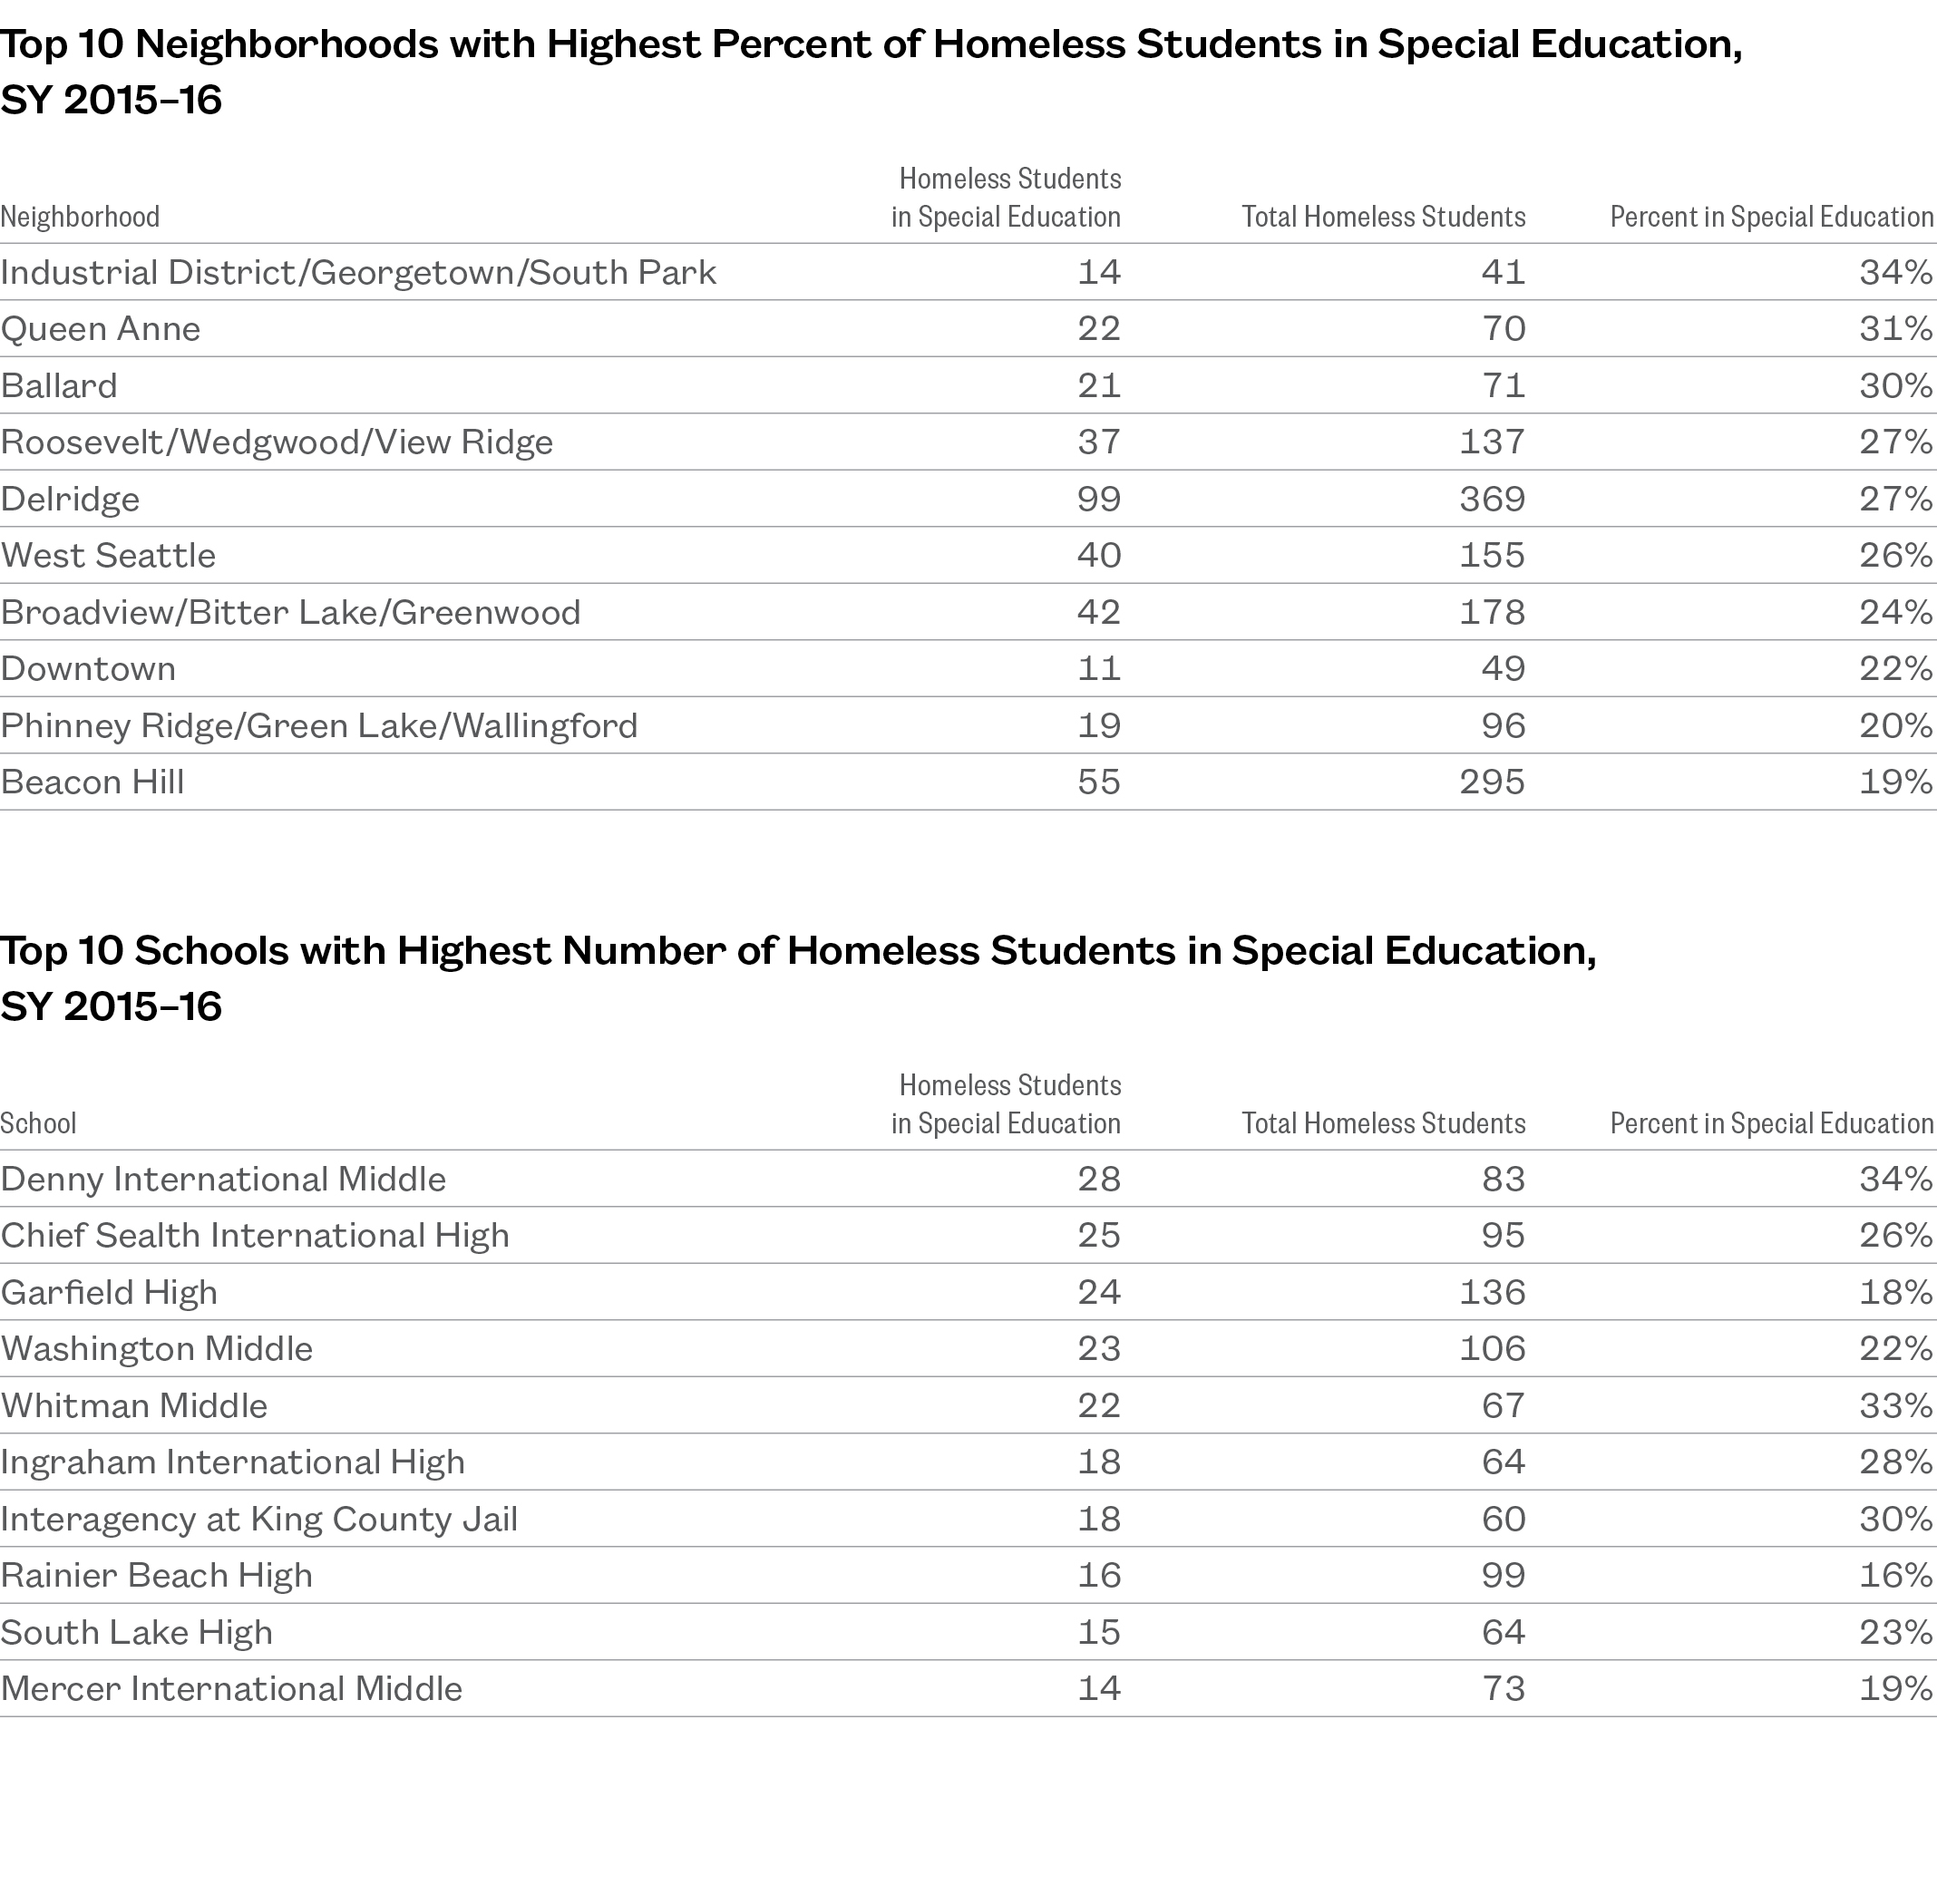
- The Industrial District/ Georgetown area, Queen Anne, and Ballard had 30% or more of their homeless students in special education.
- Rainier Valley and Lake City had the lowest rates, at 15% and 17%, respectively.
- Denny International Middle, Chief Sealth International High, and Garfield High had the highest number of homeless students in special education.
Geographic Patterns of IEP Identification among Homeless Students
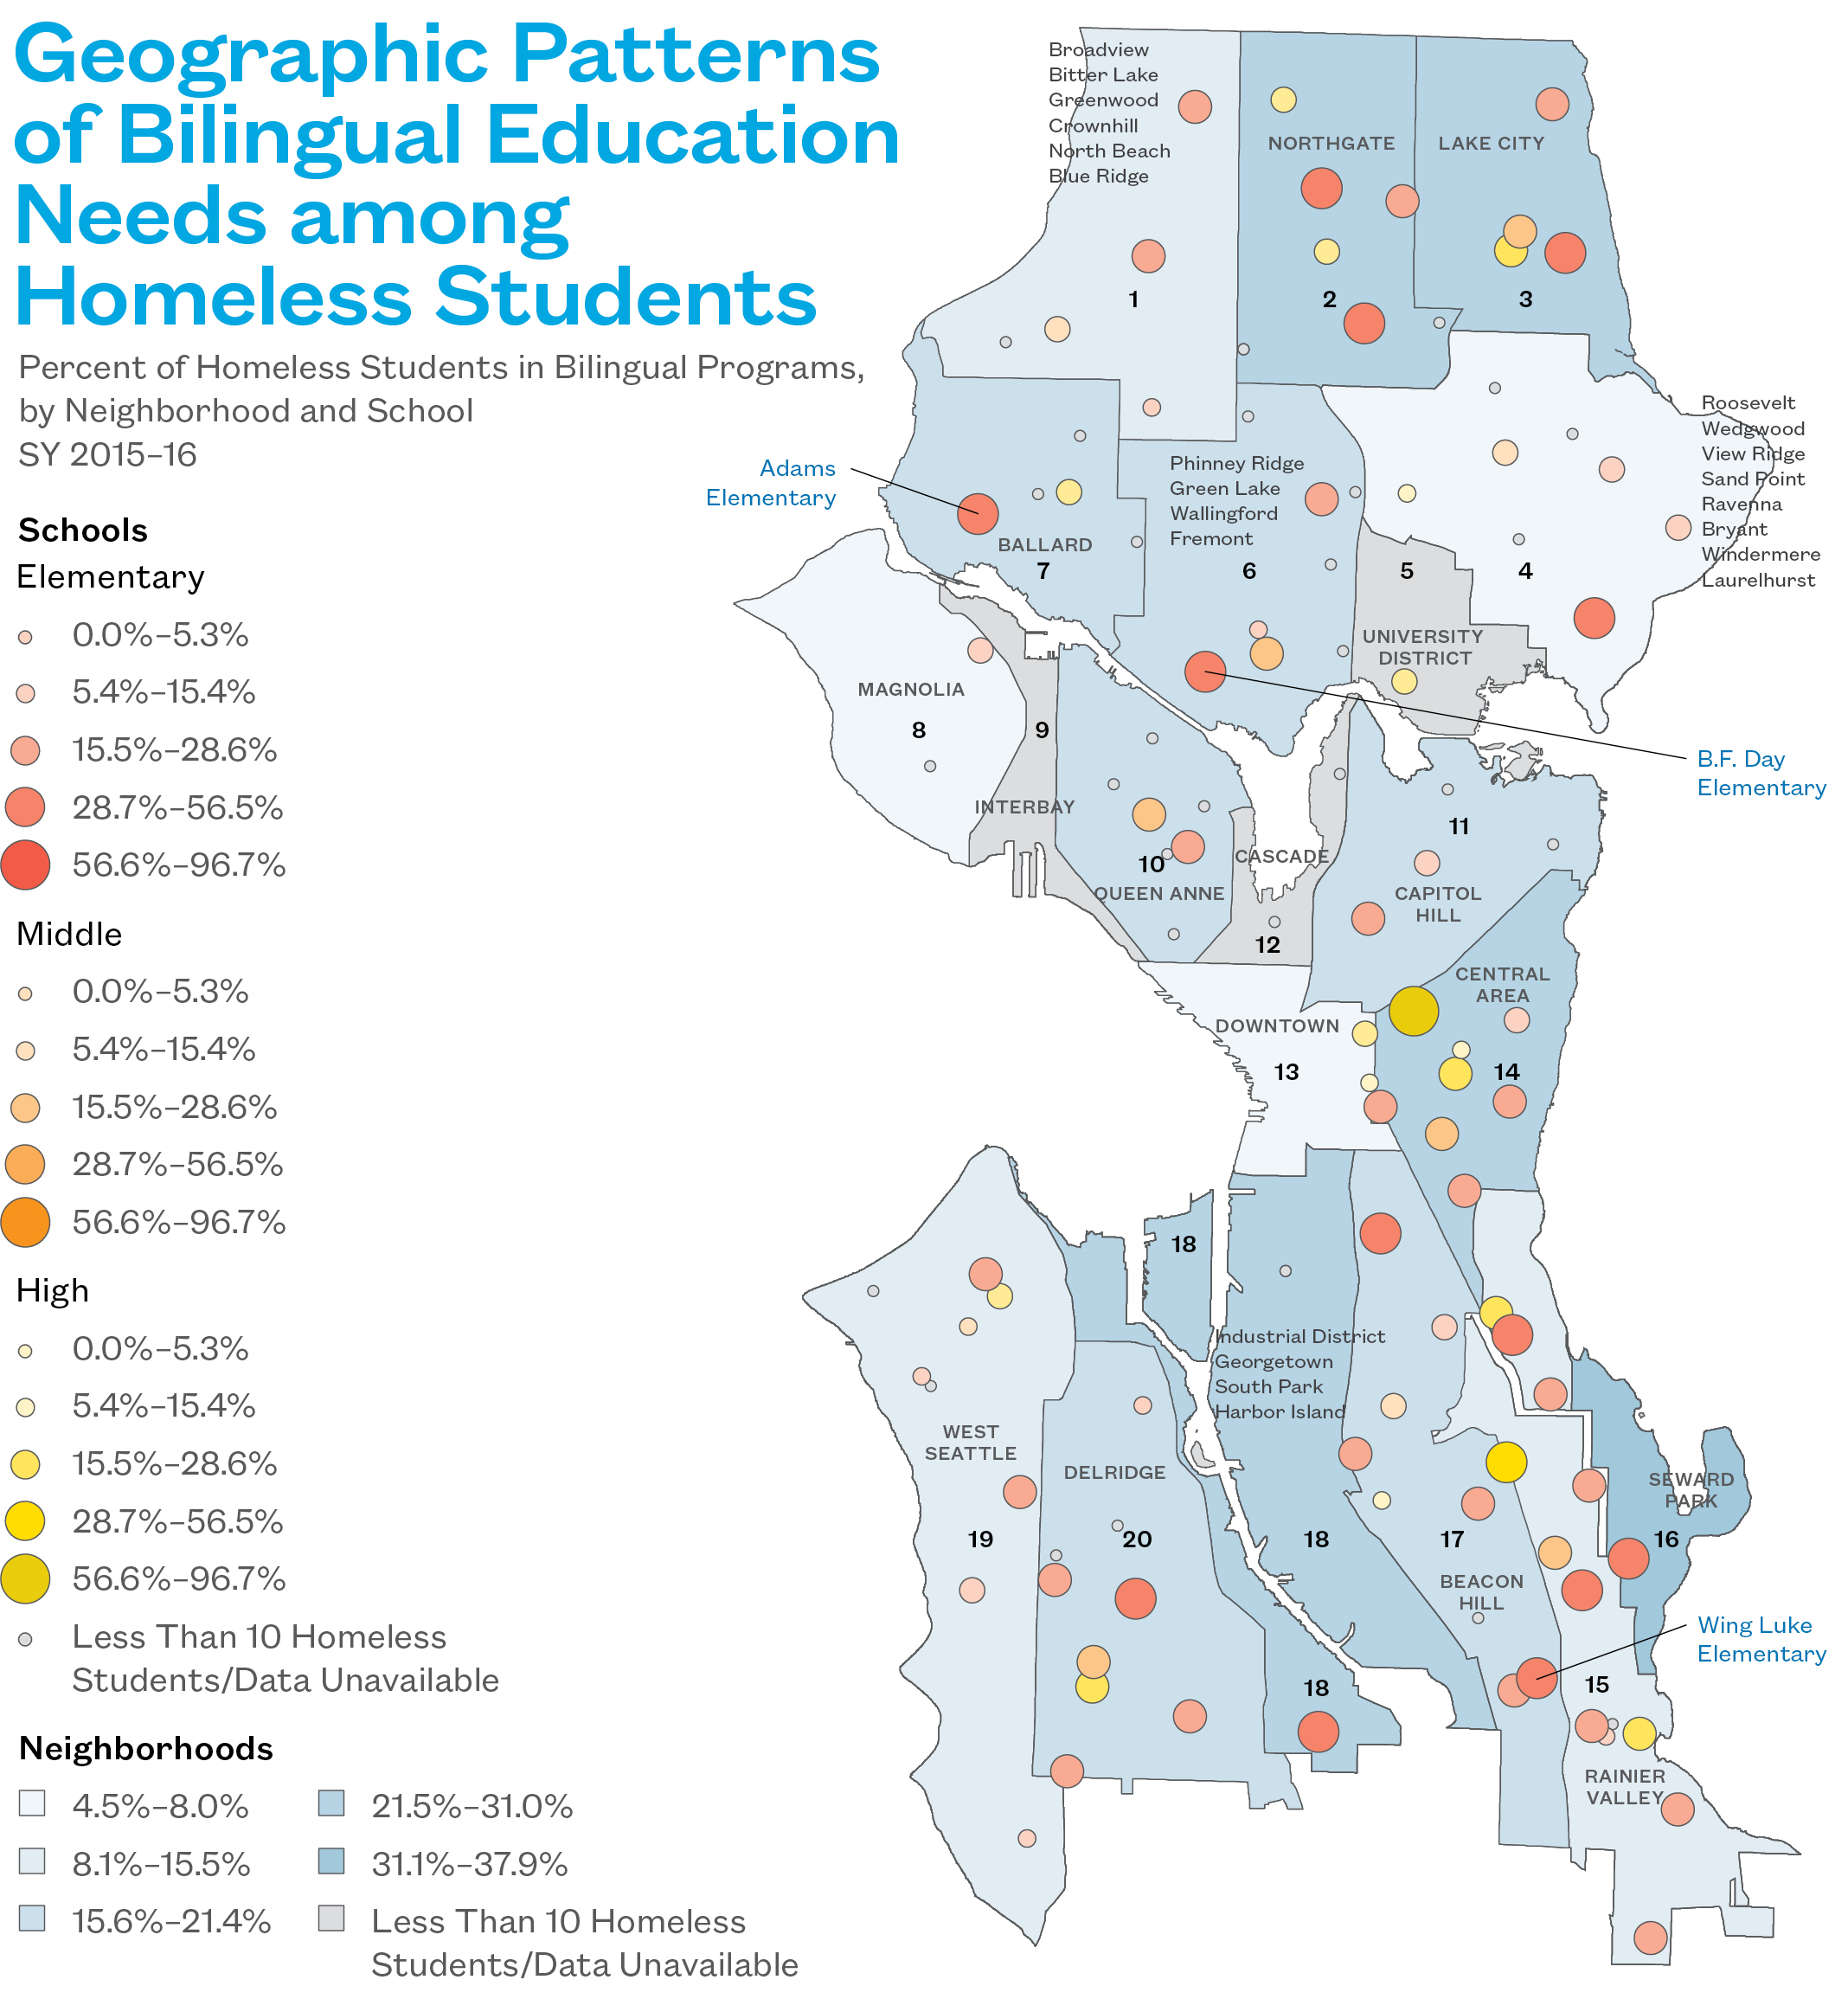
- In both Seward Park and the Central Area, over 30% of homeless students had bilingual education needs.
- Among mainstream schools, Adams Elementary, B.F. Day Elementary, and Wing Luke Elementary had the highest rates of bilingual needs among homeless students.
Geographic Patterns of Bilingual Education Needs among Homeless Students
Section 2
Challenges for Homeless Students’ Academic Stability
For homeless children, school is an important source of stability. Unfortunately, homelessness itself can undermine a student’s ability to attend school regularly, often leading to chronic absenteeism (missing over 10% of the school year) or midyear transfers as temporary living situations change. When homeless students miss classroom time, they fall further behind their classmates and become more likely to repeat grades and struggle academically in later years. Mid-year transfers have a similar destabilizing effect, depriving students of the teachers and classmates they are familiar with and setting them back academically by as much as six months. In this section, the relationships between homelessness, absenteeism, and school transfers are explored: how the specifics of a child’s housing instability can influence their risk, and how those risks can reinforce each other.
Key Findings
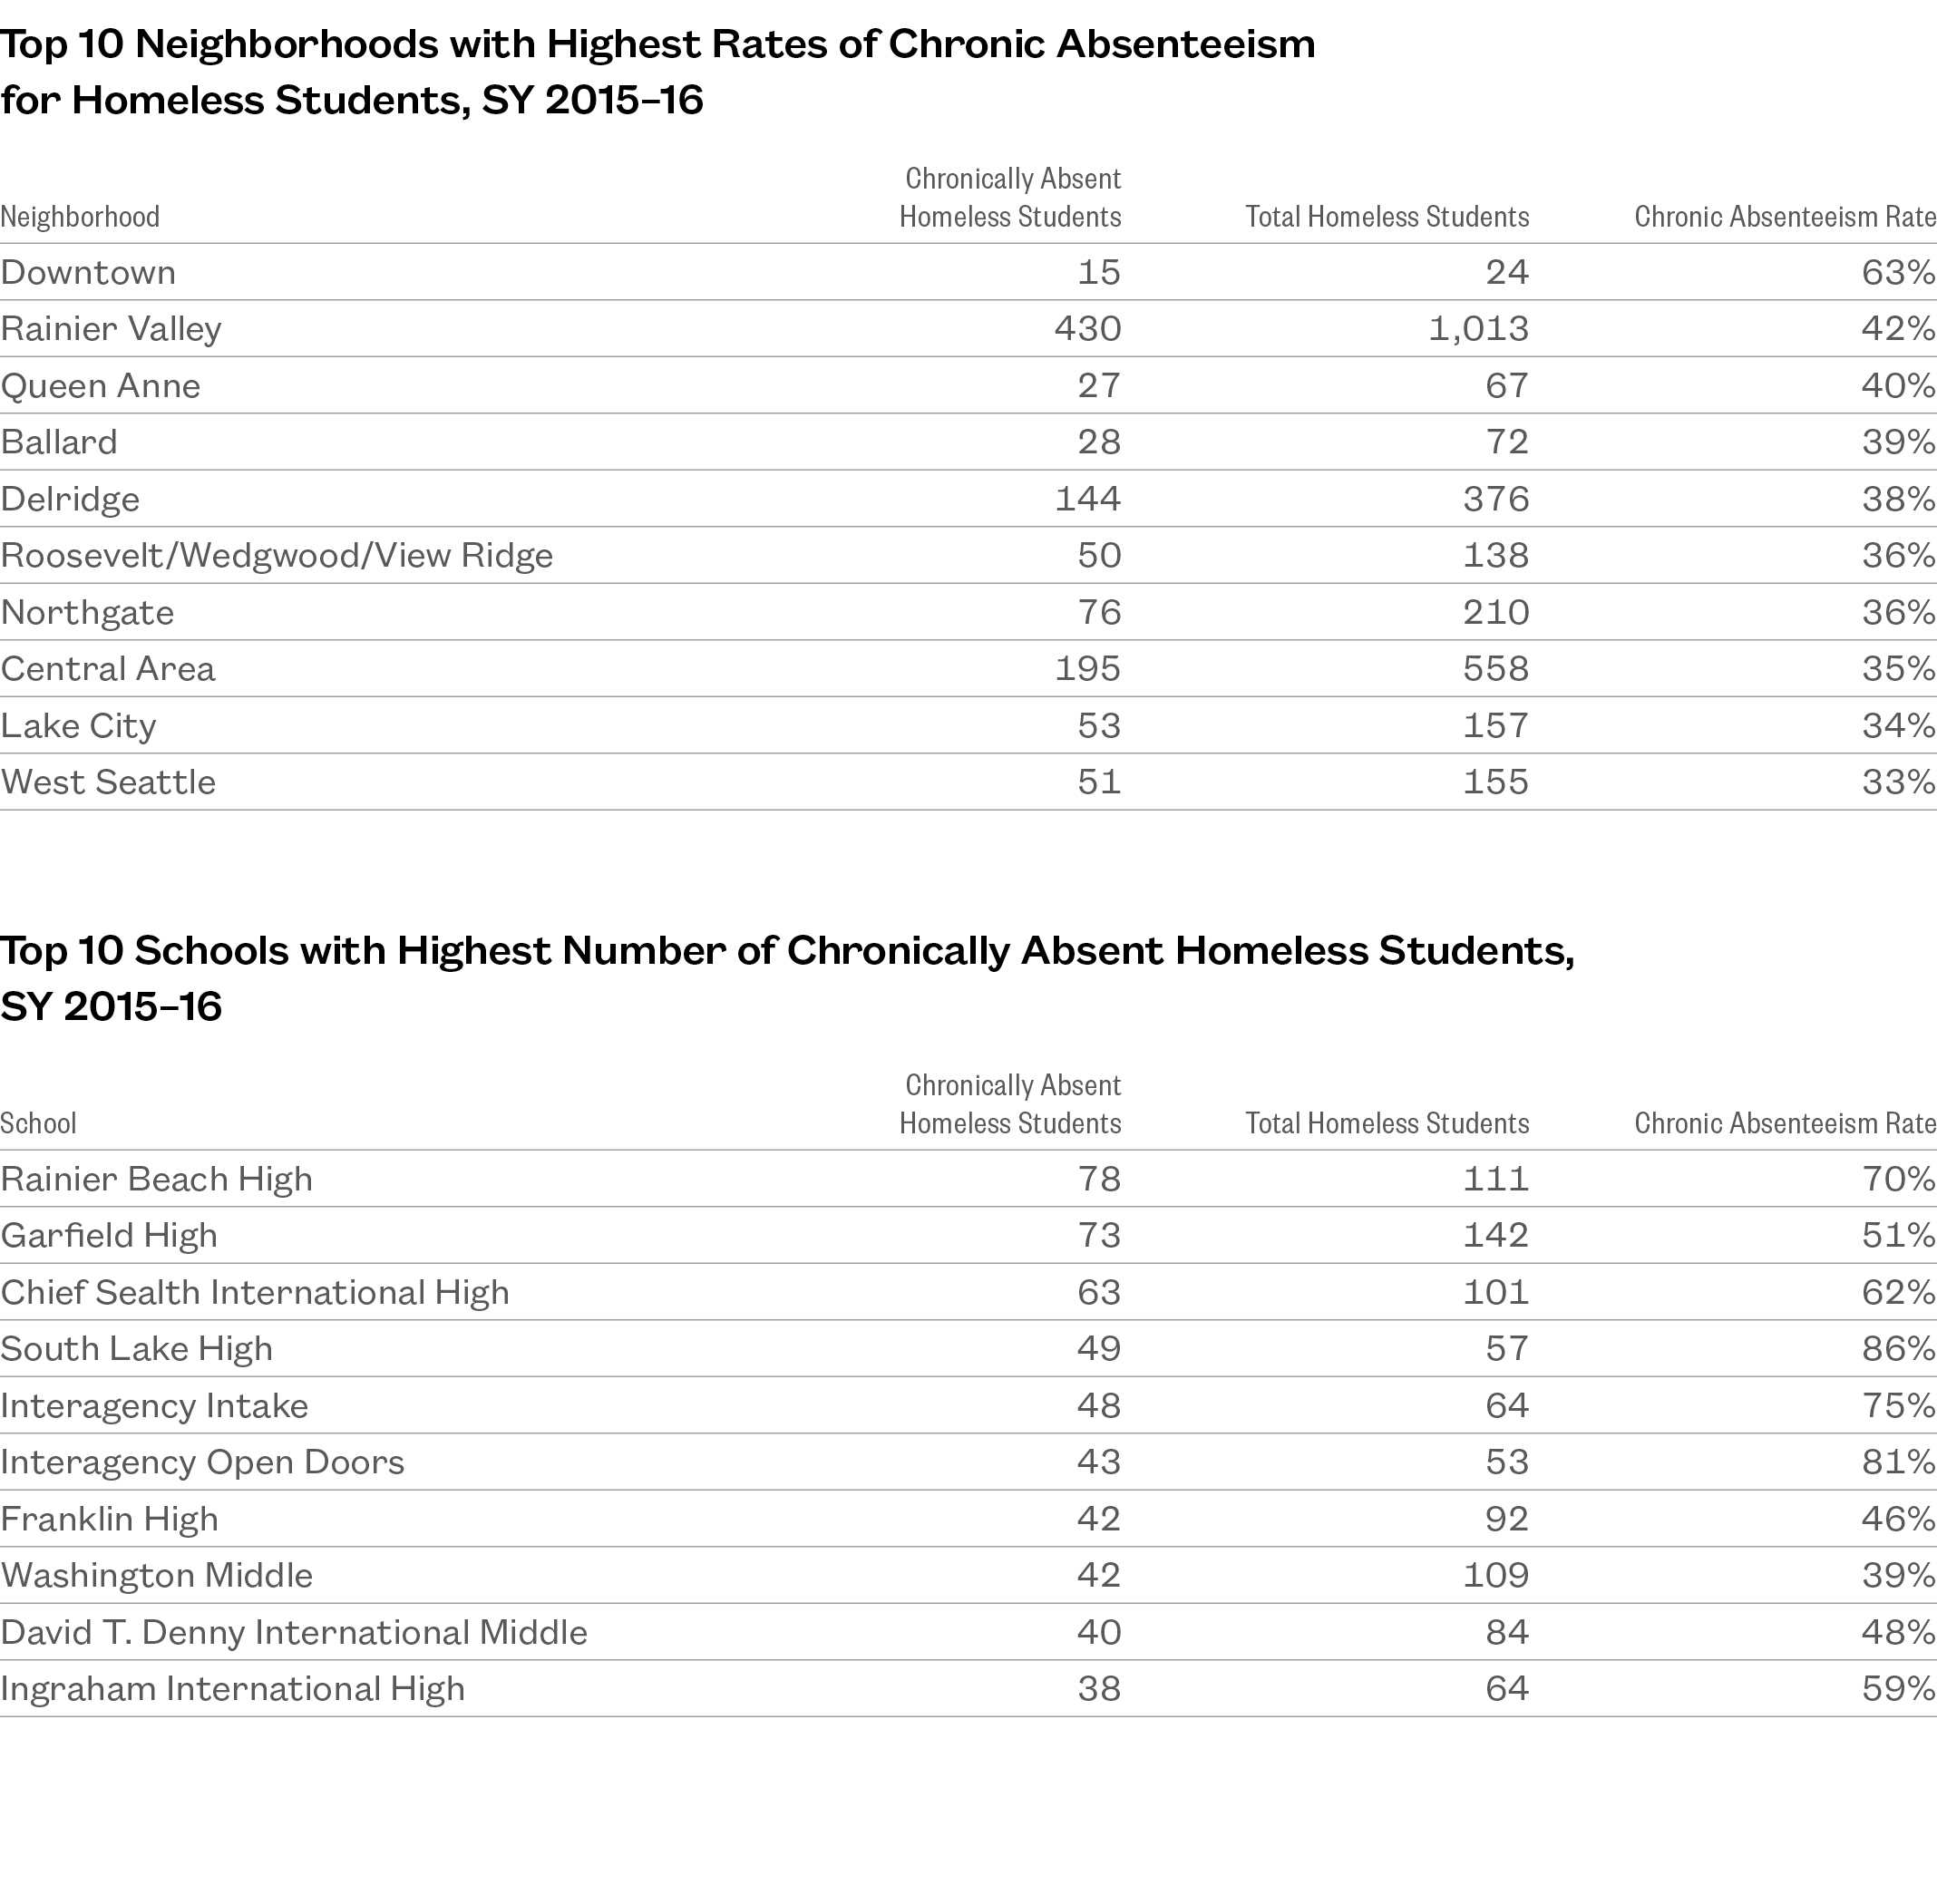
- Downtown, Rainier Valley, and Queen Anne had the highest rates of chronic absenteeism among homeless students.
- Downtown and Rainier Valley had high rates of homeless students transferring both in and out of the neighborhood.
- Most schools with high numbers of homeless students transferring mid-year were Interagency Academy locations.
Policy Considerations
- Preventing chronic absenteeism among homeless students will require a coordinated effort by schools, shelters, and families to reduce the barriers to attendance these students face, whether they be inadequate transportation, family schedules, or unpredictable relocations.
- The frequency with which homeless students enter and exit Interagency Academy schools should be viewed as an opportunity to assess how well mainstream high schools are serving homeless students.
Homeless Students Chronically Absent at 2.5 Times the Rate of Housed Students
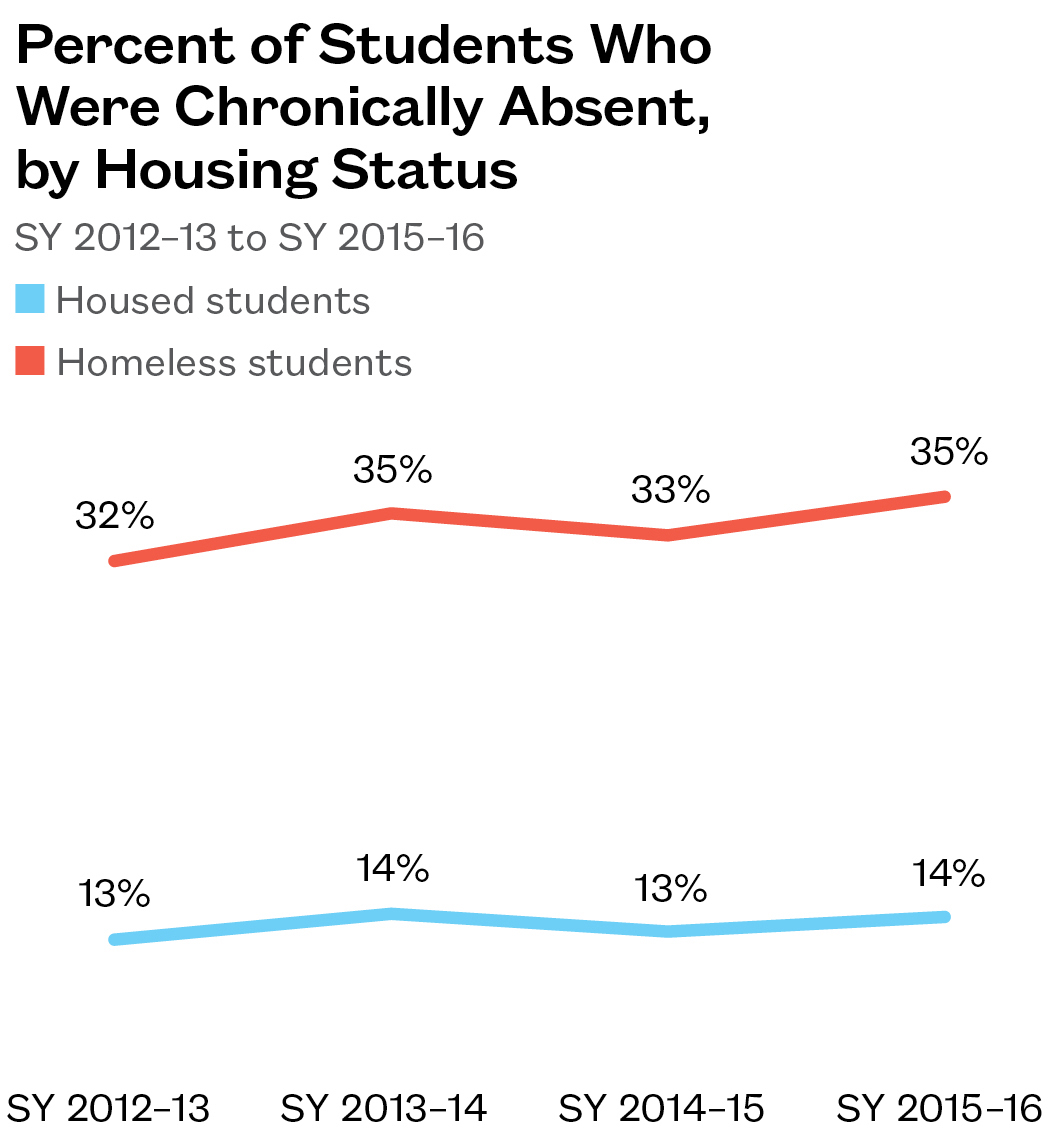
- More than a third of homeless students were chronically absent in SY 2015–16, meaning they missed 18 days or more of instruction. This is 2.5 times the rate at which housed students missed the same amount of school.
- Difficulty with transportation is a frequent cause of absenteeism, especially for homeless students. Under SPS policy, transportation-related absences for homeless students can be excused, saving them from penalties for truancy, but still represent classroom time lost.
More Than One in 10 Homeless Students Miss 40 or More Days of School
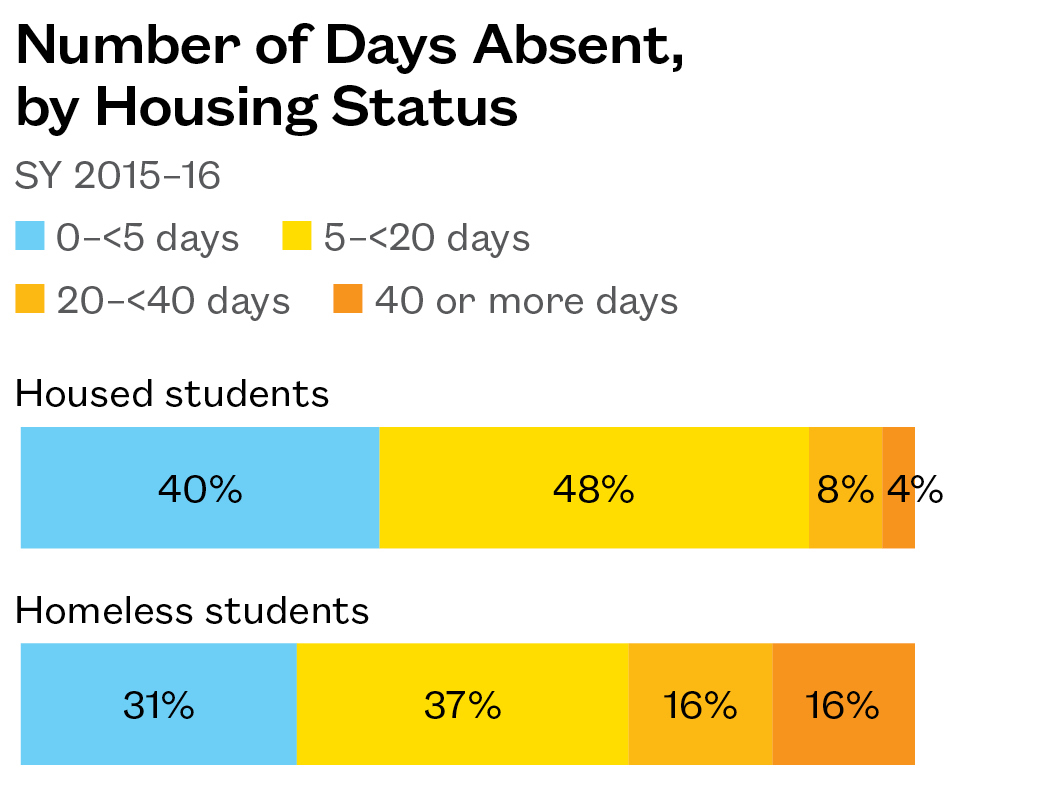
- Homeless students were also more likely to miss significant amounts of the school year beyond 18 days. Sixteen percent of homeless students missed between four and eight weeks’ worth of instruction. About one in six students (16%) were absent for even longer.
- Homeless students missed an average of 20 school days during SY 2015–16. Housed students missed an average of 10. Homeless students were also four times more likely to miss at least two months of school than housed students.
Disparities in Chronic Absenteeism Exist in All Grades
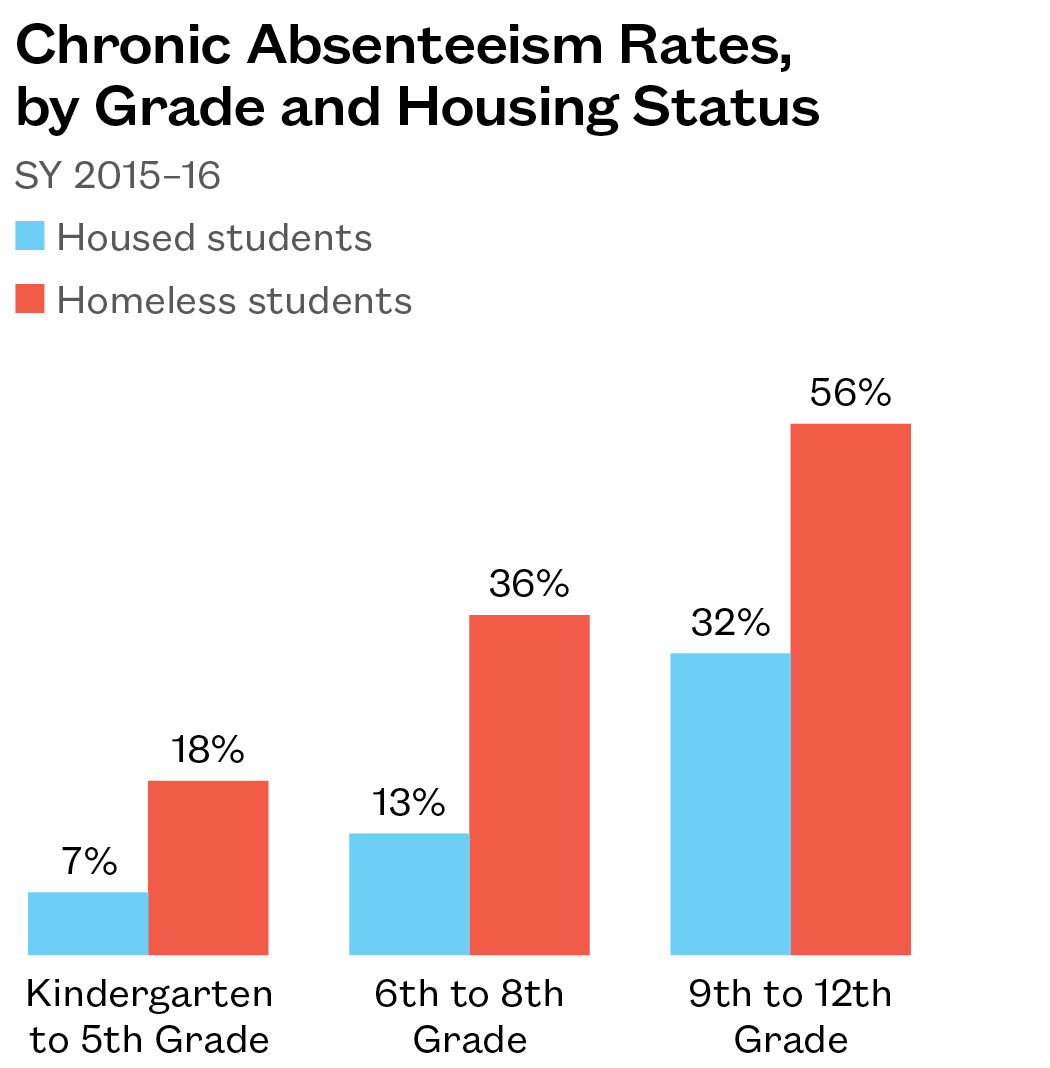
- Homeless students’ rates of absenteeism increase with age, with over one in three students in middle school and over half of all homeless students in high school being chronically absent.
- The greatest disparity in chronic absenteeism rates was in middle school, where homeless students were almost three times more likely to be chronically absent than their housed peers.
Over Half of Doubled-up High Schoolers Chronically Absent
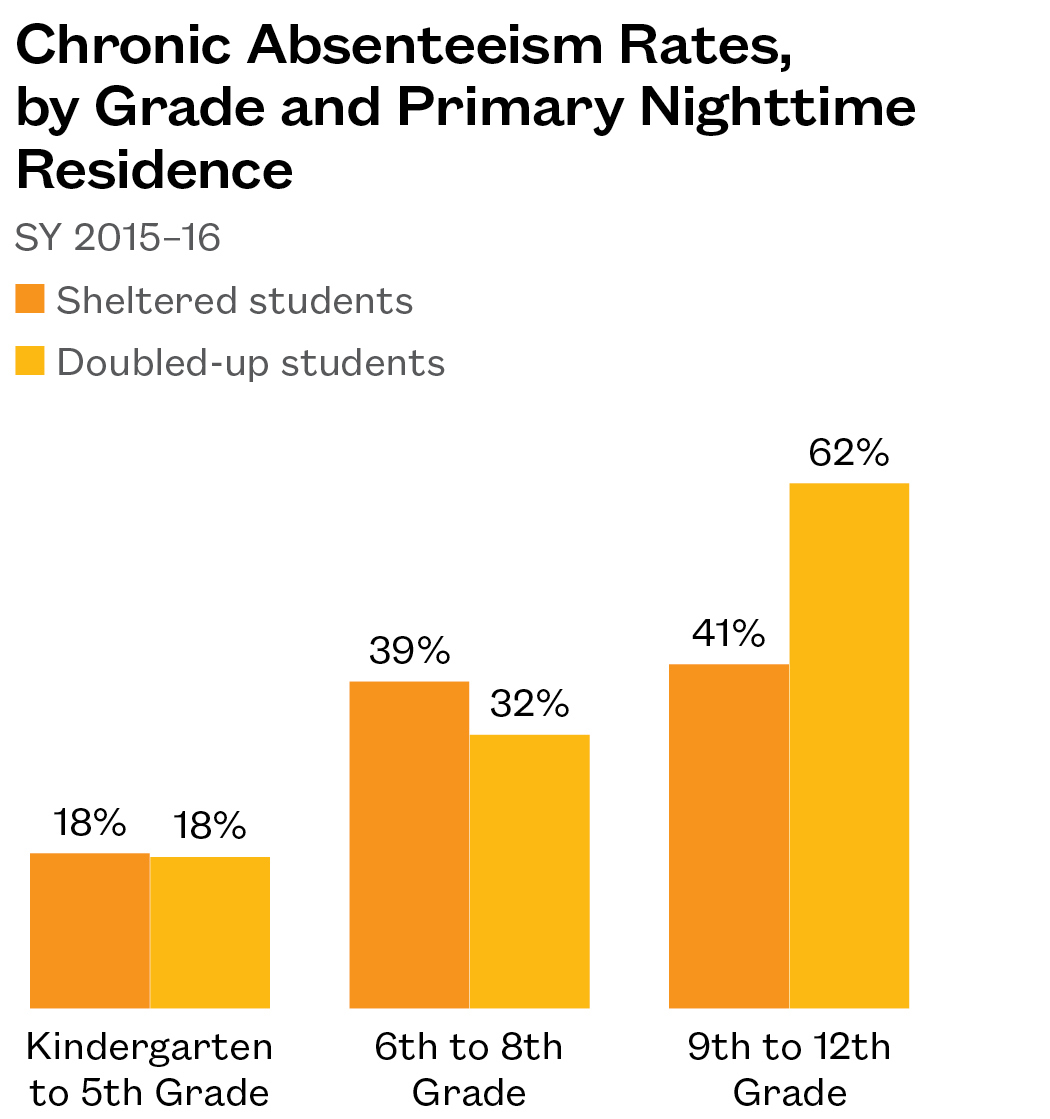
- Rates of absenteeism were roughly equal for homeless students who were in a shelter or doubled-up in elementary or middle school.
- In high school, nearly two-thirds of doubled-up students missed 18 days or more of school. Forty-one percent of high school students in shelter were also chronically absent.
Homeless Students More Likely to Transfer More Than Once
- Ten percent of homeless students changed schools during the 2015–16 school year, compared to only 3% of housed students.
- Over 2% of homeless students had to transfer schools more than once. This represents a rate of high mobility 4.5 times that seen among housed students.
![]()
Homeless Students Transfer at Four Times the Rate of Housed Students
- At all grade levels, homeless students transferred schools within SPS at three to seven times the rate of housed students. Rates were highest in high school, where 16% of homeless students changed schools during the school year.
![]()
Type of Homelessness Has Little Effect on Transfers
- Disparities in the rate sheltered and doubled-up homeless students transferred were minimal, with 10–11% of both groups changing schools.
- The differences across all groups were not statistically significant, due to the small number of students within each group. It is still important to consider how an individual student’s living situation may influence their risk of having to change schools.
![]()
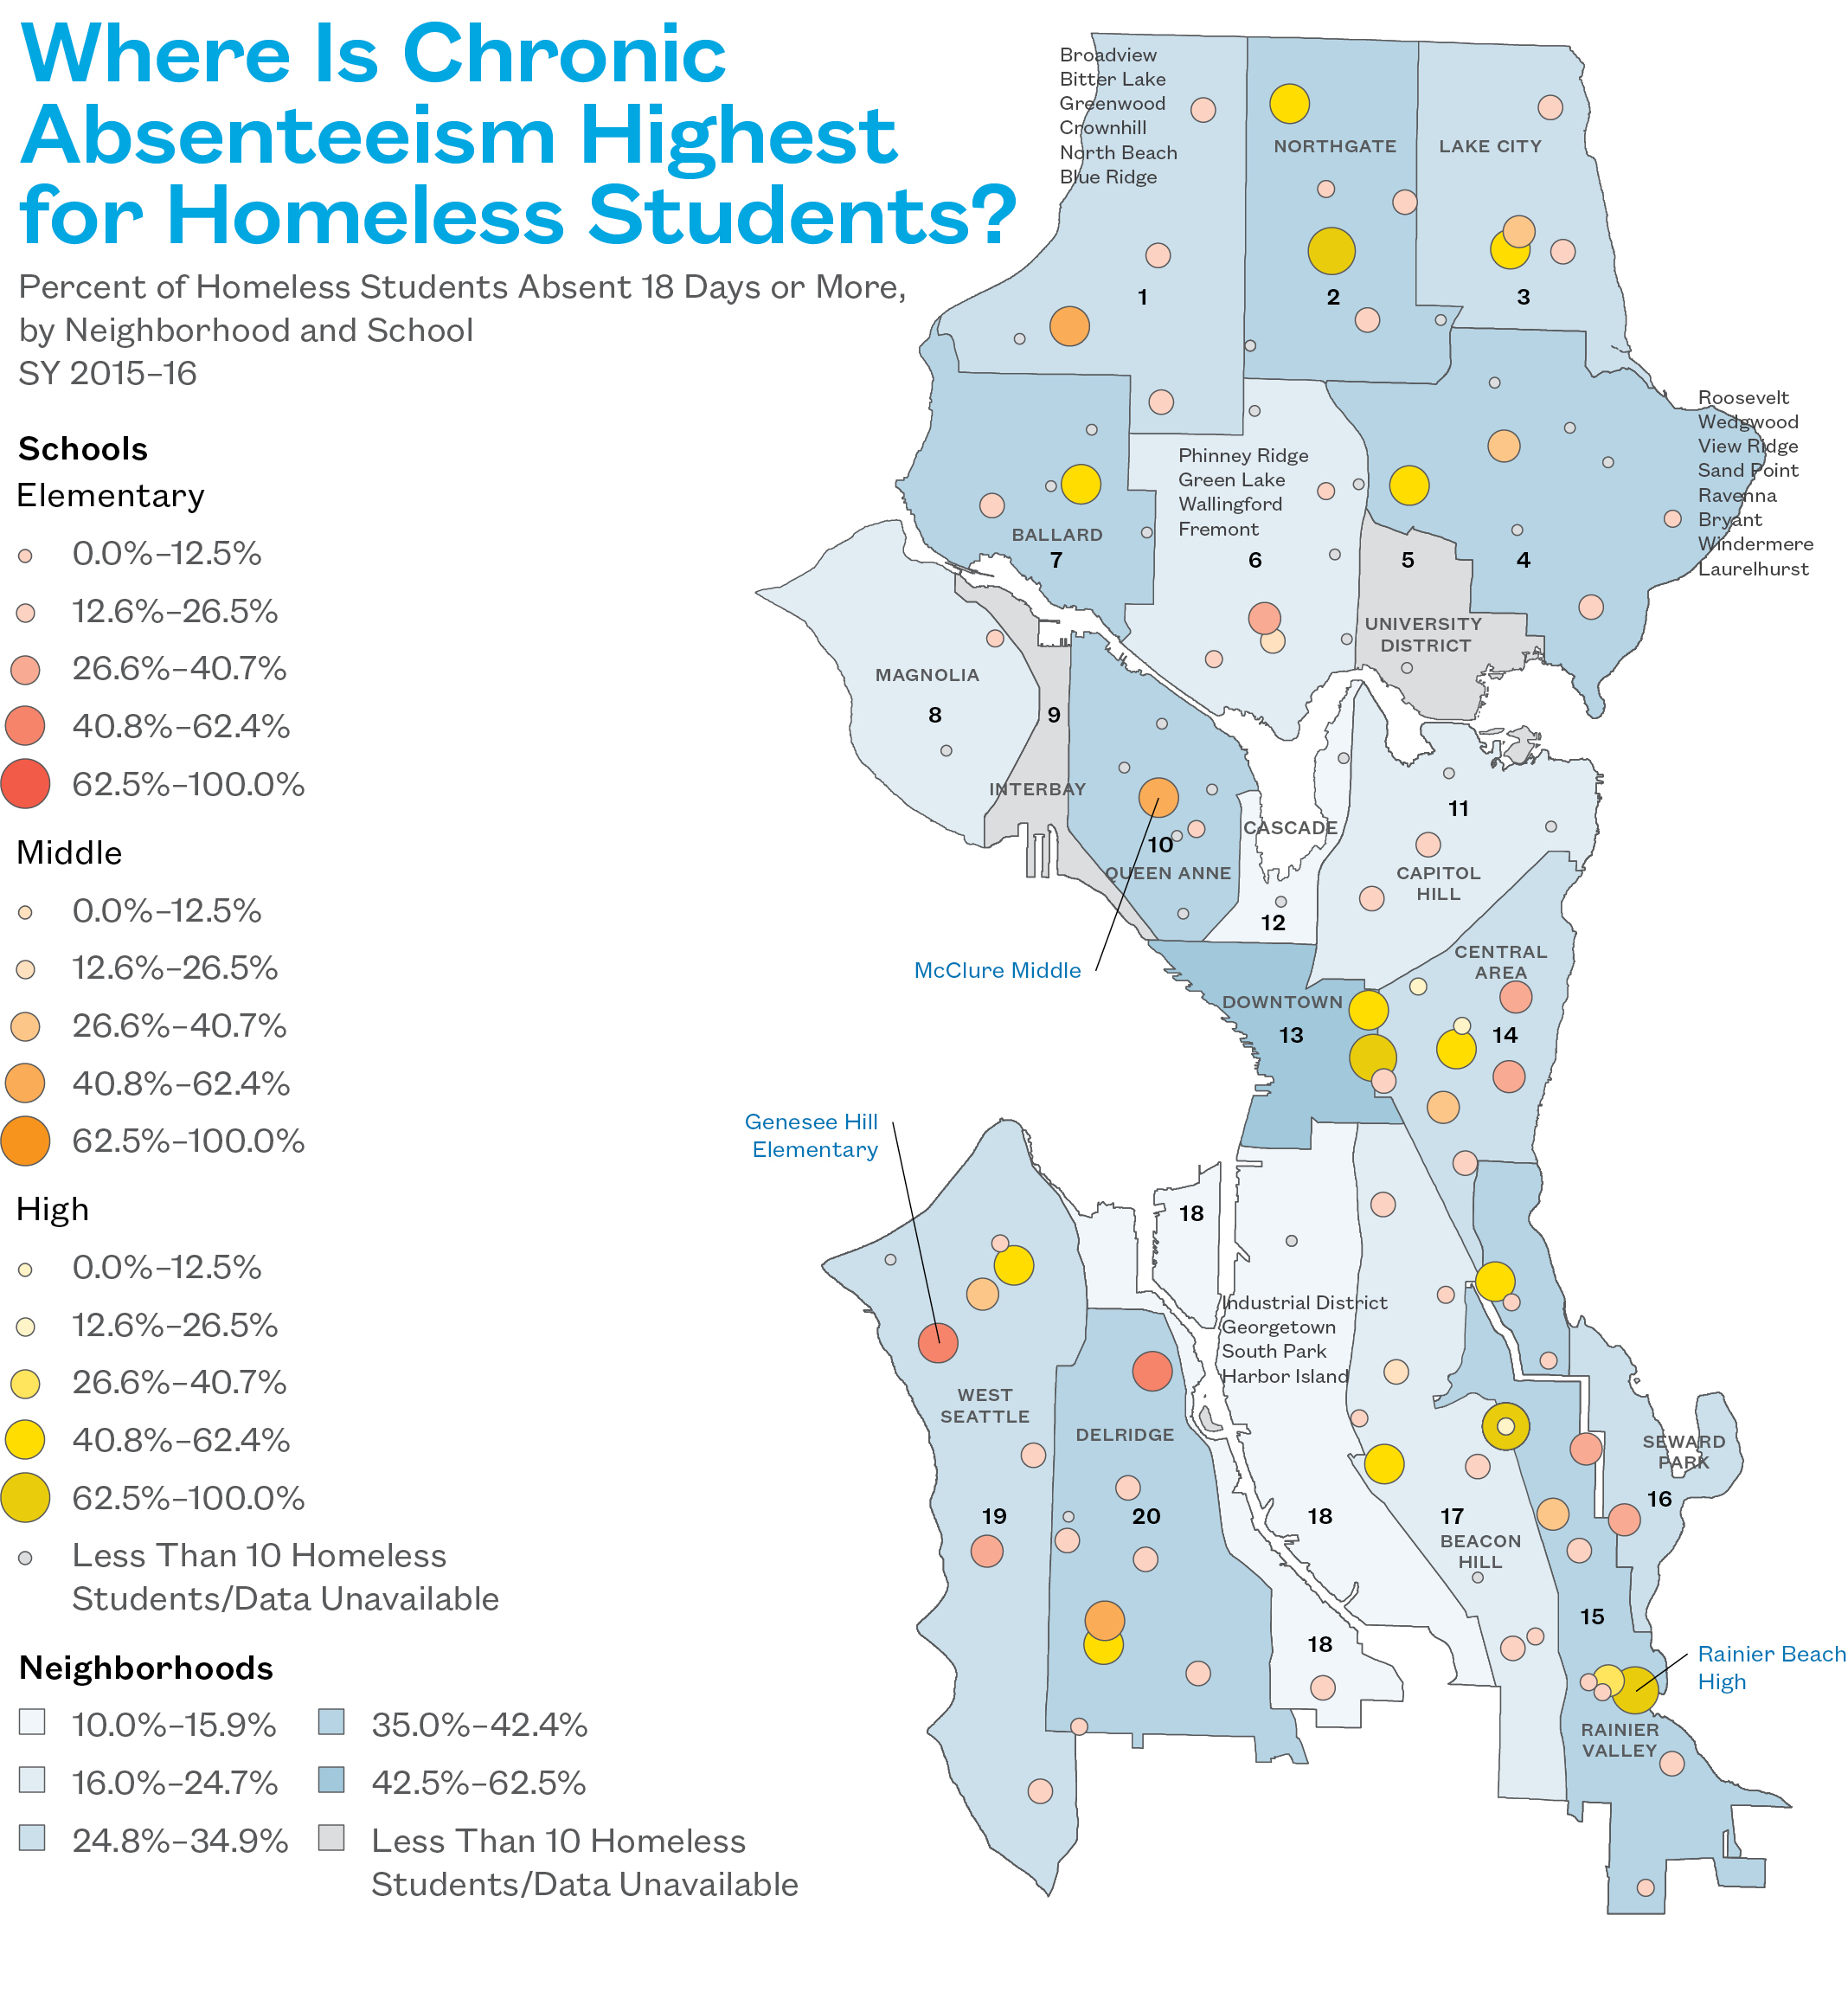
- Downtown, Rainier Valley, and Queen Anne had the highest rates of chronic absenteeism among homeless students. Phinney Ridge/Green Lake and Capitol Hill had the lowest.
- Homeless students were chronically absent at 3.5 times the rate of housed students in Queen Anne and Broadview/Bitter Lake.
- Alternative schools, such as Interagency Academy and Middle College locations, had the highest rates of chronic absenteeism.
- Among mainstream schools with at least 10 homeless students, Genesee Hill Elementary, McClure Middle, and Rainier Beach High had the highest rates for their grade levels.
Where Is Chronic Absenteeism Highest for Homeless Students?
![]()
- Downtown and Rainier Valley saw more than 25% of their homeless students transfer in mid-year. Many of the transfers in these neighborhoods were into Interagency Academy locations.
- Only 2% of homeless students in Beacon Hill and the Industrial District/Georgetown transferred into the neighborhood mid-year.
- Most schools with many homeless students transferring in mid-year were Interagency Academy locations. Among mainstream schools, Aki Kurose Middle had the most homeless students transfer in.
- Lowell Elementary and Rainier Beach High also had the most homeless transfers for their grade levels.
Where Are Homeless Students Transferring into Mid-Year?
![]()
![]()
- Downtown and Rainier Valley saw the highest rates of homeless student transfers out of a school in the area. Many of the transfers in these neighborhoods were out of Interagency Academy locations.
- Many schools with homeless students transferring out mid-year were Interagency Academy locations. Among mainstream high schools, Rainier Beach High and Franklin High had the most homeless students transfer out.
- Bailey Gatzert Elementary and Denny International Middle also had the most homeless transfers for their grade level.
Where Are Homeless Students Transferring out of Mid-Year?
![]()
Section 3
Educational Achievement of Homeless Students
Homelessness can affect a child’s cognitive and social development beginning in infancy, and the impact of housing instability on academic performance is clearly measurable by the time students begin taking mandatory assessments in math and English Language Arts (ELA) in the third grade. These tests, which continue through the eighth grade and measure whether students are performing at the appropriate grade level, are already scrutinized as a measure of the “opportunity gap” that exists for other vulnerable groups, such as low-income students and students of color. This section illuminates how homelessness can negatively affect students’ educational achievement above and beyond the challenges imposed by other factors.
Key Findings
- West Seattle had the highest rate of ELA proficiency and the 2nd-highest rate of math proficiency among neighborhoods with a large number of homeless students.
- The opportunity gap faced by homeless students has persisted across multiple years and was largely unaffected by the change in testing curricula after the 2013–14 school year.
Policy Considerations
- Efforts to close opportunity gaps for underserved groups of students, both by SPS and private organizations like the Road Map Project, can also address the unique impediments to students’ educational achievement created by homelessness.
- Research in other cities has shown the lasting impact that homelessness has on academic performance even after a student has returned to permanent housing. Continued supports and services for the formerly homeless can be an important component in closing the opportunity gap.
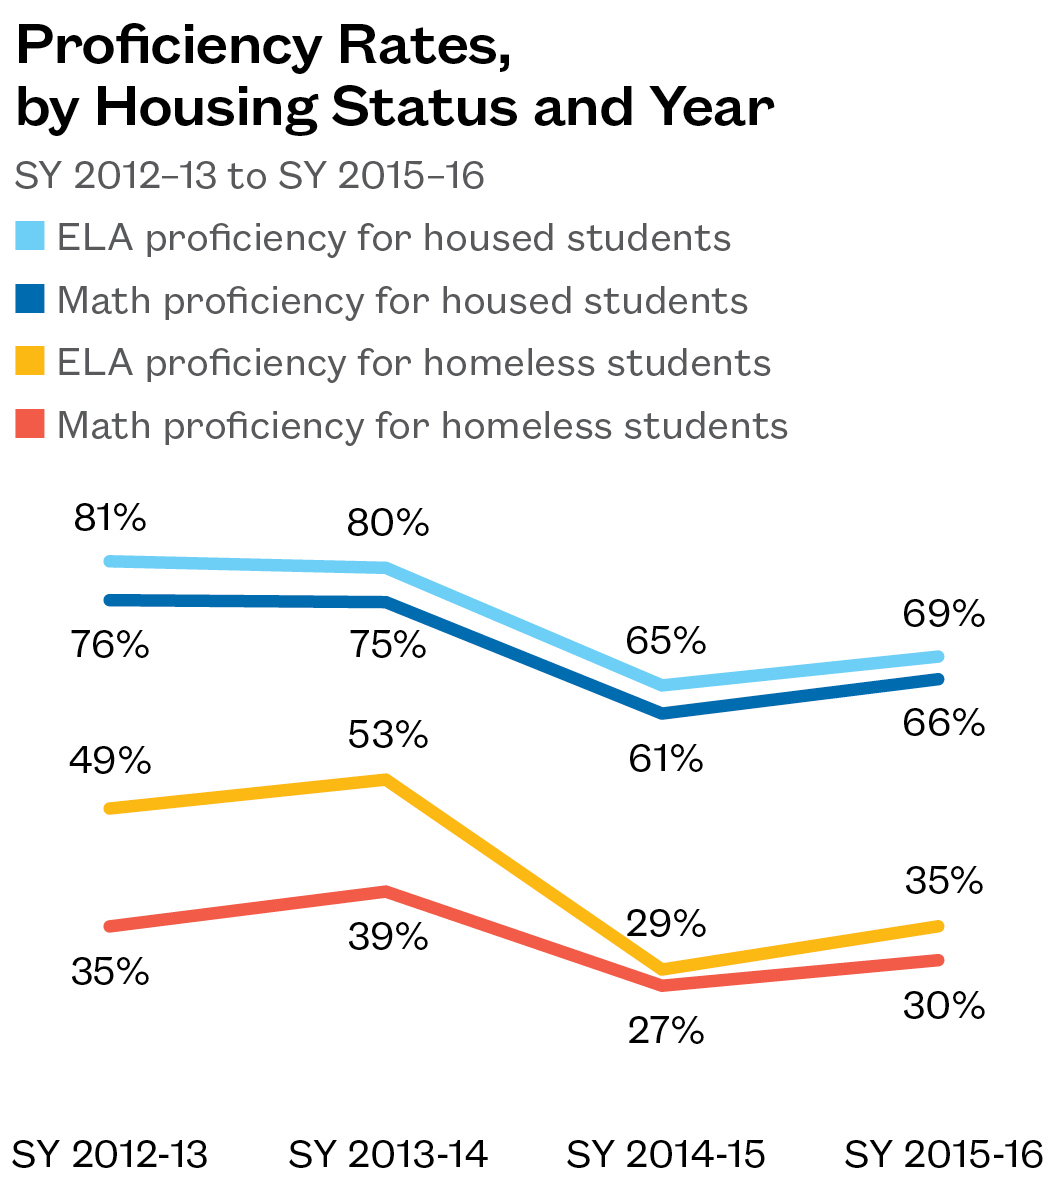
Homeless Students Meet Test Standards Half as Often as Housed Students
- Close to one in three homeless students was scored as meeting the grade level standard on statewide tests given to 3rd–8th graders in math and ELA in SY 2015–16.
- The latest test scores represent an improvement over the previous year (the first using Common Core curricula), but still showed approximately half the proficiency rate of housed students taking the same tests.
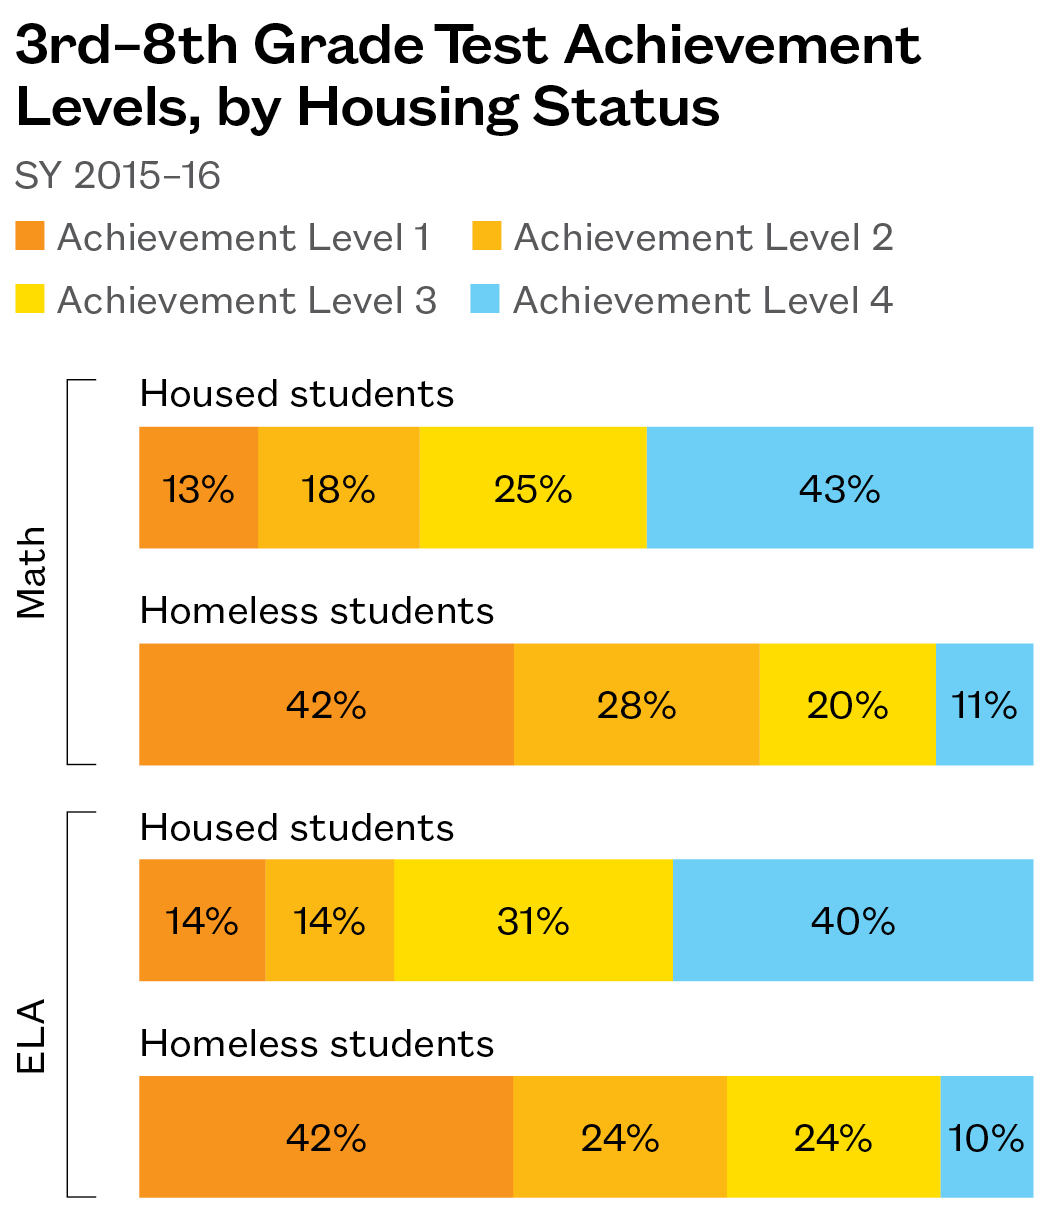
Two in Five Homeless Students Receive Lowest Achievement Level on Tests
- In both math and ELA, over 40% of homeless students received the lowest score on the four-point scale used to judge whether a student meets the standard for their grade level.
- Only one in 10 homeless students scored at achievement level 4 (in either math or ELA), compared to over 40% of housed students who earned the highest possible score.
- Homeless students’ test scores were more polarized than those of all low-income students. Across all grade levels, the percent of low-income students given an achievement level of 1 was 29% in math and 31% in ELA.
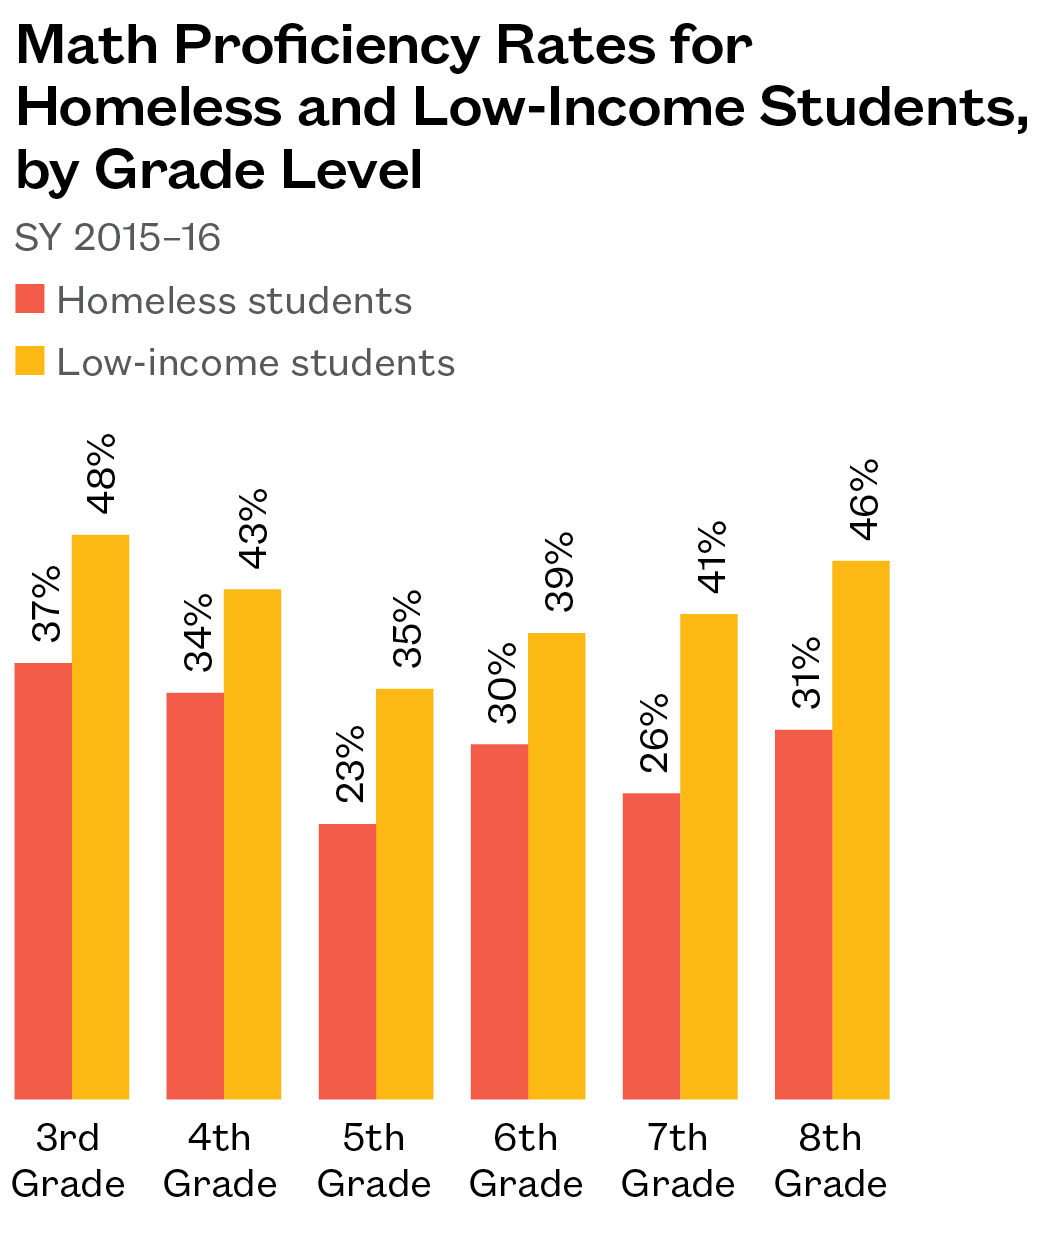
Homeless Students Less Likely to Meet Math Standard Than Low-Income Peers
- Low-income students performed better than homeless students on math assessment tests at all grade levels. On 3rd grade exams, 48% of low-income students met the test standard in math, compared with only 37% of homeless students.
- The gap in math achievement between homeless and low-income students was largest among 7th and 8th graders, with a 15 percentage point gap in achievement rates.
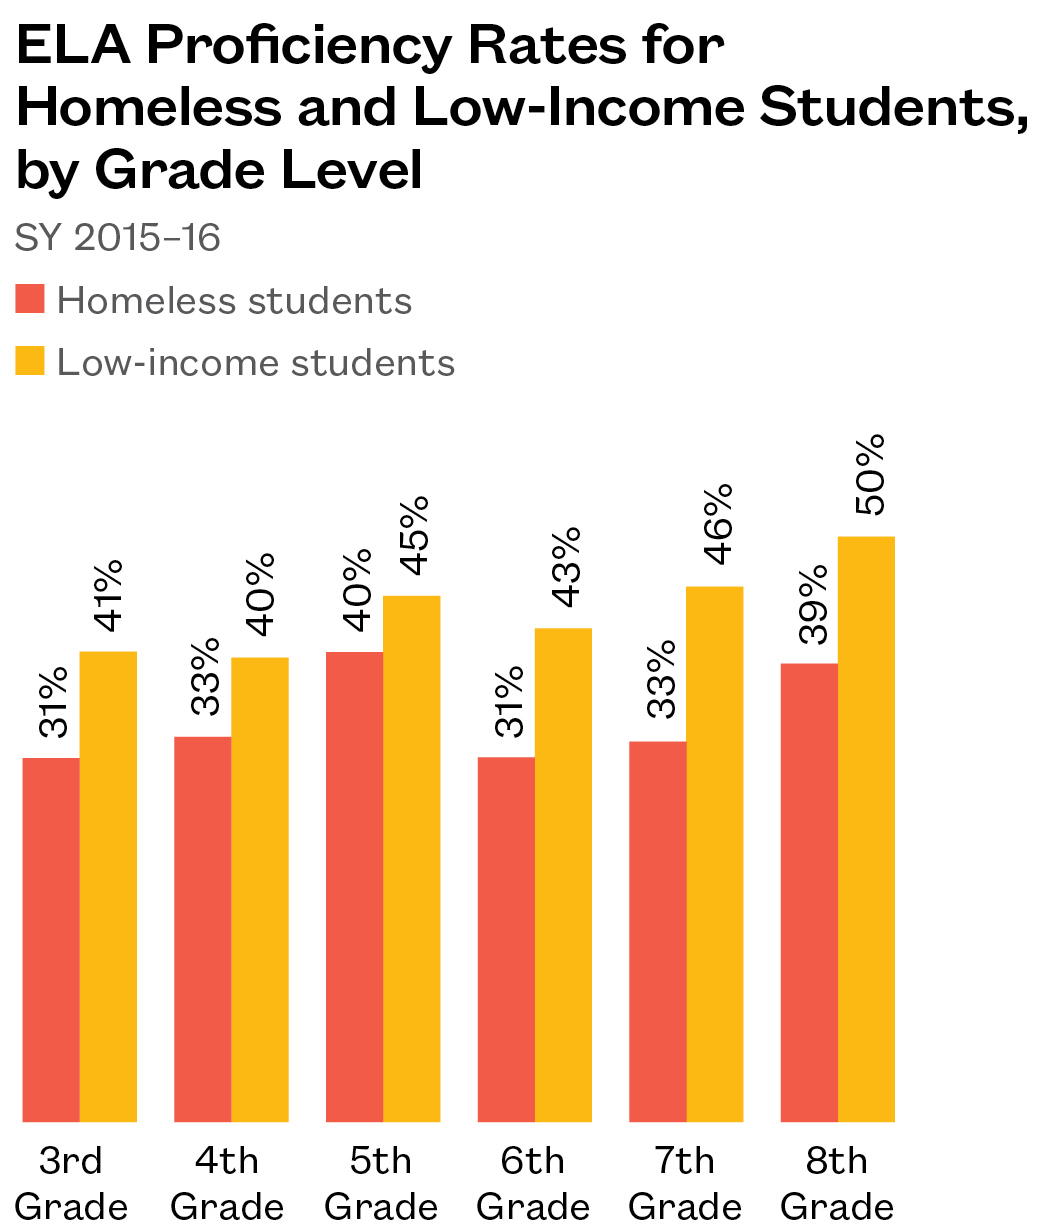
Proficiency in ELA Higher among Low-Income Students Than Homeless
- Homeless students were less likely to pass the ELA assessment than the larger pool of low-income students. On 3rd grade exams, 41% of low-income students met the test standard in ELA, compared with only 31% of homeless students.
- Seventh grade saw the largest gap in ELA proficiency rates between the homeless and low-income groups. Forty-six percent of low-income students met the standard for ELA, compared with just 33% of homeless students.
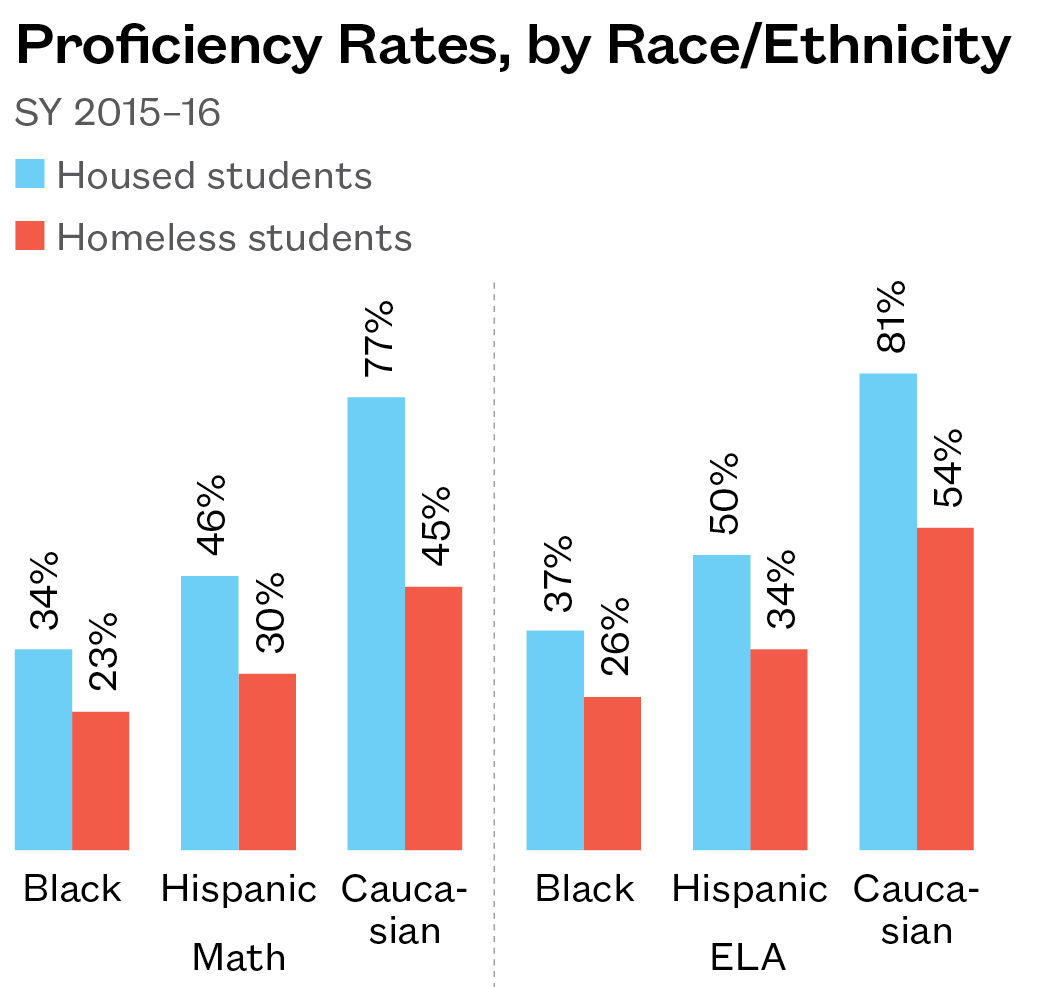
Homelessness Increases Racial Disparities in Test Performance
- One in four black homeless students scored at the grade-level standard in either math or ELA. Around one in three Hispanic homeless students also met standards.
- Caucasian homeless students were scored as proficient at roughly the same rate as Hispanic students who were housed.
- SPS has several policies and programs aimed at reducing racial disparities in learning and performance and added a professional development program in SY 2015–16.
- Continuing to expand the professional development of educators and services that address racial disparities and the impact of housing instability could increase the rate of improvement in student performance.
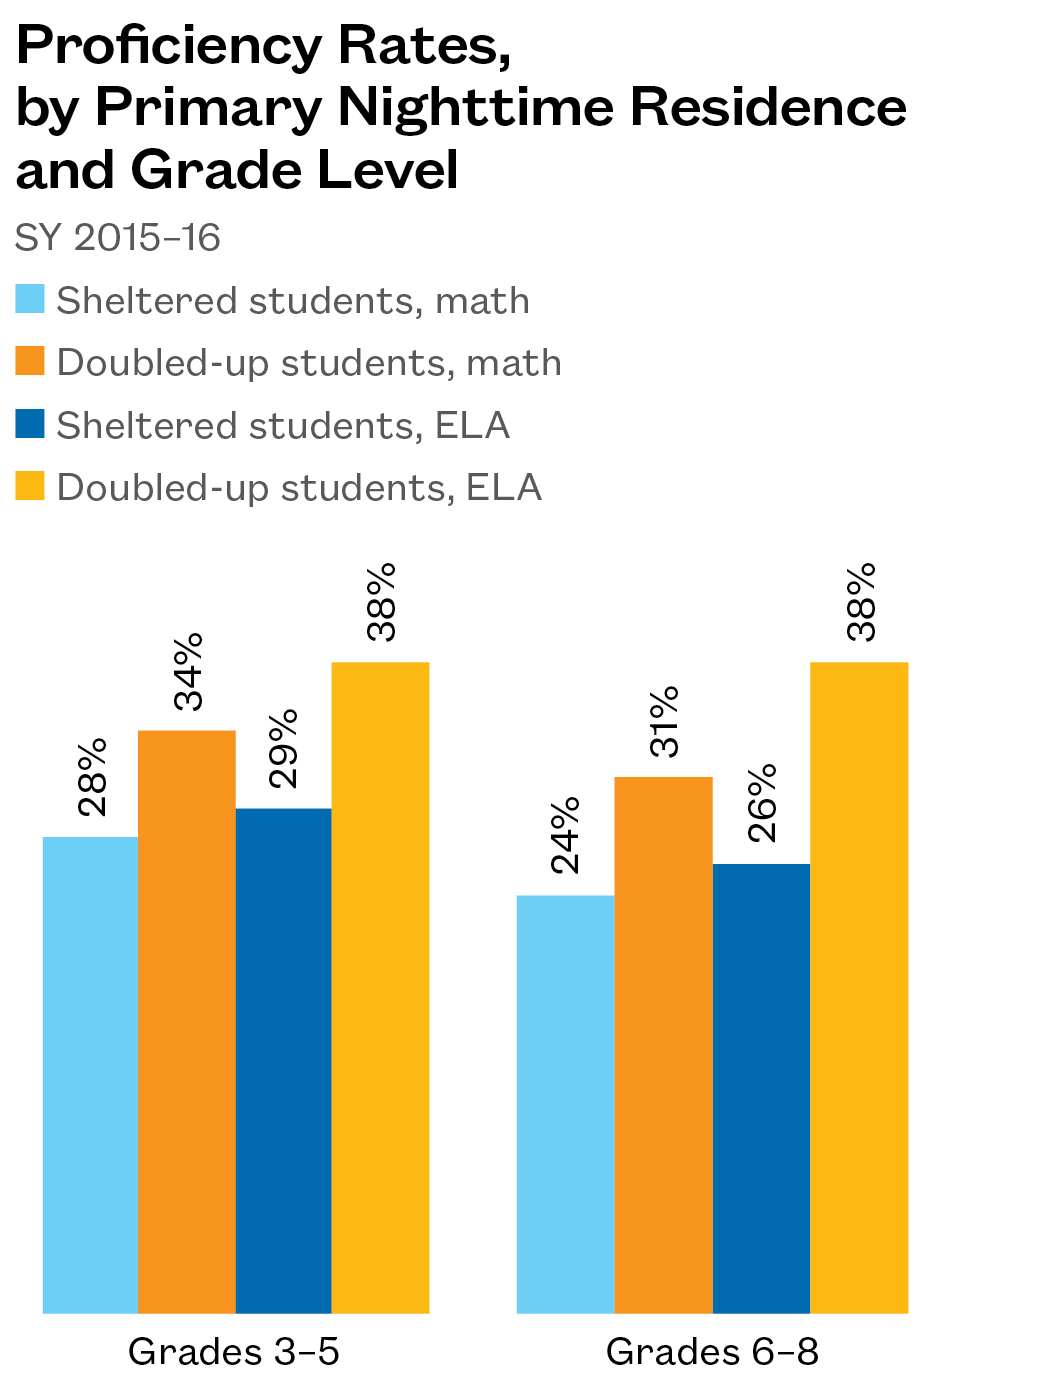
Doubled-up Students Performed Slightly Better Than Those in Shelter
- In both elementary and middle school, homeless students who were doubled up met grade-level standards at slightly higher rates than their classmates who stayed in shelters, though only in ELA were these differences statistically significant.
- The largest gap was in middle school, where only 26% of sheltered students scored as proficient in ELA, while 38% of doubled-up students met the grade-level standard.
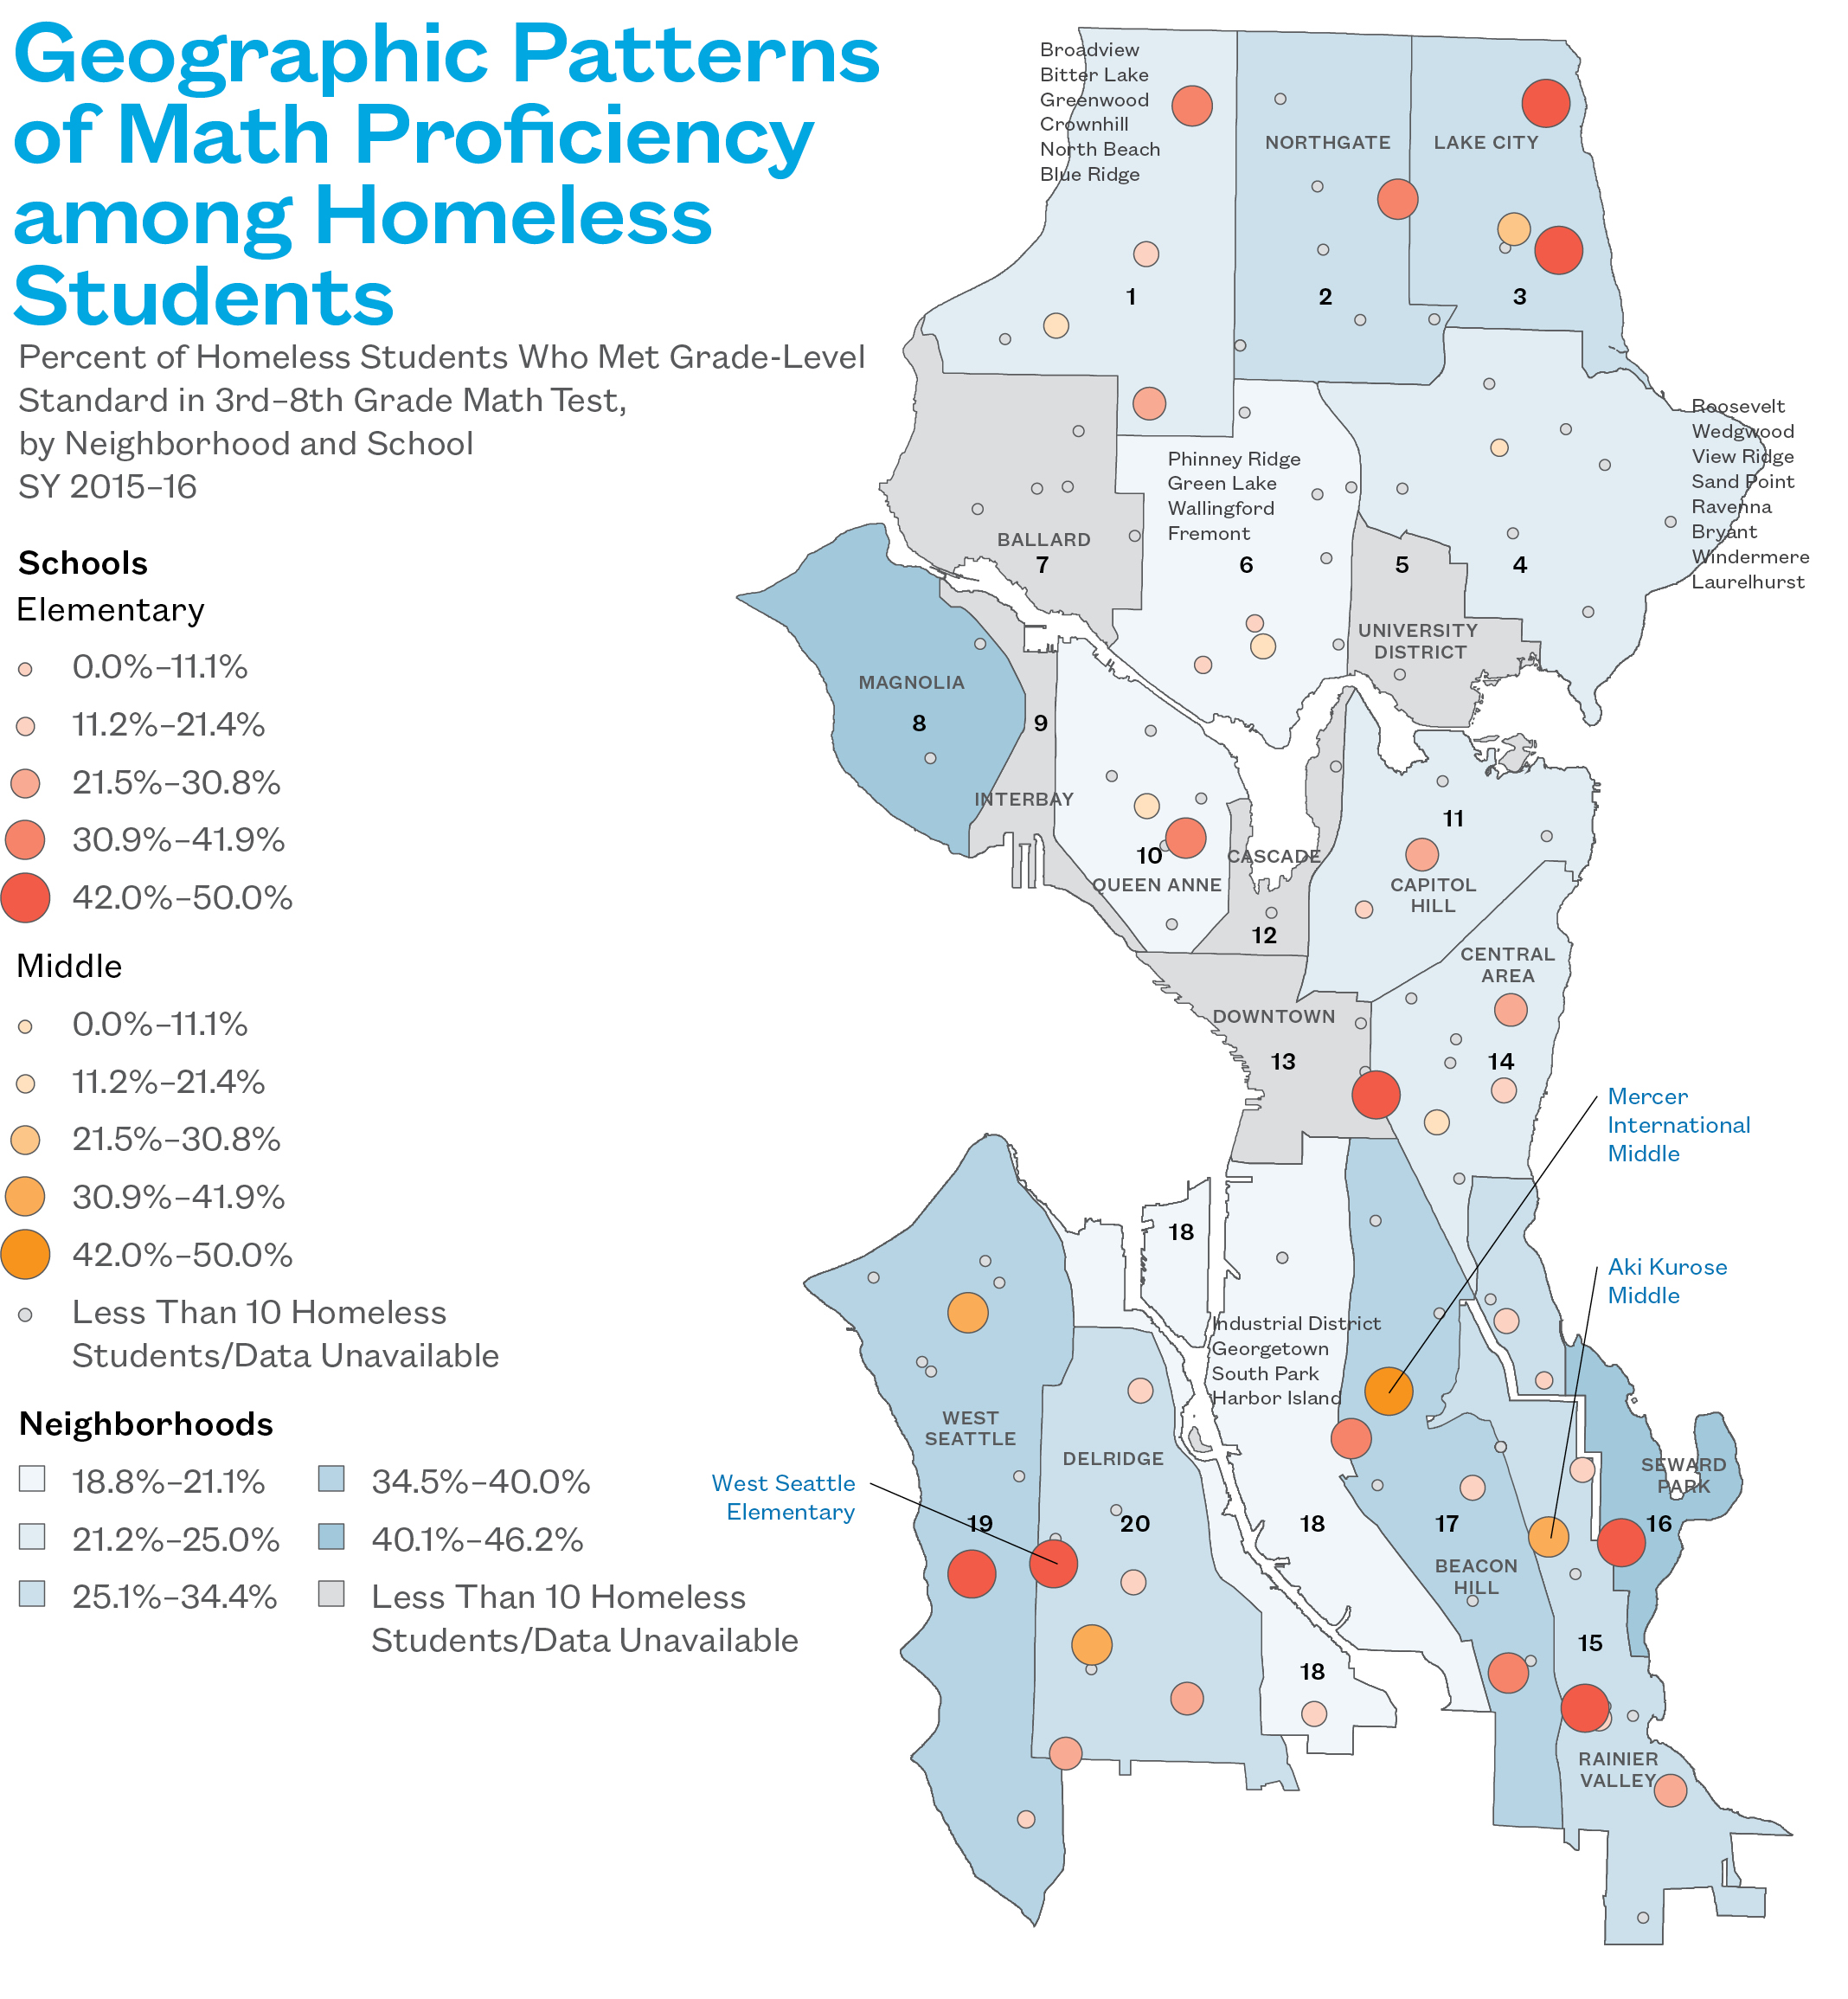
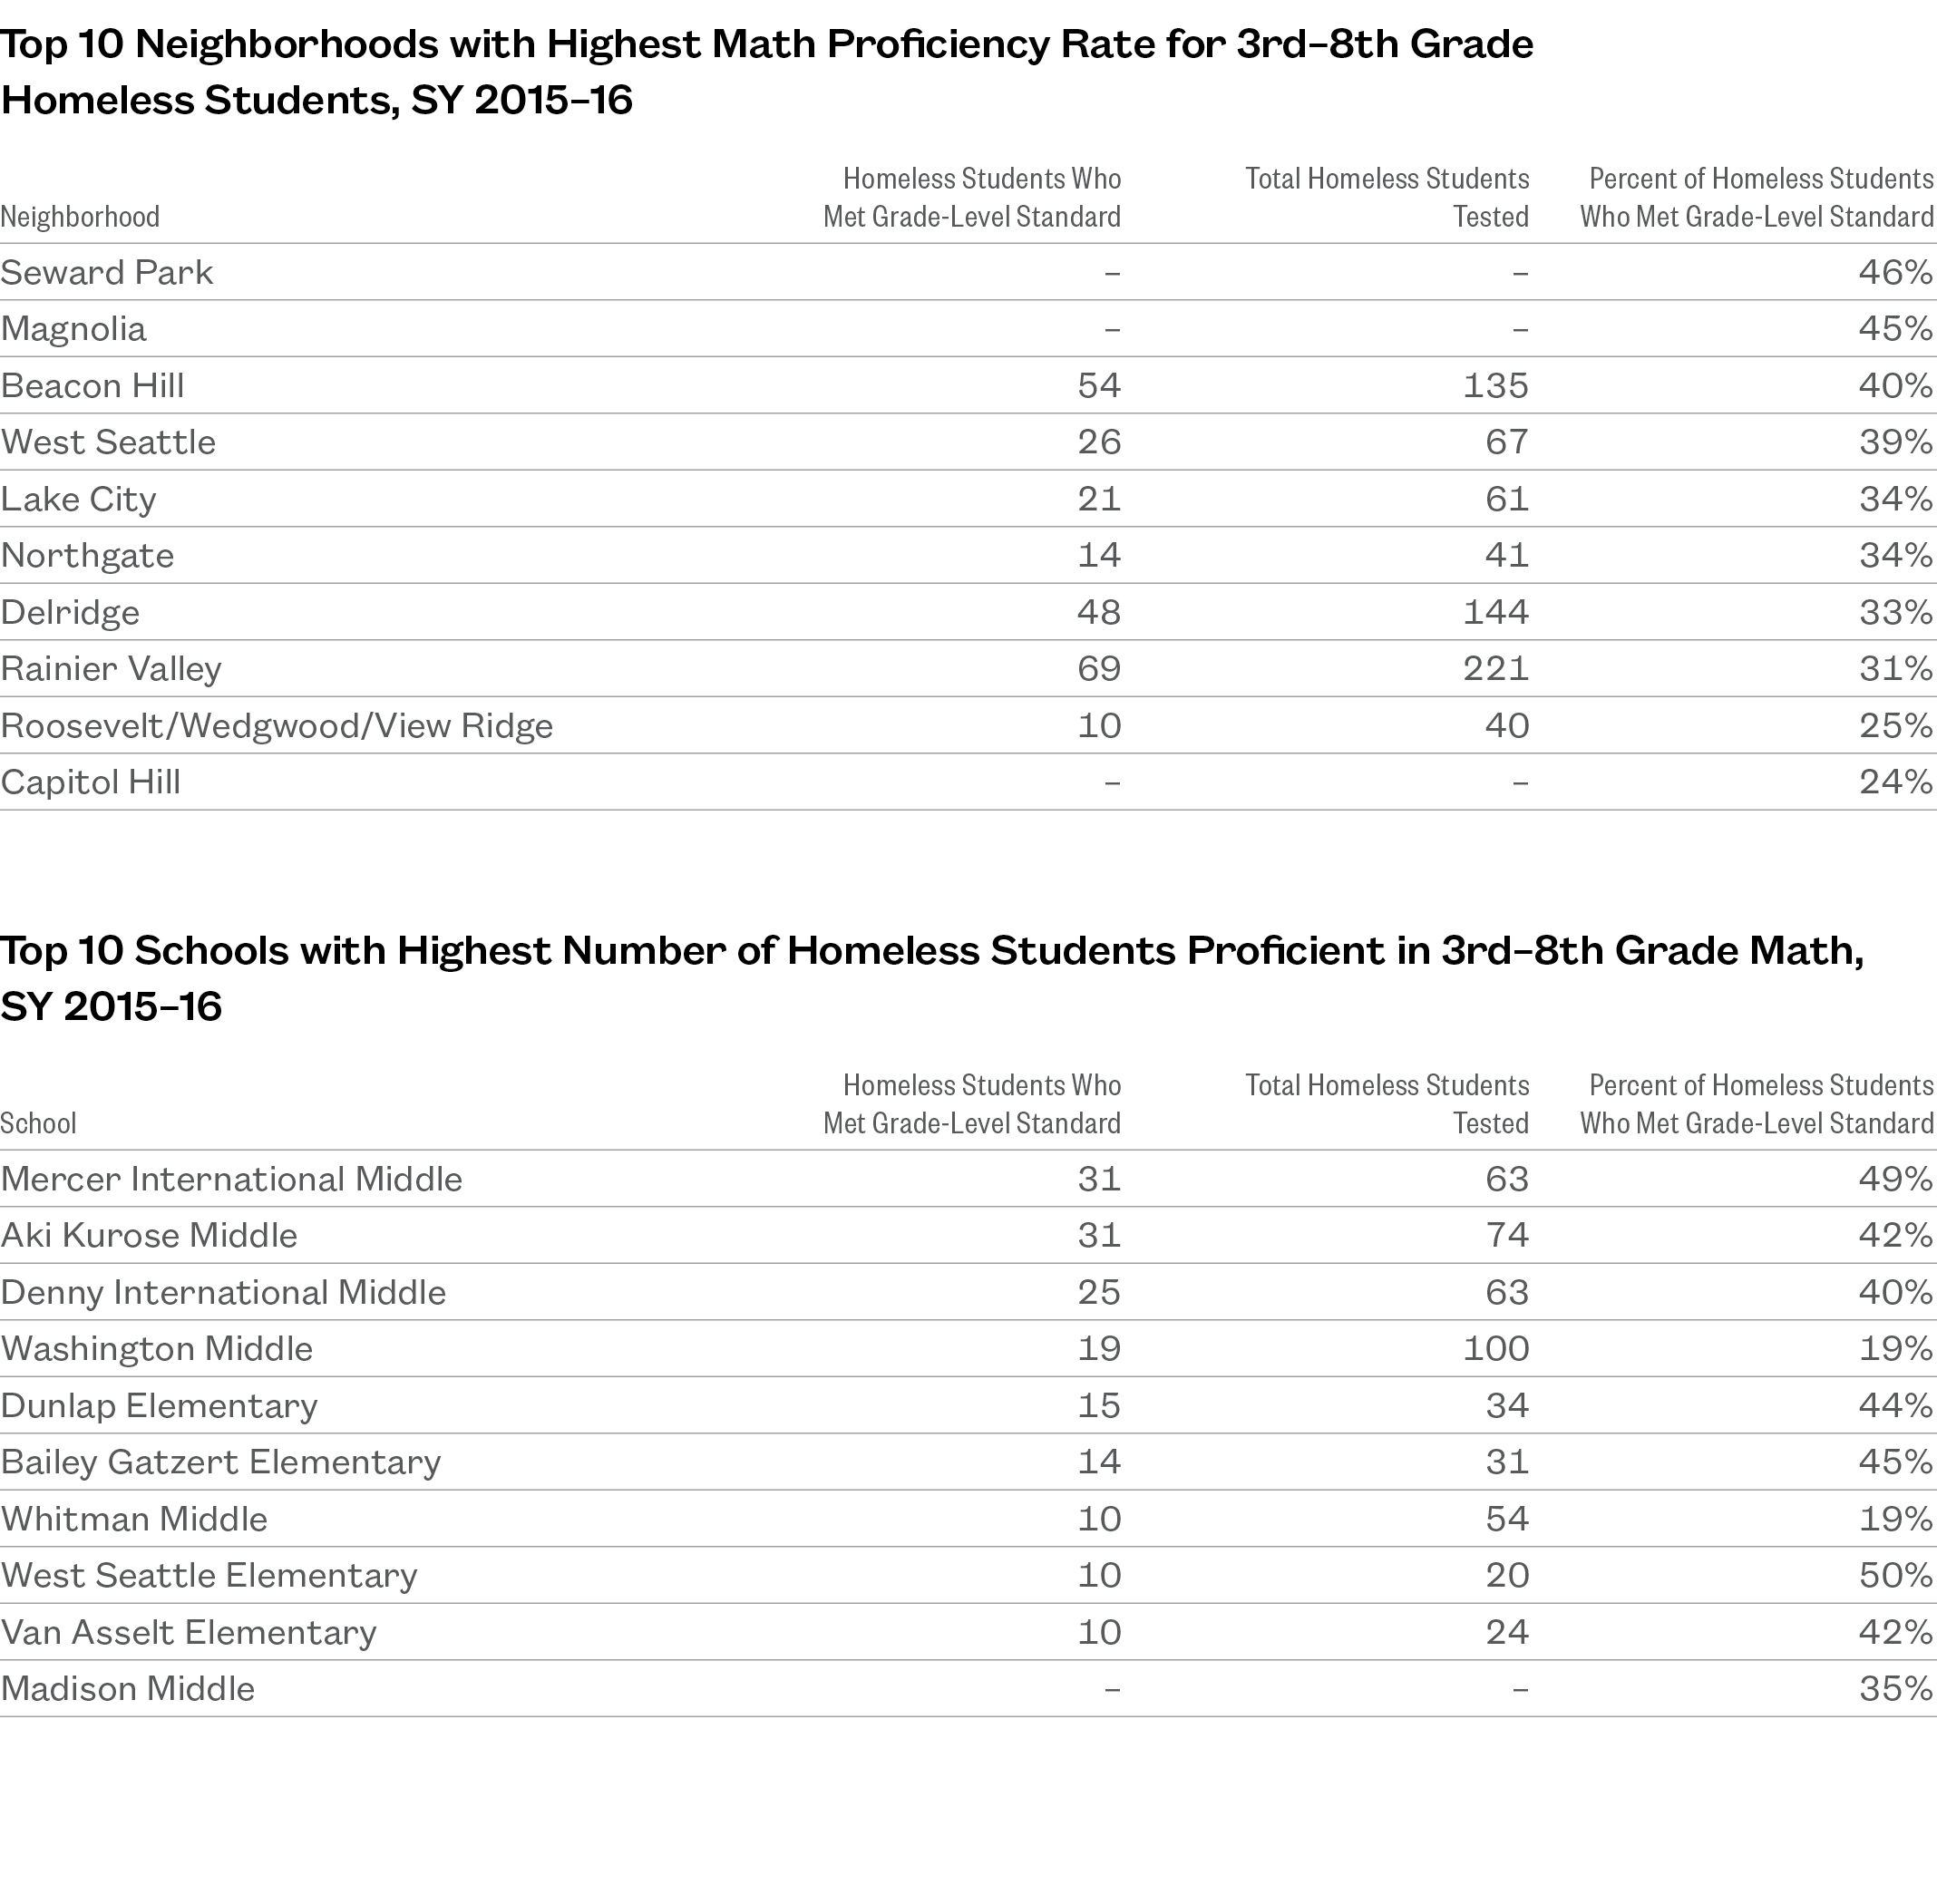
- Seward Park and Magnolia had the highest homeless proficiency rates, but relatively few homeless students tested.
- Beacon Hill and West Seattle had the highest homeless proficiency rates among neighborhoods with a large number of homeless students.
- In schools with at least 10 homeless students tested, West Seattle Elementary and Mercer International Middle had the highest math proficiency rates for their grade levels.
- Mercer International Middle and Aki Kurose Middle had the most homeless students who met the standard in math, with 31 each.
Geographic Patterns of Math Proficiency among Homeless Students
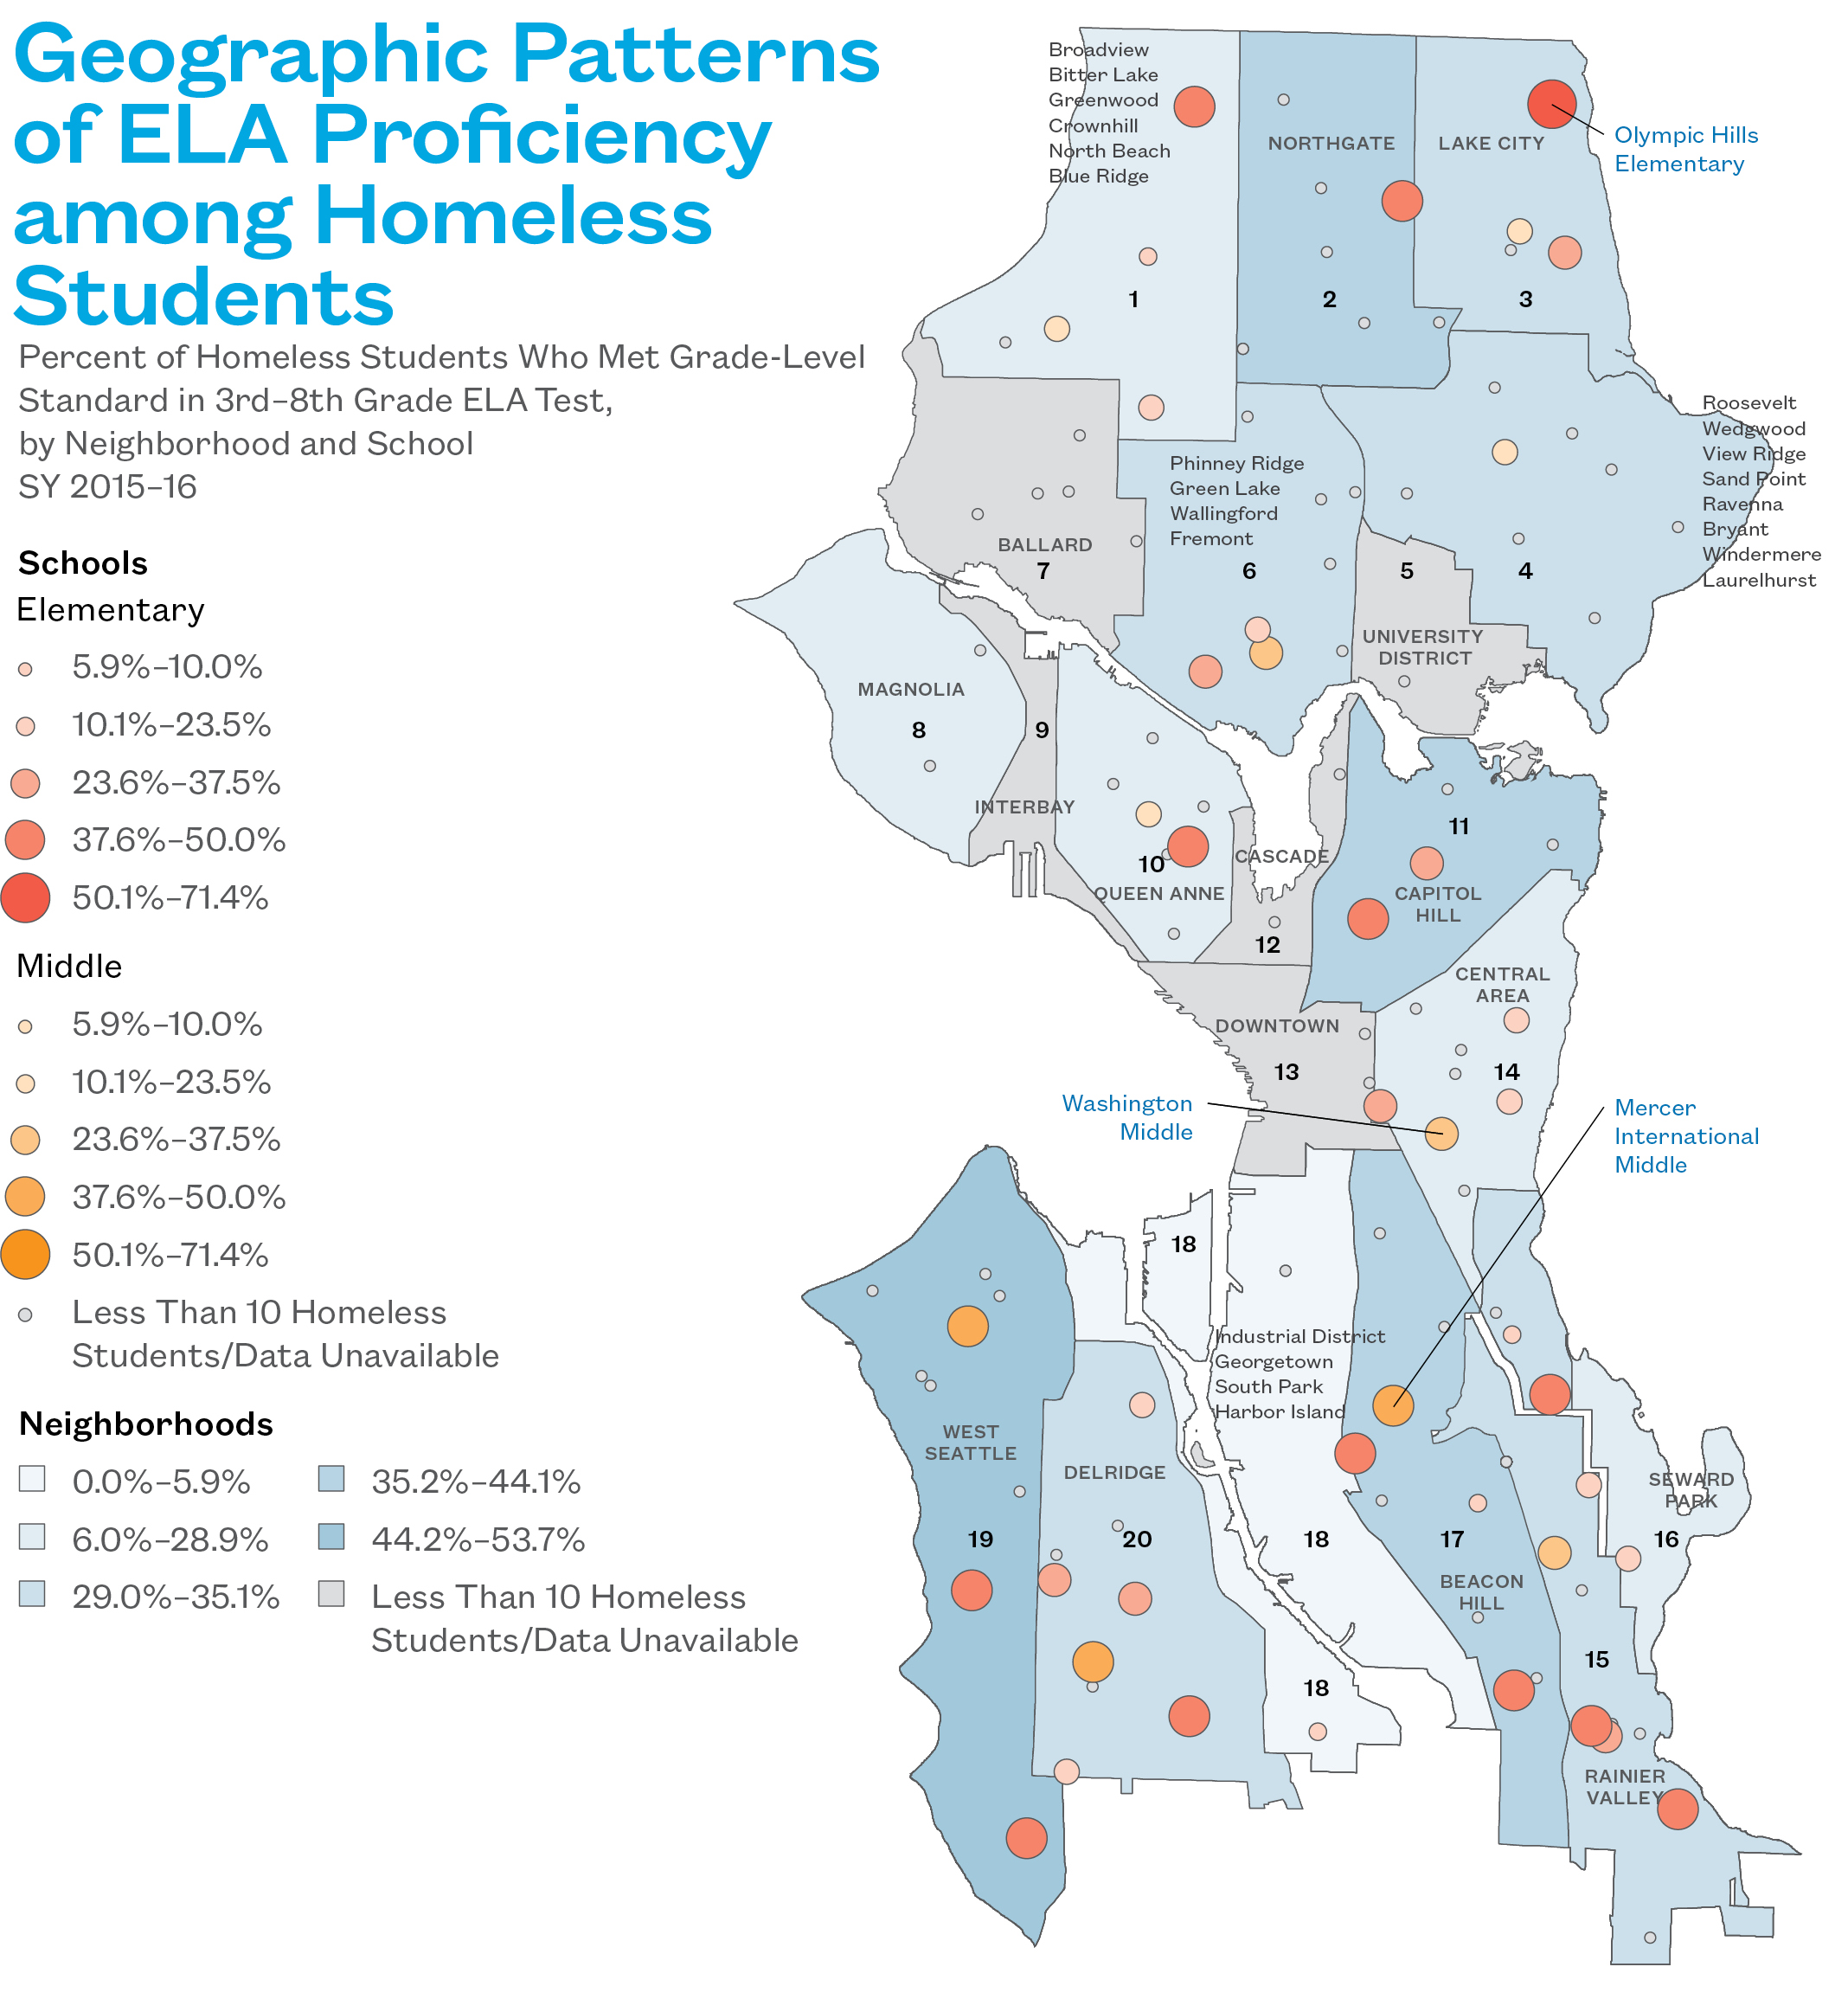
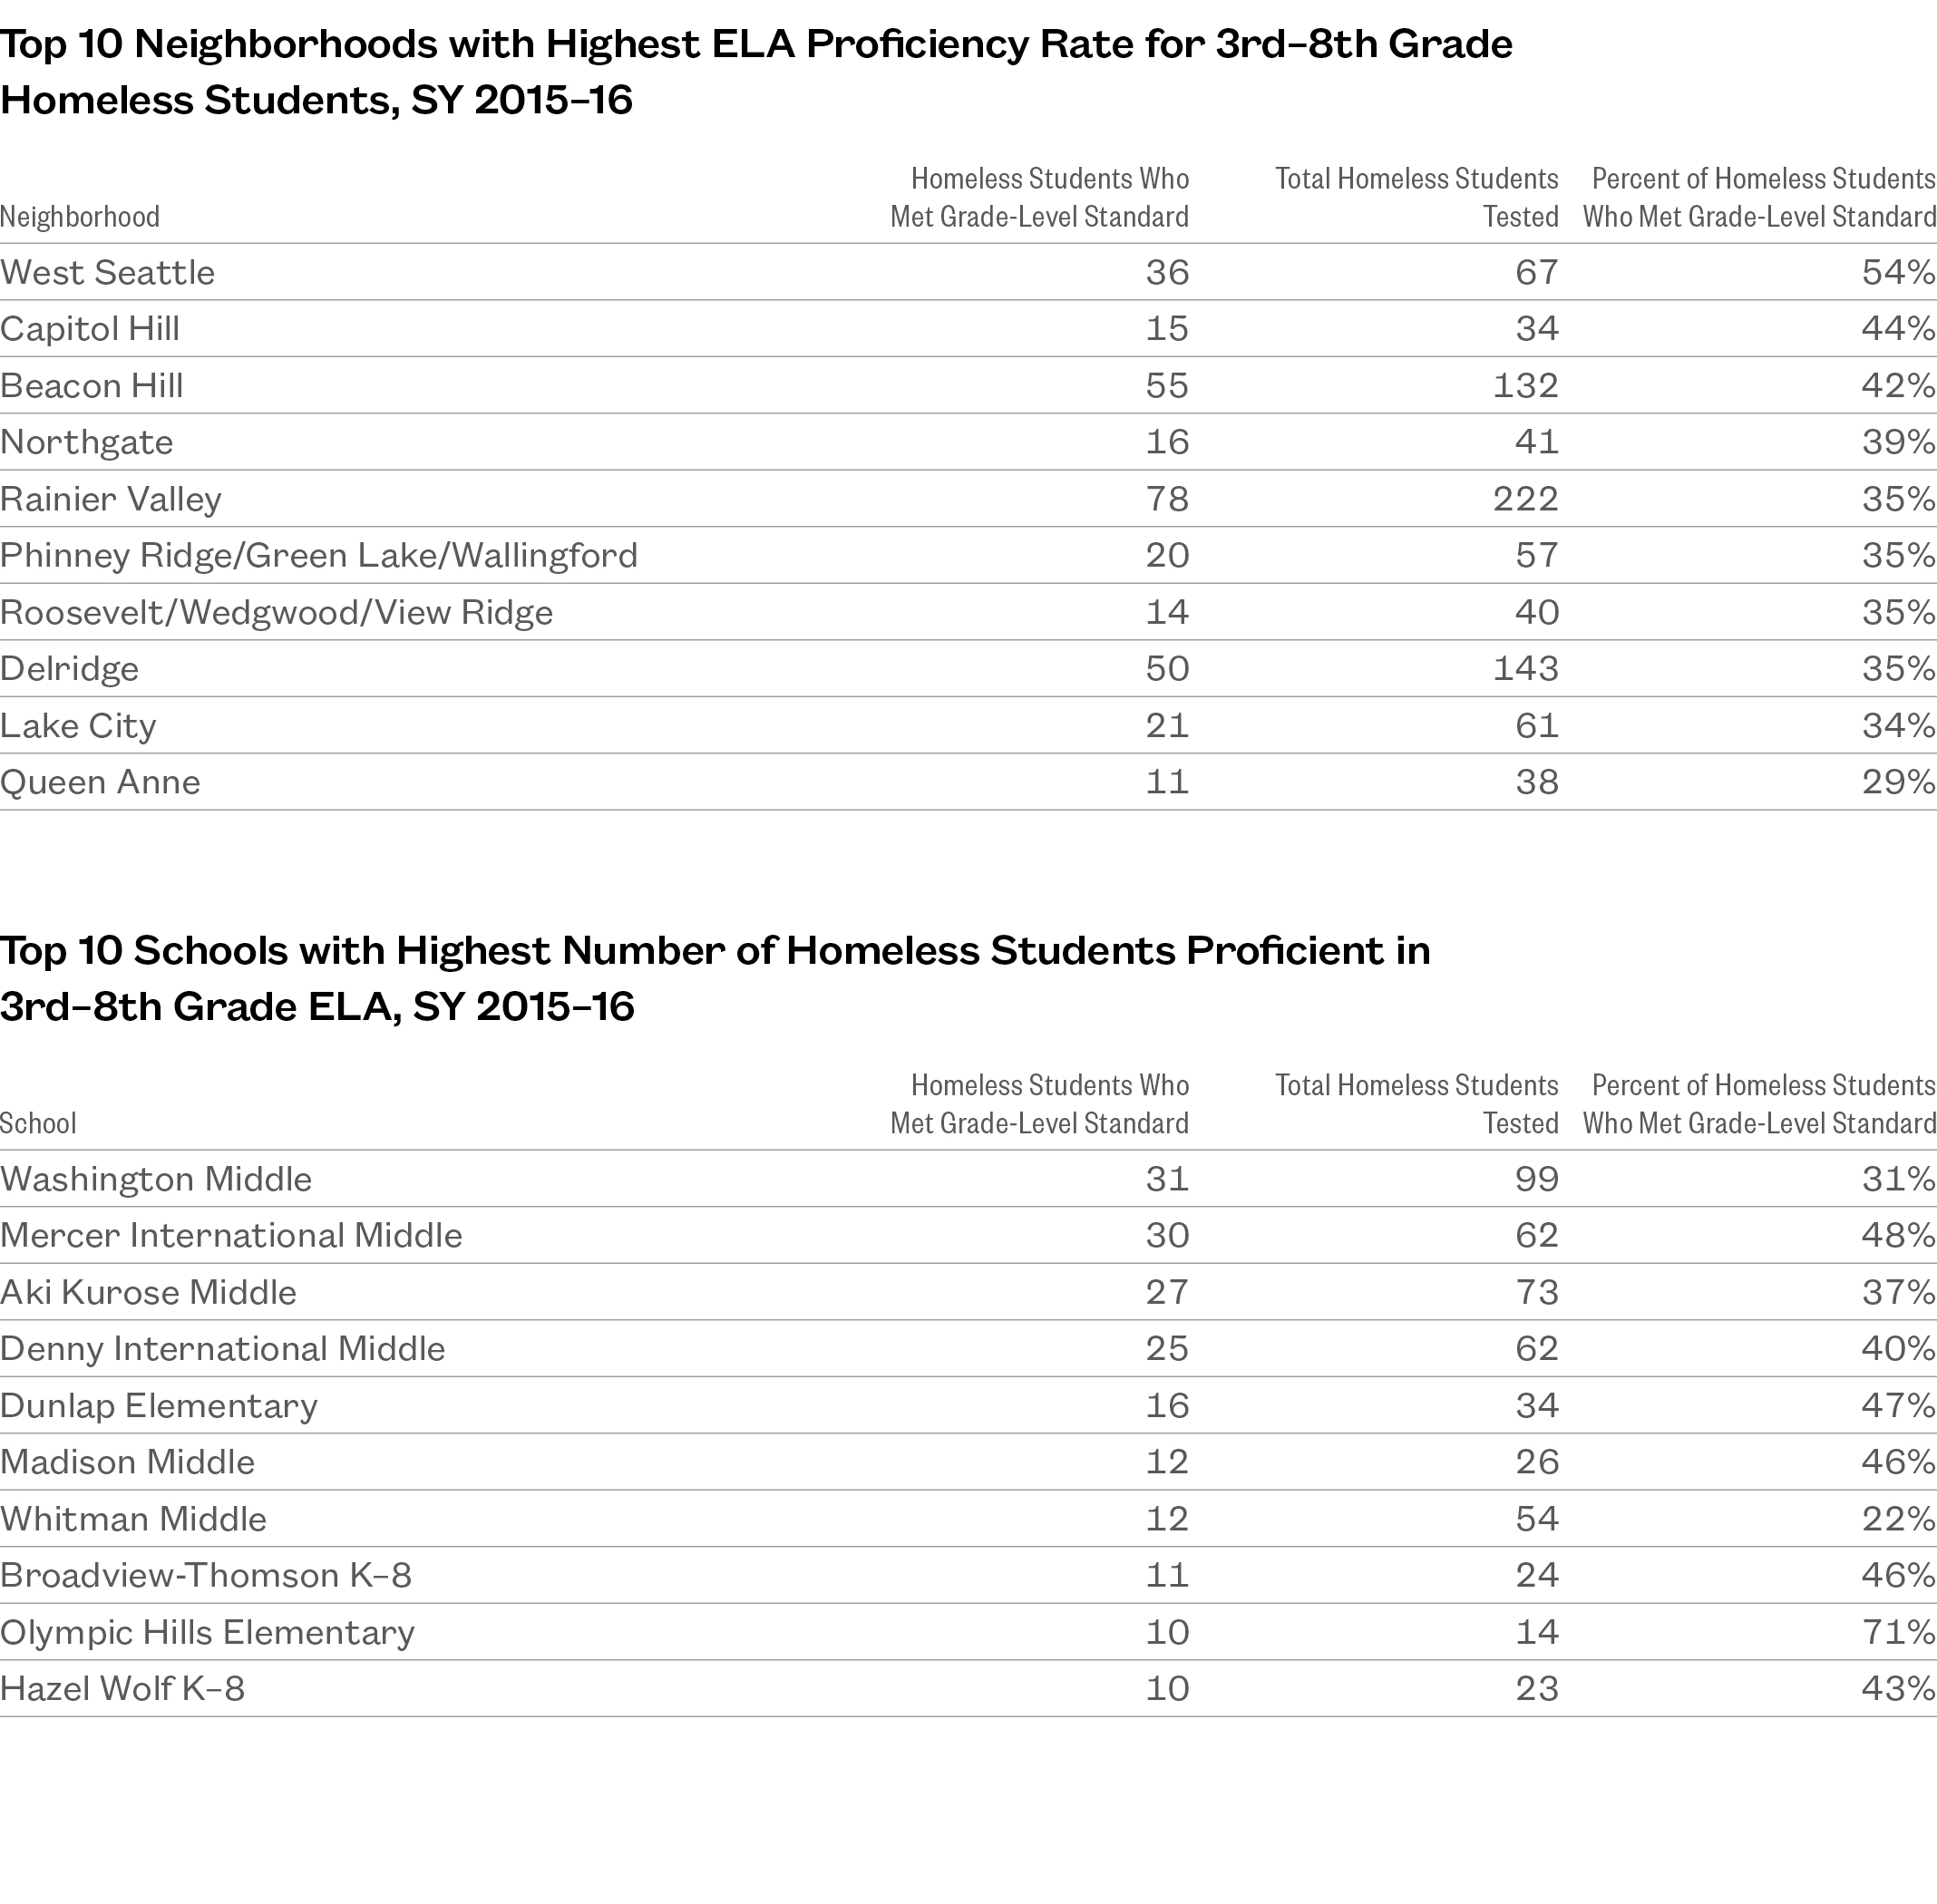
- West Seattle and Capitol Hill had the highest homeless proficiency rates in ELA.
- In the Central Area, where close to 200 homeless students took the ELA exam, only 27% scored at or above the grade-level standard.
- In schools with at least 10 homeless students tested, Olympic Hills Elementary and Mercer International Middle had the highest ELA proficiency rates for their grade levels.
- Washington Middle and Mercer International Middle had the most homeless students who met the standard in ELA.
Geographic Patterns of ELA Proficiency among Homeless Students
Section 4
Homeless Students and School Discipline
The trauma of homelessness can have significant effects on the emotional and mental well-being of students of all ages. In some cases, the negative impact of housing instability on a student’s mental health can lead to disruptive behaviors and other actions detrimental to a safe learning environment for all students. At the same time, there has been an ongoing debate amongst educators about the use of suspensions as a disciplinary measure and the most constructive way to help students with behavioral challenges. Given the other obstacles presented by homelessness, such as absenteeism and a higher rate of mid-year transfers, it is especially important that homeless students are not sidetracked by disciplinary issues and can stay in school as much as possible.
Key Findings
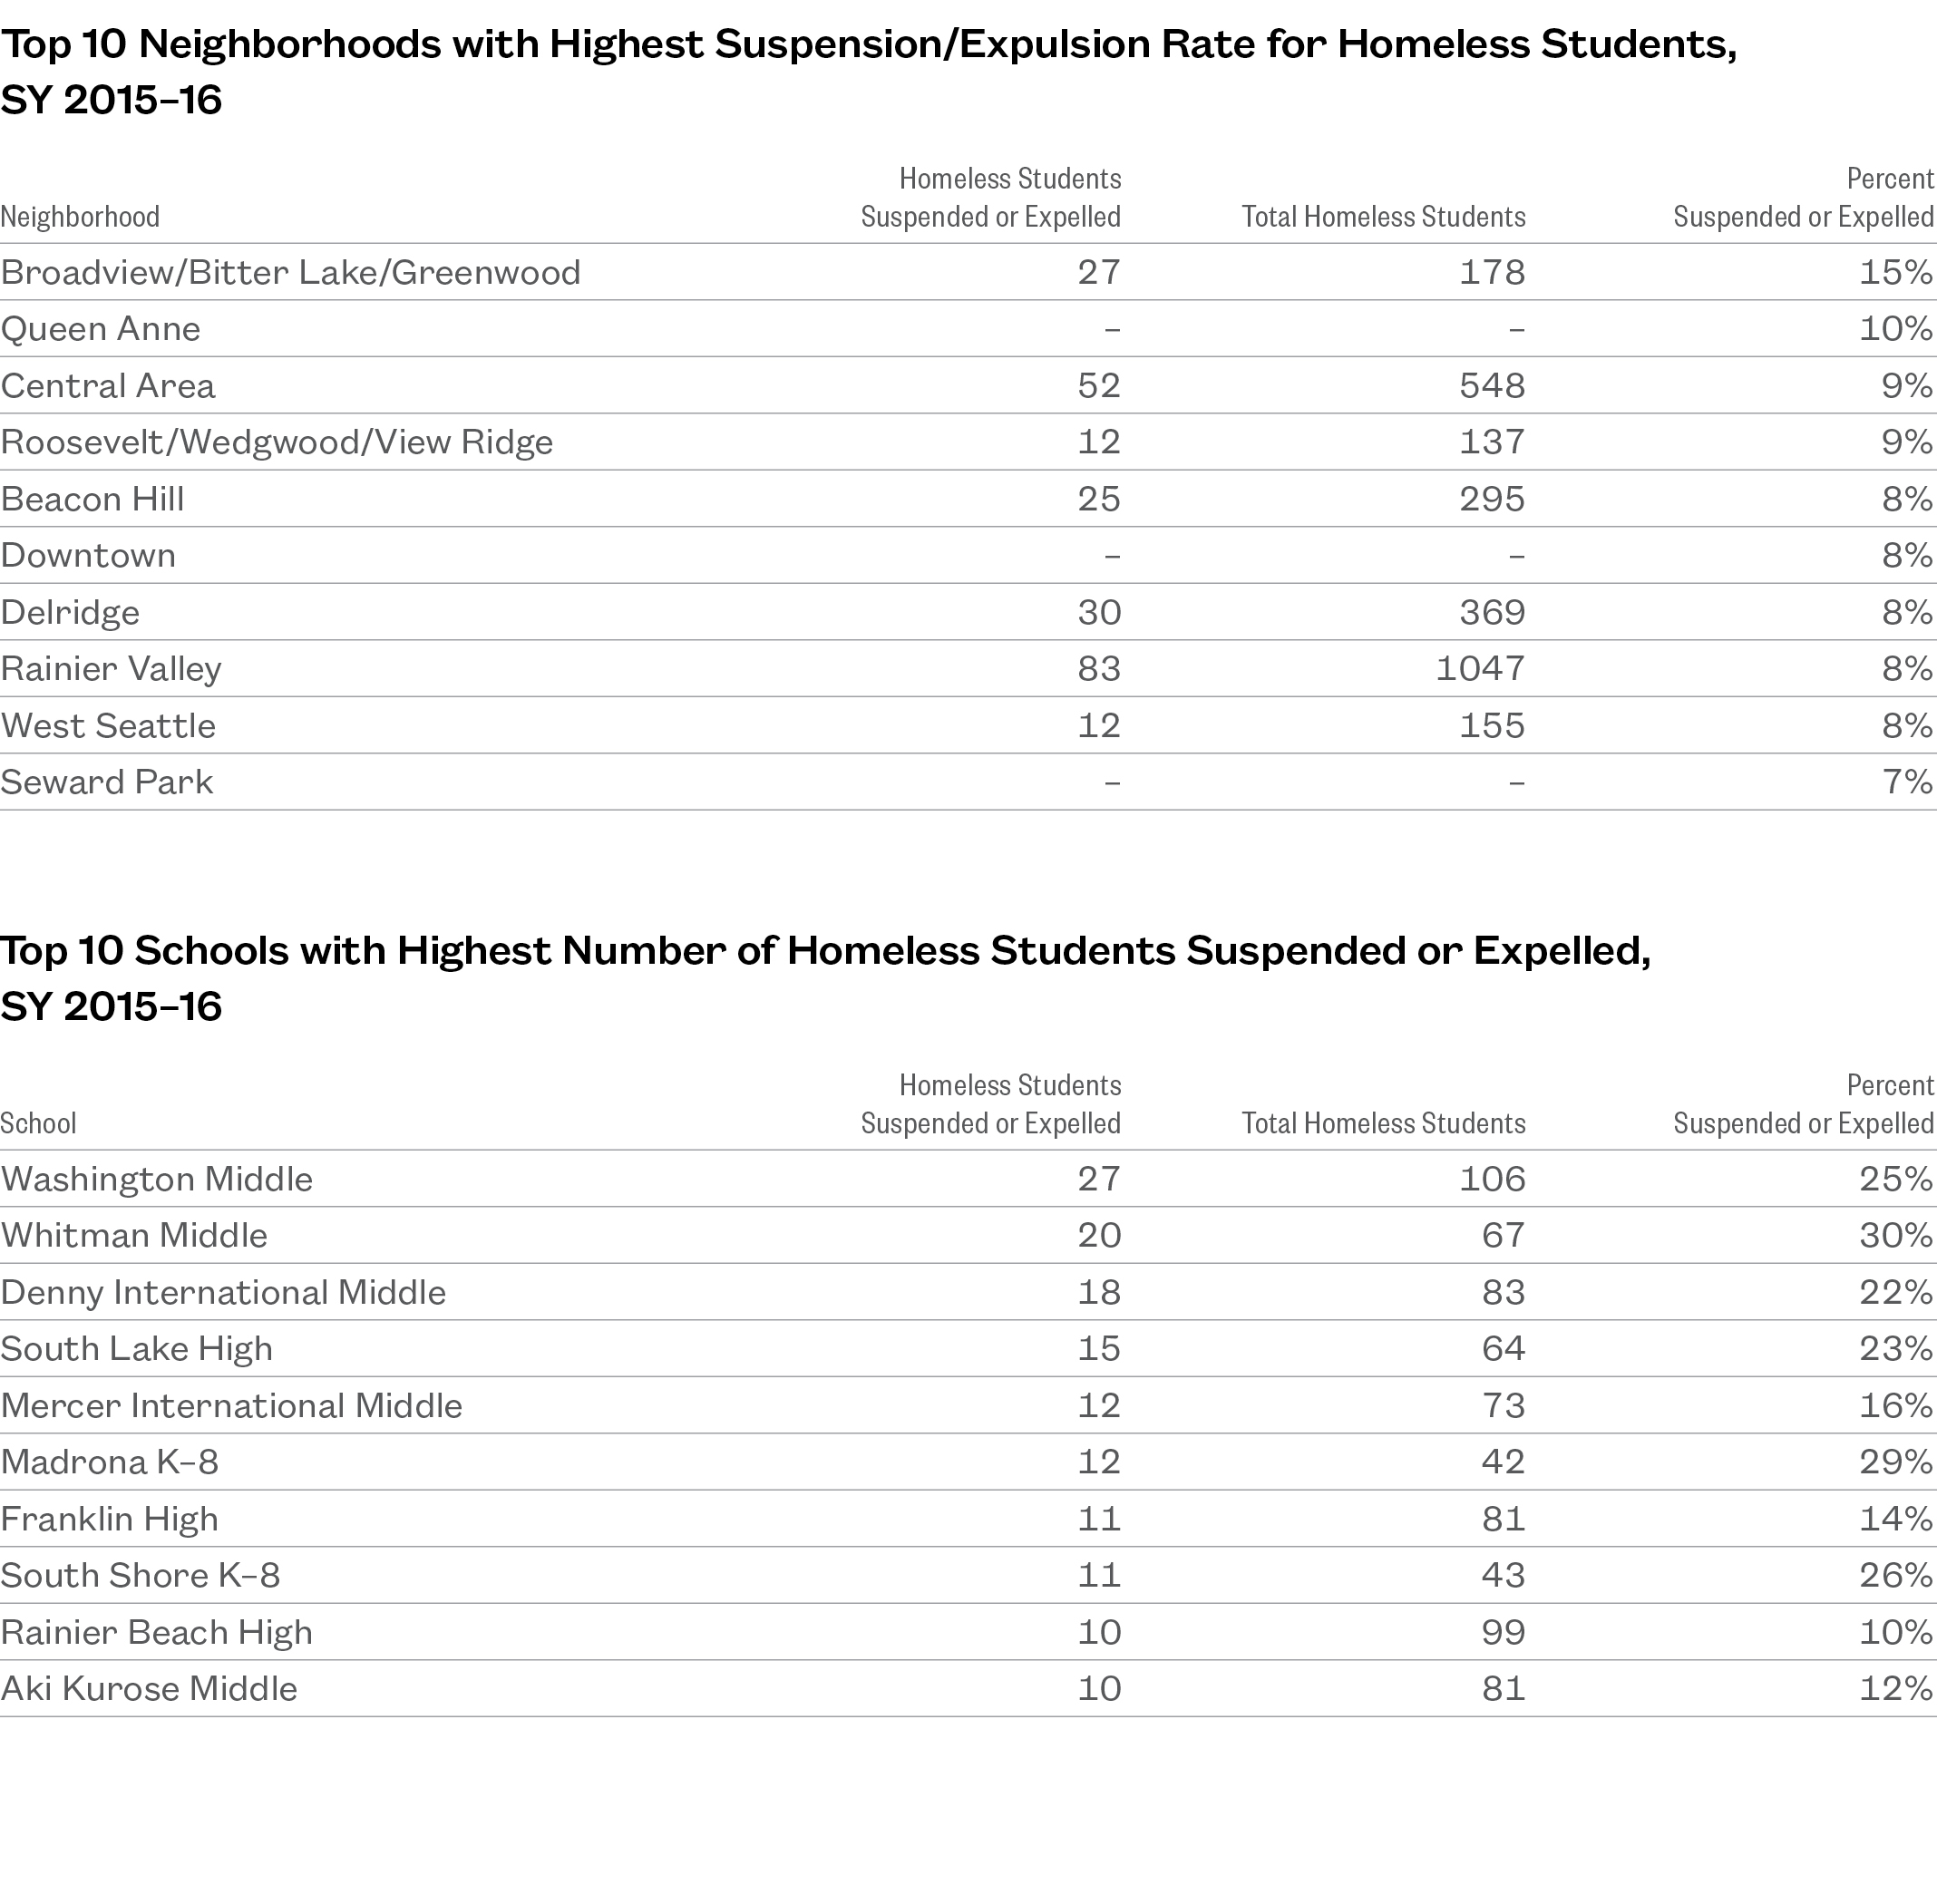
- The Broadview/Bitter Lake neighborhood had the highest suspension/expulsion rate for homeless students.
- Madrona K–8, Denny International Middle, and Franklin High had the highest number of “Exceptional Misconduct” incidents involving homeless students for their grade levels.
- Homeless students were more likely to be disciplined for “Exceptional Misconduct” in elementary school than housed students. They were also more likely to receive a suspension for a less severe “District Offense” than housed students.
Policy Considerations
- The moratorium on suspensions for nonviolent offenses in elementary school benefits homeless students directly, as they are more likely to be disciplined and may already be chronically absent due to homelessness.
- Other steps to address racial disparities in school discipline, such as those outlined by the Race and Social Justice Initiative, will help homeless students. To address the traumatic impact of housing instability and its unique effect on student behavior, additional early-intervention strategies should also be considered.
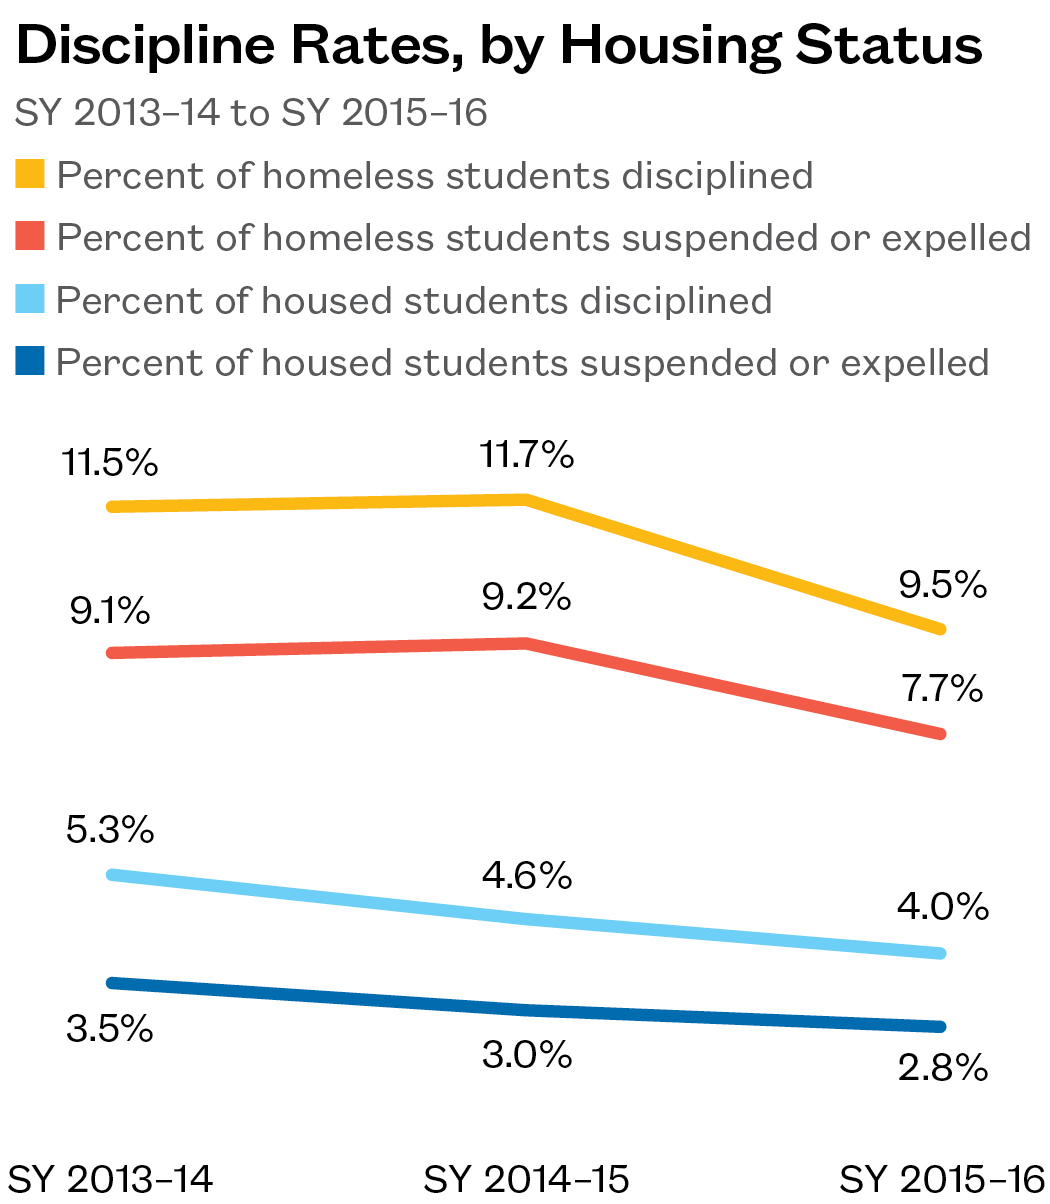
Homeless Students Disciplined at Twice the Rate of Housed Students
- The percentage of homeless students who were disciplined over the course of the school year declined in SY 2015–16. Homeless students were still being cited, however, at twice the rate of housed students.
- Almost 8% of all students who were homeless in SY 2015–16 received a suspension or expulsion.
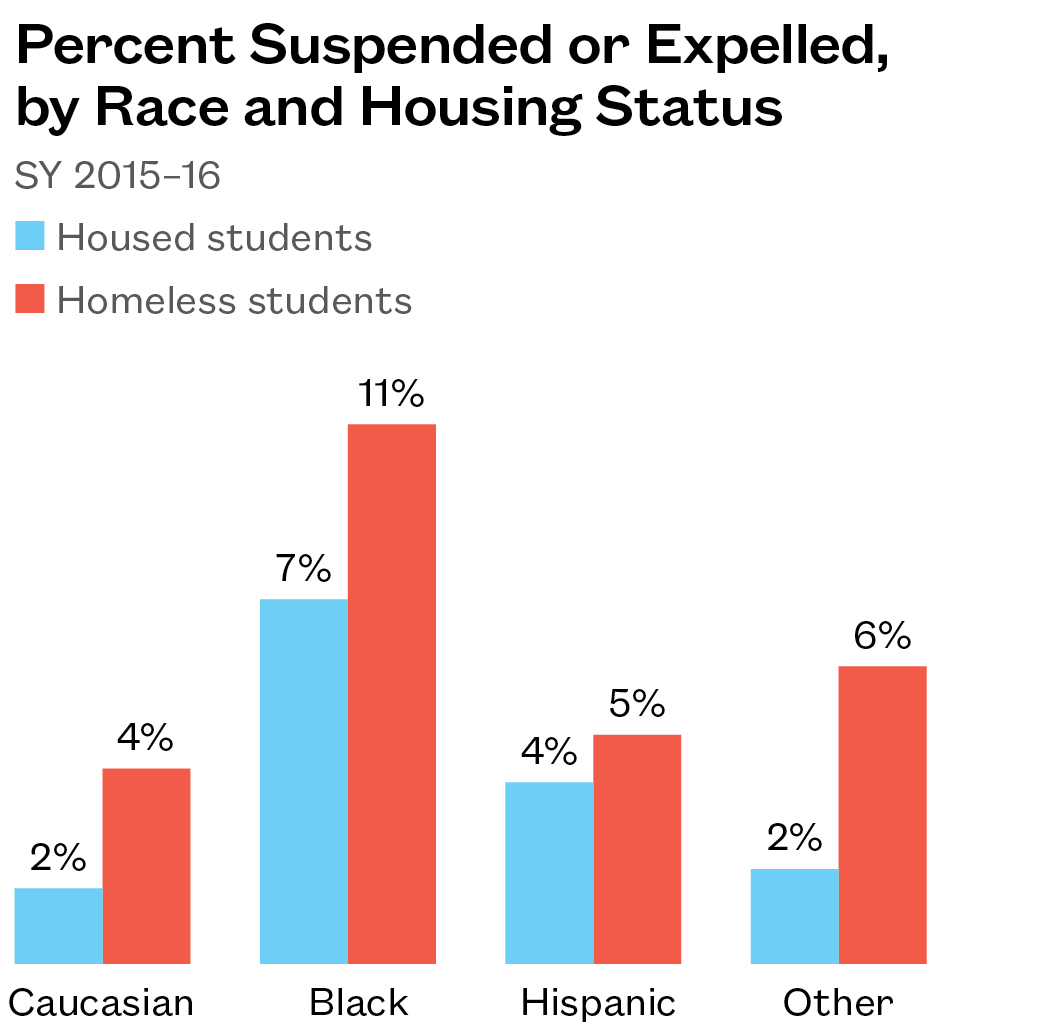
Racial Disparities in Discipline Compounded by Housing Instability
- Nearly 11% of black homeless students received either a suspension or expulsion during SY 2015–16. This is higher than the 7% rate for black students who were housed.
- Addressing racial disparities in school discipline has been a major focus of SPS, with one goal being a reduction in out-of-school suspensions of students. This can be especially important for homeless students, who may not have a place to stay during the day when not in school.
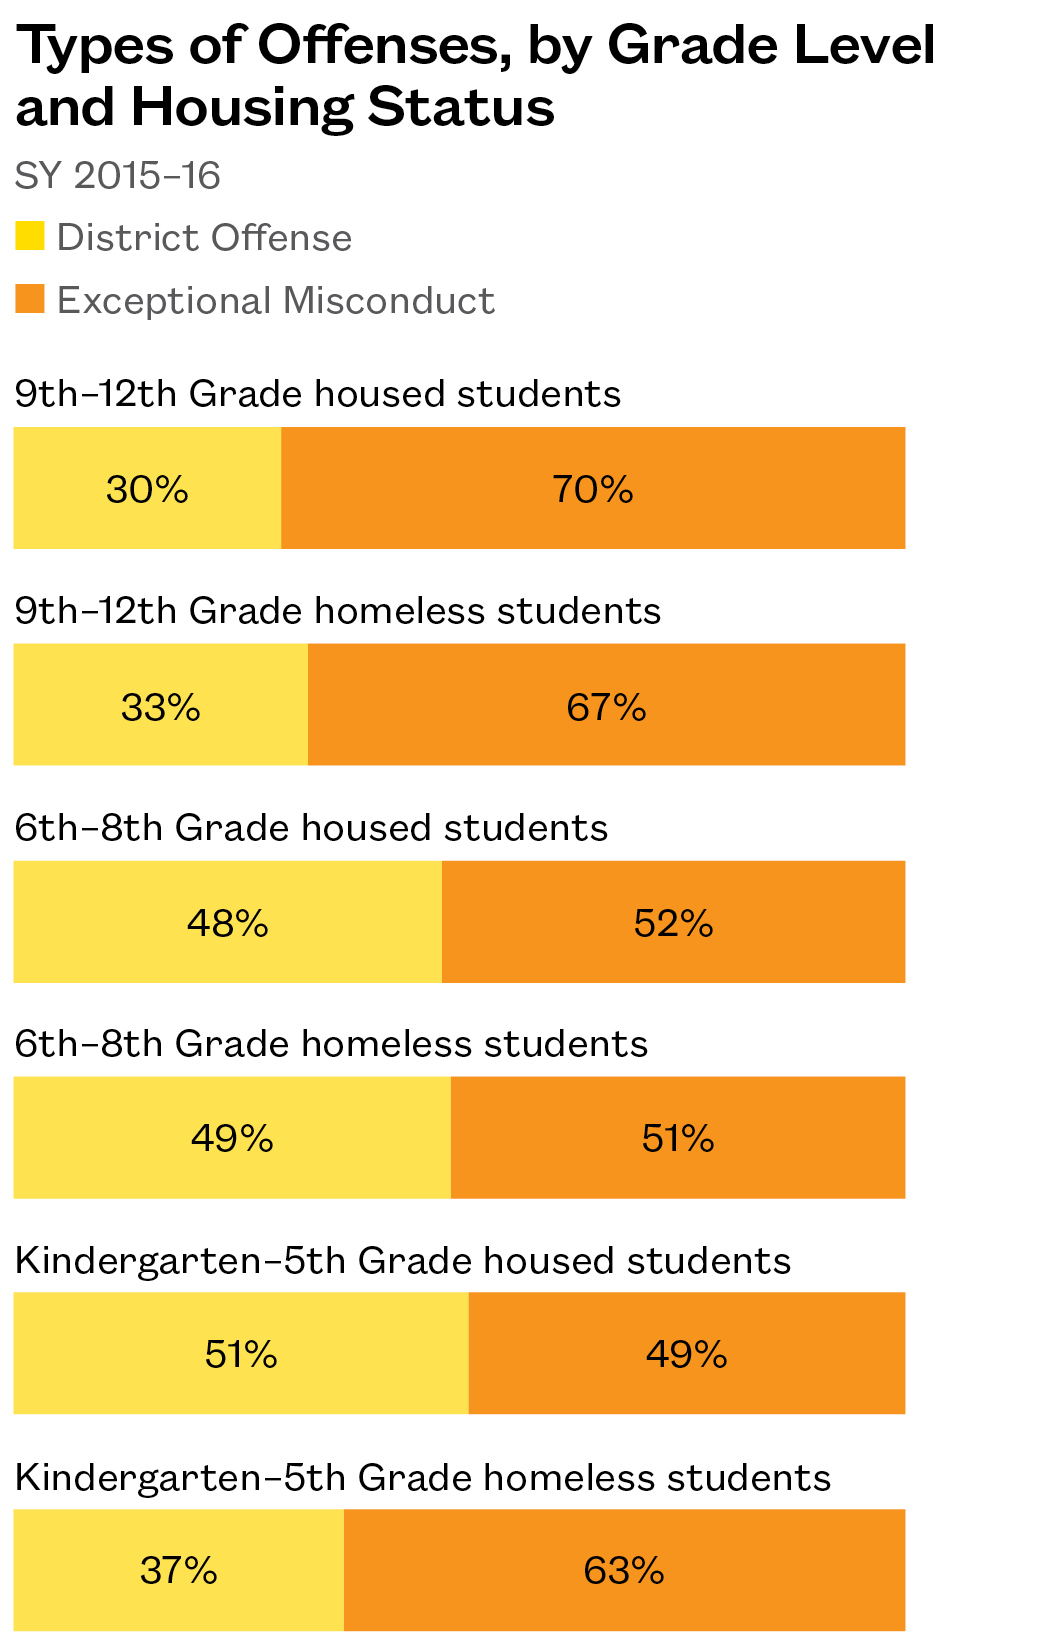
Young Homeless Students Disciplined for More Serious Incidents
- In elementary school, homeless students were more likely to be disciplined for the more severe offenses categorized by SPS as “Exceptional Misconduct.” Sixty-three percent of offenses committed by homeless students in elementary school were in this category.
- In higher grades, homeless and housed students were cited for more serious offenses at about the same rate.
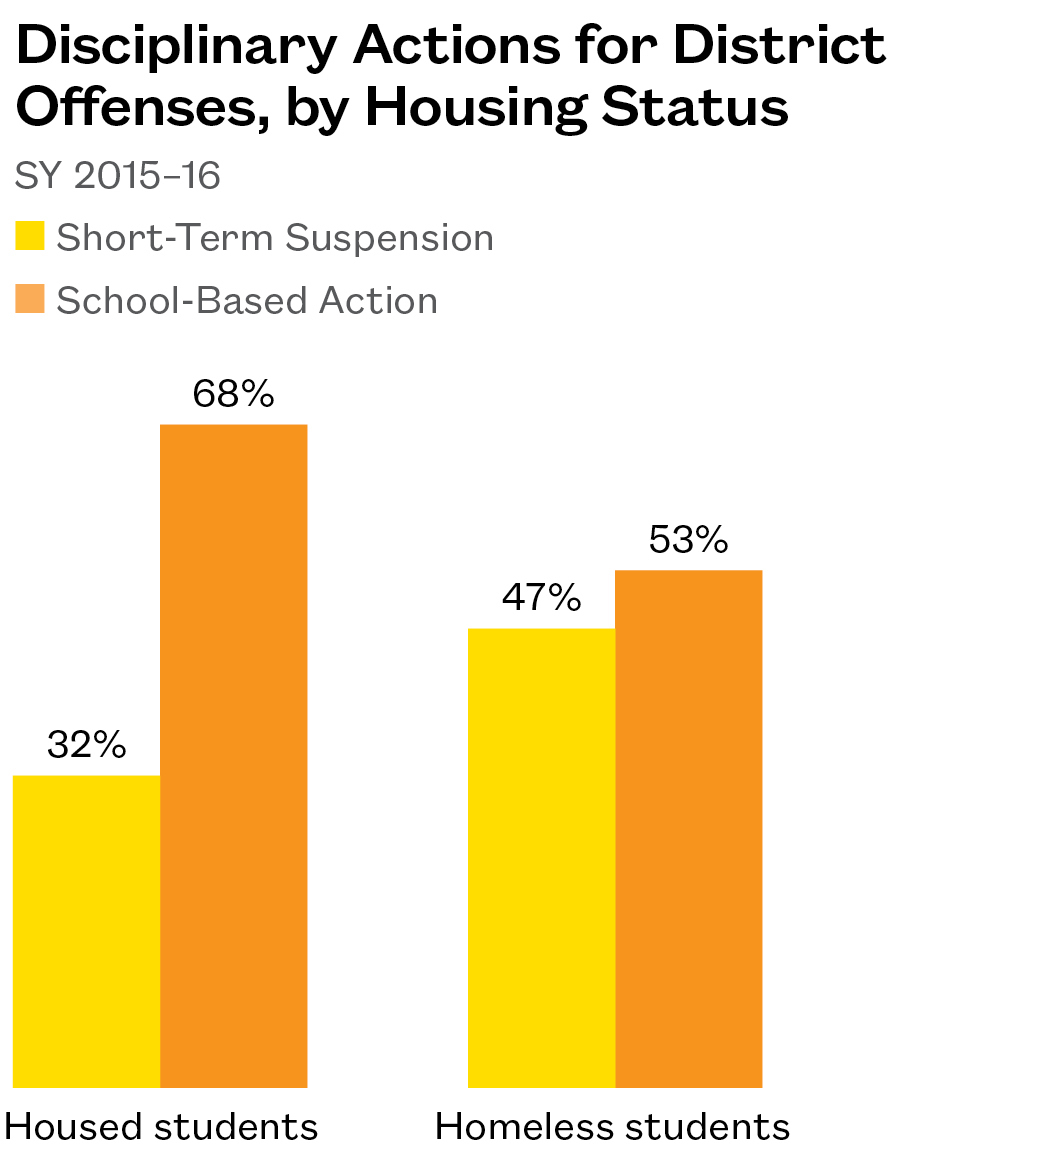
Homeless Students Receive Stronger Penalties for Same Level of Offense
- In SY 2015–16, only 53% of homeless students who were cited for a less severe “District Offense” received a school-based disciplinary action instead of a suspension or expulsion. By contrast, 68% of housed students with a district offense were spared a suspension.
- Forty-seven percent of homeless students who committed a district offense were suspended from school for 10 days or fewer, compared to 32% of housed students.
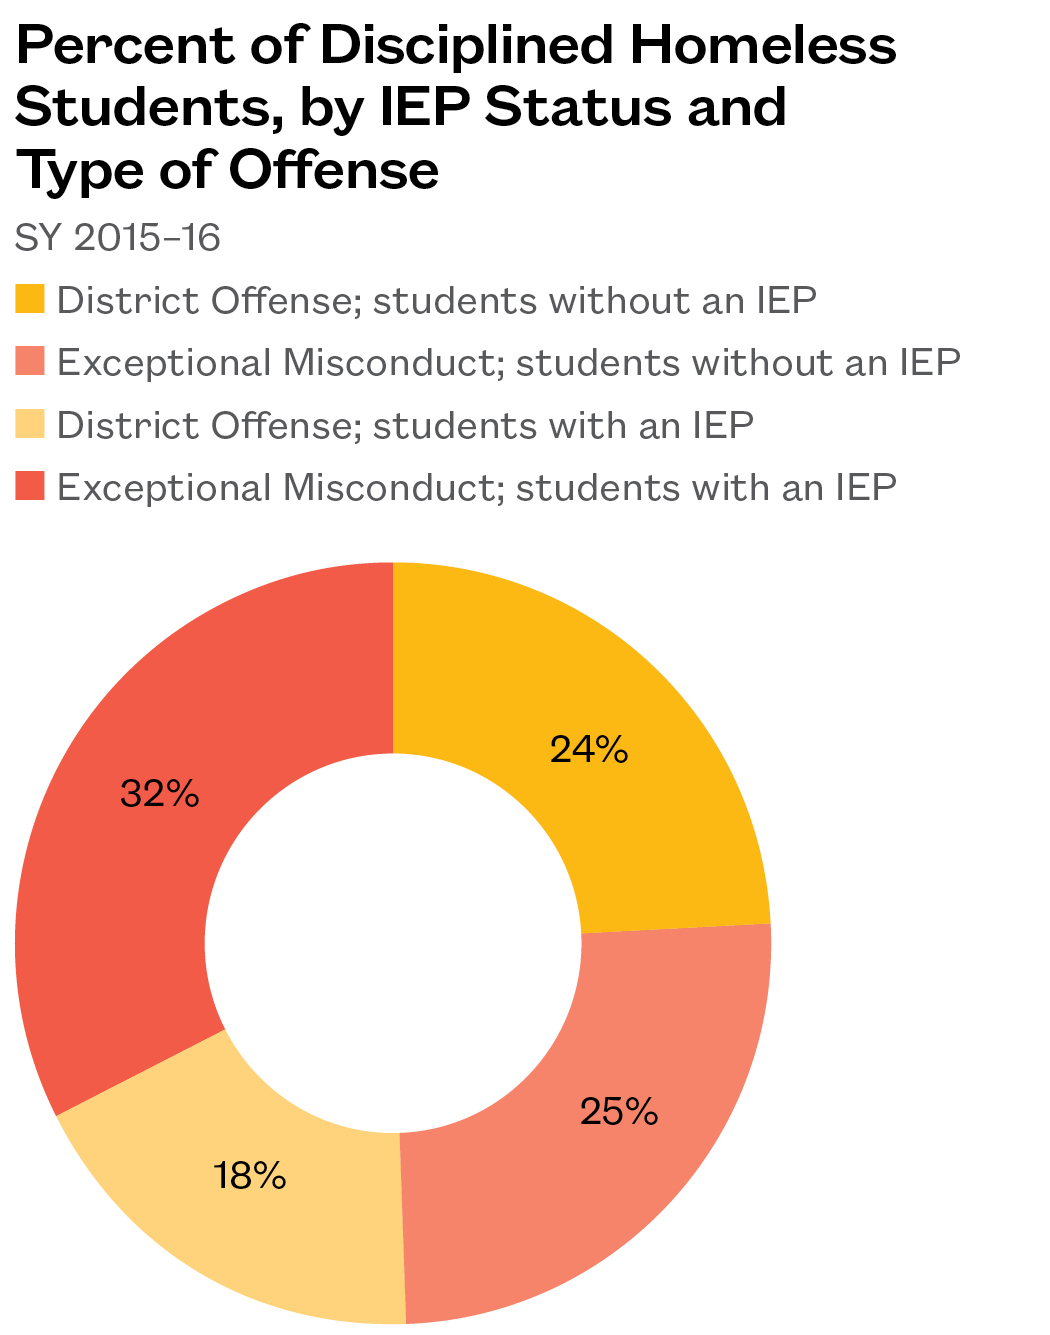
Homeless Students with IEPs More Likely to Be Disciplined
- Just over half of homeless students who received a disciplinary action in SY 2015–16 had an IEP. Students in special education made up only 20% of all homeless students that year.
- Homeless students with IEPs were more likely to be cited for exceptional misconduct. Among disciplined homeless students without an IEP, 51% were cited for exceptional misconduct, compared to 64% among students with an IEP.
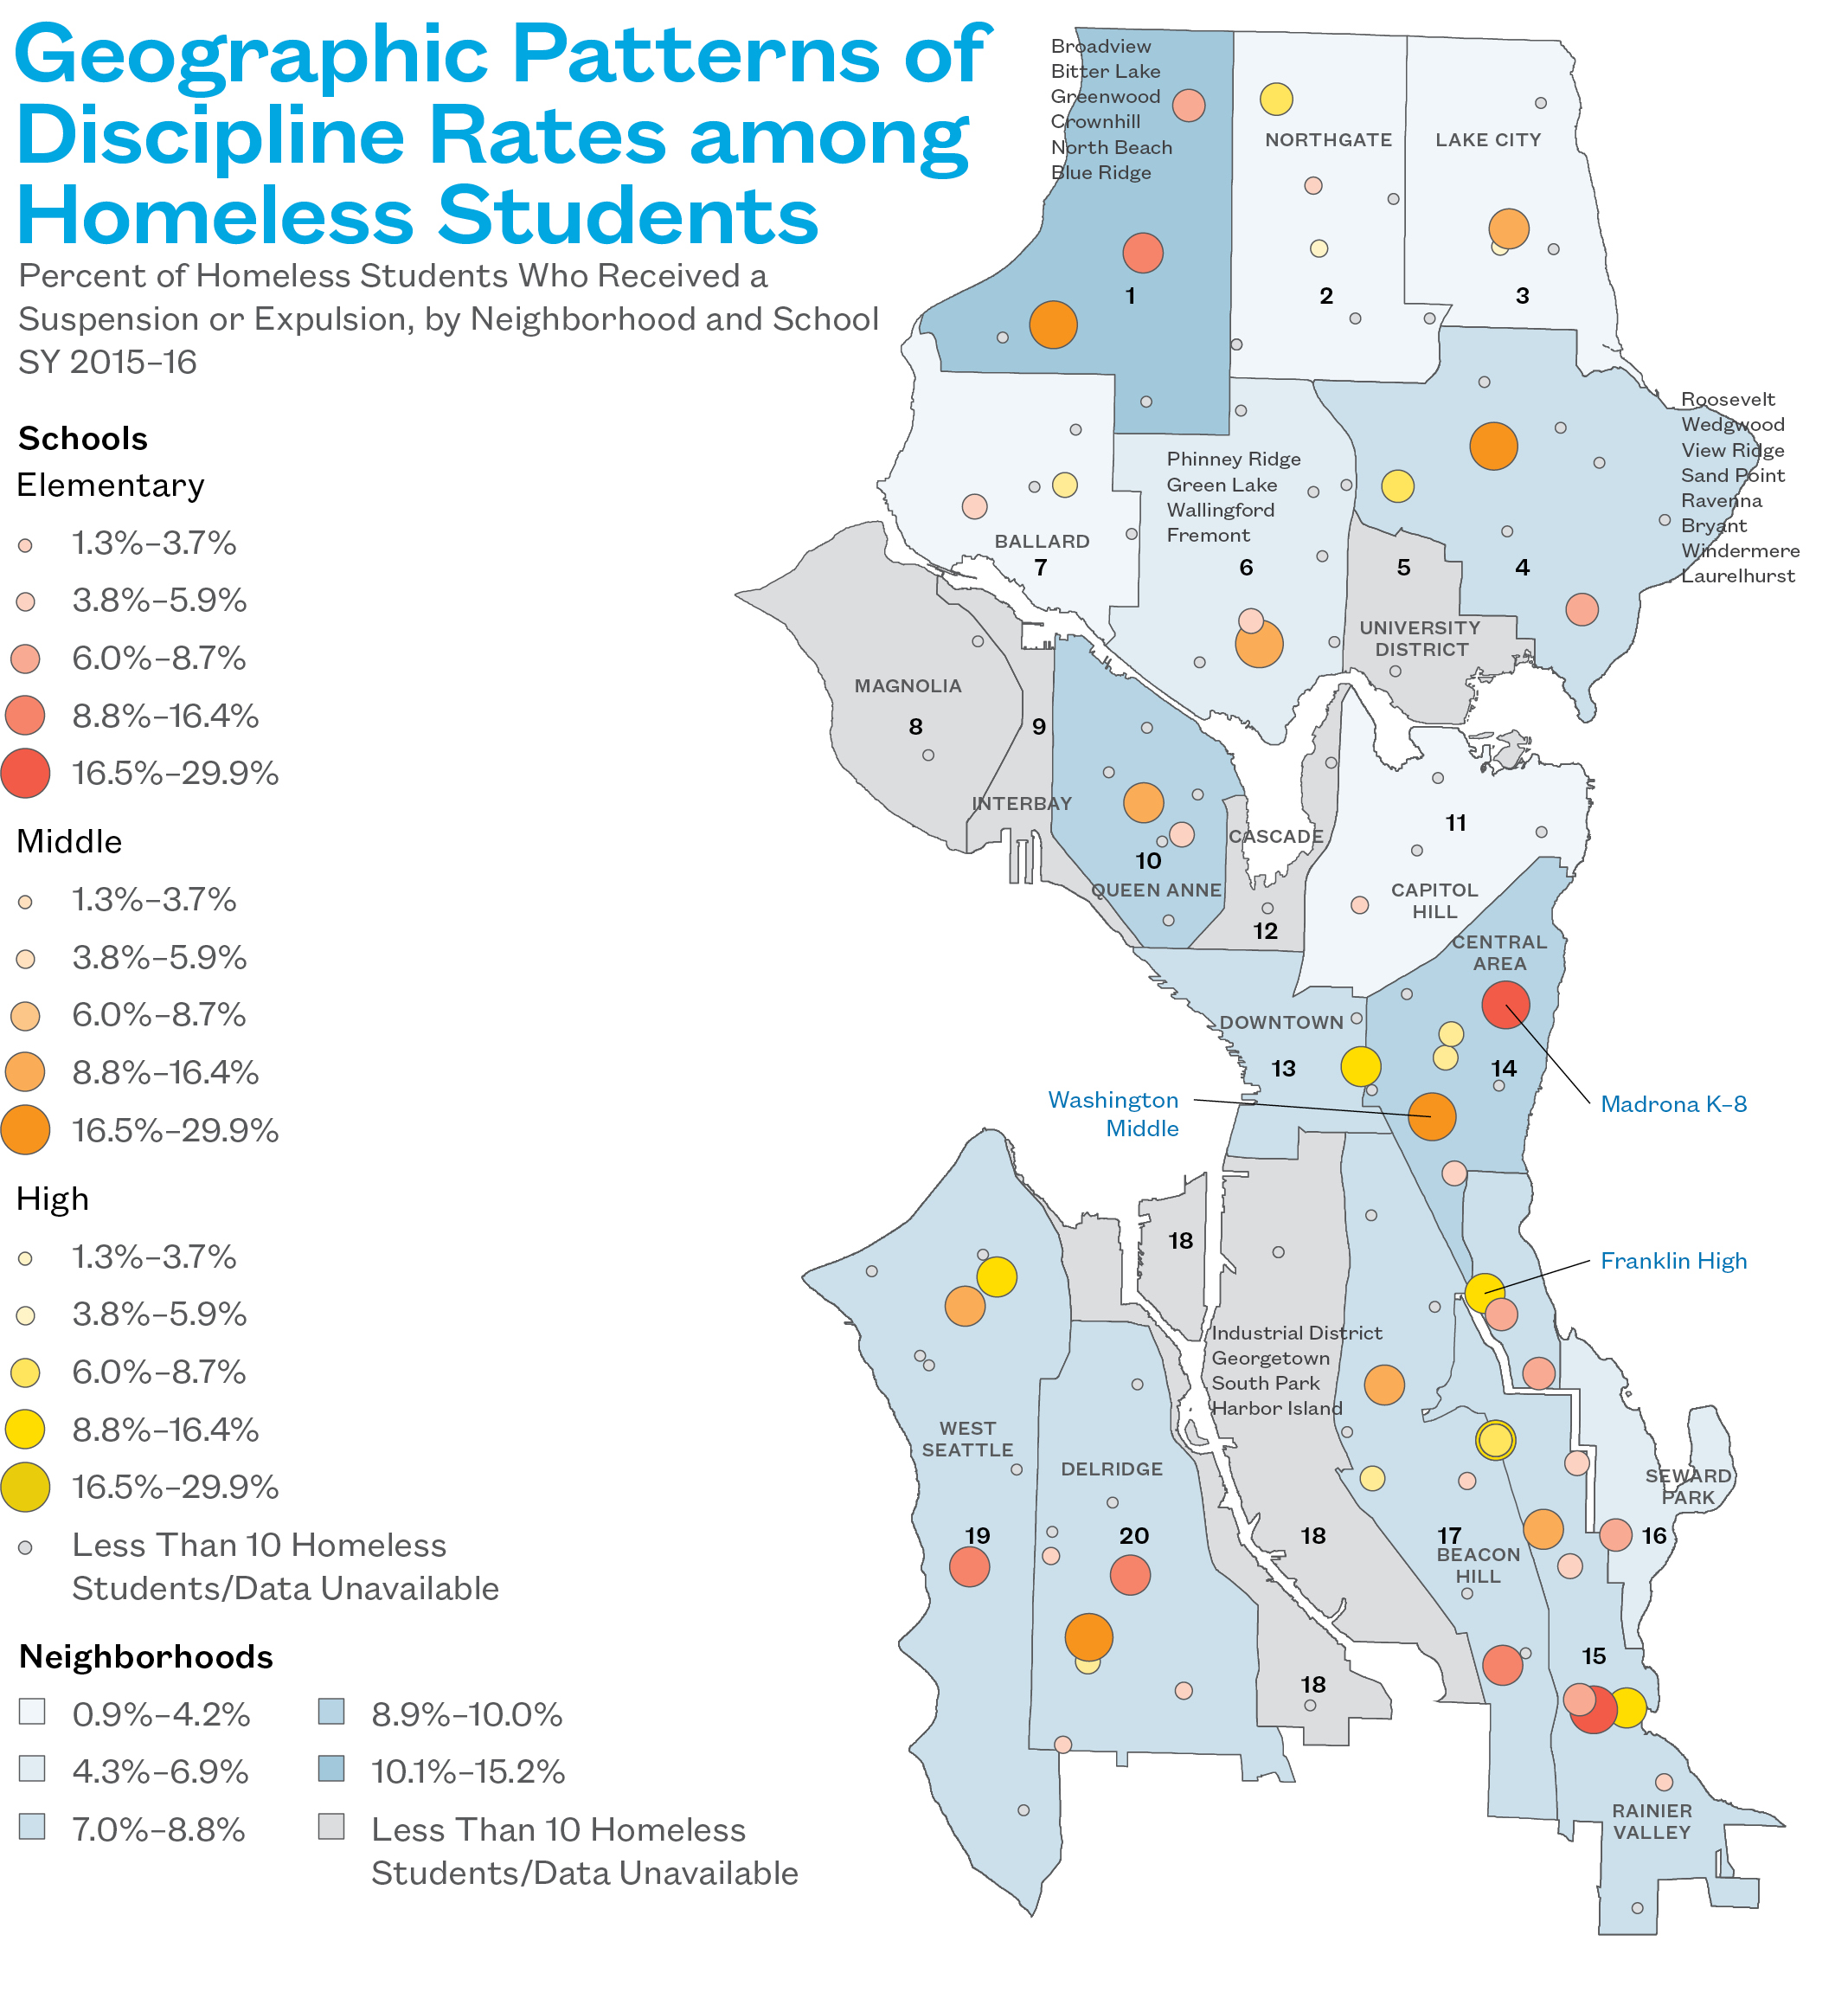
- Fifteen percent of homeless students in the Broadview/Bitter Lake neighborhood were given suspensions or expelled during SY 2015–16.
- Rainier Valley had the highest number of homeless students suspended or expelled, with 83.
- Not counting alternative or service schools, Madrona K–8, Washington Middle, and Franklin High were the schools that suspended or expelled the highest number of homeless students for their grade level.
Geographic Patterns of Discipline Rates among Homeless Students
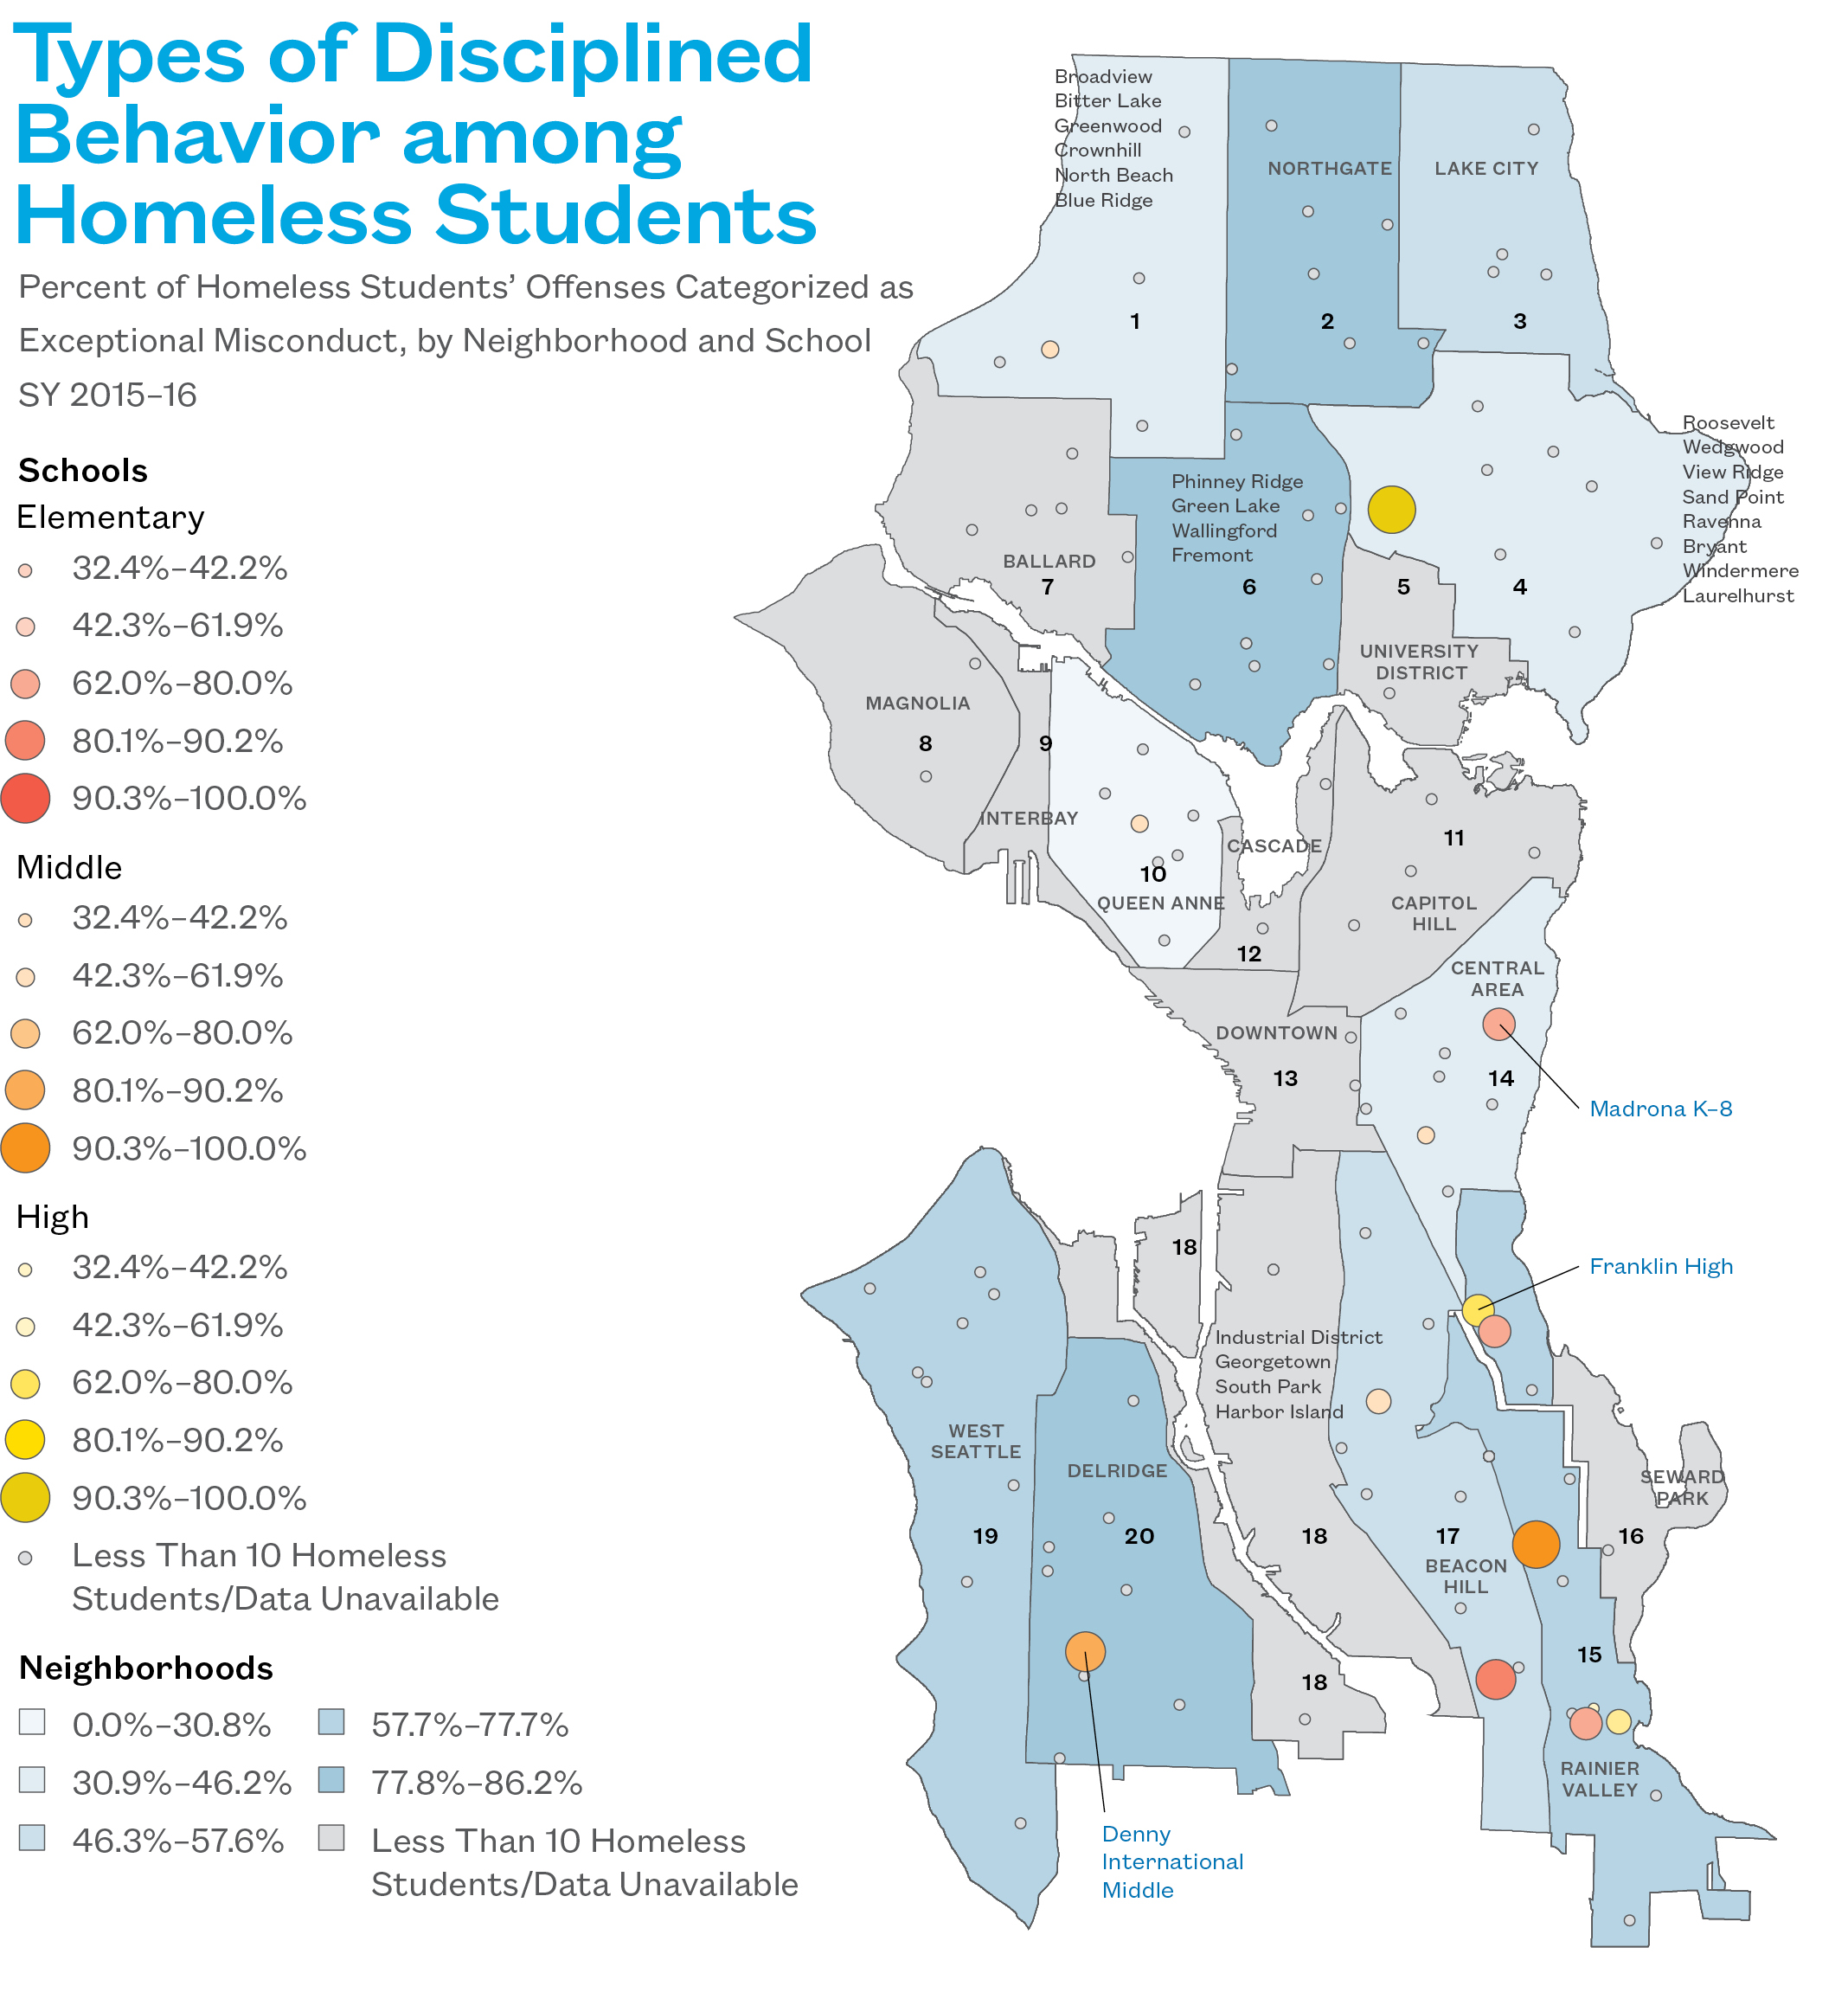
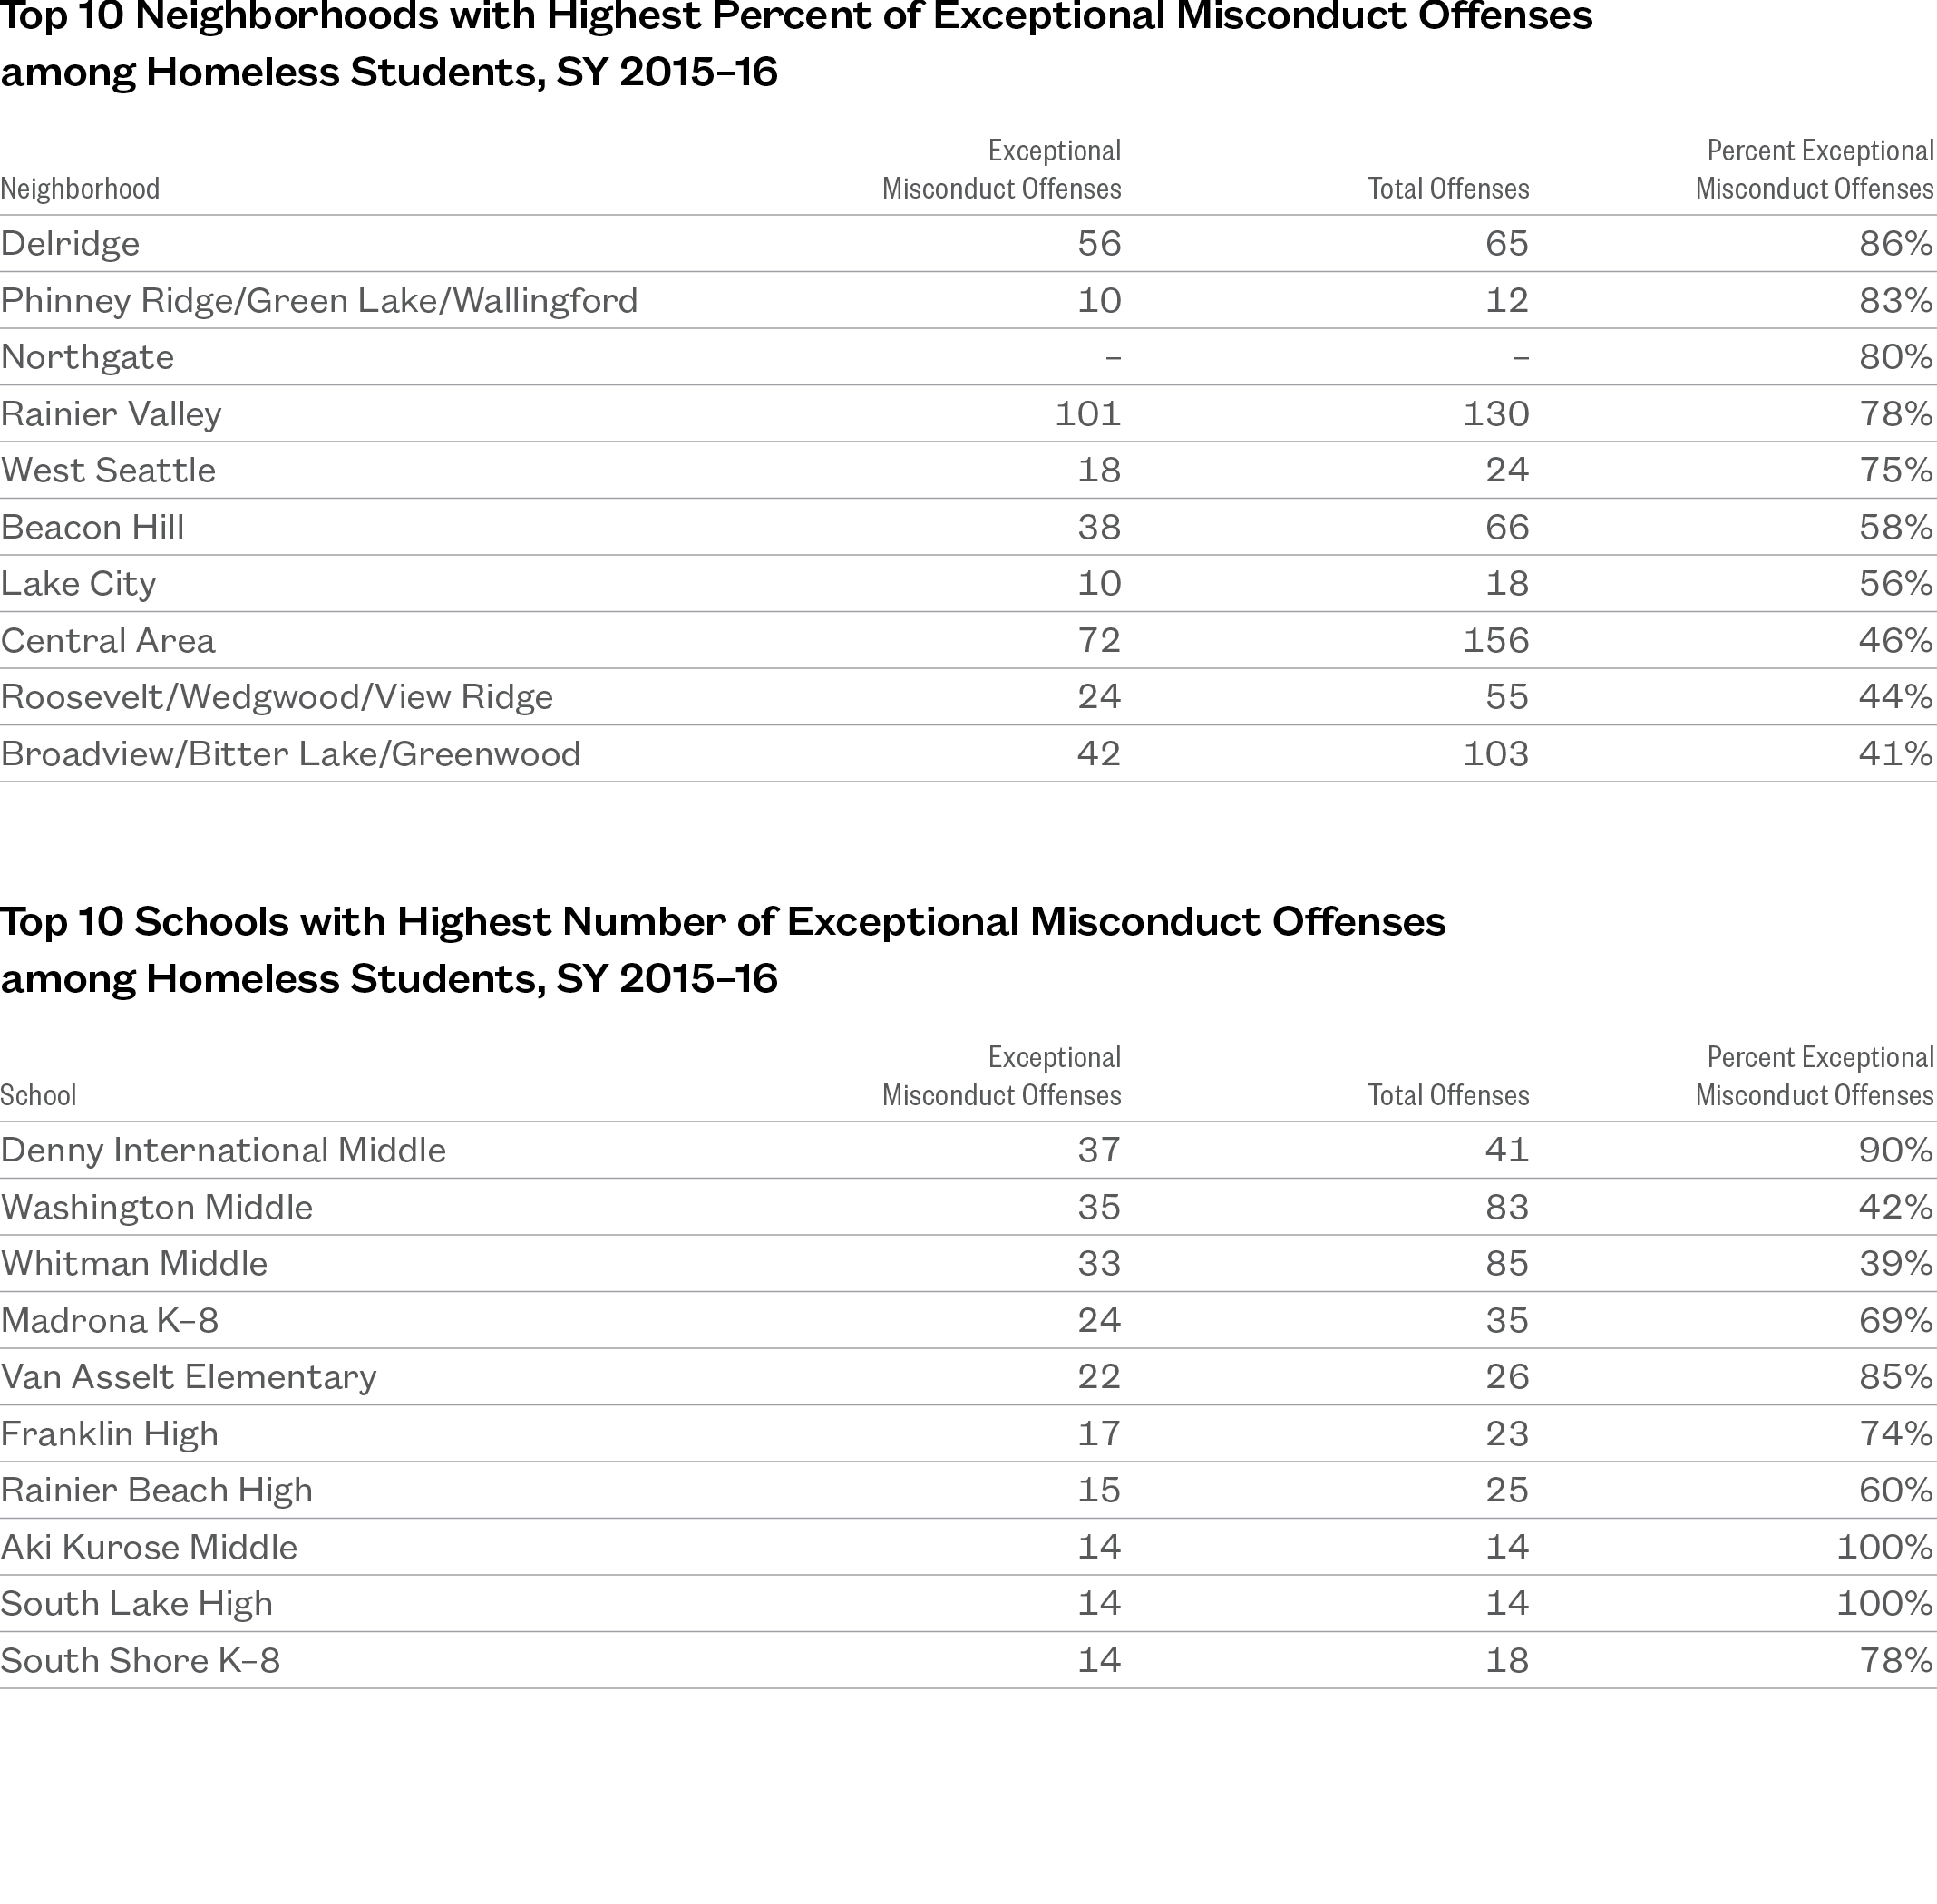
- Over 80% of the disciplinary incidents involving homeless students in Delridge, Phinney Ridge/Green Lake, and Northgate were categorized as “Exceptional Misconduct.”
- Rainier Valley saw the highest number of “Exceptional Misconduct” offenses committed by homeless students, with 101.
- Madrona K–8, Denny International Middle, and Franklin High had the highest number of disciplinary incidents involving homeless students that were categorized as “Exceptional Misconduct” at their respective grade levels.
Types of Disciplined Behavior among Homeless Students
Tune into our webinar on Thursday, December 7th at 10:00 am PST (1:00 pm EST). We will be answering your questions about the Atlas, discussing key aspects of our research, and talking about why we think the issue of student homelessness is so important to Seattle. Register Here.
Methodology and Data Notes
Methodology
Data for The Atlas of Student Homelessness in Seattle were provided by Seattle Public Schools and tabulated by the Institute for Children, Poverty, and Homelessness. Data sets containing de-identified student demographics (including homelessness status), enrollment history, state assessment results, disciplinary records, and primary nighttime residence for homeless students were merged and analyzed using Stata 14 and Microsoft Excel. In cases where records conflicted as to a student’s housing status, the status as recorded in the demographics data set was used.
All analyses comparing outcomes of homeless and housed students were tested for statistical significance using Wilcoxon-Mann-Whitney tests, Kruskal-Wallis tests, and two-sample tests of proportions. Unless noted in the accompanying text or data notes, all differences were statistically significant at the 95% level. Some percentages displayed in charts may not add to 100% due to rounding.
To comply with the Family Educational Rights and Privacy Act (FERPA), which protects the privacy of students’ educational records, all subtotals containing fewer than 10 students in a single category were suppressed prior to publication. In some cases, complementary suppression was used if the inclusion of a data point could lead to the easy calculation of an already-suppressed subtotal of students.
Citywide maps were created in ArcGIS and are included to enable visual comparisons across neighborhoods. The boundaries for neighborhoods shown in this Atlas are the Seattle City Clerk’s unofficial delineation for “large” neighborhoods, used for consistency in archival and record retrieval purposes. Other geographic boundaries were tested during the analysis process but were not chosen either due to their large size and lack of variability (e.g. city council districts, MS/HS attendance zones) or sample size and privacy concerns (e.g. census tracts, “small” neighborhoods).
School location data was downloaded from the Seattle Public Schools website, excluding schools in the Middle College High School and Interagency Academy systems. Addresses were found on these schools’ official websites, and their locations geocoded and merged into the Seattle Public Schools shapefile.
On all maps, natural breaks were used, a method of grouping data with similar values while maximizing the difference between groups.
Schools in data tables were ranked based on raw numbers in order to maximize the amount of information that could be shown without violating privacy standards. Map data, however, was created using the percentage form of a given variable. As a result, there are some points where map highlights and the accompanying table do not show the same “top” school in a given category.
Data Notes
Section 1
Homeless Students’ Primary Nighttime Residence
A student’s primary nighttime residence (PNR) was determined using the “Reported Status” variable of the relevant data set. In four cases, a student recorded as homeless in the demographics data set did not have a reported status for PNR. Fifty-three students who had a reported PNR were not recorded as homeless in the demographics data set and are not included here.
Unaccompanied Youth, by Primary Nighttime Residence
The “Other unaccompanied youth” category includes students who lived in a hotel or motel or were unsheltered.
Number of Years Homeless
The chart includes data from SY 2012–13 to SY 2015–16 for all students who were homeless in SY 2015–16. Students may have experienced homelessness in previous years or in other school districts, which is not shown here.
Section 2
Percent of Students Who Were Chronically Absent, by Housing Status
Students who were recorded as being enrolled but had null or missing data values for days absent or days present were excluded from the analysis.
Chronic Absenteeism Rates, by Grade and Primary Nighttime Residence
Homeless students who were unsheltered or living in hotels/motels were not included in this analysis due to small sample size. The difference in chronic absenteeism rates between sheltered and doubled-up students in 6th–8th grades was not statistically significant.
Percent of Students with a Mid-Year Transfer, by Grade and Housing Status
This chart includes only students who transferred to a different school within SPS. Students who transferred into or out of SPS from other school districts are not shown here.
Section 3
Proficiency Rates, by Housing Status and Year
Measurements of Student Progress (MSP) was the Washington State standardized assessment prior to SY 2014–15, when it was replaced with the Smarter Balanced Assessment (SBA). SBA uses Common Core standards to evaluate student proficiency in 3rd–8th grade math and ELA.
3rd–8th Grade Test Performance Levels, by Housing Status
This analysis does not include students who were exempted from testing, received a “No Score,” or were enrolled in special education and received a “Basic” proficiency score. Students were exempted from testing due to not being enrolled during the testing window, being partially enrolled, being medically exempt, having previously passed, or having a “New Non-English Proficient” status. Students received a “No Score” designation if no test booklet was submitted, they were enrolled in school but not tested, they tested out of grade level math and ELA, or their tests were incomplete, insufficient, or invalidated. Percentages may not add to 100% due to rounding.
Math and ELA Proficiency Rates for Homeless and Low-Income Students, by Grade Level
Low-income data are from the Office of Superintendent of Public Instruction, “Washington State Report Card,” reportcard.ospi.k12.wa.us, accessed October 11, 2017. Homeless students are included in the larger low-income category. Due to the use of different data sources, the two groups cannot be separated. The difference in test scores on the 5th-grade ELA exam was not statistically significant.
Proficiency Rates, by Race/Ethnicity
This analysis does not include American Indian, Asian, Multiracial, or Pacific Islander students due to small sample size.
Proficiency Rates, by Primary Nighttime Residence and Grade Level
Homeless students who were unsheltered or living in hotels/motels were not included in this analysis due to small sample size.
Section 4
Discipline Rates, by Housing Status
Students are included as having a suspension or expulsion if they were suspended or expelled any time during the school year, regardless of whether they also received any other type of disciplinary action.
Percent Suspended or Expelled, by Race and Housing Status
The “other” category includes multiracial, Asian, American Indian, and Pacific Islander students. There were 11 offenses in SY 2015–16 that were coded as neither District Offense nor Exceptional Misconduct; these were not included here. The difference in rates among Hispanic students was not statistically significant.
Types of Offenses, by Grade Level and Housing Status
Differences in rates of Exceptional Misconduct between homeless and housed students were not statistically significant for 6th–8th and 9th–12th grades.
Disciplinary Actions for District Offenses, by Housing Status
School-based actions include the following: Interim Alternative Education Setting, Office Referral, Alternatives to Suspension, and other actions. Short-term suspensions are one to 10 days long.
Geographic Patterns of Discipline Rates among Homeless Students
The neighborhood and school of attendance used here were those in which students were enrolled at the end of the school year.
Ralph da Costa Nunez, PhD, President and CEO
Liz Cohen, Chief of Staff
Frederick Joseph, Director of Communications and External Affairs
Project Team:
Josef Kannegaard, Principal Policy Analyst
Kristen MacFarlane, Senior GIS Analyst
Chloe Stein, Policy Analyst
Amanda Ragnauth, Policy Analyst
Alexander Guinn, Policy Associate
Graphic Design by Michael Bierman Graphic Design
A special thank you to:
Seattle Public Schools
Seattle Mayor’s Office Innovation Team
ICPH is an independent, New York City-based public policy organization that works on the issues of poverty and family homelessness.
For questions or additional copies contact:
media@ICPHusa.org
212-358-8086