Student Homelessness Snapshot
May 2017
This snapshot is part of a series analyzing student homelessness in all 50 states and the District of Columbia. Visit www.ICPHusa.org for more information.
- In the 2014-15 school year, Virginia had 1,280,381 students enrolled in 132 local education agencies (school districts).1
- That year, there were 17,876 homeless students in the state, making up 1.4% of total enrollment.2
- Virginia had the 23rd highest number of homeless students and the 42nd highest rate of student homelessness in the U.S.
- School districts with the highest rates of student homelessness were Colonial Beach Public Schools (21%) and Northampton County Public Schools (17%), 15 times and 12 times the statewide rate, respectively.
Figure 1
Number of Homeless Students and Percent Living Doubled Up3
By School District, SY 2014–15
In its definition of homelessness, ED includes students who are “doubled up,” or have no option but to stay with others in overcrowded, often unsafe living conditions.
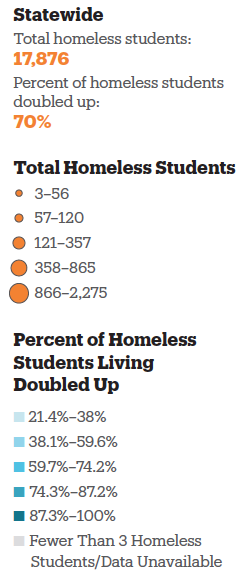
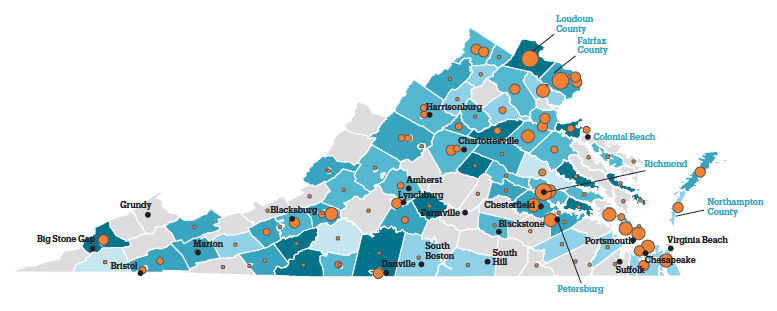
- Three school districts had over 1,000 homeless students (Fairfax County, Loudoun County, and Richmond City). In three school districts, over 10% of students were homeless (Colonial Beach, Northampton County, and Petersburg City).
- In 16 school districts, over 88% of homeless students were sleeping in a doubled-up living arrangement. Two school districts had over 1,000 homeless students living in doubled-up conditions (Fairfax and Loudoun Counties).
Source: U.S. Department of Education, Homeless Student Enrollment Data by Local Educational Agency School Year 2014–15.
Figure 2
McKinney-Vento Funding and Number of Homeless Students
SY 2011–12 to SY 2014–15
The Education for Homeless Children and Youth program, established by McKinney-Vento, is the primary source of federal funding for homeless students in elementary and secondary school.
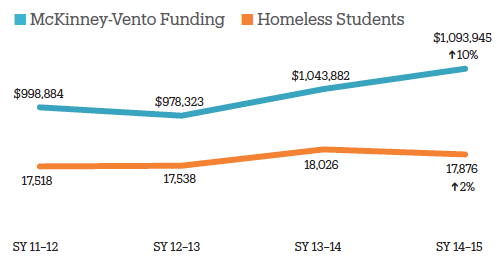
Source: U.S. Department of Education, State Funding History Tables by Program, Education Department Budget History State Tables, FY 1980–2014; National Center for Homeless Education, Federal Data Summary School Years 2011–12 to 2013–14 Education for Homeless Children and Youth, November 2015; National Center for Homeless Education, Federal Data Summary School Years 2012–13 to 2014–15 Education for Homeless Children and Youth, December 2016.
Figure 3
School Districts Potentially Under-Identifying Homeless Students
By School District, SY 2014–15
School districts with lower ratios of homeless students to free-lunch eligible students are likely under-identifying those not in shelter.
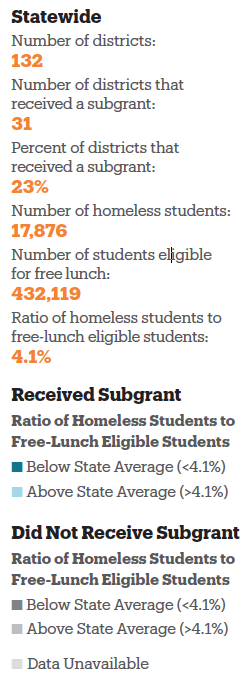
Source: U.S. Department of Education, Homeless Student Enrollment Data by Local Educational Agency School Year 2014–15; National Center for Education Statistics, Local Education Agency (School District) Universe Survey Directory Data, SY 2014–15; National Center for Education Statistics, Public Elementary/Secondary School Universe Survey Free Lunch Data, SY 2014–15.
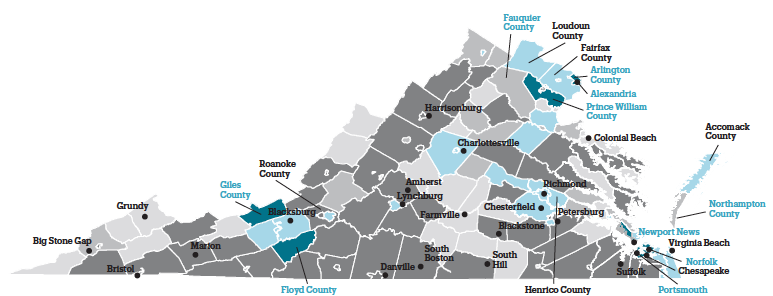
- In Virginia, 56% of school districts had a ratio of homeless students to free-lunch eligible students smaller than the statewide average, including eight, or 26%, that received subgrants (Newport News City, Alexandria City, Arlington County, Floyd County, Norfolk City, Portsmouth City, Prince William County, and Giles County Public Schools).
- Twenty-three percent of Virginia’s school districts received McKinney-Vento subgrants, and 78% of the state’s homeless students lived in a district with a subgrant. Non-grantees with the most homeless students included Fauquier and Northampton Counties.
Figure 4
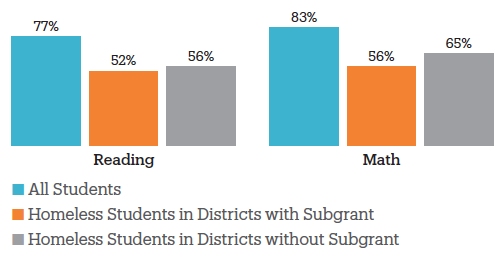
Proficiency in 4th Grade Reading and Math
SY 2014–15
Student performance in early grades is a strong predictor of high school graduation.
Source: U.S. Department of Education, ED Data Express, SY 2014–15; U.S. Department of Education, State Assessments in Reading/Language Arts and Mathematics School Year 2014–15.
- On average, homeless students were proficient in reading at a rate 21 to 25 percentage points lower than all students. In math, homeless students were proficient at rates 18 to 27 percentage points lower than all students.
- Across all grades, Amherst County in central Virginia had the largest achievement gap in math, at least 39 percentage points, between all students and homeless students. Roanoke County, also in central Virginia, had the largest achievement gap in reading (at least 38 percentage points) between all students and homeless students.
Figure 5
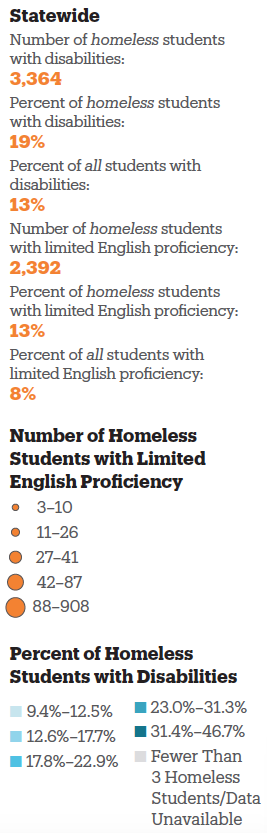
Homeless Students with Additional Support Needs
By School District, SY 2014–15
Students with disabilities or limited English proficiency may have difficulty accessing additional support services if they are homeless.
Source: U.S. Department of Education, Homeless Student Enrollment Data by Local Educational Agency School Year 2014–15.
- In seven school districts, over 32% of homeless students were identified as having a disability (Salem City, Falls Church City, Rockbridge County, Scott County, Clarke County, Manassas Park City, and Poquoson City Public Schools), and the average rate for districts with any homeless students was 19%.
- In four school districts over 35% of all homeless students had limited English proficiency (Arlington, Loudoun, Fairfax, and Accomack Counties), almost three times the statewide rate for all homeless students.
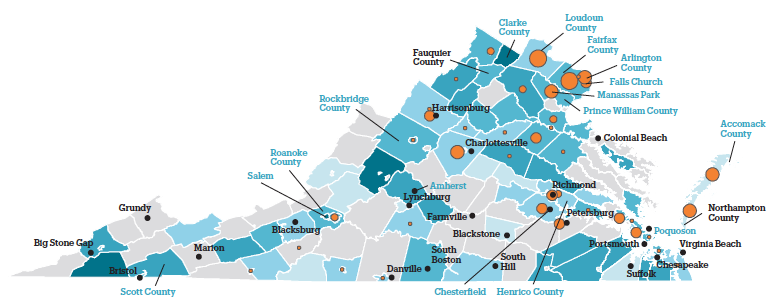
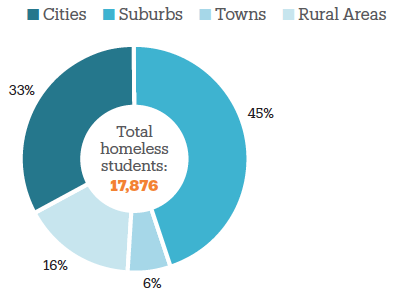
Figure 6
Where Homeless Students Live, by Population Density
SY 2014–15
Families in rural areas or small towns often have fewer shelters or services to turn to for assistance.
Source: U.S. Department of Education, Homeless Student Enrollment Data by Local Educational Agency School Year 2014–15; National Center for Education Statistics, Education Demographic and Geographic Estimates (EDGE) Program, Geographic Indicators and Identifiers 2014–2015.
- In Virginia, 33% of homeless students lived in urban school districts. Among suburbs, five districts had at least 500 homeless students each (Fairfax, Loudoun, Henrico, Chesterfield, and Prince William Counties).
- Homelessness was disproportionately seen in Virginia’s urban areas. Despite enrolling only 22% of the total student population in the state, these districts accounted for one-third of all homeless students.
Homeless students are too often overlooked by policymakers when talking about education policy. Improving outcomes and supports for homeless students reduces the burden on teachers, parents, and schools who struggle to help students cope with the trauma of homelessness along with the challenges of poverty.
Questions for educators and state/local legislators to consider
- Do you know how many homeless children live in your town? In your state?
- Is your school district a McKinney-Vento grantee? How much funding does it receive? How is it used?
- What supports are being provided to help homeless children toward better educational outcomes?
- Are the challenges that homeless students face, such as chronic absenteeism and difficulty traveling to and from school, being addressed?
- Are the educational needs specific to homeless students being identified?
- Does your public school have a dedicated liaison whose priority and focus is the needs of homeless students?
- Do schools coordinate with the shelter system or service delivery system?
- Are homeless students being granted access to services to which they are entitled (e.g. transportation, tutoring, special education, health care, food)?
This snapshot is part of a series analyzing student homelessness in all 50 states and the District of Columbia. Visit www.ICPHusa.org for more information. Data tables for the figures seen here will be available at www.ICPHusa.org starting in May 2017.
Source Notes
(1) Virginia’s local education agencies include Regional Education Service Agencies, state agencies, and supervisory unions that cannot be mapped but are included in all other data analysis. (2) Unless otherwise noted, statewide data is from National Center for Homeless Education, Federal Data Summary School Years 2012–13 to 2014–15 Education for Homeless Children and Youth, December 2016; National Center for Homeless Education, “Virginia,” http://profiles.nche.seiservices.com/StateProfile.aspx?StateID=53. (3) The McKinney-Vento definition of “doubled up” refers to children and youths who are sharing the housing of other persons due to loss of housing, economic hardship, or a similar reason.