Student Homelessness Growing Fastest in Rural America
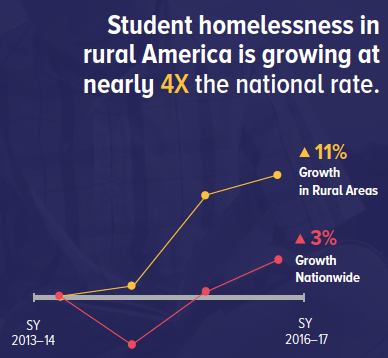
Across the country, the number of public school students being identified as homeless continues to rise. The vast majority of these students, 88%, live in cities, suburbs, and towns. In recent years, however, the highest rate of growth for student homelessness has been in rural America. Between the 2013–14 and 2016–17 school years, the number of homeless students in rural areas increased by 11% to over 162,000 students. By contrast, the number of homeless students nationwide experienced a more modest 3% increase.
Rural homeless students face fundamentally different challenges than their peers in urban settings. Rural areas often have fewer homeless shelters, meaning that homeless students are more likely to have stayed in overcrowded, doubled-up living arrangements or unsheltered in places not meant for habitation, such as cars. Access to other services, such as public transportation and regular health care, is more limited in rural areas than cities. As a result, the disparities in both health and academic outcomes that often correspond with the experience of housing instability are likely to be compounded in rural areas.
Despite its rapid growth in rural communities, student homelessness continues to be mainly concentrated in cities and surrounding suburbs. Public policy on homelessness centers around these metropolitan areas, ultimately leaving rural homeless students undercounted and underserved. This report spotlights these students by exploring national and state-level trends in rural student homelessness, the challenges in identifying and supporting these families, funding to rural school districts, and the obstacles faced by homeless students that are specific to rural areas.
Rural communities are those that fall geographically outside of an urbanized area and have fewer than 2,500 residents.1
Thirty-Eight States Experienced Growth in Rural Student Homelessness
- The number of students identified as homeless is on the rise. While the number grew nationally by 3%, it grew by nearly four times that rate—or 11%—in rural communities between SY 2013–14 and SY 2016–17.
- Thirty-eight states—three-quarters of the country—saw an increase in the number of rural students identified as homeless. In 35 states, it grew by more than the 3% national rate; in 26 states, it grew by more than the 11% rural rate. Montana and Nebraska saw increases of over 100% in the number of students experiencing homelessness.
- There were approximately 162,000 students identified as homeless in rural America during SY 2016–17. The largest numbers were identified in Texas (15,236), Georgia (12,746), Michigan (11,638), Kentucky (11,620), and North Carolina (9,834), totaling over 60,000 rural homeless students.
- Ten states saw a decline in the number of rural students identified as homeless between SY 2013–14 and SY 2016–17. Delaware experienced the largest decline over the four-year period (-36%).


While student homelessness increased 3% nationwide, rural school districts saw the fastest growth, increasing by 11%.
Growth in Rural Homelessness Often Defies Other Statewide Trends
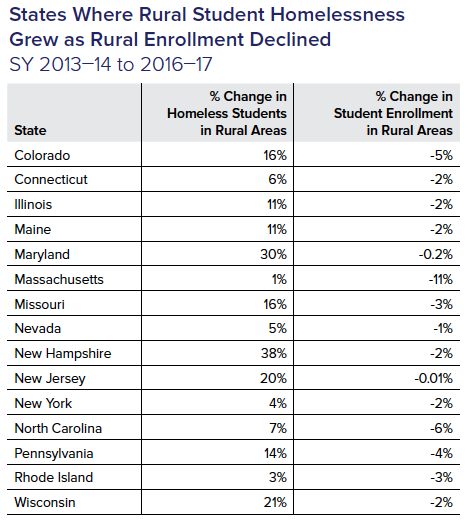
Rural Growth vs. Enrollment Decline
- In many states, the number of rural students identified as homeless grew while overall student enrollment declined.
- Twenty states experienced a reduction in the total numbers of enrolled students, though 15 of these states saw increases in the number of students identified as homeless.
- In nine of these states, student homelessness grew by more than 10%—over three times the national average. (ME, IL, PA, CO, MO, NJ, WI, MD, NH)
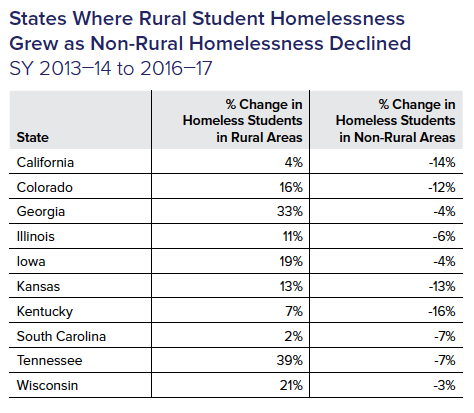
Rural Growth vs. Non-Rural Decline
- In 10 states, the number of rural students identified as homeless grew while there was a simultaneous decline in the number of students identified in non-rural districts.
- The two states with the largest percentage point gap between rural student homelessness growth and non-rural decrease were Tennessee (46 points) and Georgia (37 points).
- In Georgia, the number of homeless students in non-rural areas declined by 4%, while increasing in rural areas by one-third to over 12,000 students. After Texas, this was the second largest number of rural homeless students identified.
Growth in student homelessness counts can be the result of real increases in the number of homeless students as well as improved identification practices that lead to more students being counted.
Higher numbers of rural homeless students may be evidence that children who were already struggling with housing instability are being identified and connected to the services they may need.
Twelve States Disproportionately Affected by Rural Student Homelessness
- In most states, the proportion of homeless students attending school in rural districts was roughly equal to or less than the proportion of all students attending school in that state’s rural districts.
- In 12 states the proportion of homeless students in rural areas was greater than the proportion of all students in rural areas of that state.
- In three of these 12 states—AR, MI, and WV—the proportion of homeless students in rural areas exceeded the proportion of all students in rural areas by more than 10 percentage points.
- The greatest disproportionality was seen in West Virginia where rural students made up 35% of the total student population while they constituted 53% of the homeless student population.

Nationwide, 15% of all students, and 12% of homeless students, attend school in a rural district. In twelve states, however, rural students are over-represented among the homeless population.
Statewide Rates of Student Homelessness Mask Local Dynamics
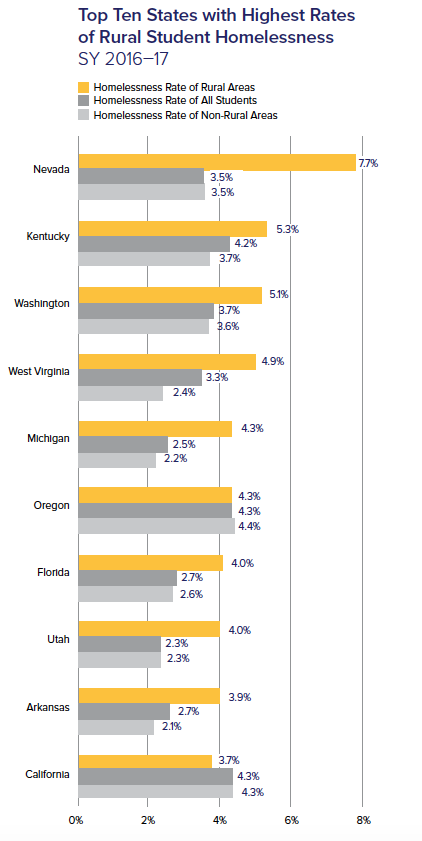
- Nationally 2.8% of all students were identified as homeless in SY 2016–17. This rate stood at 2.1% for students in rural districts and at 2.9% for students in non-rural districts.
- State-by-state, the average rate of student homelessness can mask the dynamic at play in rural and non-rural districts. For example, eight of the 10 states with the highest rates of rural student homelessness had rates higher than in their non-rural areas. (NV, KY, WA, WV, MI, FL, UT, AR)
- Nevada had the smallest percentage of students living in rural areas overall but the highest rate of rural student homelessness nationwide (2% and 7% respectively). Students attending schools in Nevada’s rural school districts were identified as homeless at three times the rate of rural students nationwide.
- An additional six states not in the top ten also had rates of rural student homelessness higher than in non-rural areas. (GA, IL, MD, NJ, TX, WY)

Do high rates of rural student
homelessness in states like
Nevada and Kentucky signal
that homelessness is
disproportionately affecting rural
communities or that rural school
districts have better identification
practices?
Nationwide, 2.8% of all students were homeless. In rural districts, 2.1% of students were homeless compared to 2.9% of students in non-rural districts. These differences are starker in many states, highlighting the importance of understanding local dynamics.
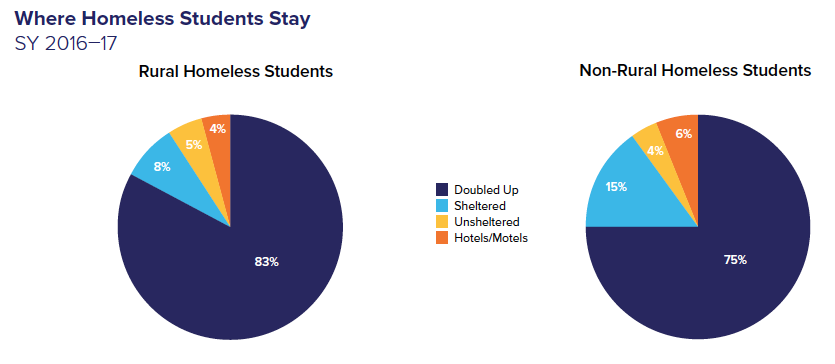
Rural Homeless Students Are Less Likely to Sleep in Shelter
- Rural homeless students were more likely than their non-rural counterparts to stay in temporary doubled-up arrangements, often as a result of a lack of shelter capacity in the area.
- Four out of five (83%) rural homeless students stayed in doubled-up arrangements. Only 8% of rural homeless students were in shelter, compared to 15% in non-rural districts.
- In both rural and non-rural areas, around 9% to 10% of homeless students were identified as staying either unsheltered in a place not meant for habitation or paying out-of-pocket to stay at a hotel or motel.
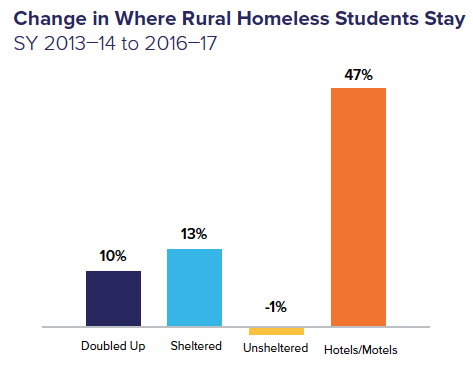
- Although the vast majority of rural homeless students stayed in doubled-up arrangements, the number staying in hotels or motels paid out-of-pocket increased dramatically between SY 2013–14 and 2016–17 (47%).
- Over 6,000 rural students nationwide were identified as living precariously day-to-day, staying in a hotel or motel paid out-of-pocket.
- The demand for shelter also increased over this time period, with 13% more rural homeless students staying in shelter by SY 2016–17.
Who is Considered Homeless?
In 1987, Congress passed the McKinney-Vento Act, establishing the only source of dedicated funding for homeless students. Under this Act, students are considered homeless if they are living doubled up due to economic hardship or loss of housing, living in an emergency or transitional shelter, living unsheltered in a place not meant for human habitation, or living in non-publicly funded hotels or motels due to a lack of alternative accommodation.
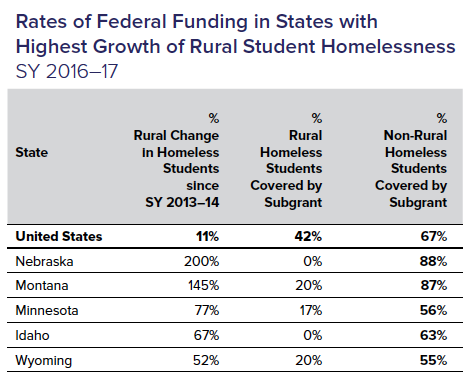
Rural Students Less Likely to be in Districts that Received Federal Homeless Funding
- Nationally, only 42% of rural homeless students are covered by federal funding, meaning they attended school in a district that received McKinney-Vento subgrants, compared to 67% of non-rural students.
- Even in those states with the largest increases in rural homelessness, the proportion of students who attended school in a district that received federal funds was smaller in rural areas. For example, 88% of non-rural homeless students in Nebraska were covered by a McKinney-Vento subgrant while no rural homeless students were covered, despite 200% growth between SY 2013–14 and SY 2016–17.
- In 28 states, the proportion of rural homeless students covered by McKinney-Vento funding was less than half the proportion of homeless students covered in non-rural districts.
- Eight states did not allocate subgrants to any rural districts with homeless students despite the fact that six of those states covered over half of their students in non-rural areas with a subgrant. (NE, SD, KS, ID, IA, and WI)
- Over 90% of identified rural homeless students were covered with a subgrant in five states. (IL, NJ, PA, MI, and FL)

Could the complexity
of the McKinney-Vento
subgrant award process be
inadvertently resulting in
the exclusion of some rural
districts? Could a lag in timely
enrollment data be affecting
funding allocations? Is there
a procedural bias against
districts with lower numbers
of homeless students?
Why is McKinney-Vento Funding Important?
McKinney-Vento funds are the only source of federal funding dedicated to the identification and support of homeless students. Districts do not receive grants directly, but must apply to their state for a subgrant. The amount of money a state receives is not directly based on its number of homeless students, but a district’s count is often a key part of the subgrant application.3 The difficult task of identifying homeless students in rural areas, due to geographic sprawl and a larger proportion of doubled-up students, can affect a district’s likelihood of receiving McKinney-Vento funds.
Rural Areas Are Underfunded and Underserved
In addition to educational challenges and limited federal funding to rural areas, homeless students are more likely to have poor physical and mental health outcomes.
Homeless and low-income children are more likely to be overweight, have diabetes or asthma, and have mental health issues like depression and anxiety than their housed and more affluent peers. For rural homeless students, these issues are compounded by a scarcity of primary care physicians and mental health professionals. Almost 9% of children in rural areas living at or below the federal poverty line ($24,600 for a family of four) lack health insurance, compared to 6% of children in non-rural areas.4 These factors exacerbate the physical and mental health issues of rural homeless students.
Rural households often grapple with lack of access to technology and are less likely to have computer or internet access than non-rural households. In 2017, 12% of rural households did not have access to a computer or smartphone, and 21% did not have internet in the home, compared to 9% and 15% for non-rural households.5
Among families making less than $20,000 a year, which includes a significant portion of homeless families, 48% in rural areas had no internet access versus 39% in non-rural areas.6 The lack of access, coupled with the transient nature of homelessness, is a significant barrier to the education of rural homeless students. Schools are increasingly requiring computer and internet access for homework and assignments, placing rural homeless students at a disadvantage compared to their housed classmates.
Identification is Key
The first step in addressing student homelessness is to ensure that all school-age children are identified and counted—whether they are residing in a shelter, living doubled-up in temporary arrangements, or staying in their family’s car or living day-to-day in a hotel/motel paid out-of-pocket. Equally important as counting all students is the identification and coordination of all available resources within communities for addressing the specific challenges faced by homeless students.
As in most communities, the stigma surrounding homelessness can present a barrier to identification. The unique challenges faced by rural areas, such as scarcity of resources, limited infrastructure, and large distances between school and ‘home’ can represent additional obstacles in addressing the growing issue of student homelessness. Only by placing more attention on the local dynamics of homelessness can we effectively target solutions to address it, and ensure that homeless students can exercise their right to high-quality educational and economic opportunities.

Unless otherwise noted, data are from U.S. Department of Education. “Homeless Student Enrollment Data by Local Education Agency: School Year 2013–14 and 2016–17” https://www2.ed.gov/about/inits/ed/edfacts/data-files/school-status-data.html; National Center for Education Statistics. “Local Education Agency (School District) Universe Survey Data” https://nces.ed.gov/ccd/pubagency.asp; National Center for Education Statistics, Education Demographic and Geographic Estimates (EDGE) Program, Geographic Indicators and, Identifiers 2013–14 and 2016–17.
Note: Statewide percentages are based on aggregations of district totals and may include duplicated counts of some students, particularly in urban areas.
1 Cities, suburbs, towns, and rural areas were defined using standard urban and rural designations defined by the U.S. Census Bureau. An LEA is located in a city if it is inside an urbanized area of at least 50,000 residents and inside of a principal city. A suburb is inside of an urbanized area of at least 50,000 residents, but outside of a principal city. A town is a community inside of an urban cluster of 2,500–50,000 residents. Rural areas are territories that do not fall into the categories of urbanized area or urban cluster.
2 Hawaii, the District of Columbia, and schools within the Bureau of Indian Education are not included in this report. Hawaii’s one school district is classified as a suburb. The District of Columbia has one school district classified as rural, the Department of Youth Rehabilitation Services. The population size of DC’s rural school district was too small for analyses, with 28 total students and 21 identified homeless students in SY 2016–17. In the same year, the Bureau of Indian Education enrolled 45,399 students, 2,238 of whom were homeless. The Bureau of Indian Education did not report data on homeless students for SY 2013–14, and therefore were excluded from national growth rate calculations.
3 Title 1, Part A grants are determined through multiple formulas that take into account the number of low-income students in a school district, but do not measure homelessness directly.
4 United States Census Bureau, 2017 American Community Survey 1-year Estimates.
5 Ibid.
6 lbid.
Ralph da Costa Nunez, PhD, President and CEO
Aurora Zepeda, Chief Operating Office
Project Team:
Andrea Pizano, Chief of Staff
Josef Kannegaard, Principal Policy Analyst
Kristen MacFarlane, Senior GIS Analyst
Chloe Stein, Senior Policy Analyst
Alexander Guinn, Policy Analyst
Katie Linek Puello, Digital Communications Manager
Hellen Gaudence, Senior Graphic Designer
Marcela Szwarc, Graphic Designer