While homelessness impacts families in every neighborhood of New York City, some communities have a combination of neighborhood instability factors that make families particularly vulnerable to homelessness. Meanwhile, coronavirus is ravaging these same low-income, predominantly minority neighborhoods. For residents of Central Queens, Eastern Brooklyn, and the South Bronx—which already have a high percentage of families facing housing instability—the daily impact of coronavirus has been monumental. Many of these New Yorkers have lost their jobs and are now wondering how they will make ends meet for their families. Others are deemed essential employees, such as those working in healthcare, building security and maintenance, or food and package delivery. These workers, many of whom live in overcrowded and doubled-up housing arrangements, are at risk of contracting coronavirus on the job and bringing it home to their loved ones or others with whom they live. Of course, there are also those who have experienced coronavirus firsthand, many of whom have had to take unpaid sick leave, pay costly medical bills, or are dealing with the deaths of family or community members.
Although the number of cases in NYC is staggering, it is assumed to be a vast undercount. At one point, NYC’s healthcare systems were so overrun that the City’s Department of Health and Mental Hygiene was recommending that testing be reserved for hospitalized patients only. With such limited testing, the overall scope of the pandemic has yet to be measured. What is clear now, however, is that some of the most affected areas were already experiencing a crisis of housing instability, evidenced by high numbers or rapid increases of homeless students. Estimates on the number of students that experience homelessness are the most accurate available measure on the magnitude of family homelessness affecting each community. They not only capture families that live in shelter, but those temporarily doubled up with others, paying out-of-pocket for hotels and motels, or sleeping in other types of unstable and often unsafe living arrangements.
The two maps presented here provide a glimpse of how the virus outbreak is impacting NYC communities. The map on the left explores the intersection of student homelessness and coronavirus testing. It suggests that there are still vast areas of the city—including many low-income and largely minority communities—with high numbers of students experiencing housing instability that remain with low testing, such as Northern and Central Brooklyn and the East Village and Harlem areas of Manhattan. Whether these communities actually have a lower number of cases or if they just have less access to testing is unknown at this time.
The map on the right explores the overlap of student homelessness and confirmed cases of coronavirus. The map highlights those communities that were already vulnerable to housing instability and are now facing the added stress of the outbreak. These include: Washington Heights in Manhattan; large sections of the Bronx; Jamaica, Queens; and Canarsie and East Flatbush in Brooklyn. This map also illustrates how the virus has spread throughout most of Queens, including communities that until now have had low numbers of homeless students compared to the rest of the city, but are experiencing some of the City’s most rapid increases in homeless students. Neighborhoods such as Elmhurst/Corona, Rego Park, Kew Gardens, and Queens Village are reflective of this trend.
Each map tells its own story about how residents of individual communities are being impacted by economic instability and the coronavirus. We invite you to explore where your own community stands.
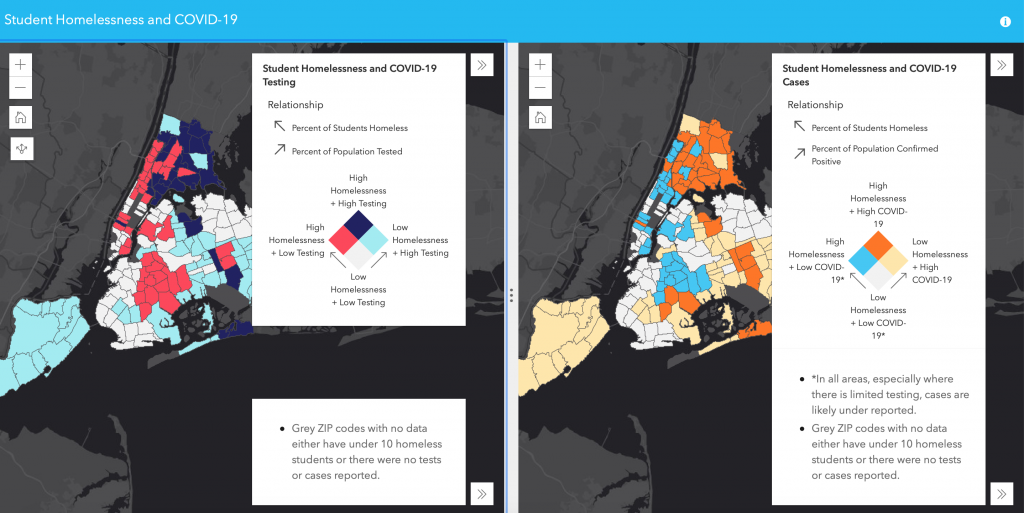
Note: These maps use the names of neighborhood tabulation areas (as used by the Census) rather than traditional neighborhood designations.
As of 7/26/2020:
COVID-19 Testing: Mean: 17.7%, Low Range: 12.3% – <17.7%, High Range: 17.7% – 32.0%
COVID-19 Cases: Mean: 2.5%, Low Range: 0.8% – <2.5%, High Range: 2.5% – 4.7%
Student Homelessness: Mean: 8.2%, Low Range: 1.1% – <8.2%, High Range: 8.2% – 24.4%