For the over 360,000 homeless high school students across the country, the instability of homelessness leads to physical and mental health challenges, dating violence, alcohol and drug use, and even bullying and safety concerns. In Arkansas, 3 in 5 homeless high schoolers reported being diagnosed with asthma. In New Hampshire, nearly 60% of homeless students were depressed—over 2x the rate of their housed peers. Homeless high schoolers in California were 3x as likely as housed students to have smoked cigarettes by the age of 12.
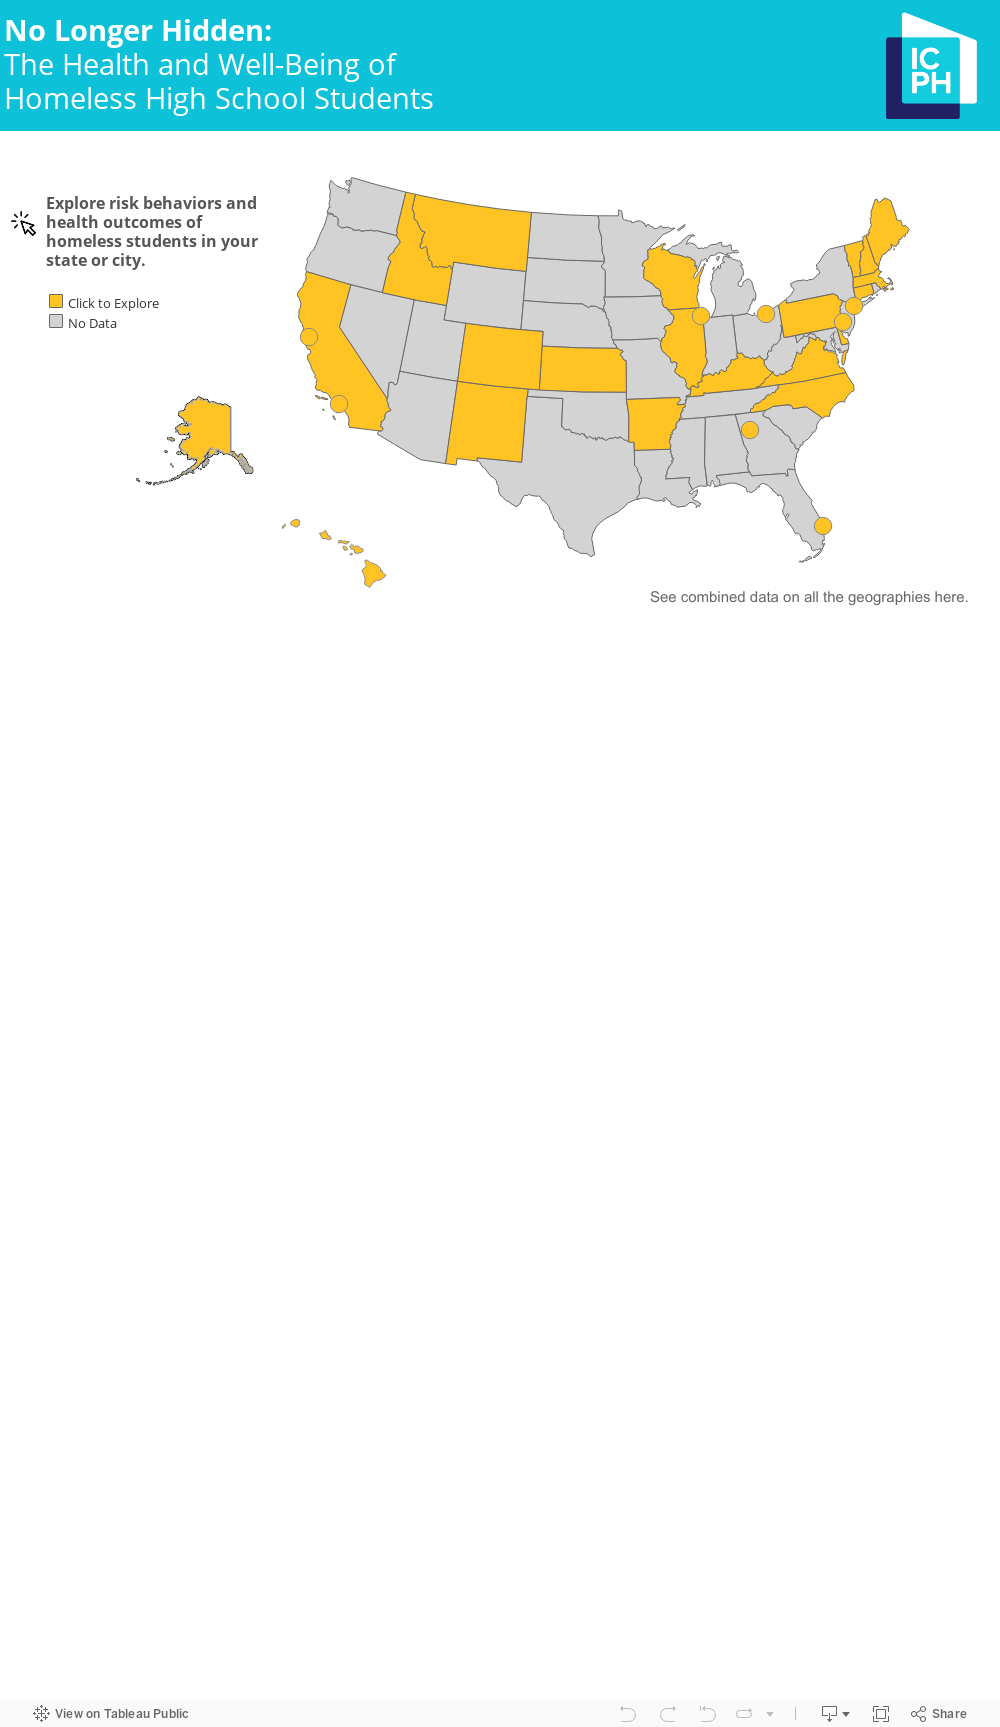
While homelessness is a national experience, it is an issue which requires locally driven solutions. In order to shed light on the local challenges to homeless students’ health and well-being, the Institute for Children, Poverty, and Homelessness created this interactive web tool. The tool below allows users to examine how risk behaviors and health outcomes differ between homeless and housed students in their state or urban school district.
To learn more about the health outcomes of homeless students in New York City, read No Longer Hidden.
Notes
Data are from the Youth Risk Behavior Survey (YRBS), administered every other year by the Centers for Disease Control and Prevention (CDC) along with select states and large urban school districts. The purpose of this interactive tool is to explore differences in health and well-being between housed and homeless students; as such, sites that did not ask students about housing status are not displayed here. All data are from surveys administered in 2017, except for Pennsylvania, which collected its data in 2016. Data are weighted to be representative of all high school students within a given geography.
Unless otherwise noted, results are statistically significant.
*There is not a statistically significant difference between percentages of homeless and housed students that fall within the category. Statistical significance is determined at the p=0.05 level.
†Estimate should be interpreted with caution. Estimate’s Relative Standard Error (a measure of estimate precision) is greater than 30%, or the 95% Confidence Interval half-width is greater than 10, or the sample size is too small, making the estimate potentially unreliable.
All Colorado and Los Angeles estimates are unreliable due to small sample size (fewer than 50 homeless students were surveyed in these geographies).
Estimates are suppressed if the Relative Standard Error (a measure of estimate precision) is greater than 50% and the confidence interval band width is larger than 6. Data are suppressed due to imprecise and unreliable estimates. Race categories are combined if displaying them separately would have led them to be suppressed due to reliability concerns.
_______________________________________________
Ralph da Costa Nunez, PhD, President and CEO
Aurora Zepeda, Chief Operating Officer
Andrea Pizano, Chief of Policy Research
Chloe Stein, Principal Policy Analyst
Rachel Barth, Senior Policy Analyst
Kaitlin Greer, Policy Analyst
App creation by Rachel Barth