September 2013
Except where noted, all data refer to the 2010–11 school year.
Homelessness is experienced by thousands of students in New York City.
- 71,271 students were homeless during the 2011–12 school year (SY), 40% more than four years earlier.1
- 6.9% of all students were homeless during SY 2011–12, three times the national rate and more than the rates of other major cities, including Los Angeles (2.3%) and Chicago (4.3%).2
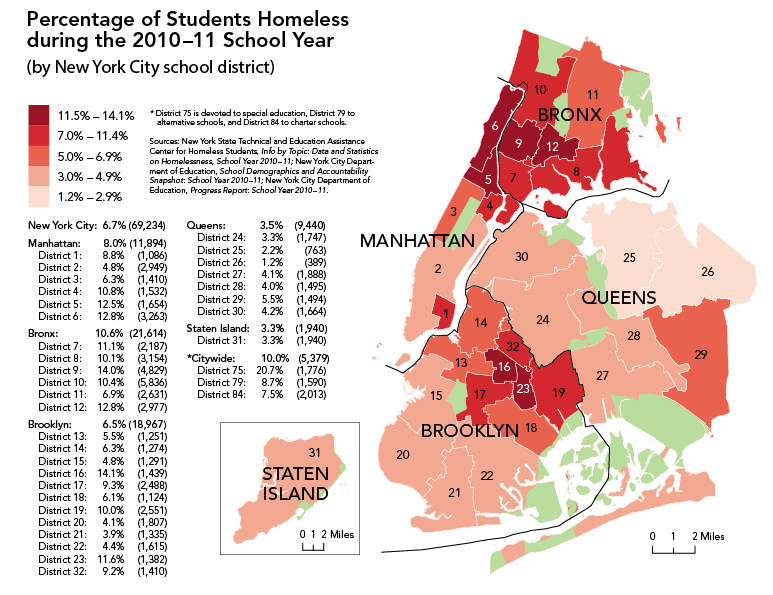
Every New York City neighborhood has schools with homeless students.
- 41% of homeless students lived in shelter.
- 44% were living doubled-up with family or friends.
- 15% were unsheltered, living on the streets.3
Homelessness can affect a student’s education.
A higher proportion of homeless students in a school district corresponds to a lower graduation rate.4
- On average, students in DHS shelters attended school less frequently (83.3%) than housed students (90.5%). New York public schools require 90% attendance for promotion to the next grade level.5
- Homelessness corresponds with use of special education services. One in five (20.7%) students in special education programs is homeless.6
Homeless students often attend schools in districts with higher concentrations of poor and minority residents.
Homelessness is associated with greater percentages of Hispanic and black students, but lower proportions of white and Asian pupils.7
- Homelessness corresponds with higher proportions of students receiving free or reduced price lunch.8
Endnotes
1 New York State Technical and Education Assistance Center for Homeless Students (NYS-TEACHS), Info by Topic: Data and Statistics on Homelessness, School Years 2007–08 and 2010–11.
2 NYS-TEACHS, Data and Statistics on Homelessness, School Year 2011–12; New York City Department of Education, School Demographics and Accountability Snapshot: School Year 2011–12; National Center for Homeless Education, Education for Homeless Children and Youth Program Data Collection Summary, 2012; U.S. Department of Education, National Center for Education Statistics, Common Core of Data, 2010–11; Los Angeles Unified School District, Homeless Education Program Data, 2011–12; Chicago Coalition for the Homeless, CPS Served 17,255 Homeless Students, a 10.7% Increase, 2012; U.S. Department of Education, “Ed Data Express,” www.eddataexpress.ed.gov.
3 NYS-TEACHS, Data and Statistics on Homelessness, School Year 2010–11; New York City Department of Education, Snapshot: School Year 2010–11.
4 In SY 2010–11, the proportion of homeless students by school district was negatively correlated with graduation (-.444; p < .05) rates; Ibid.
5 City of New York, Preliminary Mayor’s Management Report, February 2013.
6 In SY 2010–11, the proportion of homeless students by school district was positively correlated with the percentage of students receiving special education services (.576; p < .05); NYS-TEACHS, Data and Statistics on Homelessness, School Year 2010–11; New York City Department of Education, Snapshot: School Year 2010–11.
7 In SY 2010–11, the proportion of homeless students by school district was positively correlated with the percentage of Hispanic (.449; p < .05) students, while negatively correlated with white (-.686; p < .05) and Asian (-.766; p < .05) pupils. A strong positive correlation existed with the percentage of black students, but was not significant due to the sample size; Ibid.
8 In SY 2010–11, the proportion of homeless students by school district was positively correlated with the percentage of students receiving free or reduced price lunch (.749; p < .05); Ibid.