On the Map
Community Profile
June 2016
Concourse/Highbridge in the Bronx is one of the poorest neighborhoods in New York City.1 With a disproportionate number of families in the lowest income bracket, new affordable housing plans may not prevent these families from becoming homeless. This profile looks at the growing affordability gap in the Concourse/Highbridge neighborhood and the significance this has for its most vulnerable families. Who benefits from new development? Could new plans for affordable housing in fact increase homelessness in this already susceptible neighborhood? With proposed rezoning and development underway for the Jerome Avenue Corridor, the implications of these data have never been more important.2
xxx
Key Findings
85 percent of all affordable housing units in 2014 were designated for families earning $40,000 or more—out of the price range for two-thirds of Concourse/Highbridge residents.
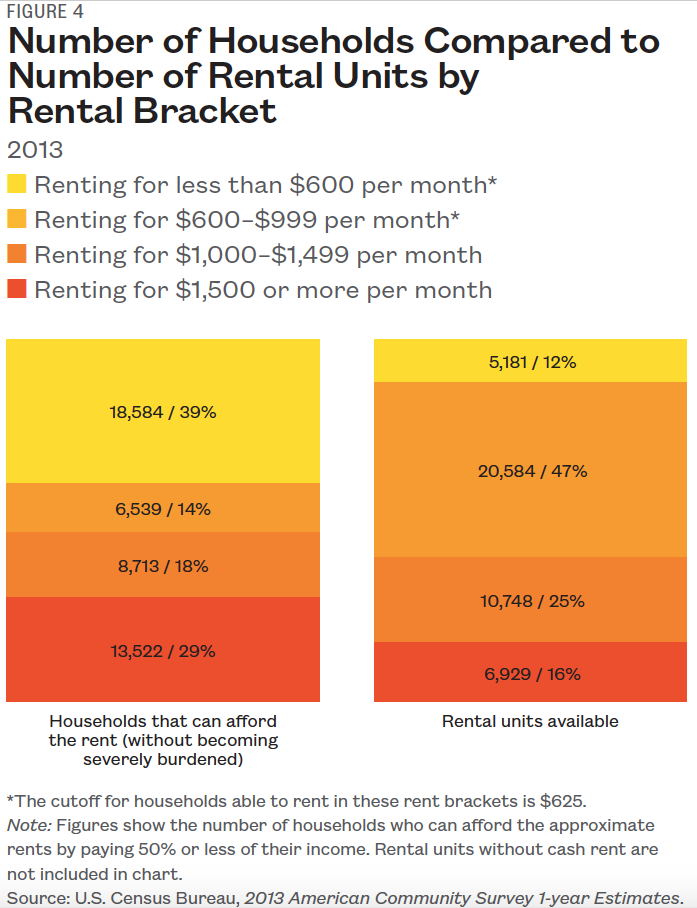
In 2013, there was a shortfall of six thousand apartments for those who could only afford the lowest rental bracket.
Concourse/Highbridge is a chronic feeder to the shelter system, with over 4,800 families entering shelter in ten years. More than 900 families entered shelter between FY 2013–FY 2014 alone.
xxx
Affordable for Whom?
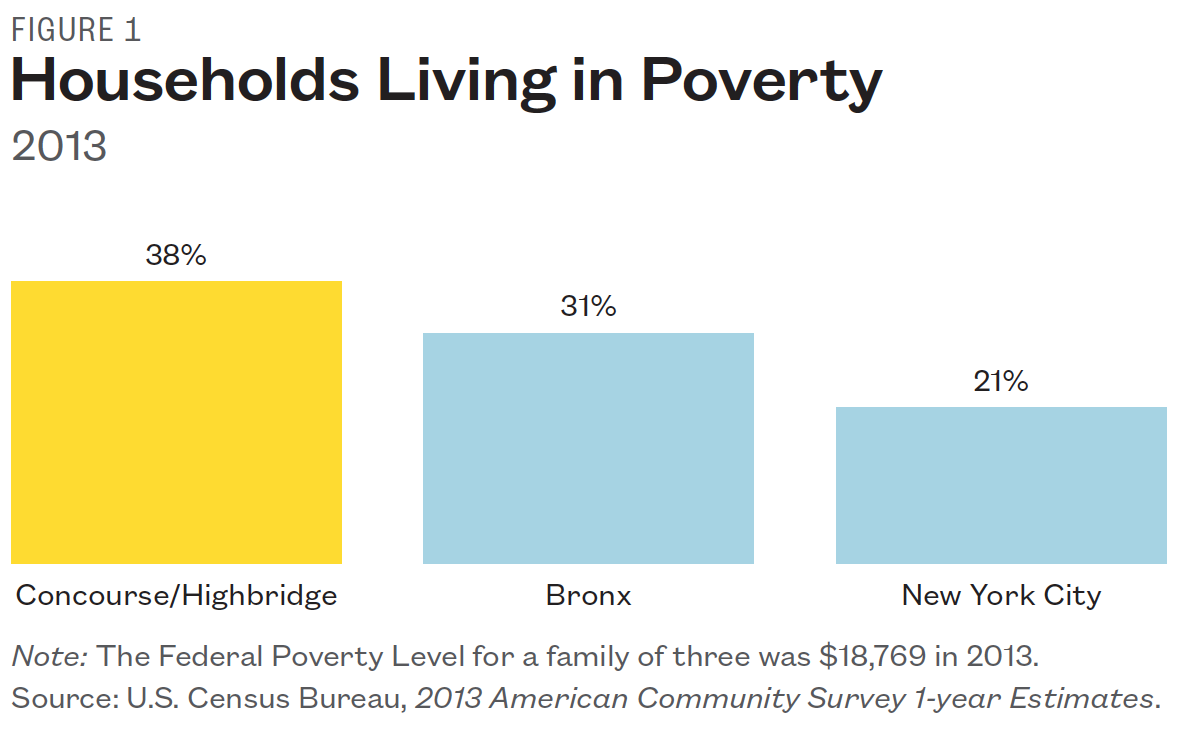
In 2013, 38% of Concourse/Highbridge residents lived below the poverty line (roughly $19,000 for a family of three)3—two times the rate of poverty than in the city overall (see Figure 1). While Concourse/Highbridge has a relatively high proportion of units renting for under $1,000—often defined as affordable4—the question arises: affordable for whom?
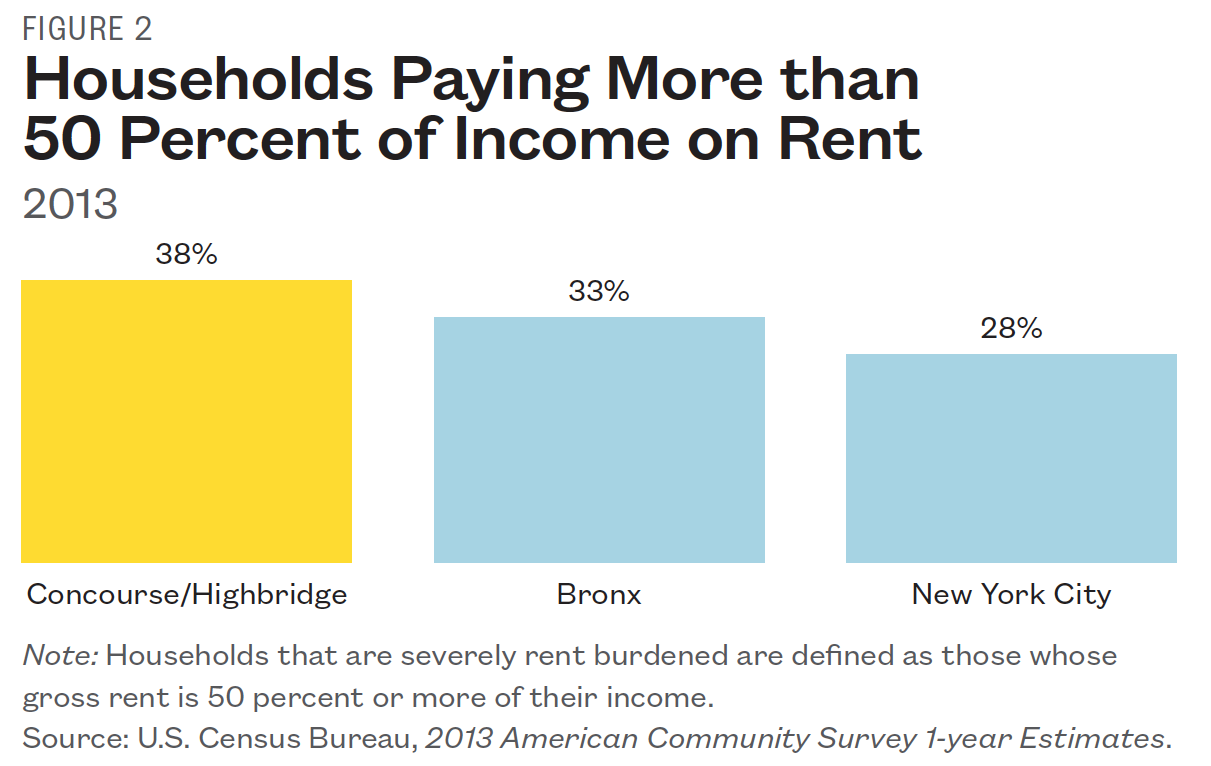
Amidst widespread poverty, residents of Concourse/Highbridge face growing housing pressure. Every single subsidized rental unit—more than 1,800—that was eligible to convert to market rate did so from 2002–2011, ending affordability commitments that typically cap rents at 30% of tenants’ income.5 In tandem with the loss of subsidized units, severe rent burden (people who paid more than 50% of their monthly income on rent) increased by 9% among neighborhood residents since 2005. While rent burden grew at about the same rate in the rest of New York City, as shown in Figure 2, 38% of Concourse/Highbridge residents spent half or more of their income on rent alone in 2013—compared to 33% in the Bronx and 28% citywide. Among low-income households, 58% were paying half their gross income in rent, leaving them with less than $1,500 per month for additional household expenses, like child care, food, and transportation.6 Of the remaining subsidized housing stock in the neighborhood, up to 1,900 additional units, or 29%, are eligible to convert by 2024, a potential loss of 3,700 subsidized units in two decades.7
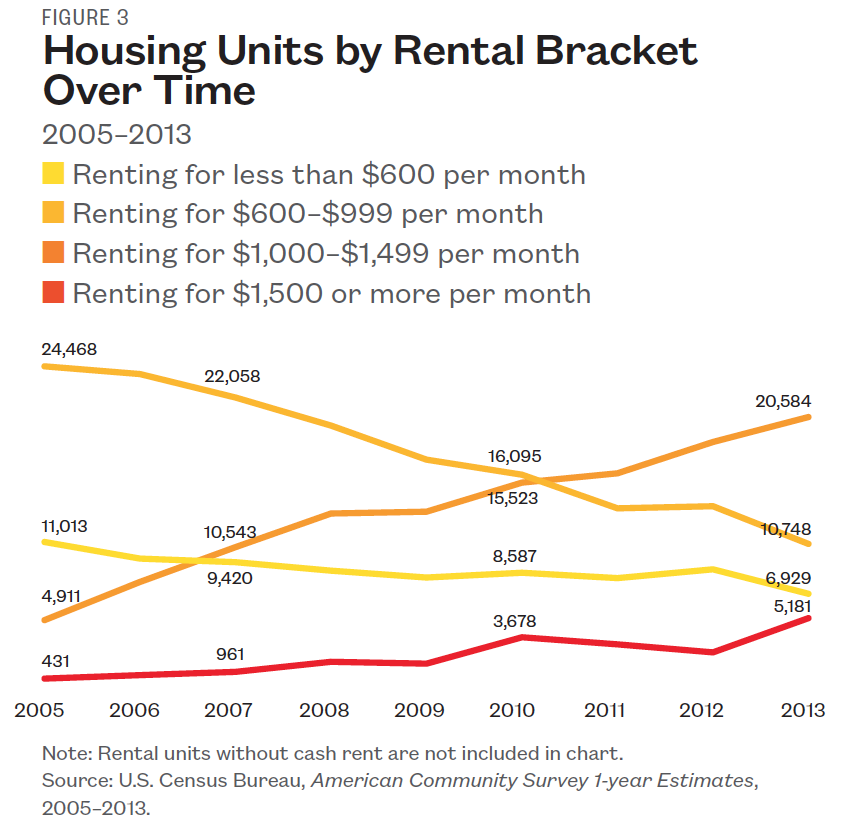
Following citywide trends, both median rent and income have risen in the neighborhood, but rent increased at a much more rapid pace. From 2005 to 2013 the neighborhood’s median rent increased by 43% from $752 per month to $1,078, whereas median income for families with children increased by only 20%, averaging less than $27,000 in 2013. Closer examination of these trends shows that these changes hit some Concourse/Highbridge households much harder than others; Figures 3 and 4 show how unmet housing demand for residents in the lowest income brackets is much greater than for middle-income households.
From 2005 to 2013, the number of apartments renting for under $1,000 declined by 50%, while the number of apartments renting for $1,000–$1,499 grew by 319% (Figure 3). Figure 4 shows that in 2013, almost one-third of households could afford a rent of $625 or less per month by paying half of their income towards rent. There were only enough lowest-cost units to house half of the people who could afford the lowest rental bracket—over six thousand units less than needed.
Changes in a Destabilized Community
Overcrowded, Homeless, and Pushed Out
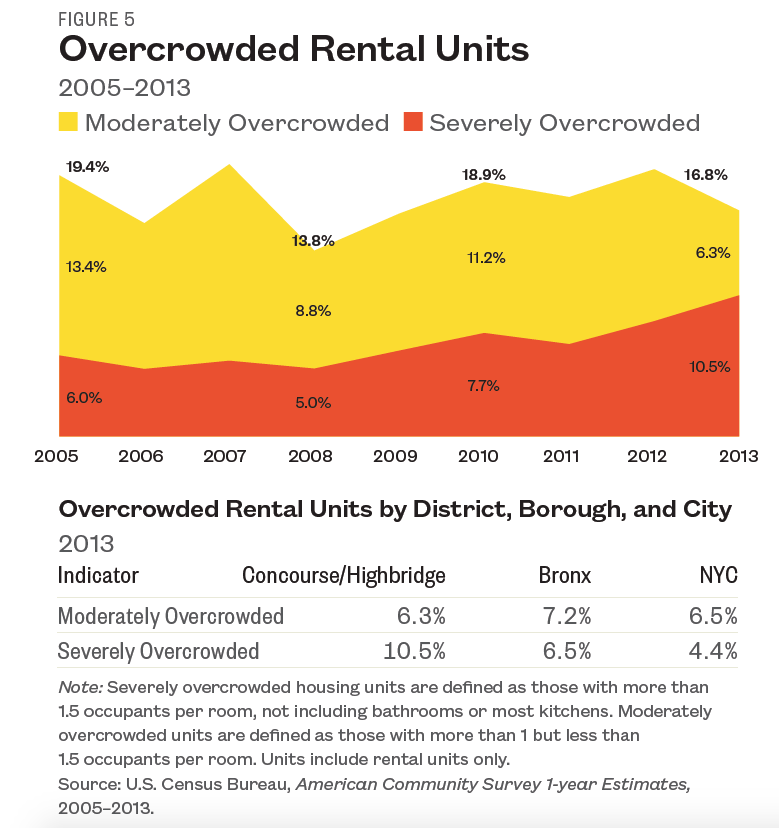
The number of households earning the very least— less than $10,000 per year—declined by 24% from 11,721 in 2005 to 8,962 in 2013. It is unknown whether the poorest households saw an increase in income, or whether they were pushed out of the neighborhood altogether. Either way, growing unaffordability meant this change had relatively little impact. At the same time, severe overcrowding (more than 1.5 occupants per room) grew in the neighborhood, rising from 6% of rental units in 2005 to 11% in 2013. This increase is taking place in an area that is already overcrowded. As seen in Figure 5, in 2013, severe overcrowding exceeded moderate overcrowding for the first time in the neighborhood; 11% of households were severely overcrowded versus 7% in the Bronx and just 4% in New York City.
Overcrowding often means that families are doubled-up, with more than one family unit living in a single apartment. Doubling up is frequently the last step before a family ends up in shelter; increasing rates of over-crowded units means more and more families are at risk of homelessness.
Concourse/Highbridge is already a chronic feeder to the shelter system, ranking among the top four community districts for the number of families entering shelter since FY 2005, with over 4,800 families entering shelter in ten years.8 These data suggest that the numbers of families heading towards homeless shelters has nowhere to go but up.
Students and Homelessness in Concourse/Highbridge
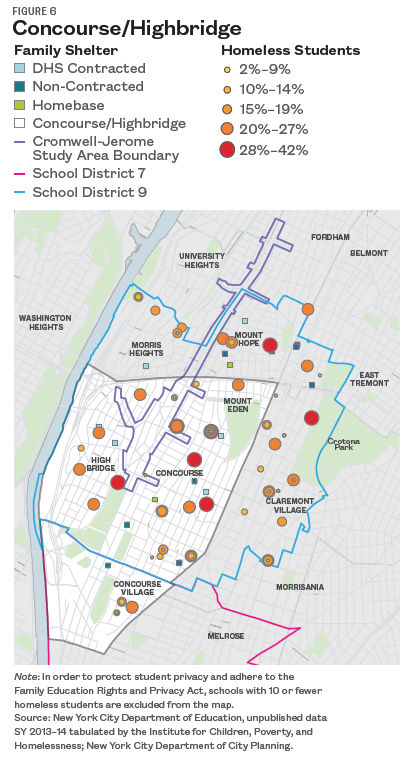
Homelessness in the area is even more severe than family shelter entry data show. In addition to the 419 families that entered shelter in FY 2014, over 4,000 students attending schools within Concourse/Highbridge’s community district were homeless in SY 2013–14, approximately 19% of all students.9 Based on rankings from the Atlas of Student Homelessness in New York City, this district had the largest number of homeless students out of New York City’s 59 Community Districts.10 While homeless students attended schools across the district, as shown in Figure 6, five schoolsi saw at least 1 in 3 students (30%) experience homelessness at some point during SY 2013–14.
Concourse/Highbridge lies almost entirely within School District 9,ii where despite having the largest number of family shelter units, the number of families entering shelters has consistently exceeded neighborhood shelter capacity since 2005.11 Furthermore, students becoming homeless in the neighborhood experienced high levels of school instability. More than half (56%) of the 682 students from District 9 who became homeless in SY 2013–14 transferred schools after becoming homeless.12 This pattern suggests that families with children from the neighborhood who become homeless are being forced to leave Concourse/Highbridge, while homeless families from other neighborhoods are simultaneously brought in.13
i P.S. X114 Luis Llorens Torres, P.S. 64 Pura Belpre, Claremont International High School, P.S. 53 Basheer Quisim, and P.S. X88 S. Silverstein Little Sparrow High School.
ii A small portion of the neighborhood lies within School District 8. For our purposes, we focus on District 9 as it represents the vast majority of the neighborhood and is generally representative of the population.
These student data add to the picture of destabilization in the community, particularly when considering the large number of children in the neighborhood. Almost one-third of people living in Concourse/Highbridge were under age 18 in 2013, making it one of the most disproportionately populated community districts by age.14 Almost half of the neighborhood’s children were living in poverty in 2013 and of those, 36% were age 5 or under.15 The instability faced by this community places all of these children at risk for further educational and developmental challenges.
Rising cost of living has led to different consequences in Concourse/Highbridge than are typically discussed: poor families pushing out even poorer ones, families becoming homeless, and children cycling through local shelters and schools. The housing affordability gap is not the only factor contributing to this poverty destabilization; basic support services are currently lacking in the neighborhood, especially child care. The Highbridge section of the neighborhood—west of Grand Concourse and north of Yankee Stadium—ranked among the highest in New York City for unmet child care demand, with more than 3,700 children age 4 or younger lacking care.16 For families with young children living in New York City, child care is the second leading expense after housing,17 and a lack of quality care greatly impacts parents’ ability to participate in the workforce or further their education and earning potential. Inadequate child care puts additional burdens on families with children and can contribute to families being displaced by poverty and homelessness.
Could Adding Affordable Housing Increase Homelessness?
With plans to re-zone and develop part of Concourse/Highbridge included in Mayor Bill de Blasio’s affordable housing plan (the Jerome Avenue study area), and over one-quarter of the neighborhood’s remaining subsidized units eligible to convert to market rate between 2015–2024, how development will impact the neighborhood remains to be seen.18 A key question is how affordable housing will be defined; the housing plan clearly states that most families served by the Department of Homeless Services earn incomes below the range served by the Department of Housing Preservation and Development.19 Eighty-five percent (85%) of the affordable units that were created or preserved citywide in 2014 were designated for families earning $40,000 or more—out of the price range for two-thirds of Concourse/Highbridge residents.20 The neighborhood faces significant gaps in affordability for its poorest residents, and development that does not address these gaps could further destabilize the community and place thousands more children and families at risk for homelessness. Ensuring that development includes accessible rental units for all income brackets and addressing residents’ needs beyond housing, such as child care, education, and workforce development, are crucial to bring stability to a neighborhood that has long struggled with family homelessness.