Student Homelessness Snapshot
November 2016
This snapshot is part of a series analyzing student homelessness in all 50 states and the District of Columbia. Visit www.ICPHusa.org for more information.
- In the 2013–14 school year, New York had 2,732,770 students enrolled in 1,015 local education agencies (school districts).1
- That year, there were 116,700 homeless students in the state, making up 4.3% of total enrollment.2
- New York had the 2nd highest number of homeless students and the 3rd highest rate of student homelessness in the U.S.
- School districts with the highest rates of student homelessness outside of NYC were Morristown Central (19%) and Hempstead Union (15%).
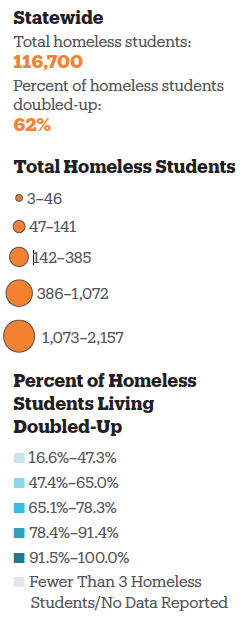
Figure 1
Number of Homeless Students and Percent Living Doubled-Up3
By School District, SY 2013–14
In its definition of homelessness, ED includes students in shelter as well as those with no option but to stay with others in overcrowded, often unsafe living conditions.
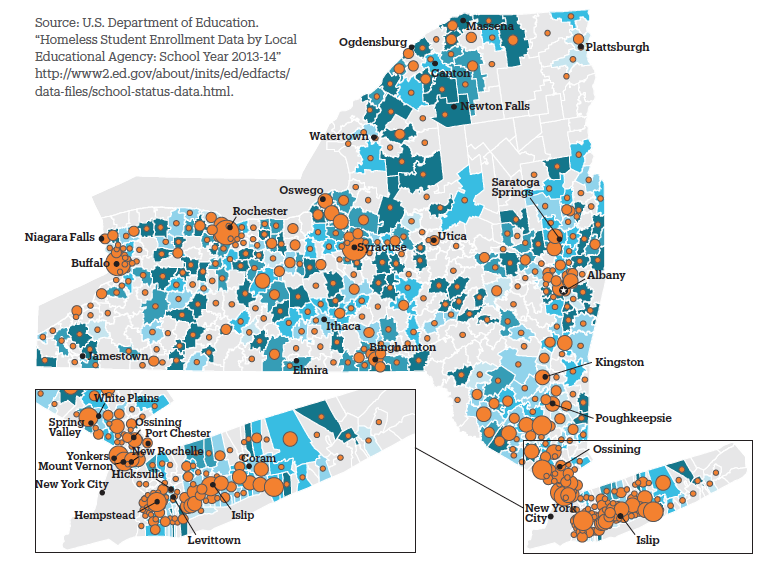
- Outside of New York City, four school districts had over 1,000 homeless students (Hempstead Union, Syracuse City, Rochester City, and Buffalo City).
- In 114 school districts outside of NYC, over 92% of homeless students were sleeping in a temporary doubled-up living arrangement. Four school districts had over 1,000 students without a fixed night-time residence.
Figure 2
McKinney-Vento Funding and Number of Homeless Students
SY 2011–12 to SY 2013–14
The Education for Homeless Children and Youth program, established by McKinney-Vento, is the primary source of federal funding for homeless students in elementary and secondary school.
- Since SY 2011–12, New York’s McKinney-Vento funding increased less than 1%, to $4.85 million. Over the same period, the number of homeless students rose 20%, to 116,700. New York had the 15th highest rate of growth in student homelessness nationwide during that time.
- On average, New York received $41.59 per homeless student in SY 2013–14, down from $49.99 in SY 2011–12. Nationally, the per-student average for SY 2013–14 was $49.98.
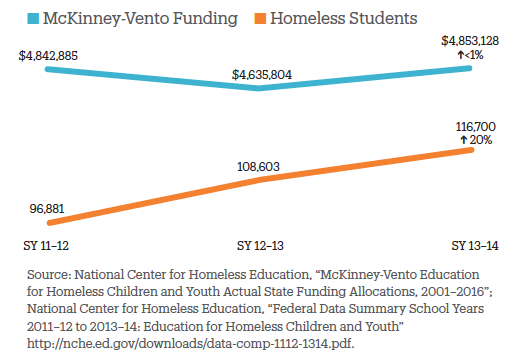
Figure 3
School Districts Receiving McKinney-Vento Subgrants and Ratio of Homeless Students to Free-Lunch Eligible Students
By School District, SY 2013–14
Comparing the numbers of homeless and low-income students is a way to gauge how well schools are identifying homeless students.
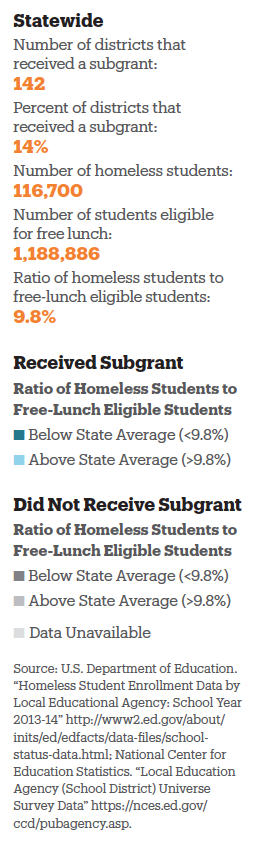
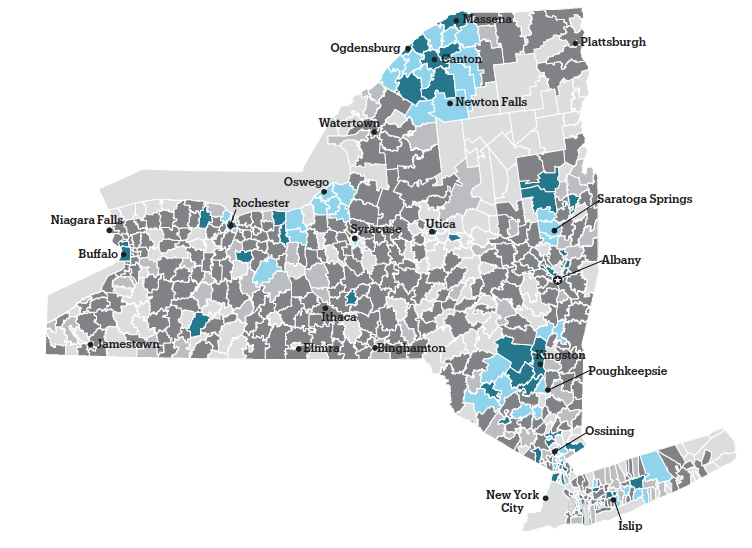
- In New York, 49% of school districts had a ratio of homeless students to free-lunch eligible students smaller than the statewide average (9.8%), including 63 that received subgrants.
- Fourteen percent of New York’s school districts received McKinney-Vento subgrants, and 87% of the state’s homeless students lived in a district with a subgrant. Non-grantees with the most homeless students included Hempstead Union, Patchogue-Medford Union, and Copiague Union School Districts.
Figure 4
Proficiency in 3rd Grade English Language Arts (ELA) and Math
SY 2013–14
Student performance in third grade is a strong predictor of high school graduation, and has been shown to be affected by family and socioeconomic factors.
- In districts with an above-average rate of student homelessness, 34% of third graders were proficient in math, compared to 46% of students in districts with a below-average rate. In ELA, 26% of third graders in districts with an above-average rate of student homelessness were judged to be proficient, compared to 34% in areas with a below-average rate.
- Island Park Union Free School District on Long Island had the highest passing rates among non-NYC districts with above-average homelessness, with 71% of third graders proficient in math and 47% proficient in ELA.
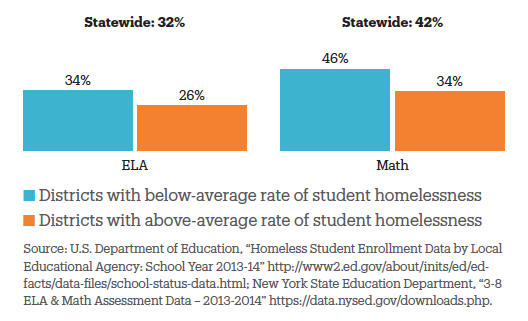
Figure 5
Homeless Students with Disabilities and Homeless Students with Limited English Proficiency
By School District, SY 2013–14
Students with disabilities or limited English proficiency are eligible for additional support services but may have difficulty accessing them if they are homeless.
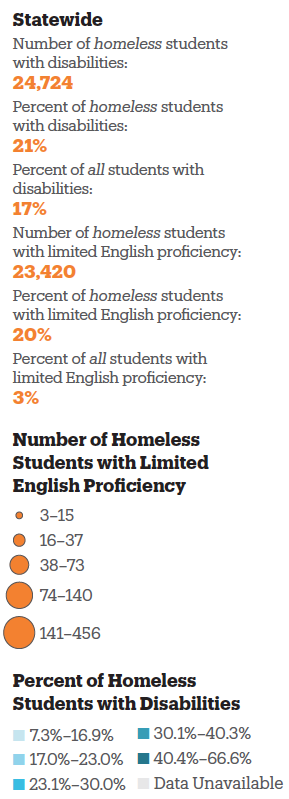
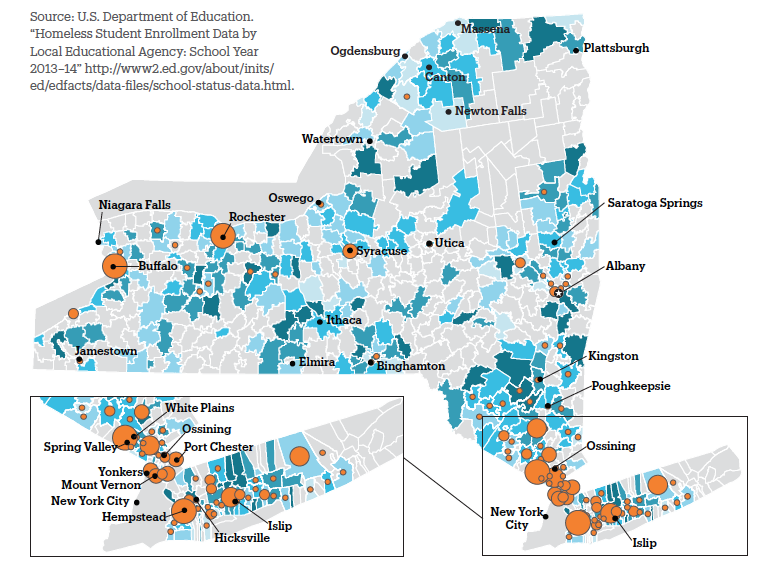
- In seven school districts, over 50% of homeless students were identified as having a disability.
- Outside of New York City, two districts had over 400 homeless students with limited English proficiency, and in three school districts over 50% of all homeless students had limited proficiency.
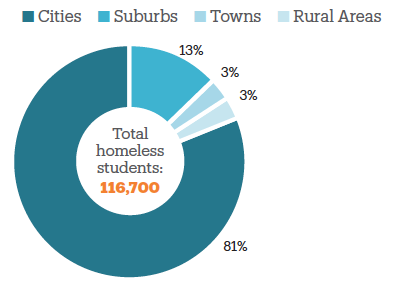
Figure 6
Where Homeless Students Live, by Population Density
SY 2013–14
Families in rural areas or small towns often have fewer shelters or services to turn to for assistance.
- In New York, 81% of homeless students lived in urban school districts, including over 7,000 students who lived outside of New York City. Among suburbs, six districts had over 500 homeless students each (Hempstead Union, William Floyd Union, Newburgh City, Mount Vernon, Brentwood Union, and Yonkers City).
- Homelessness was disproportionately seen in New York’s urban areas. Despite enrolling 46% of the total student population in the state, these districts accounted for 81% of all homeless students.
Homeless students are too often overlooked by policy-makers when talking about education policy. Improving outcomes and supports for homeless students reduces the burden on teachers, parents, and schools who struggle to help students cope with the trauma of homelessness along with the challenges of poverty.
Questions for educators and state/local legislators to consider:
- Do you know how many homeless children live in your town? In your state?
- Is your school district a McKinney-Vento grantee? How much funding does it receive? How is it used?
- What supports are being provided to help homeless children toward better educational outcomes?
- Are the challenges that homeless students face, such as chronic absenteeism and difficulty traveling to and from school, being addressed?
- Are the educational needs specific to homeless students being identified?
- Does your public school have a dedicated liaison whose priority and focus is the needs of homeless students?
- Do schools coordinate with the shelter system or service delivery system?
- Are homeless students being granted access to services to which they are entitled (e.g. transportation, tutoring, special education, health care, food)?
Data tables for the figures seen here will be available at www.ICPHusa.org starting in January 2017.
Source Notes