This snapshot is part of a series analyzing student homelessness in all 50 states and the District of Columbia.
Student Homelessness Snapshot
July 2017
- In the 2014–15 school year, Ohio had 1,724,810 students enrolled in 1,106 school districts (local education agencies).
- That year, there were 27,939 homeless students in the state, making up 1.6% of total enrollment.
- Ohio had the 11th highest number of homeless students and the 41st highest rate of student homelessness in the U.S.
- School districts with the highest rates of student homelessness were Hillsboro City (18%) and Switzerland of Ohio Local (12%), 11 times and 7 times the statewide rate, respectively.
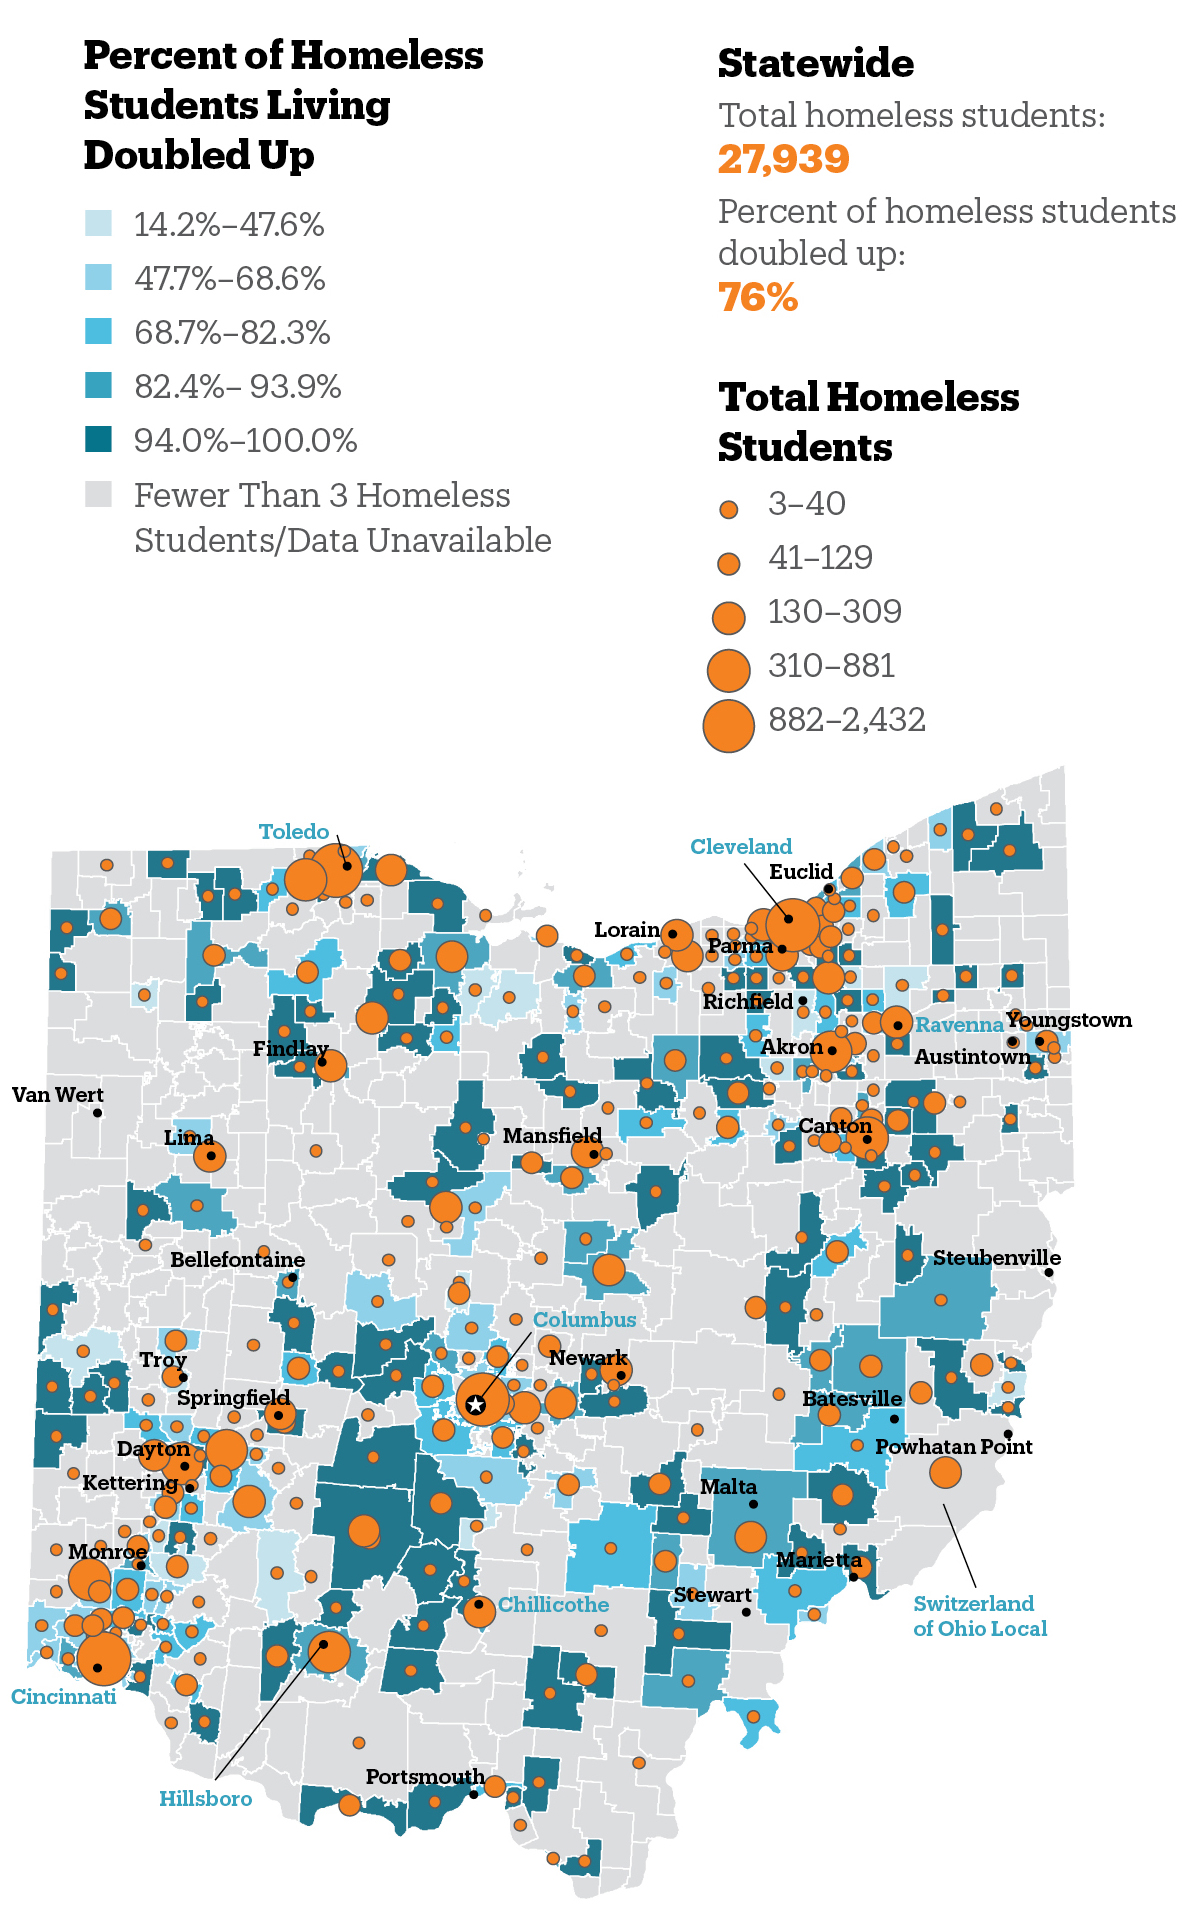
Figure 1
Number of Homeless Students and Percent Living Doubled Up
By School District, SY 2014–15
The U.S. Department of Education’s definition of homelessness includes students who are “doubled up,” or have no option but to stay with others in overcrowded, often unsafe living conditions.
Source: U.S. Department of Education, Homeless Student Enrollment Data by Local Educational Agency School Year 2014–15.
- Three school districts had over 2,000 homeless students (Toledo City, Columbus City, and Cleveland Municipal). In five school districts, over 10% of students were homeless (Hillsboro City, Switzerland of Ohio Local, Toledo City, Ravenna City, and Chillicothe City).
- In 108 school districts, over 94% of homeless students were sleeping in a doubled-up living arrangement. Four school districts had over 1,000 homeless students living doubled up (Toledo City, Cleveland Municipal, Columbus City, and Cincinnati City).
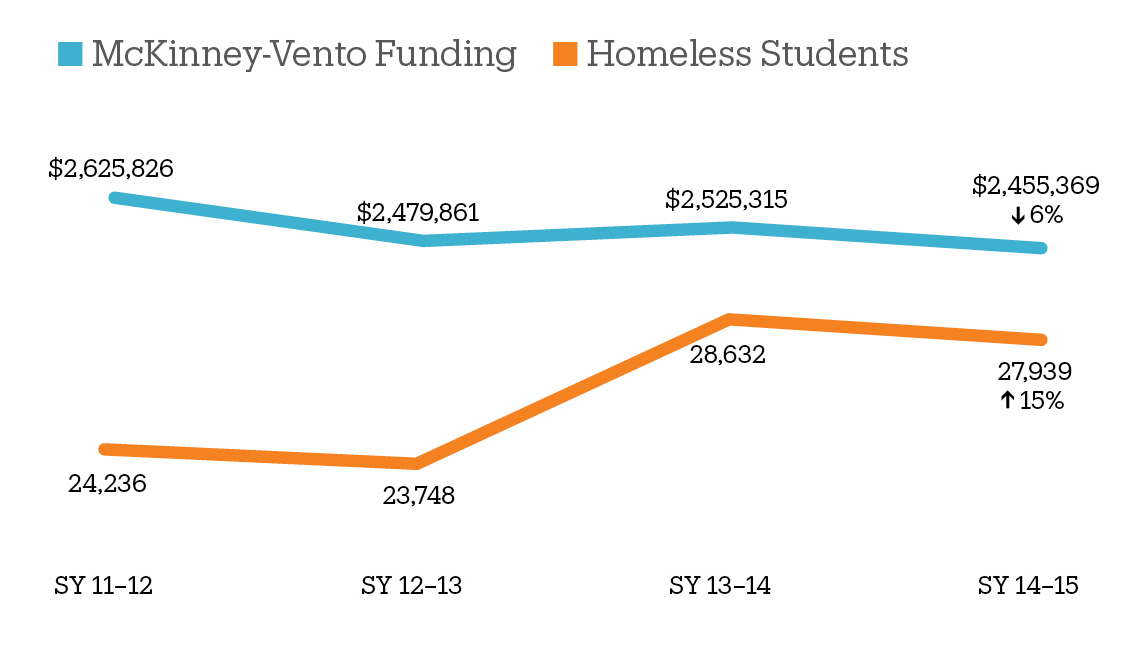
Figure 2
McKinney-Vento Funding and Number of Homeless Students
SY 2011–12 to SY 2014–15
The Education for Homeless Children and Youth program, established by McKinney-Vento, is the primary source of federal funding for homeless students in elementary and secondary school.
Source: U.S. Department of Education, State Funding History Tables by Program, Education Department Budget History State Tables, FY 1980–2014; National Center for Homeless Education, Federal Data Summary School Years 2011–12 to 2013–14 Education for Homeless Children and Youth, November 2015; National Center for Homeless Education, Federal Data Summary School Years 2012–13 to 2014–15 Education for Homeless Children and Youth, December 2016.
- Since SY 2011–12, Ohio’s McKinney-Vento funding decreased 6%, to $2,455,369. Over the same period, the number of homeless students rose 15%, to 27,939. Ohio had the 22nd highest rate of growth in student homelessness nationwide during that time.
- On average, Ohio received $87.88 per homeless student in SY 2014–15, down from $108.34 in SY 2011–12 (a decrease of 19%). Nationally, the per-student average for SY 2014–15 was $50.08.
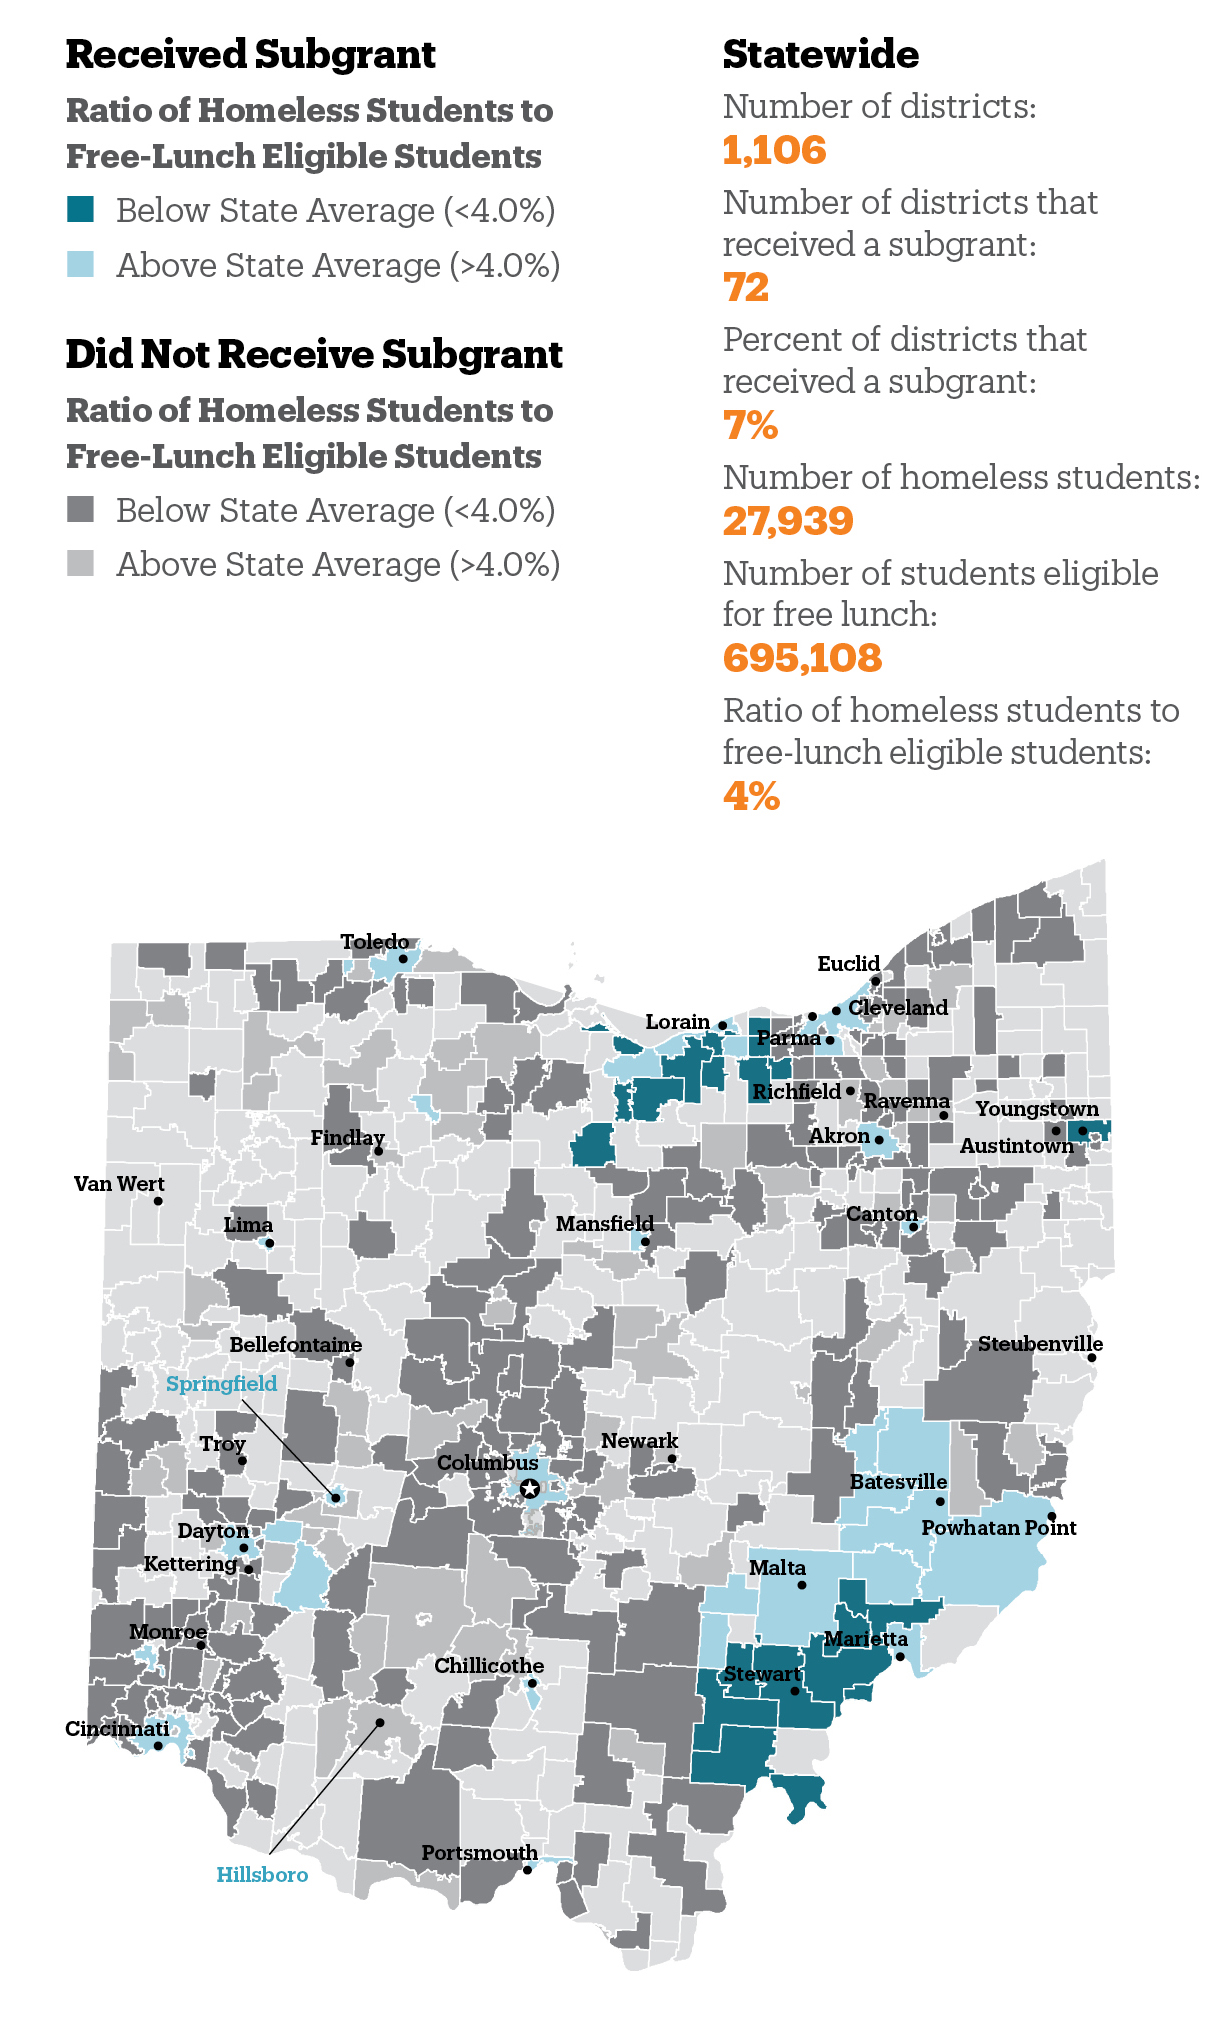
Figure 3
School Districts Potentially Under-Identifying Homeless Students
By School District, SY 2014–15
School districts with lower ratios of homeless students to free-lunch eligible students are likely under-identifying those not in shelter.
Source: U.S. Department of Education, Homeless Student Enrollment Data by Local Educational Agency School Year 2014–15; National Center for Education Statistics, Local Education Agency (School District) Universe Survey Directory Data, SY 2014–15; National Center for Education Statistics, Public Elementary/Secondary School Universe Survey Free Lunch Data, SY 2014–15.
- Seven percent of Ohio’s school districts received McKinney-Vento subgrants, and 56% of the state’s homeless students lived in a district with a subgrant. Non-grantee districts with the most homeless students included Hillsboro City and Springfield Local.
- In Ohio, 35% of school districts had a ratio of homeless students to free-lunch eligible students smaller than the statewide average, including 32 (or 44% of 72 districts) that received subgrants.
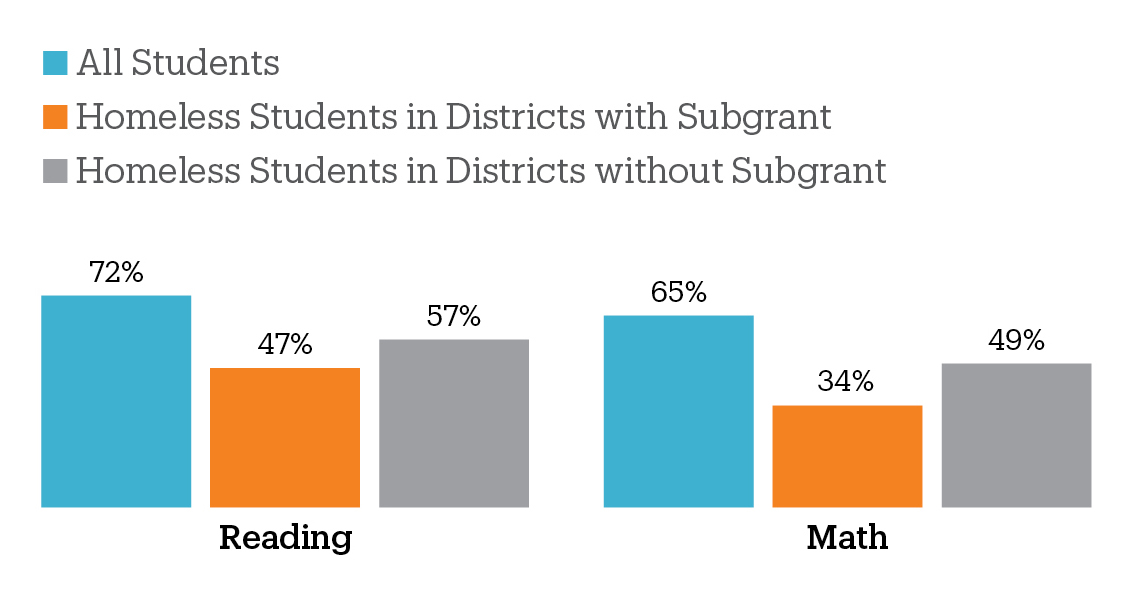
Figure 4
Proficiency in 4th Grade Reading and Math
SY 2014–15
Student performance in early grades is a strong predictor of high school graduation.
Source: U.S. Department of Education, ED Data Express, SY 2014–15; U.S. Department of Education, State Assessments in Reading/Language Arts and Mathematics School Year 2014–15.
- Statewide: On average, homeless students were proficient in reading at a rate 15–25 percentage points lower than all students. In math, homeless students were proficient at rates 16–31 percentage points lower than all students.
- A closer look: Across all grades, Troy City Schools in western Ohio had the largest achievement gap between all students and homeless students. The math proficiency rate among all students was 77%, while the proficiency rate among homeless students was no more than 20%. In reading, 75% of all students were proficient, and just 21–39% of homeless students scored proficiently.
Figure 5
Homeless Students with Additional Support Needs
By School District, SY 2014–15
Students with disabilities or limited English proficiency may have difficulty accessing additional support services if they are homeless.
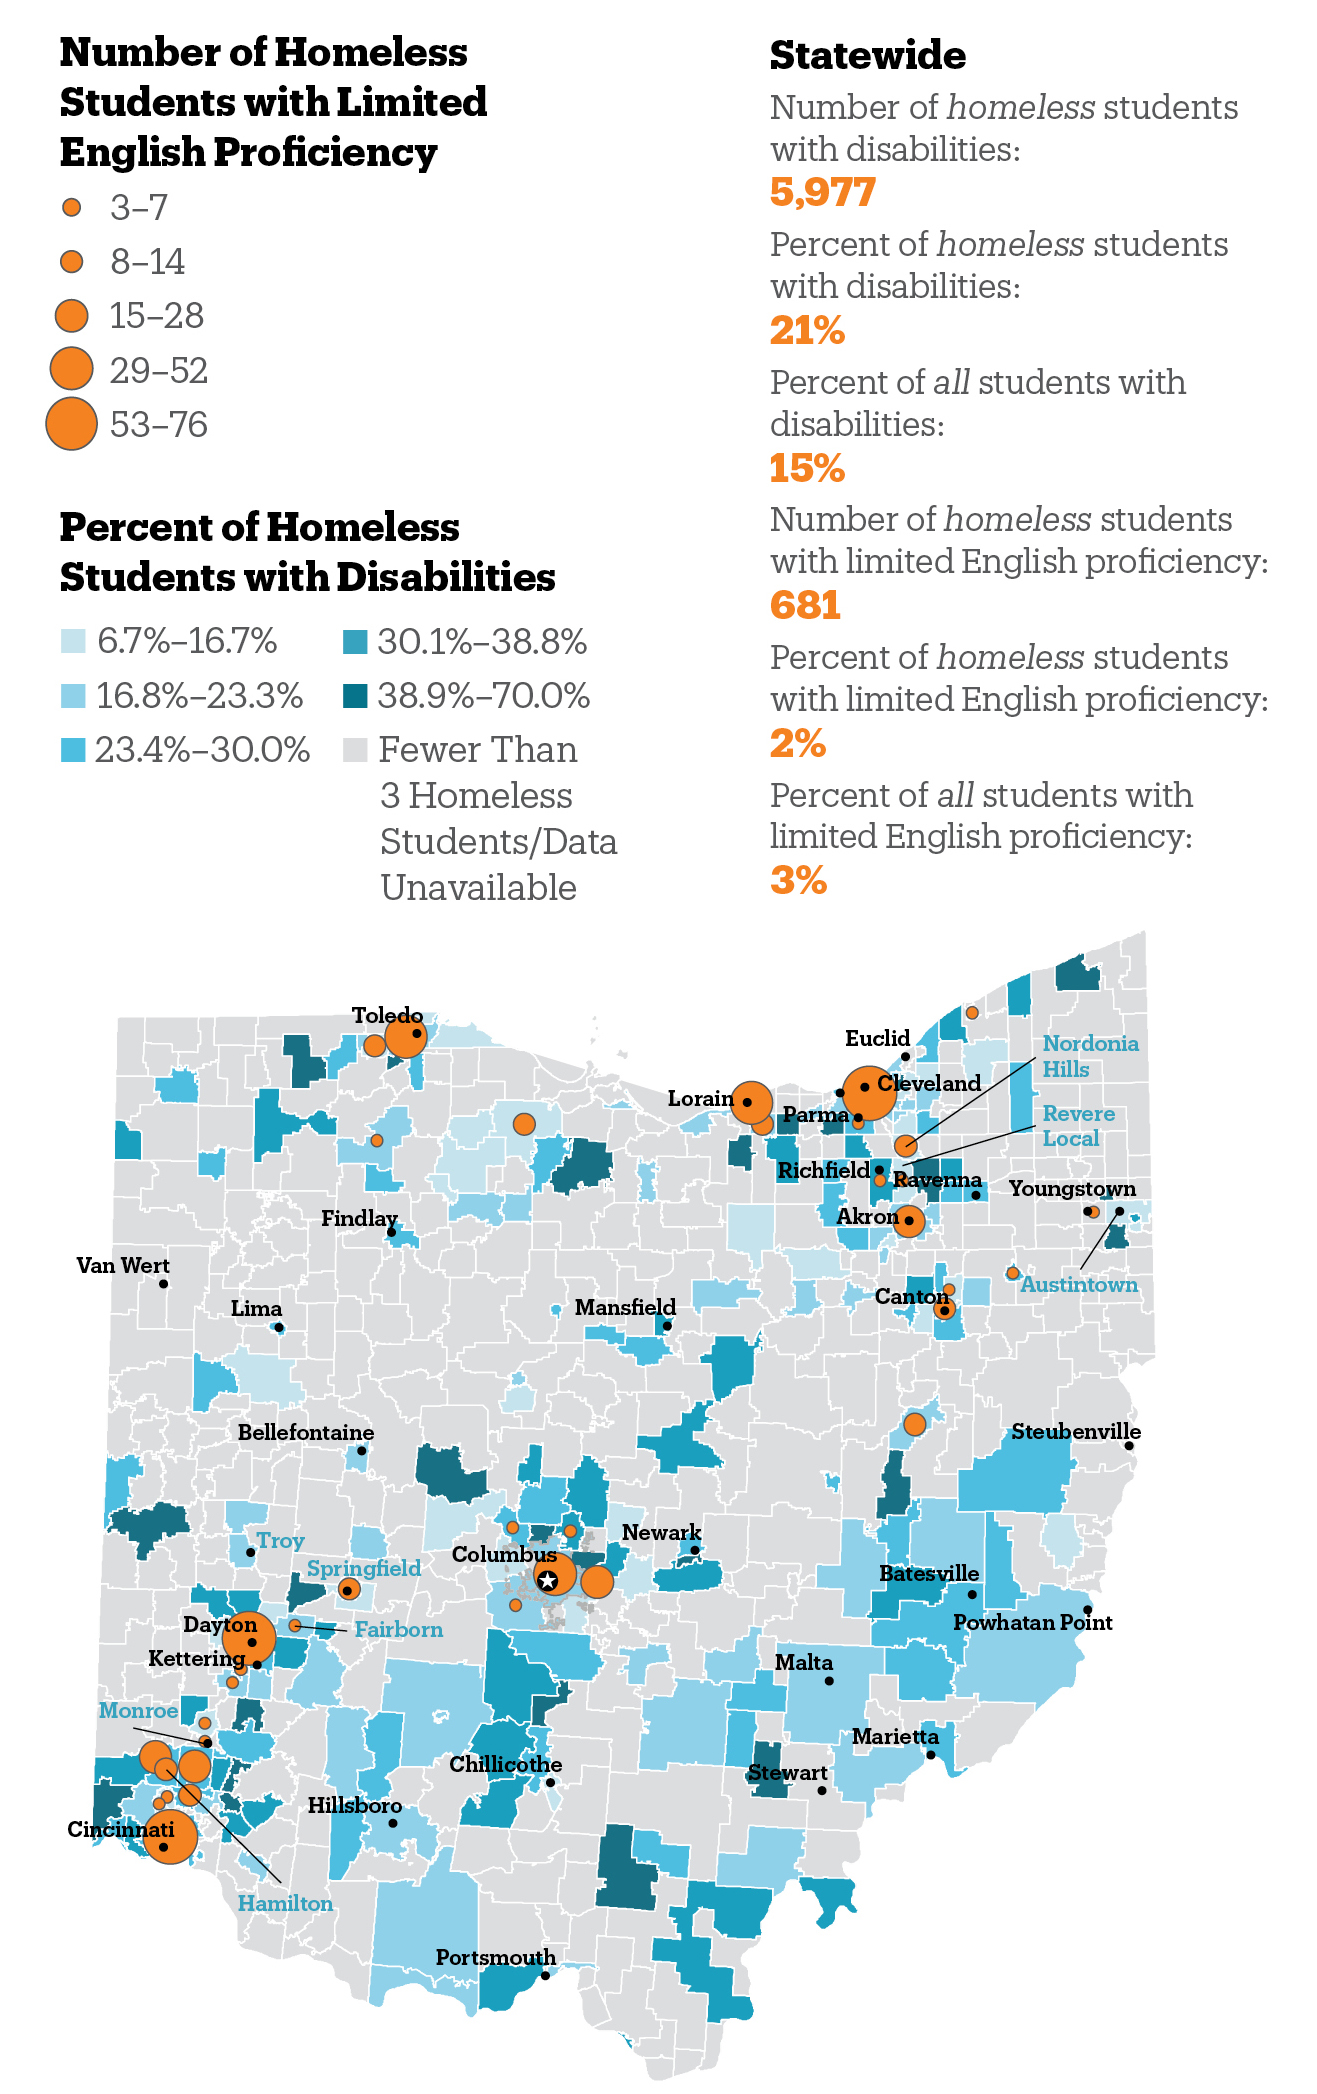
Source: U.S. Department of Education, Homeless Student Enrollment Data by Local Educational Agency School Year 2014–15.
- In 29 school districts, over 40% of homeless students were identified as having a disability. The average rate for districts with any homeless students was 20%, or 33% higher than the average rate for all students.
- In three school districts, over 25% of all homeless students had limited English proficiency (Austintown Local, Revere Local, and Monroe Local). This is about 12 times the rate of limited proficiency for homeless students and eight times the rate for all students.
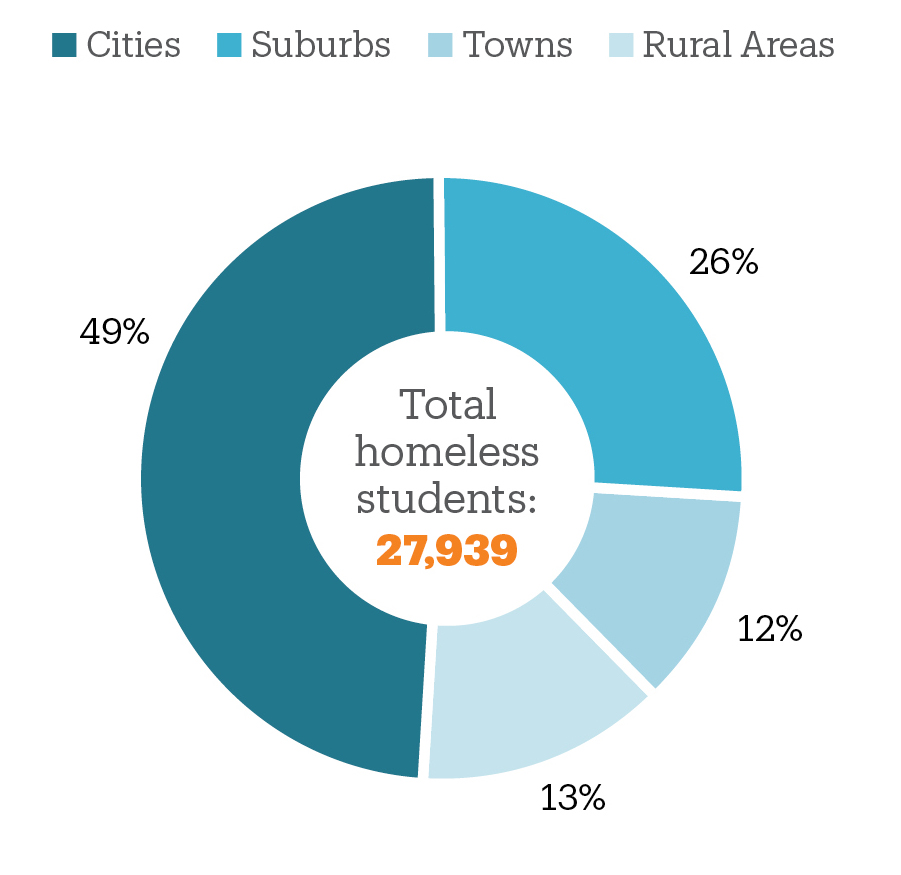
Figure 6
Where Homeless Students Live, by Population Density
SY 2014–15
Families in rural areas or small towns often have fewer shelters or services to turn to for assistance.
Source: U.S. Department of Education, Homeless Student Enrollment Data by Local Educational Agency School Year 2014–15; National Center for Education Statistics, Education Demographic and Geographic Estimates (EDGE) Program, Geographic Indicators and Identifiers 2014–2015.
- In Ohio, 49% of homeless students lived in urban school districts. Among suburbs, four districts had at least 300 homeless students each (Hamilton City, Fairborn City, Springfield Local, and Nordonia Hills City).
- Homelessness was disproportionately seen in Ohio’s urban areas. Despite enrolling only 19% of the total student population in the state, these districts accounted for almost half of all homeless students.
Homeless students are too often overlooked by policymakers when talking about education policy. Improving outcomes and supports for homeless students reduces the burden on teachers, parents, and schools who struggle to help students cope with the trauma of homelessness along with the challenges of poverty.
Questions for educators and state/local legislators to consider:
- Do you know how many homeless children live in your town? In your state?
- Is your school district a McKinney-Vento grantee? How much funding does it receive? How is it used?
- What supports are being provided to help homeless children toward better educational outcomes?
- Are the challenges that homeless students face, such as chronic absenteeism and difficulty traveling to and from school, being addressed?
- Are the educational needs specific to homeless students being identified?
- Does your public school have a dedicated liaison whose priority and focus is the needs of homeless students?
- Do schools coordinate with the shelter system or service delivery system?
- Are homeless students being granted access to services to which they are entitled (e.g. transportation, tutoring, special education, health care, food)?
Source Notes