September 2018
- In the 2015–16 school year, Georgia had 1,757,237 students enrolled in 203 school districts (local education agencies) representing the state’s 159 counties.
- That year, there were 38,474 homeless students in the state, making up 2.2% of total enrollment.
- Georgia had the 8th highest number of homeless students and the 23rd highest rate of student homelessness in the U.S.
- School districts with the highest rates of student homelessness were Monroe County (20%) and Montgomery County (13%).
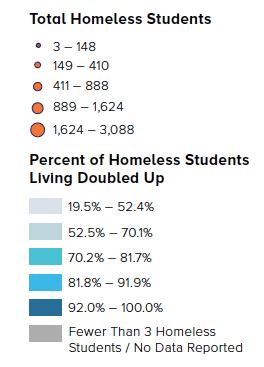
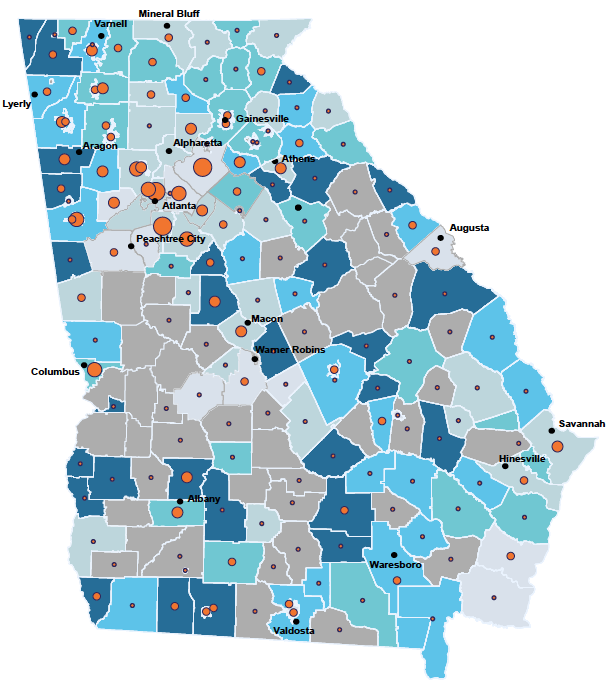
Number of Homeless Students and Percent Living Doubled Up
by School District, SY 2015–16
Statewide
Total homeless students: 38,474
Percent of homeless students doubled up: 72%
Source: U.S. Department of Education, “Homeless Student Enrollment Data by Local Educational Agency School Year 2015–16”.
The U.S. Department of Education’s definition of homelessness includes students who are “doubled up,” or have no option but to stay with others in overcrowded, often unsafe living conditions.
- Two school districts had over 2,000 homeless students (Atlanta Public Schools and Clayton County). Five school districts had rates of student homelessness above 10% (Monroe, Montgomery, Seminole, Hancock, and Polk Counties).
- In 16 school districts, all homeless students were sleeping in a doubled-up living arrangement. Three school districts had over 1,000 homeless students living doubled up (Atlanta Public Schools, Clayton County, and Muscogee County).
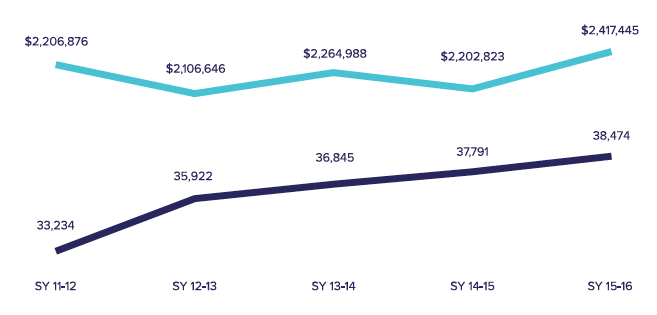
McKinney-Vento Funding and Number of Homeless Students
SY 2011–12 to SY 2015–16

Source: National Center for Homeless Education, “Federal Data Summary School Years 2011–12 to 2013–14: Education for Homeless Children and Youth”, November 2015; National Center for Homeless Education, “Federal Data Summary School Years 2013–14 to 2015–16 Education for Homeless Children and Youth”, December 2017.
The education for Homeless Children and Youth program, established by McKinney-Vento, is the primary source of federal funding for homeless students in elementary and secondary school.
- Since SY 2011–12, Georgia’s McKinney-Vento funding increased 10%, to $2.4 million. Over the same period, the number of homeless students rose 16%, to 38,474. Georgia had the 24th highest rate of growth in student homelessness nationwide during that time.
- On average, Georgia received $62.83 per homeless student in SY 2015–16, down from $66.40 in SY 2011–12 (a decrease of 5%). Nationally, the per-student average for SY 2015–16 was $57.43.
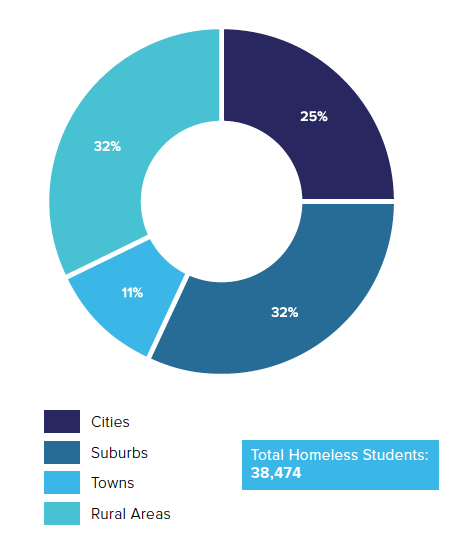
Where Homeless Students Live, by Population Density
SY 2015–16
Source: U.S. Department of Education, “Homeless Student Enrollment Data by Local Educational Agency School Year 2015–16”; National Center for Education Statistics, Education Demographic and Geographic Estimates (EDGE) Program, Geographic Indicators and Identifiers 2015–16.
Families in rural areas or small towns often have fewer shelters or services to turn to for assistance.
- While almost half of all Georgia students live in suburban school districts, suburbs were home to just one-third of the state’s homeless students.
- Among cities, two school districts had over 1,000 homeless students (Atlanta Public Schools and Muscogee County).
- Homelessness was disproportionately seen in Georgia’s urban and rural areas. Despite enrolling 17% of Georgia’s public school students, 25% of the state’s homeless students resided in cities. Similarly, 26% of all students hailed from rural school districts, yet rural areas were home to almost one-third of Georgia’s homeless students.
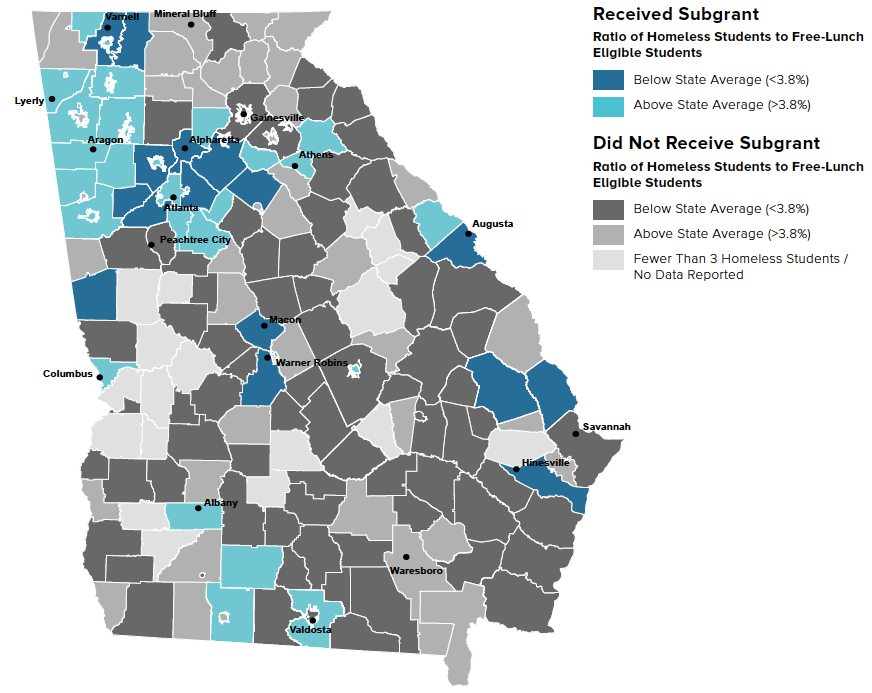
School Districts Potentially Under-Identifying Homeless Students
SY 2015–16
School districts with lower ratios of homeless students to free-lunch eligible students are likely under-identifying those not in shelter.
Statewide
Number of districts: 203
Number of districts that received a subgrant: 44
Percent of districts that received subgrants: 22%
Total homeless students: 38,474
Number of students eligible for free lunch: 1,004,357
Ratio of homeless students to free-lunch eligible students: 3.8%
Source: U.S. Department of Education, “Homeless Student Enrollment Data by Local Educational Agency School Year 2015–16”; National Center for Education Statistics, Education Demographic and Geographic Estimates (EDGE) Program, Geographic Indicators and Identifiers 2015–16.
- Twenty-two percent of Georgia’s school districts received McKinney-Vento subgrants, and 71% of the state’s homeless students lived in a district with a subgrant. Non-grantee districts with the most homeless students included Monroe and Chatham Counties.
- In Georgia, 44% of school districts had a ratio of homeless students to free-lunch eligible students smaller than the statewide average (3.8%), including 15 that received subgrants.
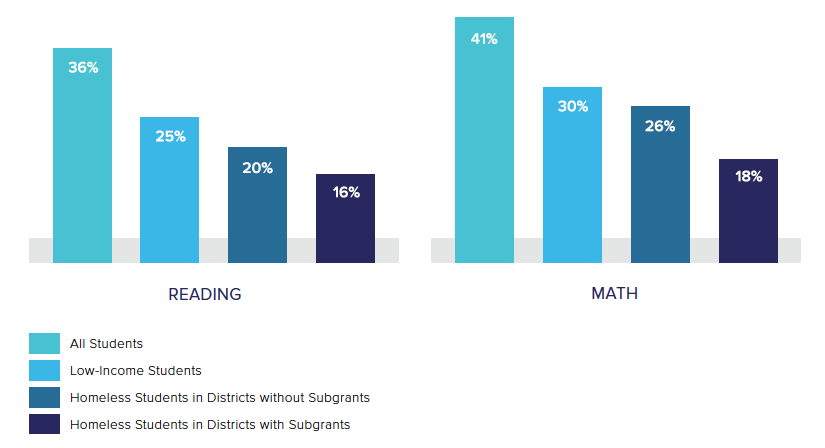
Proficiency in 4th Grade Reading and Math
SY 2015–16
Student performance in early grades is a strong predictor of high school graduation.
Source: U.S. Department of Education, ED Data Express, SY 2015–16; U.S. Department of Education, “State Assessments in Reading/Language Arts and Mathematics School Year 2015–16”.
- Statewide: On average, homeless students were proficient in reading at a rate 16–20 percentage points lower than all students. In math, homeless students were proficient at a rate 15–23 percentage points lower than all students.
- A closer look: Across all grades, Decatur City had the largest achievement gap in math and reading between all students and homeless students. In reading, 71% of the student body as a whole tested proficient, while 20% of homeless students scored proficient. Similarly, 68% of all students were proficient in math, while around 19% of homeless students were proficient.
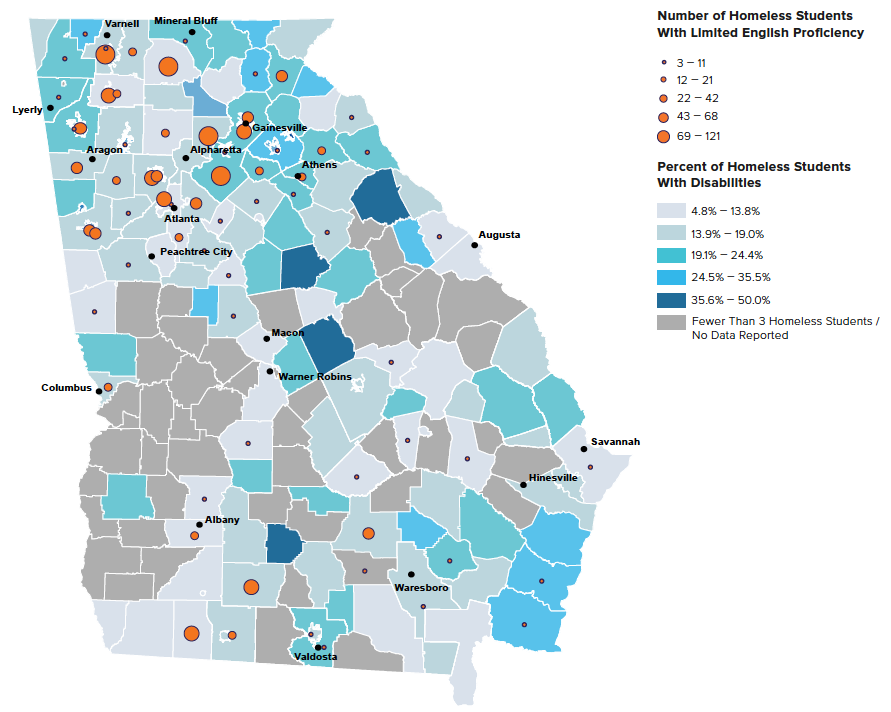
Homeless Students with Additional Support Needs
by School District, SY 2015–16
Students with disabilities or limited English proficiency may have difficulty accessing additional support services if they are homeless.
Statewide
Number of homeless students with disabilities: 6,304
Percent of homeless students with disabilities: 16%
Percent of all students with disabilities: 12%
Number of homeless students with limited English proficiency: 1,524
Percent of homeless students with limited English proficiency: 4%
Percent of all students with limited English proficiency: 6%
Source: U.S. Department of Education, “Homeless Student Enrollment Data by Local Educational Agency School Year 2015–16”; U.S. Department of Education, ED Data Express, SY 2015–16.
- In four school districts, over 40% of homeless students were identified as having a disability (Putnam, Wilkes, Commerce, and Wilkinson Counties). This represents 2.5 times the average rate for homeless students in the state.
- In three school districts, over 30% of homeless students had limited English proficiency, over seven times the statewide rate for homeless students (Buford City, Gilmer County, and Atkinson County).
Homeless students are too often overlooked by policymakers when talking about education policy. Improving outcomes and supports for homeless students reduces the burden on teachers, parents, and schools who struggle to help students cope with the trauma of homelessness along with the challenges of poverty.
Questions for educators, advocates, and elected officials:
- Has universal McKinney-Vento funding improved academic outcomes for homeless students?
- How is the money being used?
- Do you know how many homeless children live in your town? In your state?
- What supports are being provided to help homeless children toward better educational outcomes?
- Are the challenges that homeless students face, such as chronic absenteeism and difficulty traveling to and from school, being addressed?
- Are the educational needs specific to homeless students being identified?
- Does your public school have a dedicated liaison whose priority and focus is the needs of homeless students?
- Do schools coordinate with the shelter system or service delivery system?
- Are homeless students being granted access to services to which they are entitled (e.g. transportation, tutoring, special education, health care, food)?
Source Notes
Georgia’s local education agencies include charter districts and state agencies that cannot be mapped but are included in all other data analyses. • Unless otherwise noted, statewide data are from National Center for Homeless Education, “Federal Data Summary School Years 2013–14 to 2015–16: Education for Homeless Children and Youth” https://nche.ed.gov/downloads/data-comp-1314-1516.pdf; National Center for Homeless Education, “Georgia” http://profiles.nche.seiservices.com/StateProfile.aspx?StateID=13. • The McKinney-Vento definition of “doubled up” refers to children and youths who are sharing the housing of other persons due to loss of housing, economic hardship, or a similar reason.
Ralph da Costa Nunez, PhD, President and CEO
Aurora Zepeda, Chief Operating Officer
Alexander Tucciarone, Director of Marketing and Communications
Project Team:
Josef Kannegaard, Principal Policy Analyst
Chloe Stein, Senior Policy Analyst
Kristen MacFarlane, Senior GIS Analyst
Marcela Szwarc, Graphic Designer
Waqas Sheikh, GIS Intern