a policy brief from ICPH
November 2012
In 2011, over one-third (35%) of New York City residents had difficulty affording essential food.1 Since the recession, more families, both locally and nationally, are relying on the federal Supplemental Nutrition Assistance Program (SNAP, formerly the Food Stamp Program) for their nutritional needs. However, the SNAP benefit allowance does not take into account the higher cost of food in New York City compared to other urban areas. This difference is especially problematic for New York City’s homeless and at-risk families and their children, who in large part depend on public assistance not only for food, but also for the resources they require to return to or maintain permanent housing.
Despite the official end to the economic downturn in 2009, the City’s unemployment (8.9%) and poverty (20%) rates remained high through 2010. Facing tighter budgets, low-income families’ options for managing food insecurity—insufficient access to basic nutrition—are often limited to dietary sacrifices.2 In 2011, half (48%) of families making under $25,000 a year reduced the amount of food they purchased. One-third (33%) of low-income families reported having to choose rent payments over food and two-thirds (65%) said they would not be able to provide food for themselves within three months of a job loss.3 The lasting health effects of these trade-offs and dietary changes are felt most by children; studies have shown that young children living with food insecurity are more likely to develop chronic illnesses and experience cognitive delays.4
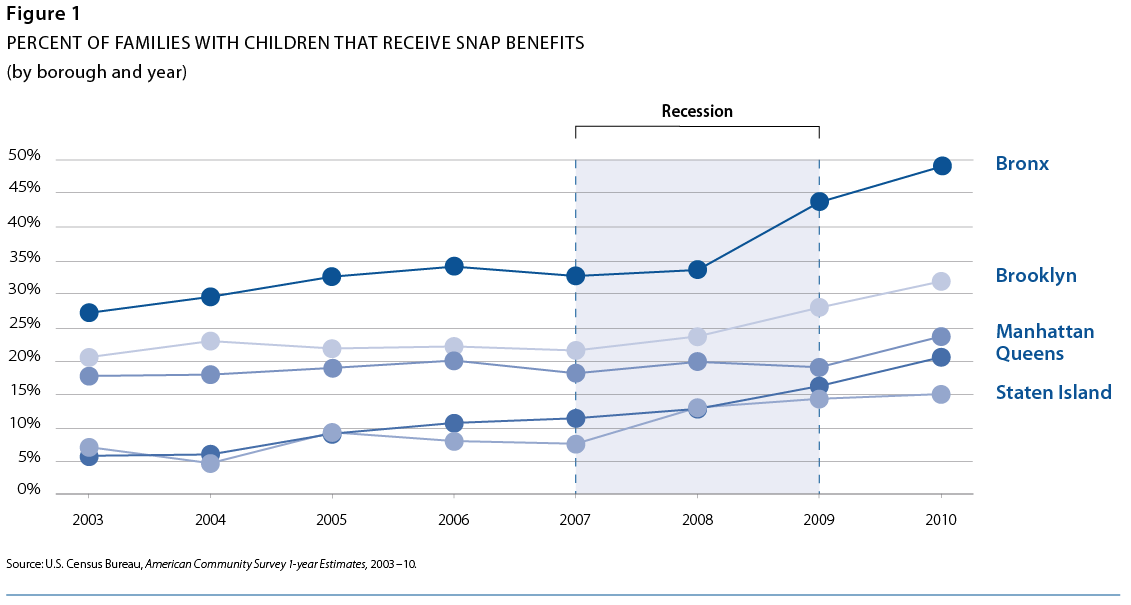
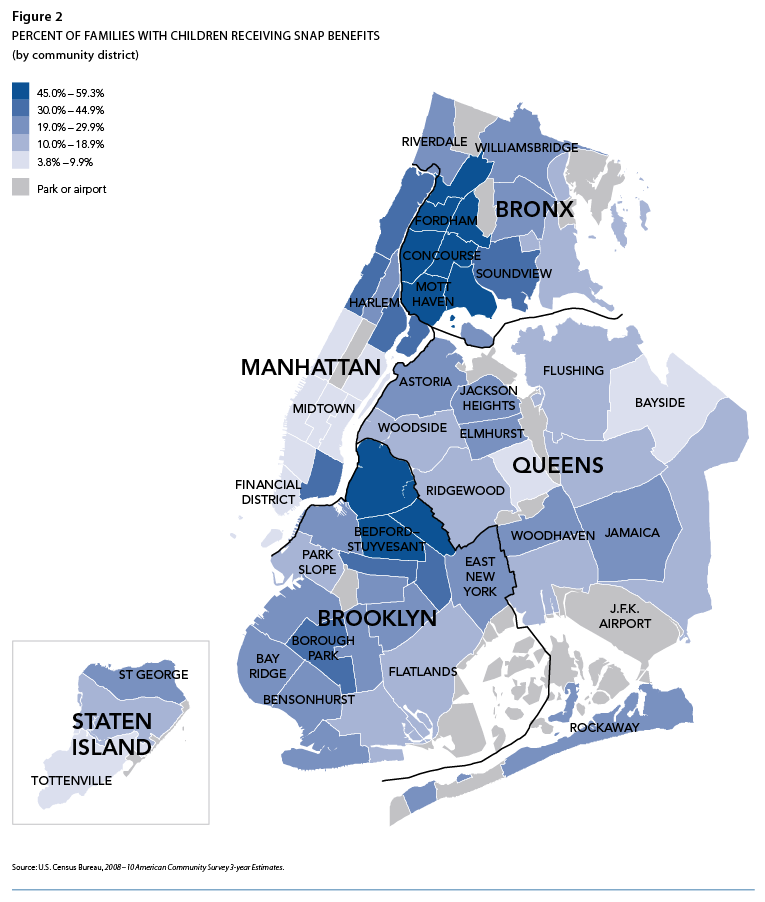
Administered by the U.S. Department of Agriculture, SNAP works to combat food insecurity by supplementing the earnings of income-eligible families and defraying the cost of nutritionally adequate food. Nearly one-third (30%) of New York City families with children received SNAP benefits in 2010, an increase of 50% since the recession began in 2007. In 2010, half (49%) of all Bronx families and one-third (32%) of all Brooklyn families used SNAP to purchase food (Figures 1 and 2). The boroughs with the lowest percentages of SNAP-enrolled families, Queens (21%) and Staten Island (15%), saw the steepest increases—76%—between 2007 and 2010.5
xxx
All SNAP Dollars Are Not Equal
With more New Yorkers relying on SNAP, it is important to examine the relationship between income, benefit levels, and the price of food to determine whether SNAP can adequately assist families in meeting their nutritional needs. SNAP benefit dollars do not cover the same percentage of food expenses in New York City that they do in other urban areas, meaning that local low-income families in New York City receiving benefits struggle to secure decent nutrition. Families must spend more out of pocket on food, forcing some to choose between sufficient groceries and other expenses such as rent or utilities.
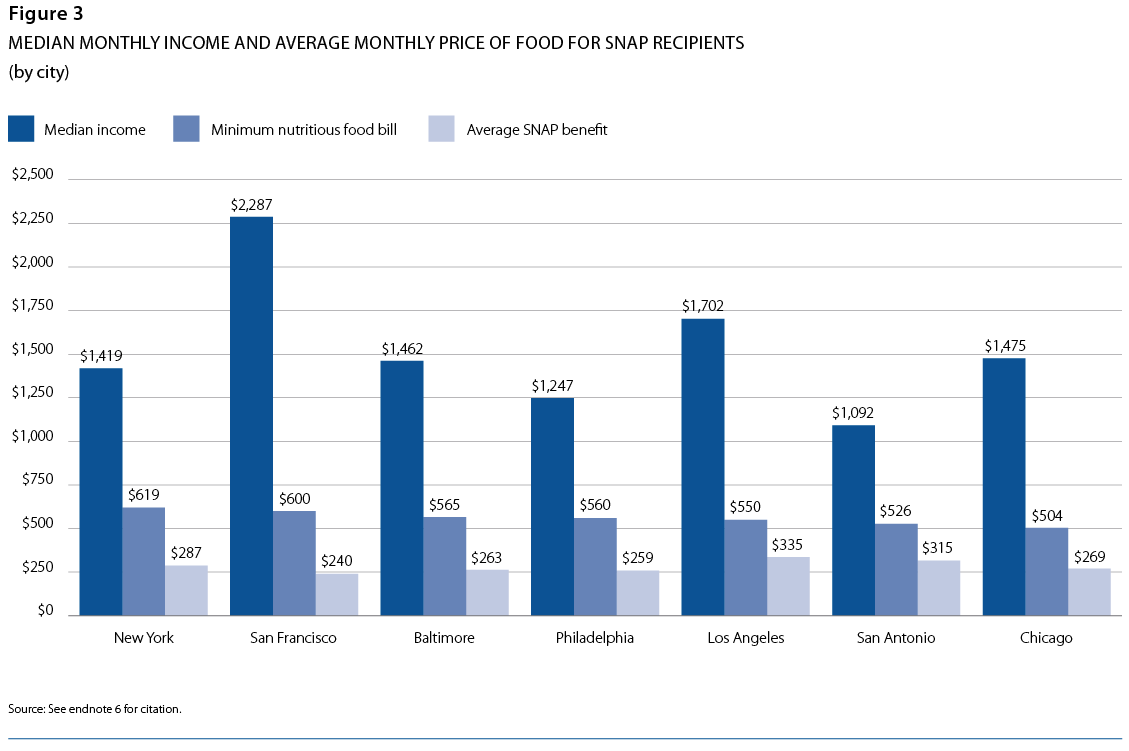
Although expenses such as rent and child care are factored into the determination of a family’s benefit amounts, regional variations in the price of food are not. For example, residents of New York City and San Francisco, where the same basket of items costs more than in other locales, do not receive the same degree of relief as residents of other large cities where prices are lower, such as San Antonio and Chicago (Figure 3).6 Furthermore, while the price of food is roughly equivalent in New York City and San Francisco, the median SNAP recipient in San Francisco earns over $850 dollars more per month, leaving more income to compensate for the high cost of food.
This disadvantage is acute for the more than 10,000 homeless families in New York City.7 The more SNAP benefits a family receives, the less likely it is to become homeless, as using SNAP benefits frees up other income sources for necessities such as housing.8 More homeless adults exiting shelter in New York City (41%, compared to 33% nationwide) receive SNAP than any other form of cash assistance.9 However, as SNAP does not offset the high price of food in New York City (figure 3), some homeless families may experience greater difficulty exiting shelter. With both the U.S. Interagency Council on Homelessness and the New York City Department of Homeless Services focused on connecting homeless families to mainstream benefits, adjusting SNAP benefit amounts for regional variations in the cost of food can have a significant impact on a family’s ability to leave shelter and maintain self-sufficiency in permanent housing. With adult and family homelessness on the rise, simply adjusting SNAP to reflect food cost and need could help prevent hundreds, if not thousands, of families from becoming homeless.