Overview
The 105,000 students in New York City Public Schools presently experiencing homelessness face many challenges—including housing and family instability, stress, depression, hunger, asthma, and lack of sleep—that can negatively impact their education. They also face additional barriers to learning that often place them at a disadvantage compared to their housed classmates. For these students, timely access to educational supports such as pre-K programs, services for English Language Learners (ELLs), and the identification of special education needs can make a significant difference.
Unfortunately, the reality is that for homeless students, these important supports are often lacking or delayed. Rates of pre-K participation are lower for homeless students than for their housed peers. In addition, the special education needs of homeless students are more likely to be identified later, resulting in delayed learning and lower academic achievement. Furthermore, homeless ELLs often need more time than housed ELLs to become proficient in English, most likely due to academic disruptions caused by absenteeism and school transfers.
- Close to 6,000 homeless children enrolled in one of the City’s pre-K programs during SY 2016–17, proportionally well below the approximately 9,000 homeless students enrolled in Kindergarten. The homeless children who did participate in a pre-K program had the opportunity to develop the cognitive, behavioral, and social skills needed for a successful transition to elementary school.
- For the 157,000 ELLs attending New York City’s public schools—of whom roughly 26,000 are homeless—timely access and stable participation in programs that help students achieve early fluency is similarly fundamental to their academic success.
- Over 211,000 students with special needs—over 22,000 of whom are homeless—have Individualized Education Plans (IEPs), which outline the services that they require to support their learning. Early identification of eligible students’ special needs and timely development of an IEP can give these students an opportunity to thrive in school.
About Student Homelessness in New York City
One in 10 New York City public school students were identified as homeless during the 2016–17 school year, the most recent year of data available at the time of publication. Given the prevalence of homelessness among school-aged students, the specific educational challenges that students experiencing homelessness face need to be identified so that educators and policymakers can advocate for the resources to help these students reach their potential.
Student Homelessness in New York City sheds light on the more than 140,000 New York City public school students who have experienced homelessness over the past seven years. This series, which does not include data from charter schools, explores the geography of student homelessness; the prevalence of school instability factors like chronic absenteeism and mid-year school transfers; whether homeless children are participating in the city’s Pre-K for All program, and if the additional educational needs of language learners and students with special education needs are being met on time; the disproportionate rate of suspensions among students experiencing homelessness; and academic outcomes like graduation rates and test scores.
1.0 | Addressing Barriers To Learning: Participation in Pre-Kindergarten
Pre-K for All
All children who turn four before January 1st of a given school year are eligible to apply for New York City’s universal pre-Kindergarten program, called Pre-K for All. Programs are free, have half- and full-day options, and are operated by either the New York City Department of Education or contracted community-based organizations.
New York City’s expansion of Pre-K for All is based on growing evidence that high-quality early education can have a positive effect on a student’s education in later years. This additional support can be especially beneficial to homeless students, who often struggle academically over the course of their education. Beginning in SY 2014–15, the City’s Pre-K for All program expanded free, full-day pre-K access to all four-year-olds. Prior to that year, only 19,000 of the city’s 58,000 pre-K students were enrolled in a full-day program. When expansion of Pre-K for All ended in 2016, the number of full-day slots had grown to approximately 70,000.
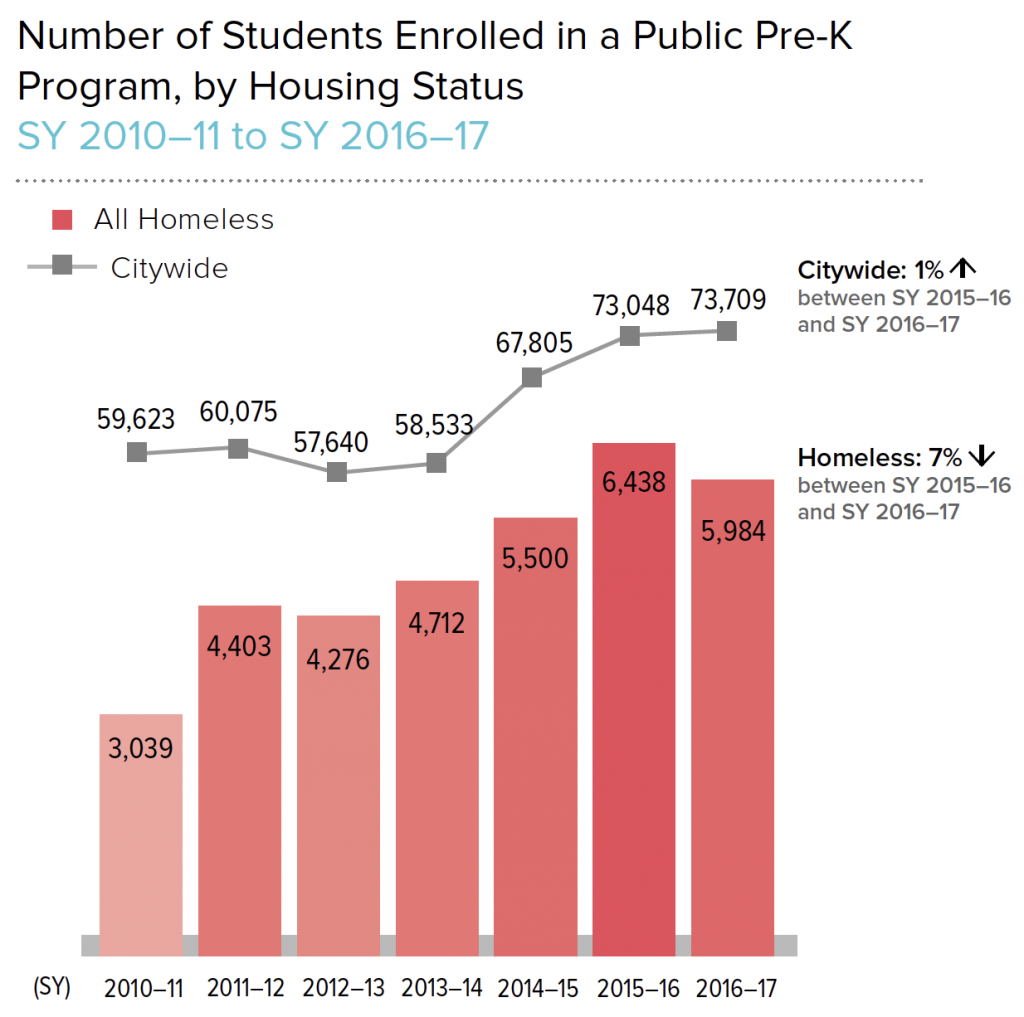
Initially, the program saw success in reaching and enrolling homeless students, with the number enrolled rising steadily from SY 2010–11 to SY 2015–16. In SY 2016–17, however, homeless student enrollment dropped despite citywide increases in both student homelessness and total pre-K enrollment. Areas of the Bronx and Brooklyn saw the steepest decreases.
Students experiencing homelessness are not accessing this critical opportunity at the same rate as their housed peers. As such, it is imperative that obstacles preventing homeless families from participating in pre-K programs be identified so that the Department of Education and other government agencies can respond appropriately to ensure that all of the city’s youngest students develop the skills they need to thrive in school for years to come.
1.1 How Have Pre-K Enrollment Levels Changed Over Time?
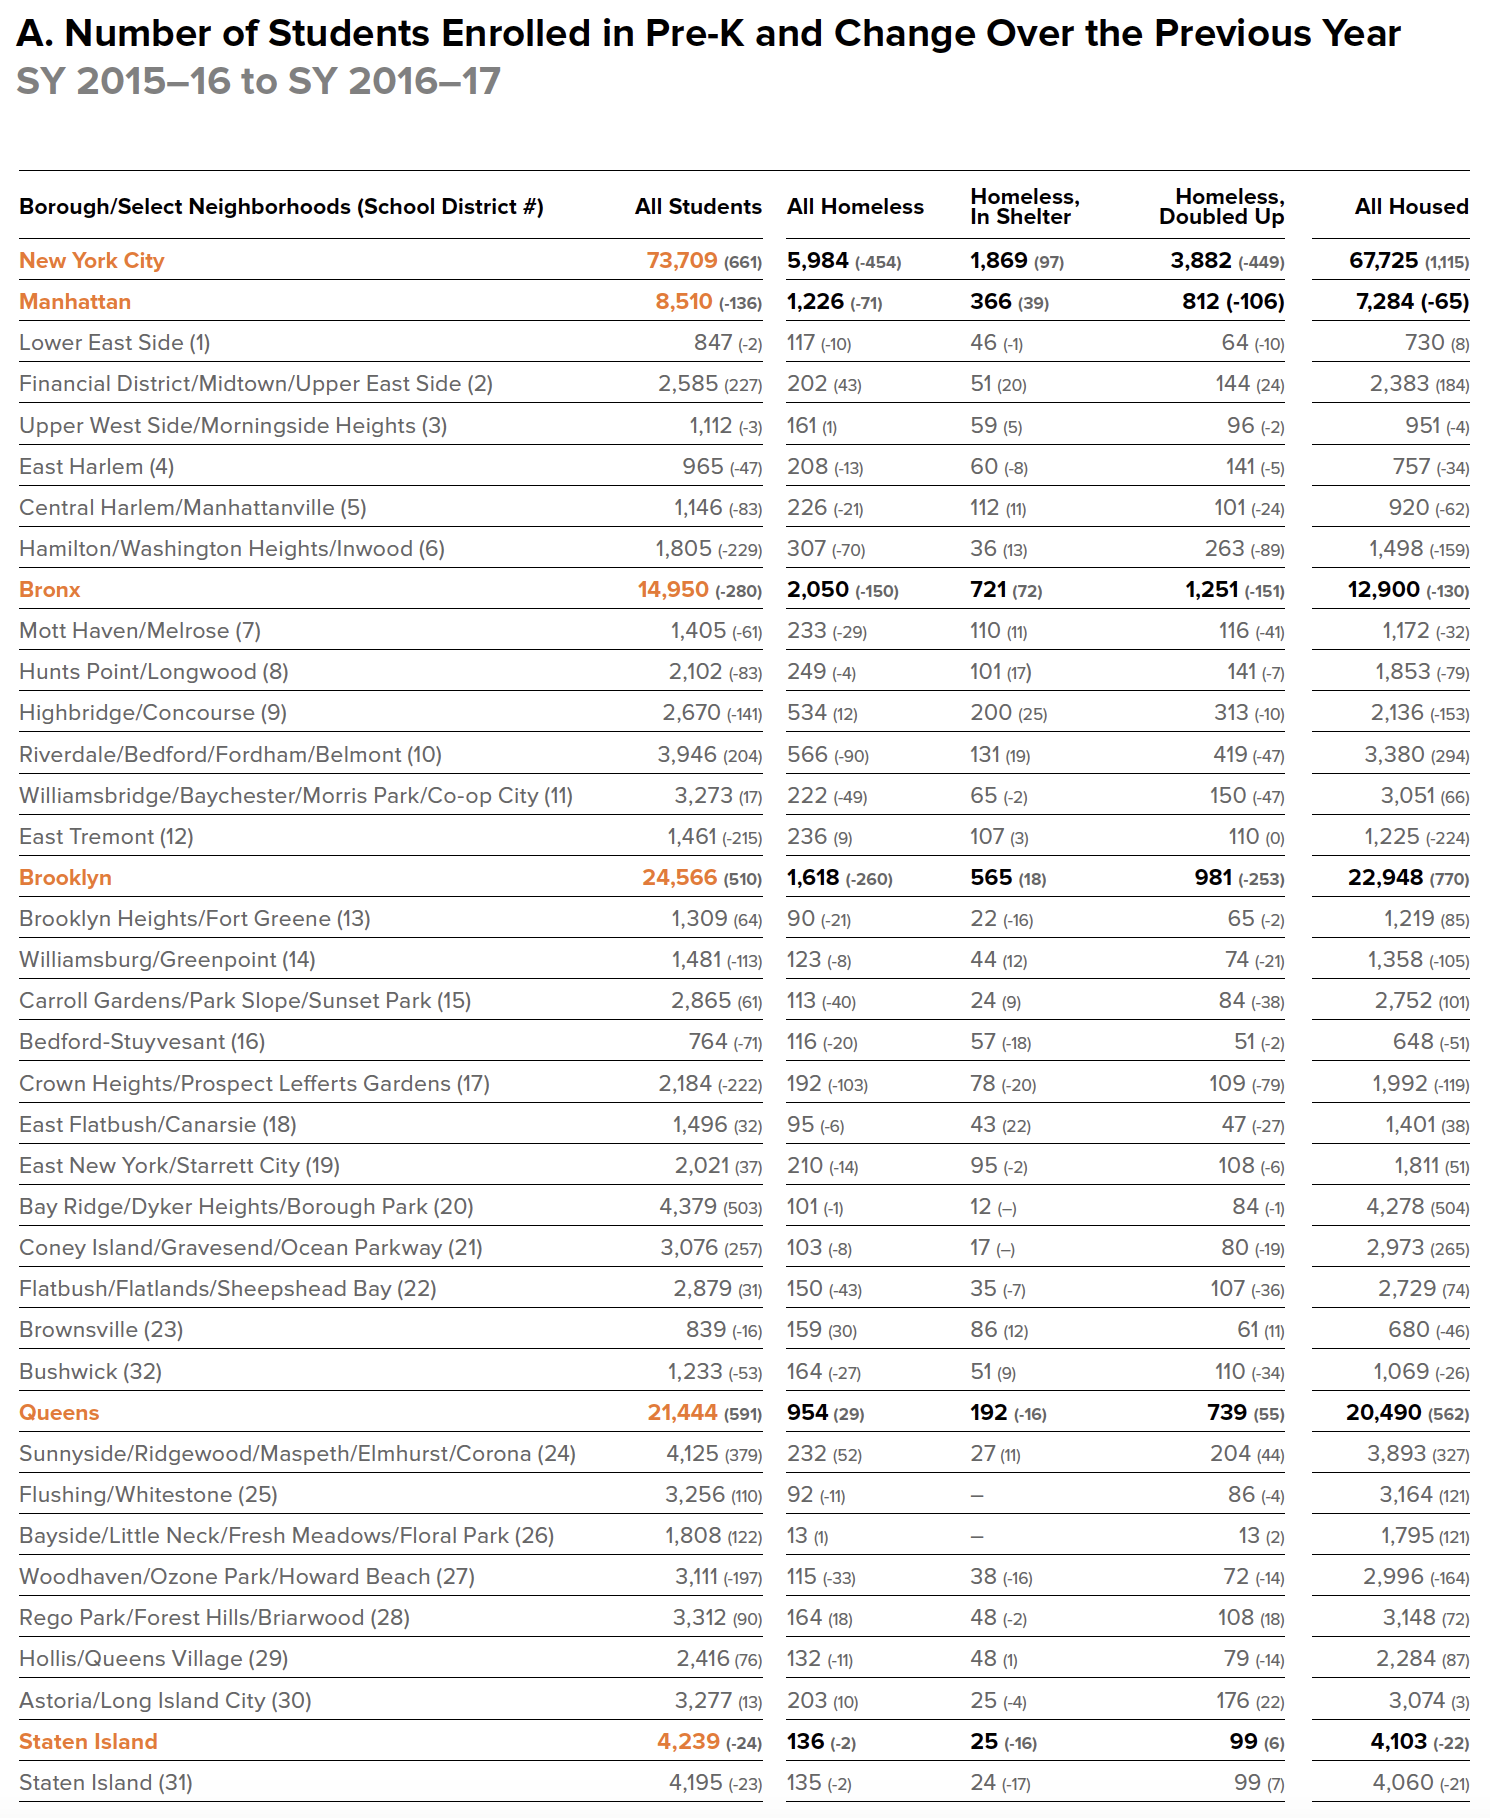
- From SY 2010–11 to SY 2016–17 the number of children experiencing homelessness enrolled in pre-K rose, peaking at 6,400 in SY 2015–16 before dropping below 6,000 in SY 2016–17.
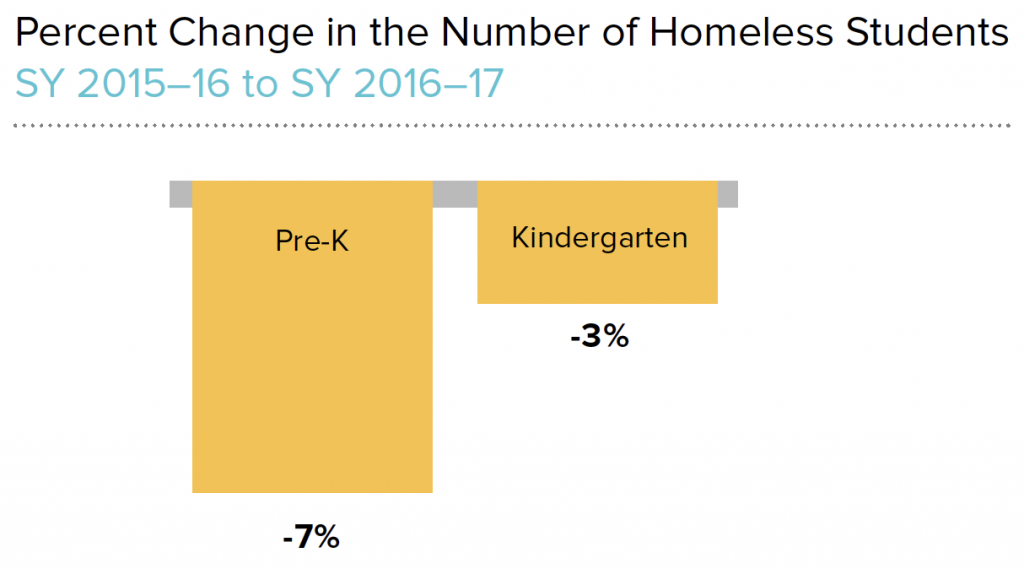
- From SY 2015–16 to SY 2016–17, the number of homeless pre-K students dropped to less than 6,000—a 7% decrease in one year. This occurred despite the overall number of pre-K students increasing slightly during the same year.
- The decline in the number of homeless pre-K students (-7%, or -454 students) from SY 2015–16 to SY 2016–17 does not mirror the much smaller decrease seen in the number of homeless students enrolled in Kindergarten (-3%, or -281 students).
- Without more data, the reason behind the decline in homeless pre-K enrollment can only be speculated. Possible explanations include a decrease in the number of age-eligible homeless students, or a decrease in the number of available slots, among other reasons.
KEY TERMS
All Homeless
Students who were identified at any point during SY 2016–17 by the New York City Department of Education as meeting the McKinney-Vento definition of homelessness. This includes students in shelter, doubled up, in hotel/motels, or other temporary arrangements.
All Housed
Students who lived in a fixed, regular, and adequate housing situation.
Low-Income
Students who were eligible for free or reduced-price lunch, or identified by the New York City Human Resources Administration as receiving certain types of public assistance, including Supplemental Nutrition Assistance Program (SNAP) or Temporary Assistance for Needy Families (TANF). In SY 2016–17, the maximum household income for a family of four to be eligible for a free or reduced-price lunch was $44,955.
From SY 2015–16 to SY 2016–17, the number
of homeless and low-income housed students
enrolled in pre-K decreased by more than 450
and 2,300 students, respectively. At the same
time, the number of non-low-income housed
students increased by nearly 3,500. There is not
yet available data to explain what is driving this
growing disparity.
1.2 Do Pre-K Enrollment Levels Vary Across School Districts?
- Twenty-three districts, or nearly three-fourths of all districts citywide (72%) enrolled fewer homeless children in pre-K during SY 2016–17 compared to the previous year.
- At the borough level, Brooklyn had the largest enrollment decrease (-14%), followed by the Bronx, Manhattan, and Staten Island (-7%, -5%, and -1%, respectively). Queens was the only borough that saw an increase in enrollment of homeless pre-K students—up 3% from SY 2015–16.
- At the neighborhood level, Crown Heights (-35%), Sunset Park (-26%), and Woodhaven (-22%) experienced the largest decreases in the number of homeless children enrolled in pre-K (Districts 17, 15, and 27, respectively).
- Sunnyside (29%), Midtown (27%), and Brownsville (23%) saw the largest increases in enrollment (Districts 24, 2, and 23, respectively).
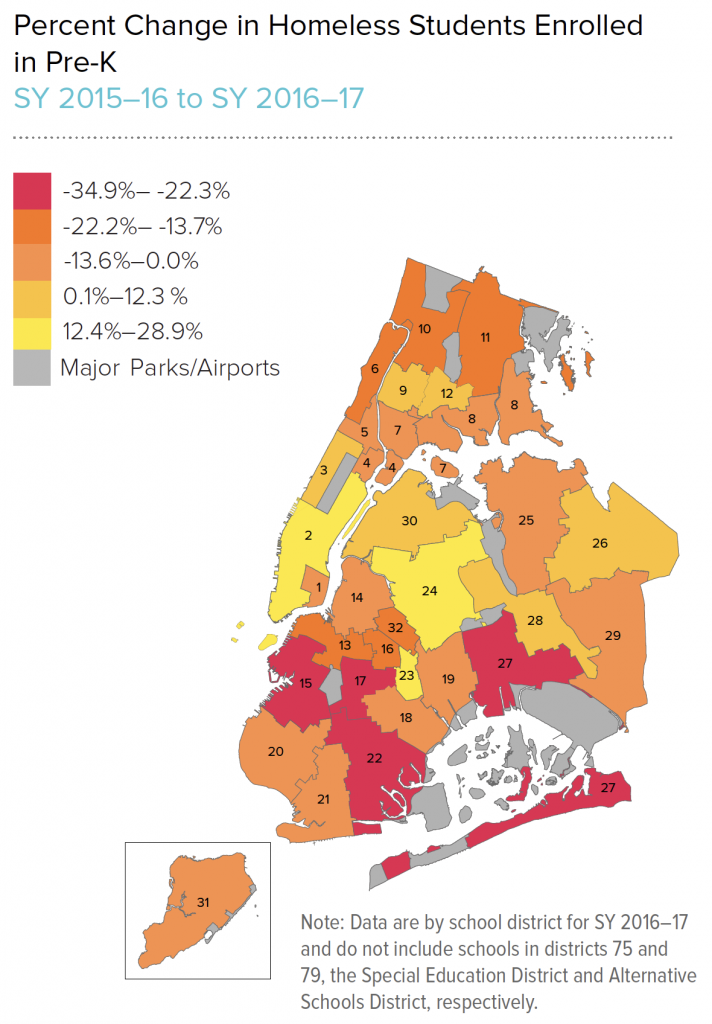
- In 10 of the 32 districts, the decrease in enrollment of homeless pre-K students occurred alongside an increase in the number of homeless Kindergarteners. Of these 10 districts, Hamilton saw the largest decrease (-19%) in the number of homeless pre-K students, from 377 to 307 students, while the number of homeless Kindergarten students increased from 389 to 407 students (5%) (District 6). Bay Ridge had the smallest decrease (-1%), from 102 to 101 homeless pre-K students, while the number of homeless Kindergarten students increased from 265 to 275 (4%) (District 20).

A decrease in the number of homeless pre-K students occurring alongside
an increase in the number of homeless Kindergarten students could signal
the existence of barriers to outreach, recruitment, or enrollment for homeless
students in the City’s pre-K programs.
1.3 Does Pre-K Enrollment Vary by Students’ Primary Night-Time Residence?
- In SY 2016–17, 32% of homeless students in Kindergarten did not enroll in pre-K the previous year, compared to 27% of their housed classmates.
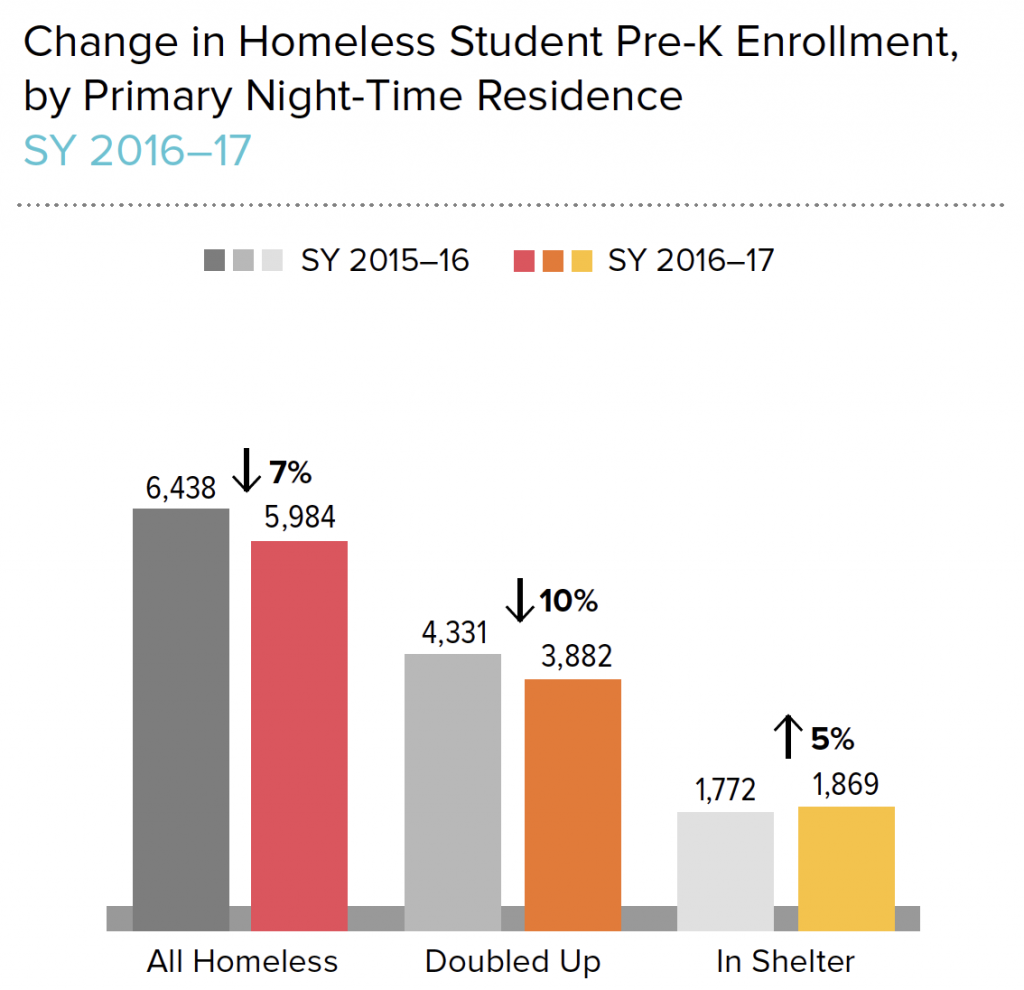
- From SY 2015–16 to SY 2016–17, there was a 7% decrease in the overall number of homeless students enrolled in pre-K. This decrease was driven by a 10% drop in enrollment among homeless doubled-up students and tempered by a modest 5% increase among those living in shelter.
- Homeless students in the Bronx were most likely not to have enrolled in pre-K (36%), while those in Staten Island were least likely not to have enrolled (26%).
- The largest disparity in pre-K enrollment was in Manhattan, where 27% of homeless students were not enrolled in pre-K compared to 38% of housed students who were not enrolled (see box below).
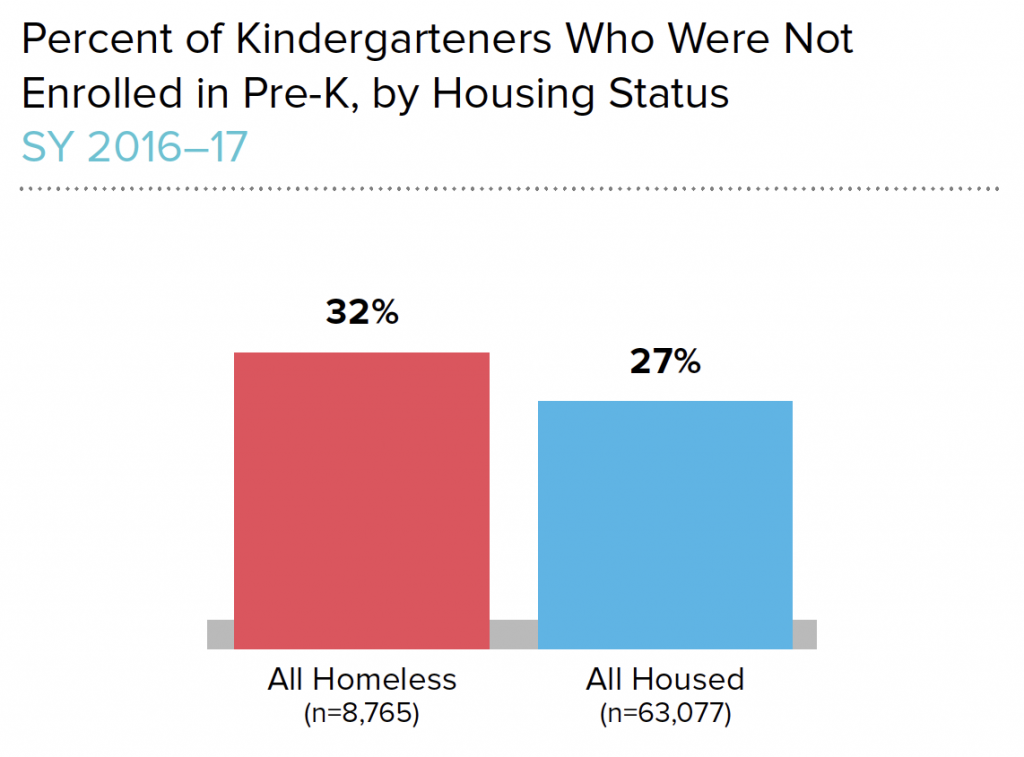
Data note: Rates are shown for students who attended pre-K in New York City public schools. Students may have attended a private pre-K program or a program outside of New York City. Students who are shown as housed and did not attend pre-K may have been homeless in the year prior to Kindergarten, but were not recorded in the data.
KEY TERMS
Homeless, Doubled Up
Students who have found temporary accommodations with another family or other person due to loss of housing or economic hardship.
Homeless, In Shelter
Students who lived in emergency or transitional shelter.
The higher rate of housed children who did not
enroll in public pre-K compared to homeless
children in Manhattan may be attributable to housed
students enrolling in private pre-K programs, which
would not be reflected in the data. This is supported
by the far lower rate of housed, low-income children
who did not enroll in pre-K in Manhattan (22%).
1.4 Does Pre-K Participation Correlate With Academic Performance?
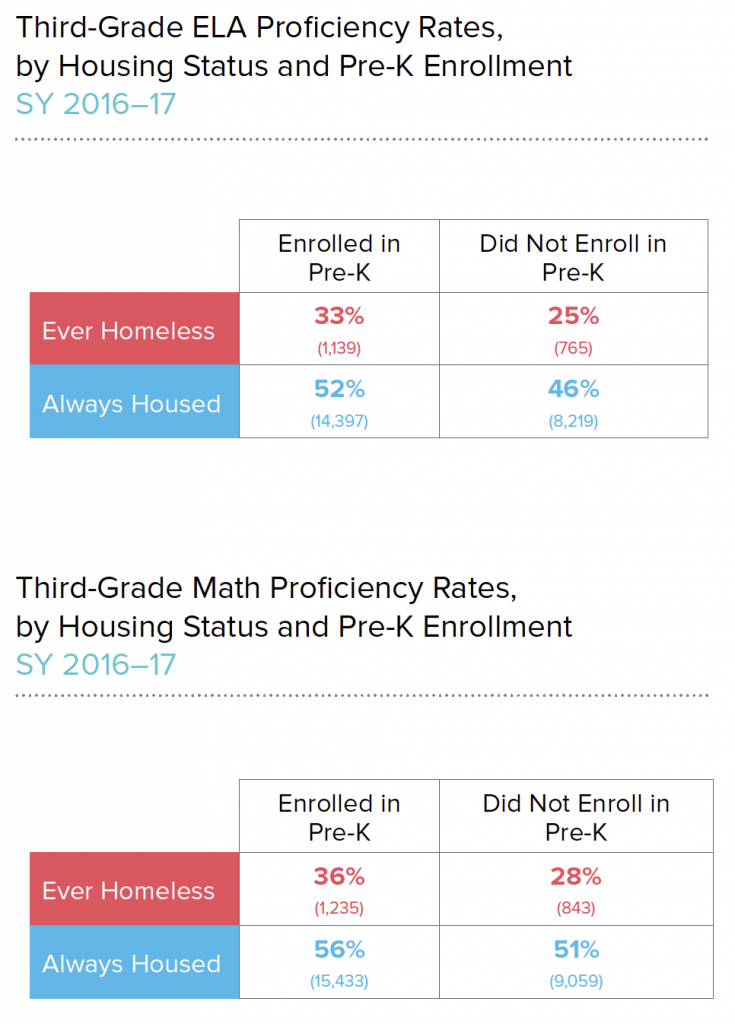
- Homeless students who attended pre-K were more likely to score proficient on the third-grade English Language Arts (ELA) statewide assessment than homeless students who did not attend pre-K (33% vs. 25%). Similarly, in math, 36% of homeless students who attended pre-K scored proficient in third grade compared to 28% who did not attend pre-K.
- About one-third (33%) of homeless students who attended pre-K scored proficient on their third-grade statewide ELA assessment compared to more than half (52%) of housed students who attended pre-K.
- Similar results were seen with the third-grade math test. Homeless students who attended pre-K were more likely to score proficient on the exam than those who did not (36% vs. 28%). However, over half of housed students scored proficient on the test, regardless of whether they attended pre-K.
Data note: Rates are shown for students who attended pre-K in New York City public schools. Students may have attended a private pre-K program or a program outside of New York City. Students who are shown as always housed and did not attend pre-K may have been homeless in the year prior to Kindergarten, but were not recorded in the data. Students who were ever homeless between Kindergarten and third grade may have lived in multiple housing settings.
KEY TERMS
Ever Homeless
Students who were in temporary housing during any of the school years shown.
Always Housed
Students who were never in temporary housing for all of the school years shown.
Statewide Assessments
Assessments are administered every year for students in grades 3–8 in English Language Arts (ELA) and math. Students who score at levels 3 or 4 on a 4-point scale are considered proficient. Students who have resided in the United States for less than one year are not required to take the ELA exam until the following year. Some students with an IEP may take the New York State Alternate Assessments in place of the statewide assessments.
Pre-K enrollment has been shown to correlate
with better educational outcomes, but does not
compensate for housing instability. Students who
experienced homelessness prior to third grade
but attended pre-K were still less likely to score
proficient on their third-grade ELA and math
assessments as housed students who did not
attend pre-K.
2.0 | Addressing Barriers To Learning: English Language Learner Services
English Language Learner (ELL)
An ELL is a student who speaks a language other than English at home and is not yet proficient in English. Federal law mandates that school districts provide an equal education opportunity for ELL students, but does not require or advocate a particular program of instruction. ELL students are required to receive services, but may exit by scoring proficient on the applicable state tests.
The intersecting challenges of homelessness and a lack of English proficiency can be a major barrier to a student’s education. Not only are homeless students more likely than their housed classmates to be English Language Learners (ELLs), they are more likely to need ELL services for a longer period of time. Over half of housed ELLs become proficient in English within three years, compared to only 40% of homeless students. Homeless students who exit ELL services within three years, however, have proficiency rates on standardized tests effectively at or even slightly above the citywide average. Removing barriers to homeless students’ access to ELL programs is therefore key to ensuring that all students have the same access to opportunities, regardless of their housing situation.
2.1 How Many Homeless Students Receive ELL Services?
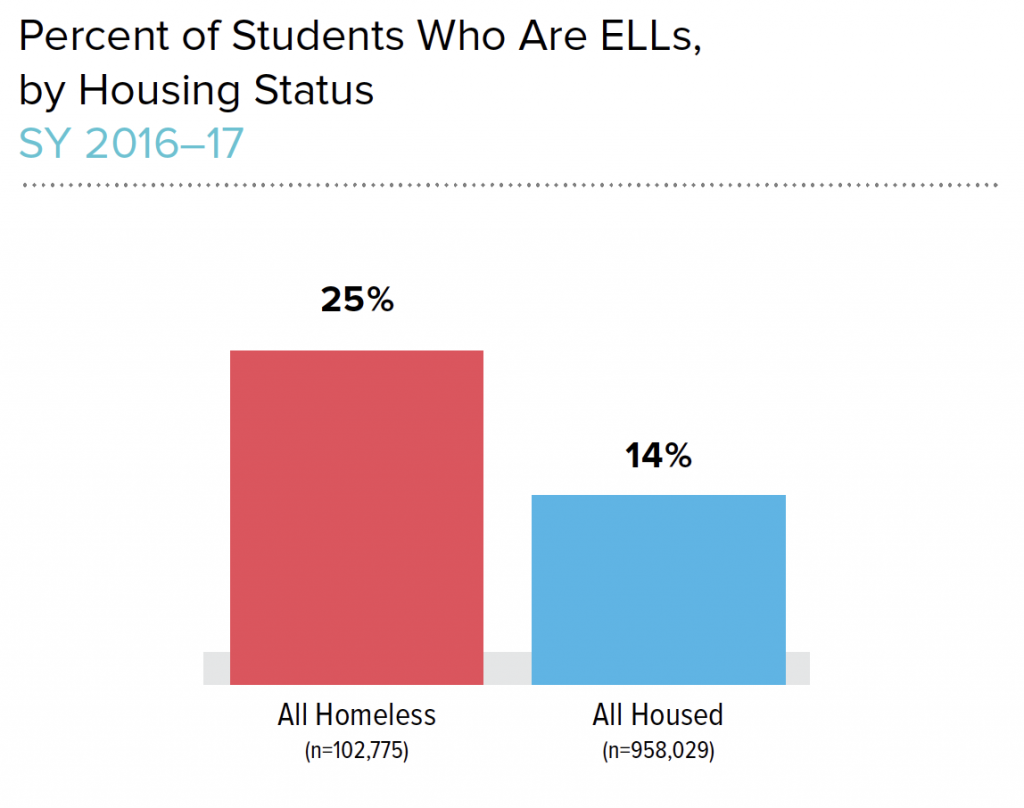
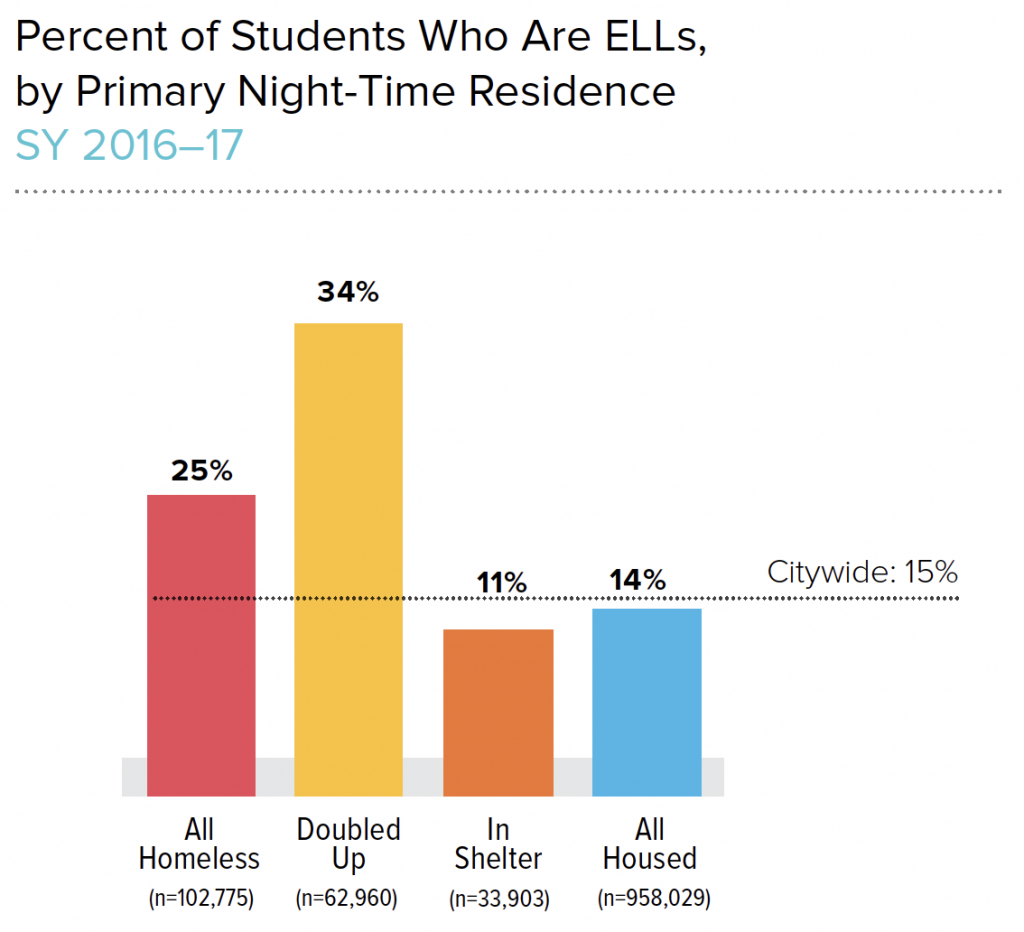
- In total, there were 157,000 ELLs attending New York City Public Schools and about 26,000 of these students were homeless. In SY 2016–17, one in four homeless students (25%) were English Language Learners (ELLs) compared to 14% of housed students who were ELLs.
- Among homeless students, those living in temporary accommodations—commonly referred to as doubled up—were most likely to need ELL services. One-third of doubled-up students (34%) were ELLs compared to about one-tenth of students in shelter (11%).
- At the borough level, Queens and the Bronx had the highest percentage of homeless students who were ELLs (30% and 27%, respectively). Staten Island had the lowest percentage of homeless ELLs, followed by Brooklyn and Manhattan (12%, 22%, and 24%, respectively).
KEY TERMS
Homeless, Doubled Up
Students who have found temporary accommodations with another family or other person due to loss of housing or economic hardship.
Homeless, In Shelter
Students who lived in emergency or transitional shelter.
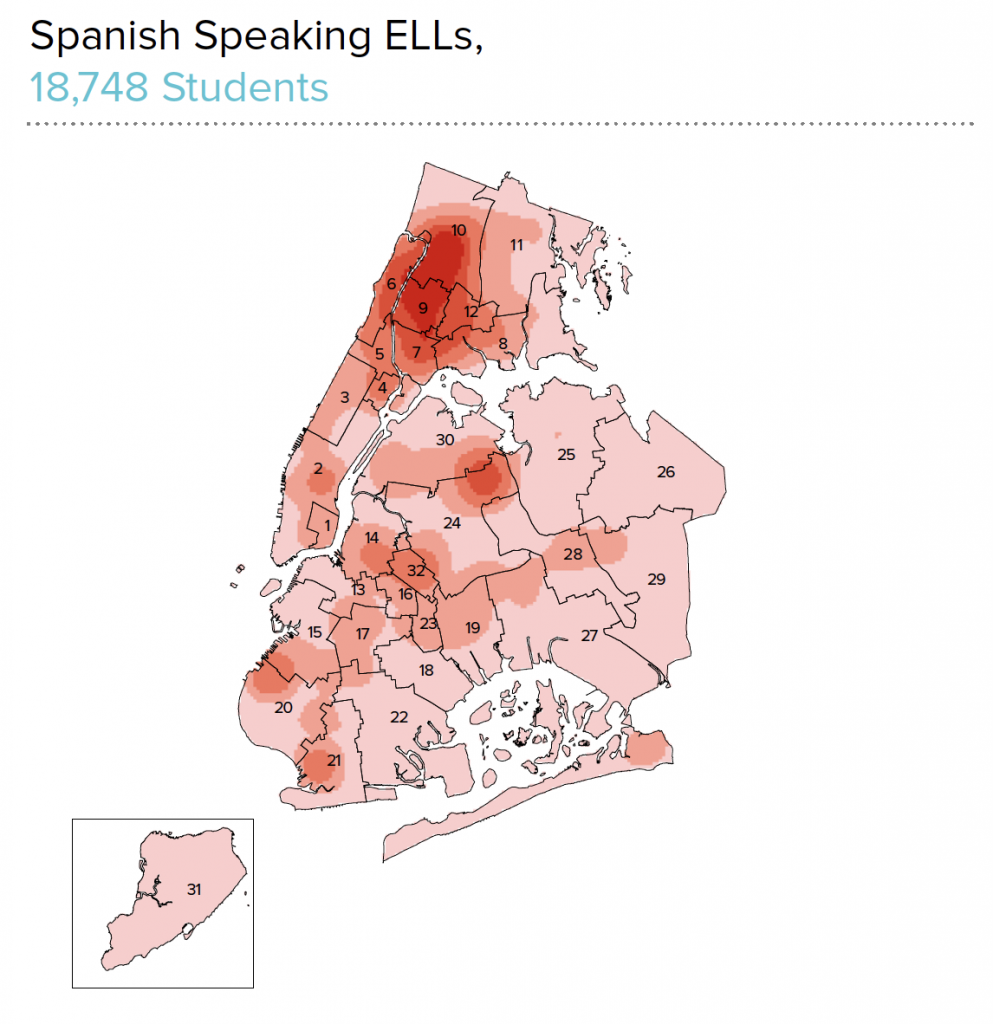
Spanish speakers represented the largest share
of ELLs, regardless of housing status. However,
they were over-represented among homeless
ELLs compared to housed ELLs (72% vs. 58%).
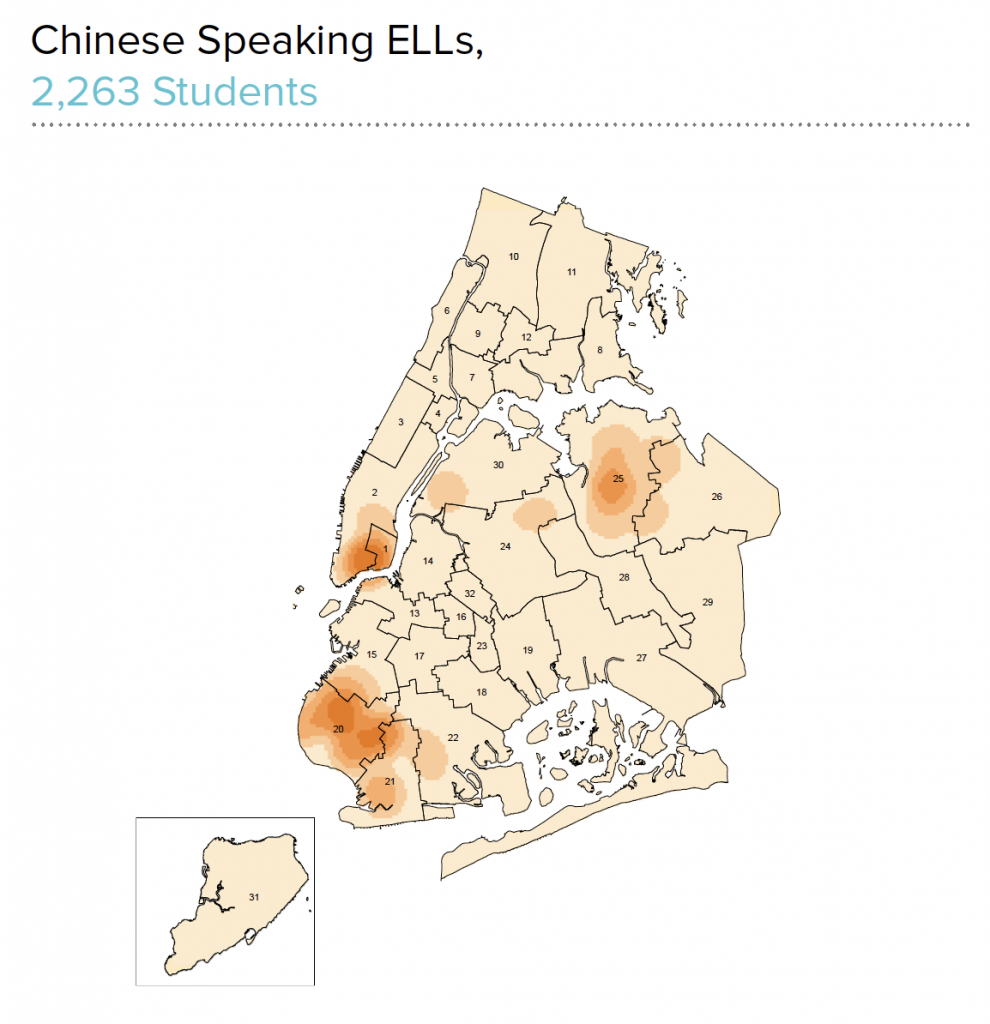
Other common languages spoken by homeless
ELLs included Bengali, Mandarin, and Arabic
(approximately 1,300, 1,200, and 800 students,
respectively).
2.2 How Has the Homeless ELL Population Changed?
- The number of ELL students experiencing homelessness increased by 78%, from nearly 15,000 in SY 2010–11 to about 26,000 in SY 2016–17, while the number of housed ELLs decreased by 4% during the same period.
- Among homeless ELLs, doubled-up students experienced the greatest increase (112%), from approximately 10,000 to more than 21,000. During the same period, the number of ELL students in shelter increased by 24%.
- The Bronx has consistently served the greatest number of homeless ELLs. This number nearly doubled from about 5,100 students in SY 2010–11 to 9,900 in SY 2016–17. Queens saw the largest percentage increase in the number of homeless ELLs over the same period, from about 2,300 to 5,700 students—a 145% increase.
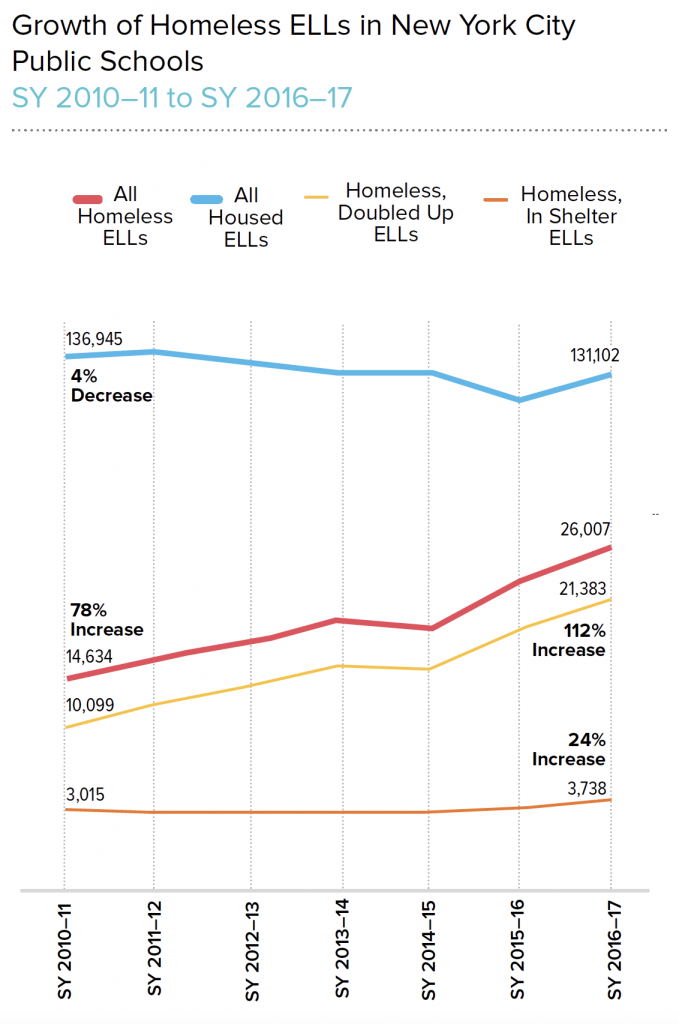
From SY 2010–11 to SY 2016–17, the growth in
the number of homeless ELL students outpaced
the overall growth of the number of homeless
students (78% vs. 57%).
The sharpest increase in the number of homeless
ELLs occurred over a two year period starting
in SY 2014–15. During this time the number of
homeless ELLs increased by 38%, or more than
7,000 students.
This rapid growth over such a short time period
can pose challenges to under-resourced school
districts in providing the necessary support to this
growing group of students.
2.3 How Long Do Homeless Students Take To Become Fluent in English?
- Homeless students require more years of ELL services to become fluent in English compared to housed students. Two in five ELL students (40%) who were ever homeless during their first seven years of school were newcomer ELLs—or those students who learned English within three years. In contrast, 51% of housed students were newcomer ELLs.
- At the same time, nearly two in five homeless ELLs (38%) required seven or more years to learn English (long-term ELLs), compared with 29% of housed students.
- Nearly 9 in 10 housed students whose families were not low-income (89%) were newcomer ELLs (not shown in chart) compared to 51% of housed students overall. This suggests that both income and housing status play a role in increasing the amount of time students need to learn English.
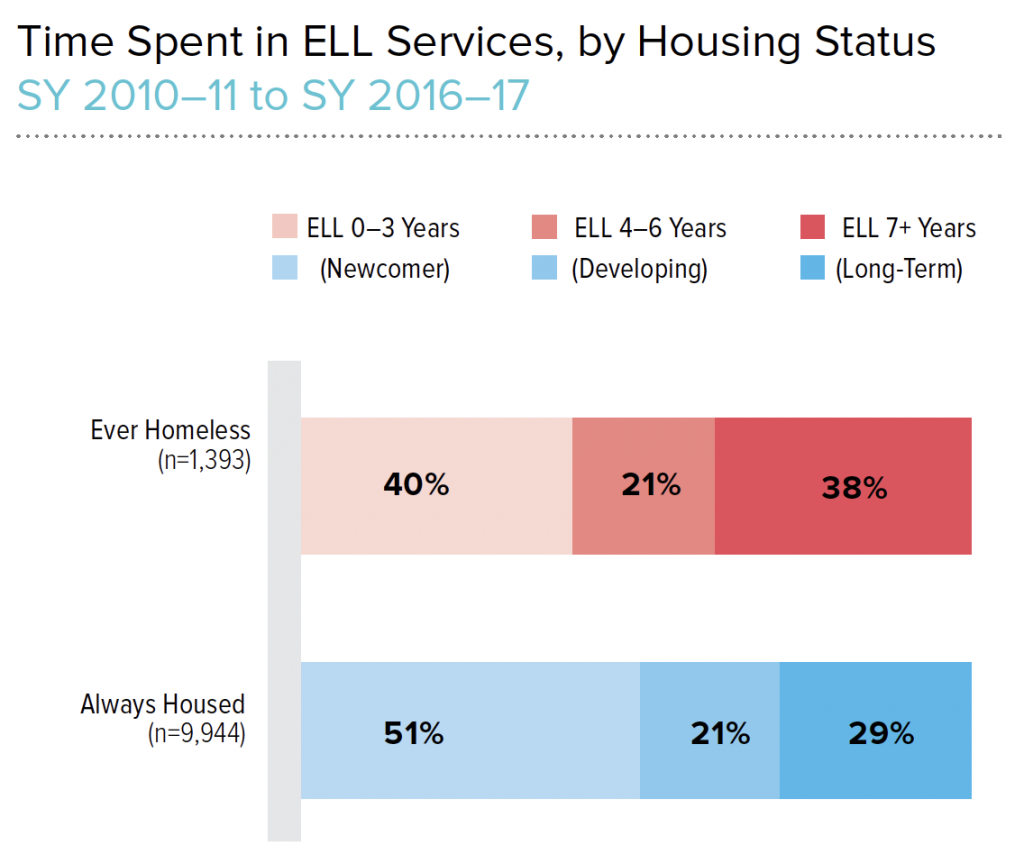
Data represent a seven-year cohort of students who started Kindergarten in SY 2010–11 and received ELL services in that year. Due to rounding, percentages may not total to 100%.
KEY TERMS
Newcomer ELLs
Students who received up to three years of ELL services in New York City public schools.
Developing ELLs
Students who received between four and six years of ELL services in New York City public schools.
Long-term ELLs
Students who received seven or more years of ELL services in New York City public schools.
Ever Homeless
Students who were in temporary housing during any of the school years shown.
Always Housed
Students who were never in temporary housing for all of the school years shown.
Low-Income
Students who were eligible for free or reduced-price lunch, or identified by the New York City Human Resources Administration as receiving certain types of public assistance, including Supplemental Nutrition Assistance Program (SNAP) or Temporary Assistance for Needy Families (TANF). In SY 2016–17, the maximum household income for a family of four to be eligible for a free or reduced-price lunch was $44,955.
Students remain in ELL services until they score
proficient on the New York State English as a
Second Language Achievement Test (NYSESLAT),
administered every spring and composed of
reading, writing, speaking, and listening sections.
Students can also exit ELL services if they score
at near-proficiency on the NYSESLAT and earn a
sufficient score on either the ELA state assessment
(for 3rd–8th grade students) or ELA Regents exam
(for high school students).
2.4 Do Newcomer ELLs Perform Better Academically?
- Homeless ELLs who were newcomers— exiting out of ELL services within three years—scored proficient on their sixth-grade state ELA assessment at rates higher than the citywide average (36% vs 32%), though at lower rates than students who were always housed (44%).
- Similarly, in math, homeless newcomer ELLs scored proficient at a rate above the citywide average (45% vs. 36%), but still nine points lower than the rate for housed newcomer ELLs (54%).
- The gap in sixth-grade proficiency rates between homeless and housed ELLs narrowed to a negligible difference for students who exited ELL services in four to six years. In ELA, developing ELLs who were homeless scored proficient at slightly higher rates than those who were always housed (28% vs. 27%). In math, 35% of homeless developing ELLs scored proficient compared to 39% of their housed peers.
- While homeless ELLs who learned English within three years scored proficient at rates higher than the citywide average, only 40% learned English within this time-frame (as shown in Section 2.3). An almost equally large share of homeless ELLs (38%) take seven or more years to learn English.
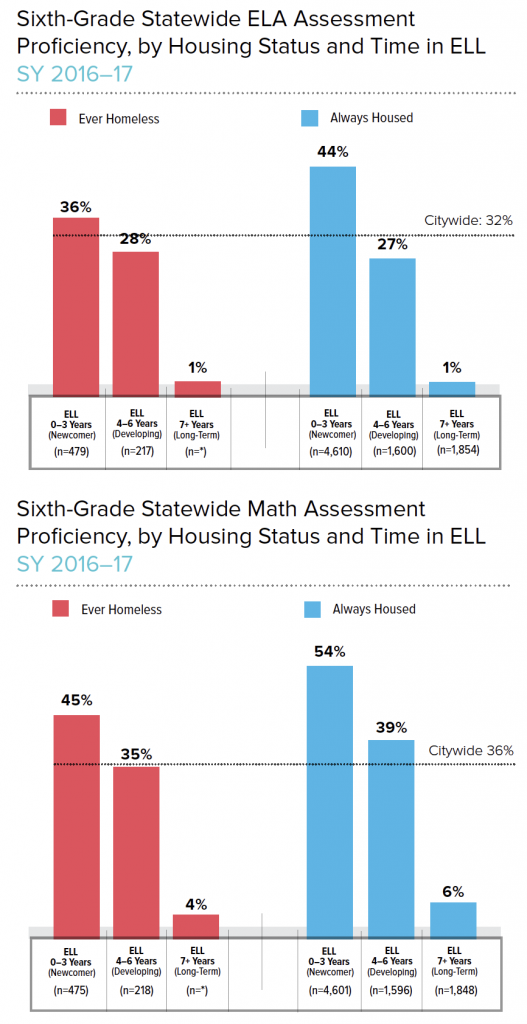
Data represent a seven-year cohort of public school students who started Kindergarten in SY 2010–11, received ELL services in Kindergarten, and were never retained. The number of long-term ELLs who were ever homeless was redacted for privacy purposes.
ELLs who learned English before the start of sixth
grade were far more likely to score proficient on
their statewide assessments. The rate at which
students learn English is likely affected by the
type of ELL services they receive. In New York City
public schools, ELL services may be delivered in
a transitional bilingual or dual-language setting, or
English instruction with additional support in the
student’s home language.
2.5 How Does the Percent of Homeless Students who Are ELLs Vary Across Districts?
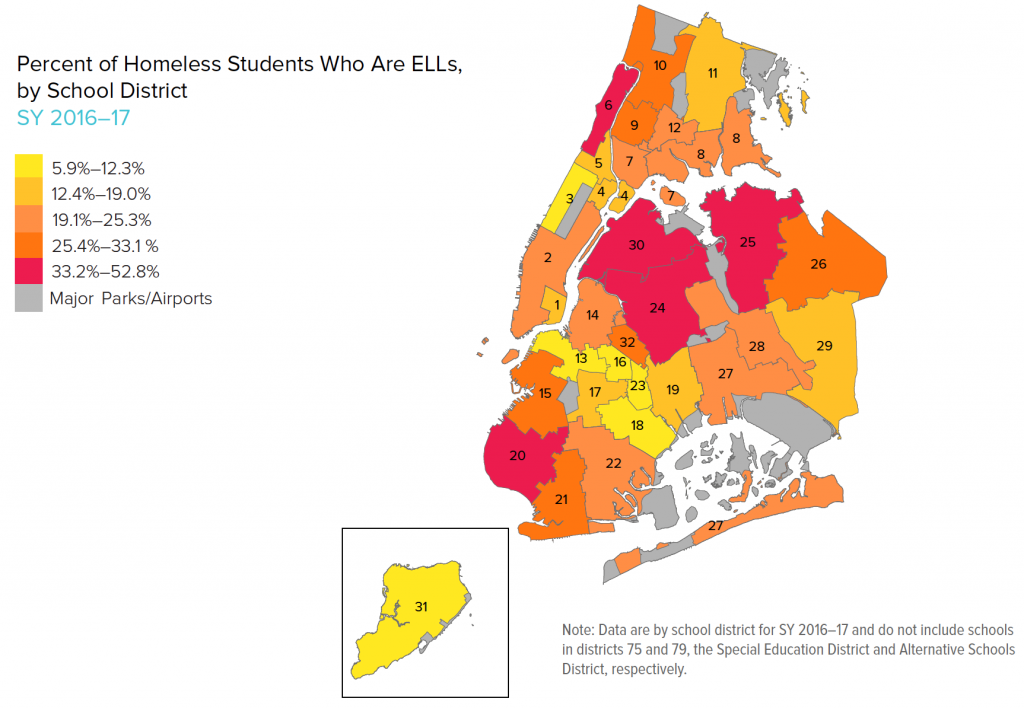
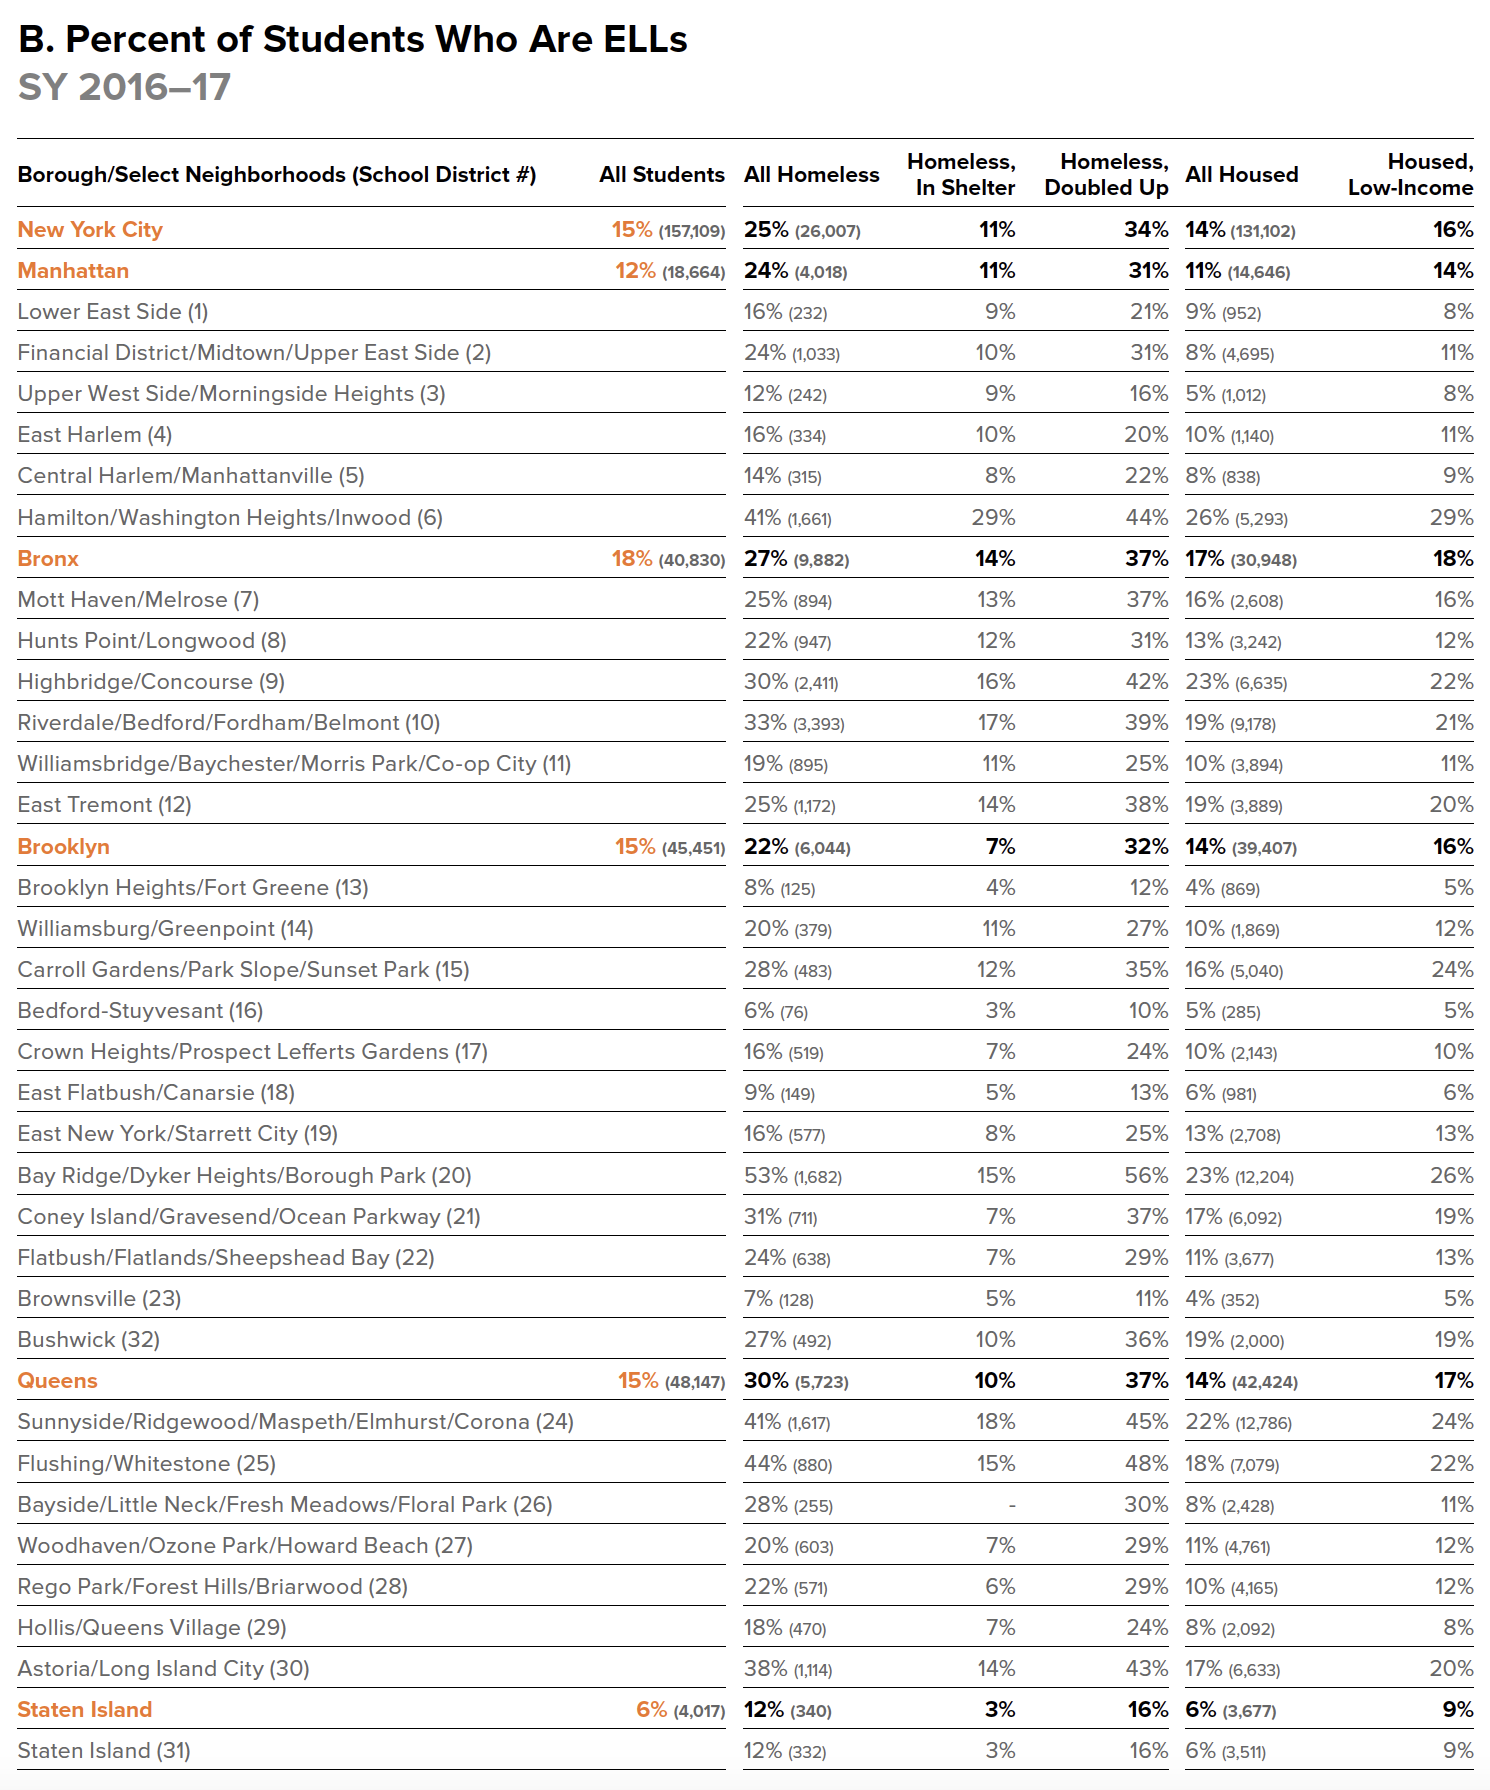
- Homeless ELLs attended school in every district in the city. In five districts, more than one in three homeless students were ELLs. These were Bay Ridge (53%), Flushing (44%), Hamilton (41%), Sunnyside (41%), and Astoria (38%) (Districts 20, 25, 6, 24, and 30, respectively).
- In six districts, fewer than one in eight homeless students were ELLs. These were Bedford-Stuyvesant (6%), Brownsville (7%), Brooklyn Heights (8%), East Flatbush (9%), Staten Island (12%), and the Upper West Side (12%) (Districts 16, 23, 13, 18, 31, and 3, respectively).
- Every district enrolled more homeless ELLs in SY 2016–17 compared to SY 2010–11. Over this period, the number of homeless ELLs quadrupled in Flushing, from 215 to 880 (District 25) and more than tripled in Bayside, from 77 to 255 (District 26).
- Riverdale and Highbridge in the Bronx both enrolled at least 1,000 more homeless ELLs in SY 2016–17 than in SY 2010–11 (Districts 10 and 9). Rates of homeless students who were ELLs nearly doubled in these districts over the same period (96% and 79% increases, respectively).
Click here for a complete table of ELL rates for each
mapped school district.
2.6 What Languages Do Homeless ELLs Speak?
ELLs experiencing homelessness attend school in all parts of the city. However, an examination of homeless ELLs by language reveals a picture that could help in the targeting of services to homeless students.
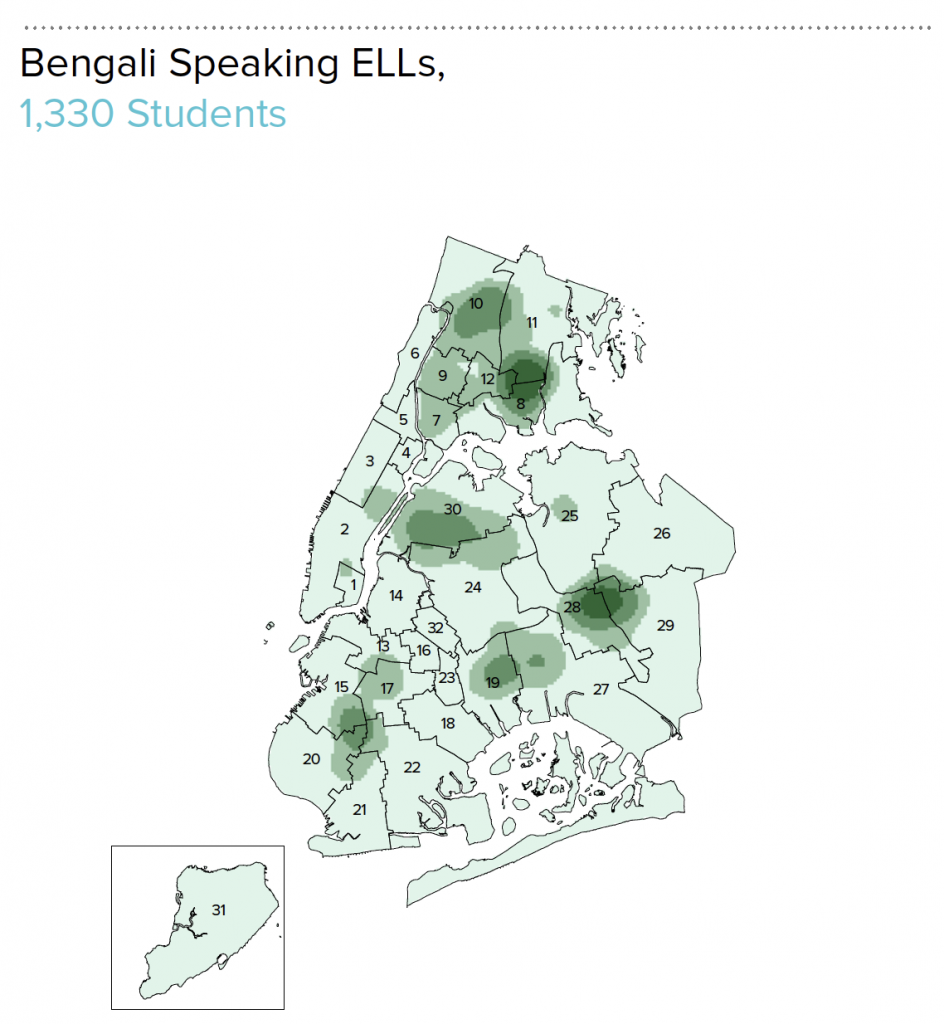
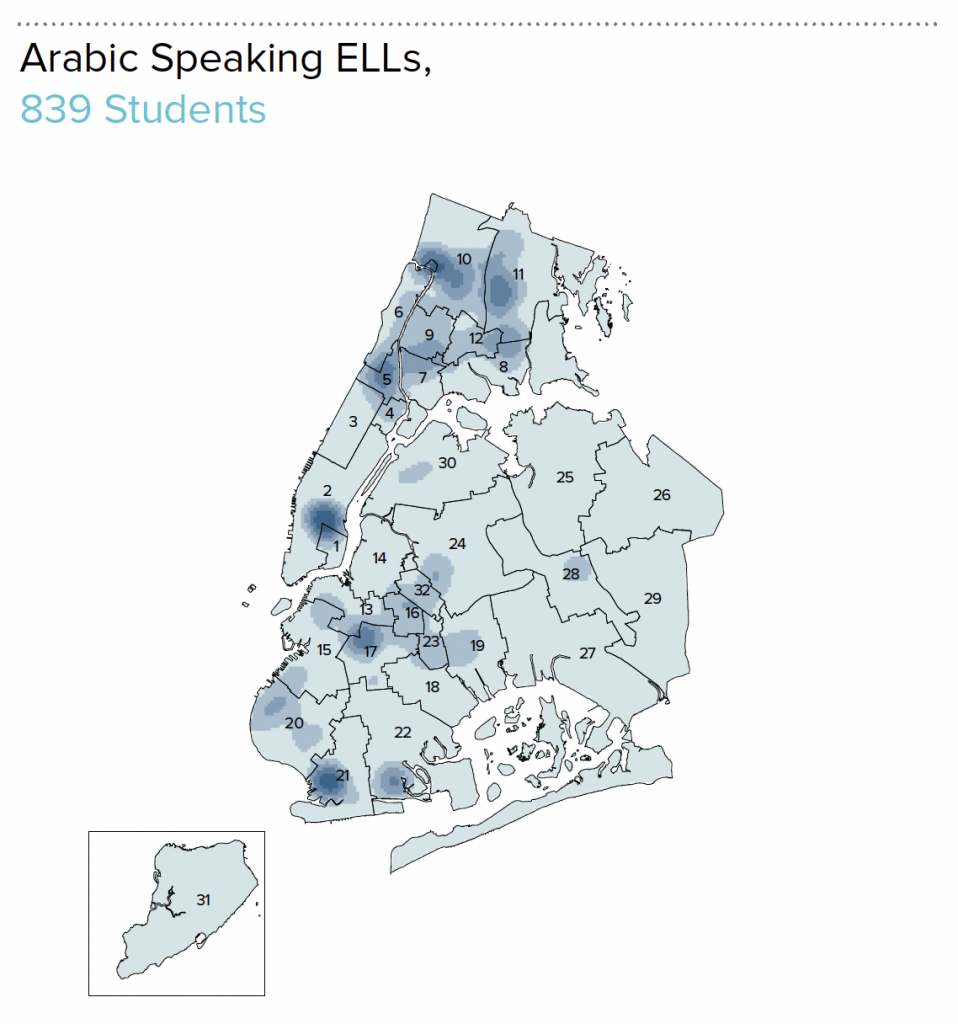
Note: Data are by school district for SY 2016–17 and do not include schools in districts 75 and 79, the Special Education District and Alternative Schools District, respectively.

3.0 | Addressing Barriers To Learning: Early Identification of Special Education Needs
Individualized Education Plan (IEP)
An Individualized Education Plan (IEP) is a written statement from the New York City Department of Education to provide a Free and Appropriate Public Education for students in any of 13 disability categories in the least restrictive environment possible. The IEP outlines the specific individual supports and services that the student will receive, and is created through a collaborative process involving parents, teachers, and administrators, at a minimum.
Late Individualized Education Plan
For the purpose of our analysis, a “late” IEP refers to IEPs that a student receives after Kindergarten. The majority of students with IEPs receive them that year, but identification rates for homeless students are significantly lower. “Late” IEP rates will include some students in both housing groups who were either not identified or who developed or exhibited a disability for the first time after Kindergarten.
All students with disabilities, regardless of their housing status, have the right to an Individualized Education Plan (IEP) and access to necessary special education services. Unfortunately, homeless students are not as likely to have their special needs identified and supported as quickly as their housed classmates. Between SY 2013–14 and SY 2016–17, only about half of all homeless students in need of an IEP received it in Kindergarten, compared to roughly two-thirds of housed students. A previous report on the timing of IEP identification for homeless students found that this IEP identification after Kindergarten was associated with worse academic outcomes in later years, even for students who did not experience instability factors such as absenteeism and school transfers. The challenge confronting educators and policymakers is how homeless students can receive timely access to special education screening and evaluation.
Many students with IEPs attend schools in District
75, New York City’s district for special education
schools. Because these schools are physically
located in other districts but are categorized
separately, these students are included in all citywide
analyses but are excluded from data maps
and district-level data in appendices. Appendices
for both District 75 and 79 (Alternative Schools)
are forthcoming.
3.1 How Many Homeless Students Have Been Identified for IEPs?
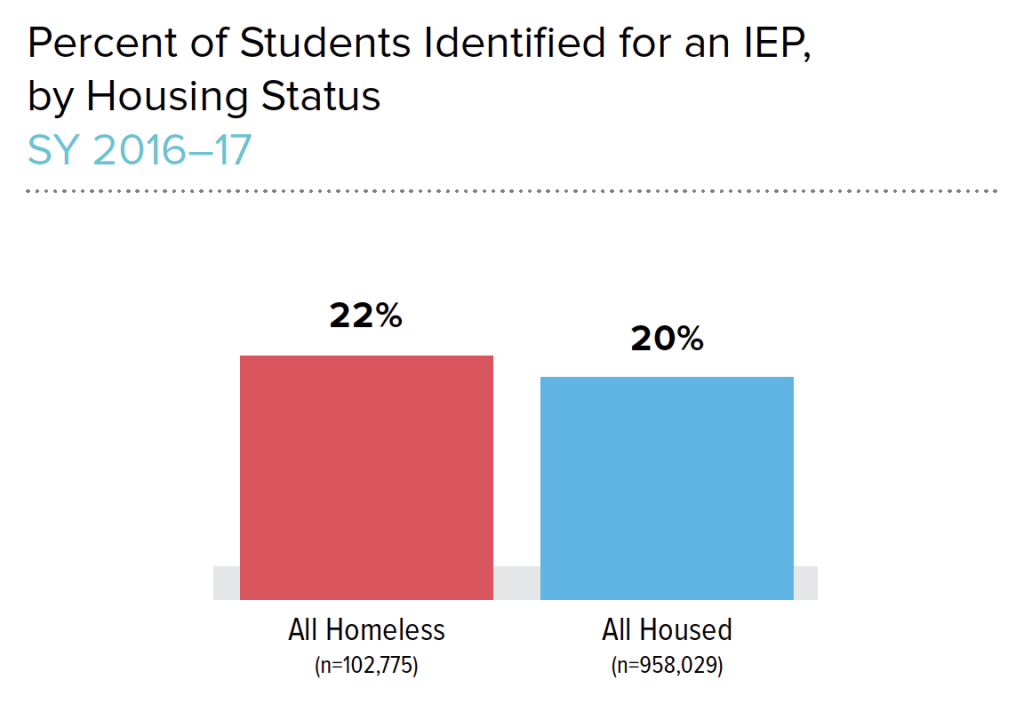
- Approximately one in five students, housed or homeless, had an IEP in SY 2016–17 (20% and 22%, respectively). This rate rose from SY 2010–11, with the percent of students with an IEP increasing from 15% for both homeless and housed students.
- The number of homeless students with IEPs more than doubled in the Bronx (from 3,600 to 8,200), Manhattan (from 1,800 to 3,800), and Brooklyn (from 3,000 to 6,200).
- Staten Island consistently identified the highest percentage of homeless students with IEPs—31% in SY 2016–17.
- Queens identified the lowest percentage of homeless students with IEPs (19%). However, because of the growing number of homeless students, the number of these students with IEPs more than doubled, increasing from approximately 1,500 to 3,600 since SY 2010–11.
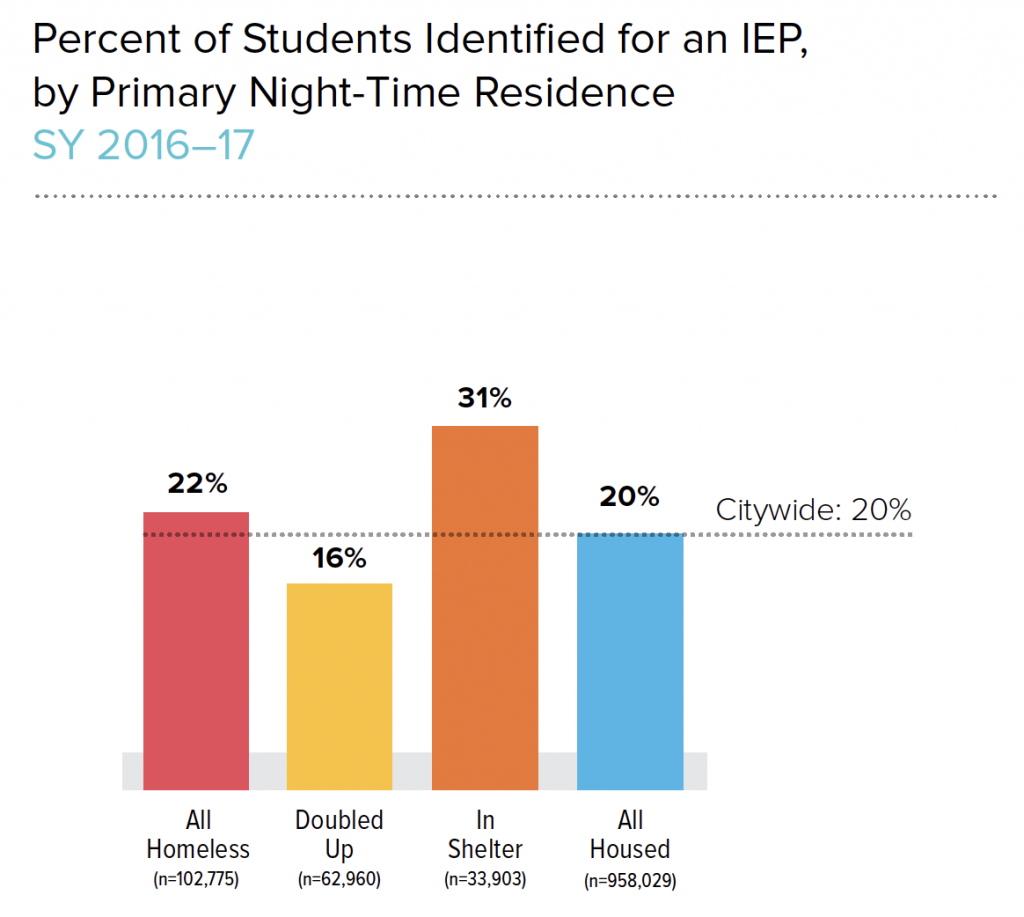
- Among homeless students, approximately one-third of students in shelter had an IEP (31%). This is about twice the rate of students living in doubled-up temporary arrangements (16%).
KEY TERMS
Homeless, Doubled Up
Students who have found temporary accommodations with another family or other person due to loss of housing or economic hardship.
Homeless, In Shelter
Students who lived in emergency or transitional shelter.
Students with an IEP who received the proper
supports in school can perform just as well as
students without an IEP if their needs were met on
time. Shelter staff can help to identify students who
do not have an IEP, but doubled-up students who
do not have access to programs often available in
shelters are more likely to be under-identified for
IEP services.
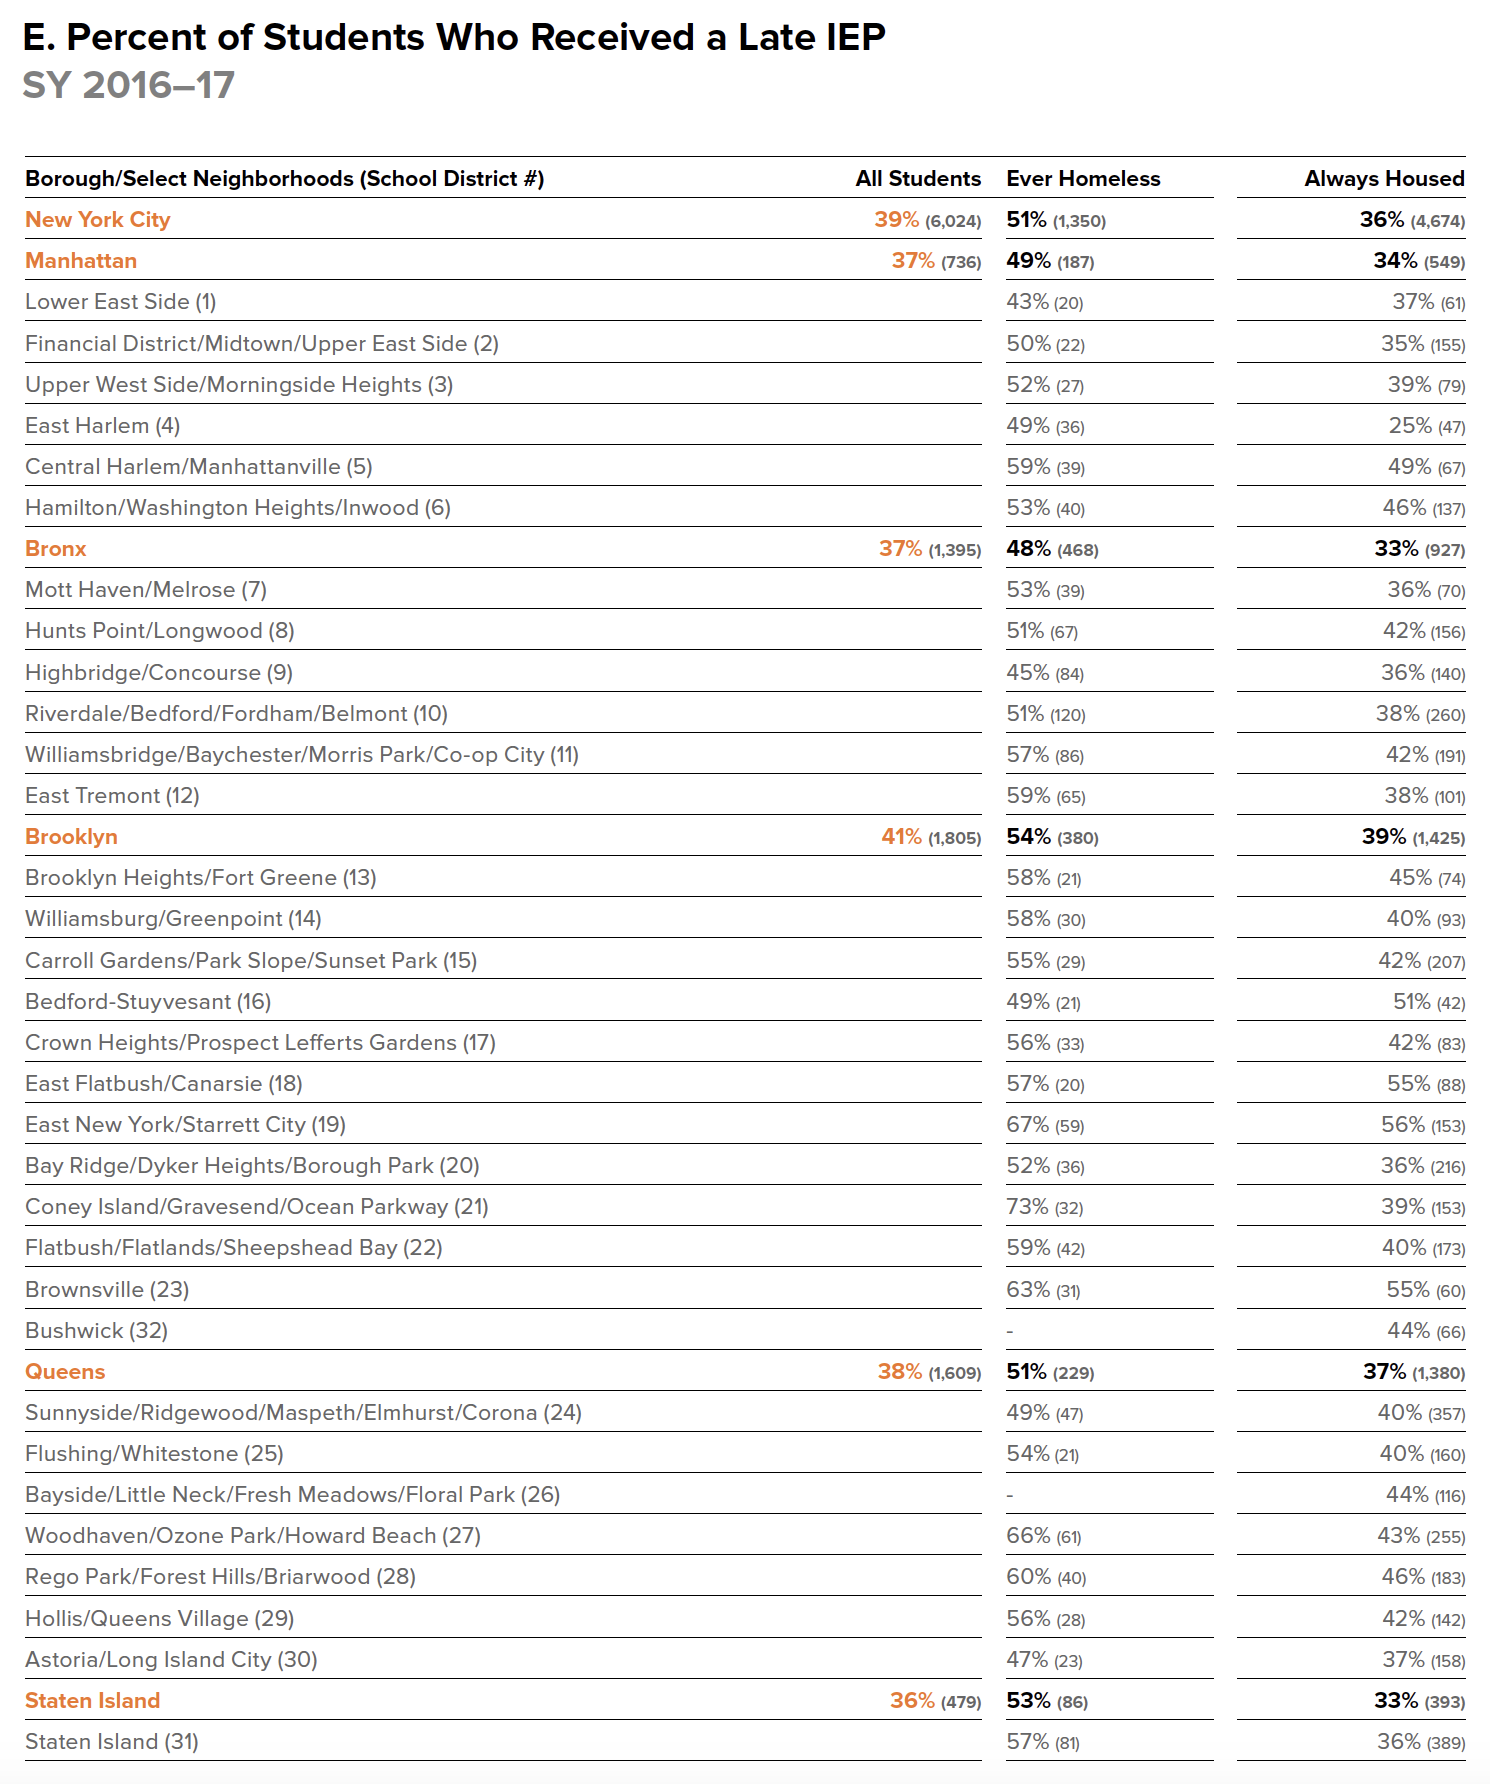
3.2 Who Receives Late IEPs?
- Homeless students were less likely to be identified for an IEP by Kindergarten. Only half of homeless students (49%) with special education needs received their IEP in Kindergarten, compared to nearly two-thirds (64%) of housed students.
- Brooklyn had the highest rate of homeless students who had a late IEP (54%). This is down from 61% in SY 2013–14.
- The Bronx saw the largest decrease in late IEP rates among homeless students, from 62% in SY 2013–14 to 48% in SY 2016–17.
- Nearly one in three homeless students (30%) with IEPs received it at least two years after Kindergarten. In comparison, less than one in four housed students (23%) received their IEP at least two years after Kindergarten.
- Approximately 12% of homeless students received their IEP three years after starting Kindergarten compared to 10% of housed students.
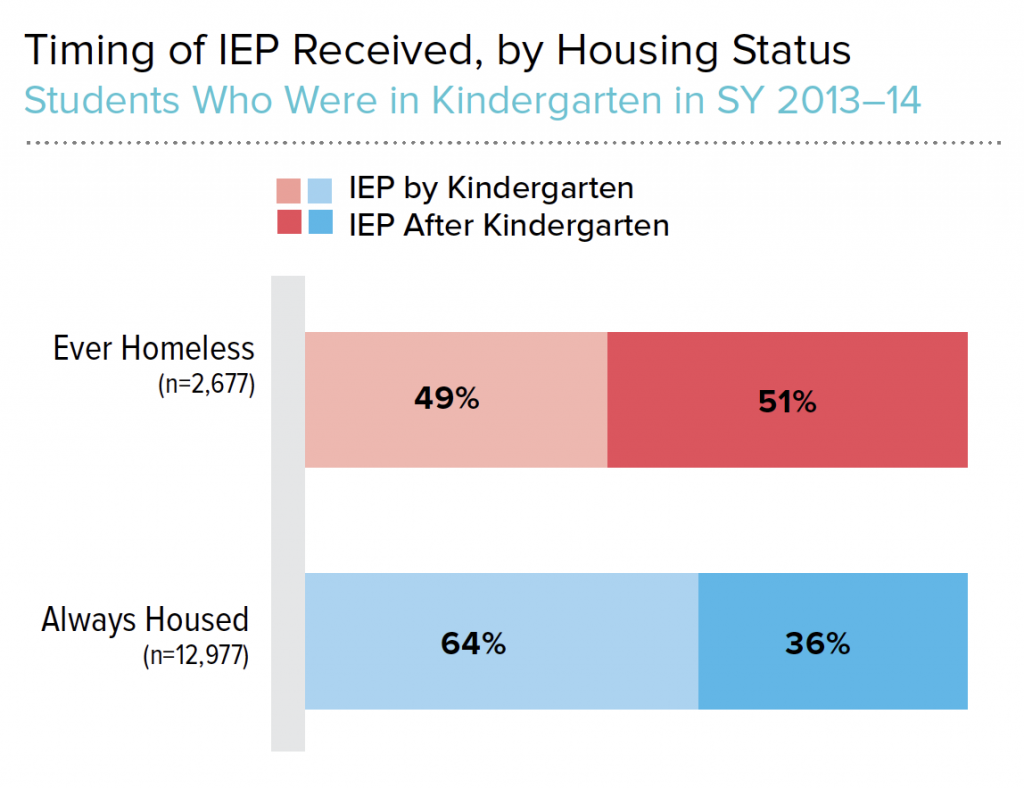
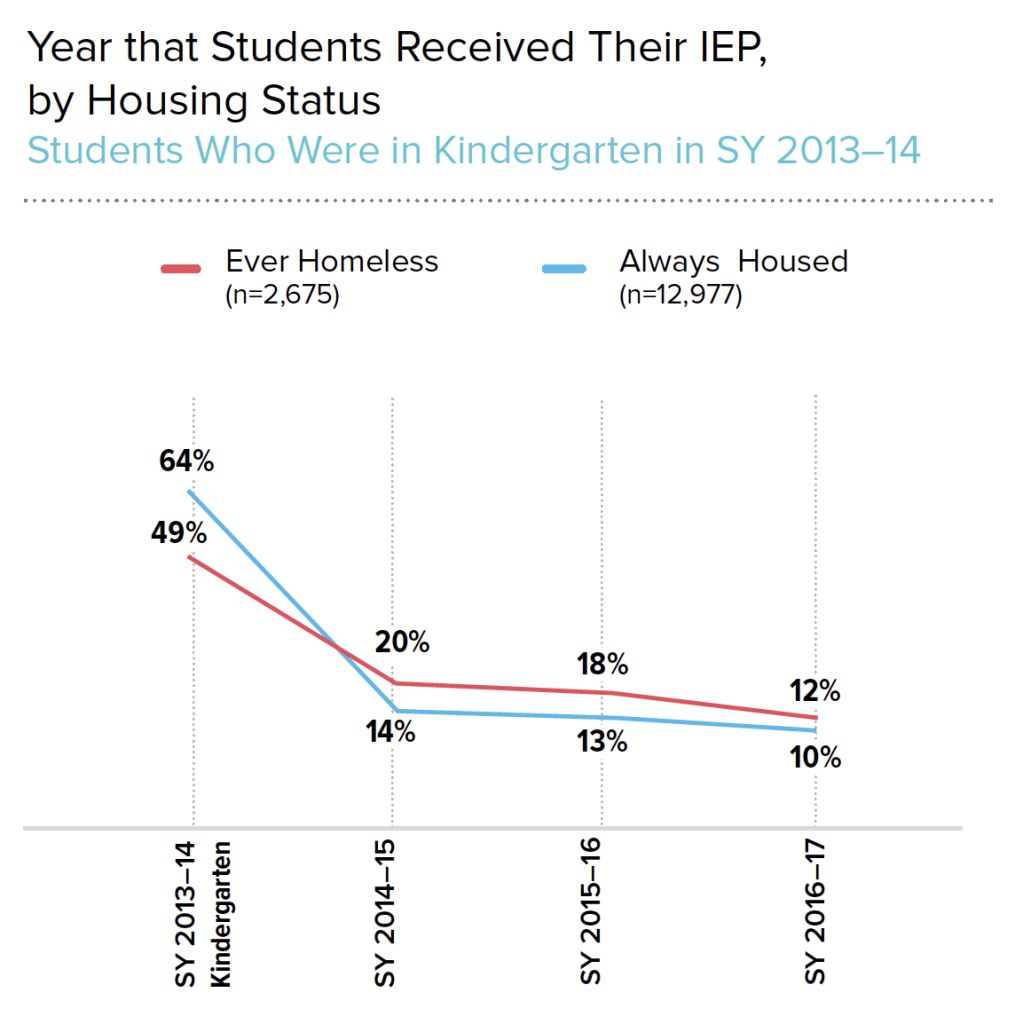
For both charts, data represent a four-year cohort of New York City public school students who started Kindergarten in SY 2013–14 and received an IEP at some point between SY 2013–14 and SY 2016–17.
KEY TERMS
Late IEP
An Individualized Education Plan that is received after Kindergarten. This includes students who developed or exhibited a disability for the first time after Kindergarten.
Ever Homeless
Students who were in temporary housing during any of the school years shown.
Always Housed
Students who were never in temporary housing for all of the school years shown.
Students who received their IEP in Kindergarten were
better prepared to learn than their peers who went
one year or more without an IEP.
The prevalence of school instability factors—chronic
absenteeism and mid-year transfers—among
homeless students can make it difficult for school
staff to identify their special education needs.
3.3 How Do IEP Timing and School Stability Correlate With Academic Performance?
- Citywide, 20% of third graders with an IEP scored proficient on the math assessment, regardless of when they received the IEP.
- Among third graders who received their IEP on time, students who were ever homeless scored proficient on their state math assessment at slightly over half the rate for housed students who received their IEP on time (19% vs. 34%).
- Among third graders who were ever homeless and received their IEP on time, 19% scored proficient on their state math assessment. This was nearly the same rate as the citywide average and over twice the rate of homeless students who received an IEP after Kindergarten (8%).
- One-third of homeless students (34%) who received their IEP on time scored proficient on their state math assessment when they experienced no school instability factors (chronic absenteeism and mid-year transfers). This was more than twice the rate of homeless students who received their IEP late and experienced no school instability factors (13%).
- Though not shown here, proficiency rates for the ELA assessment were similar to trends seen on the math exam.
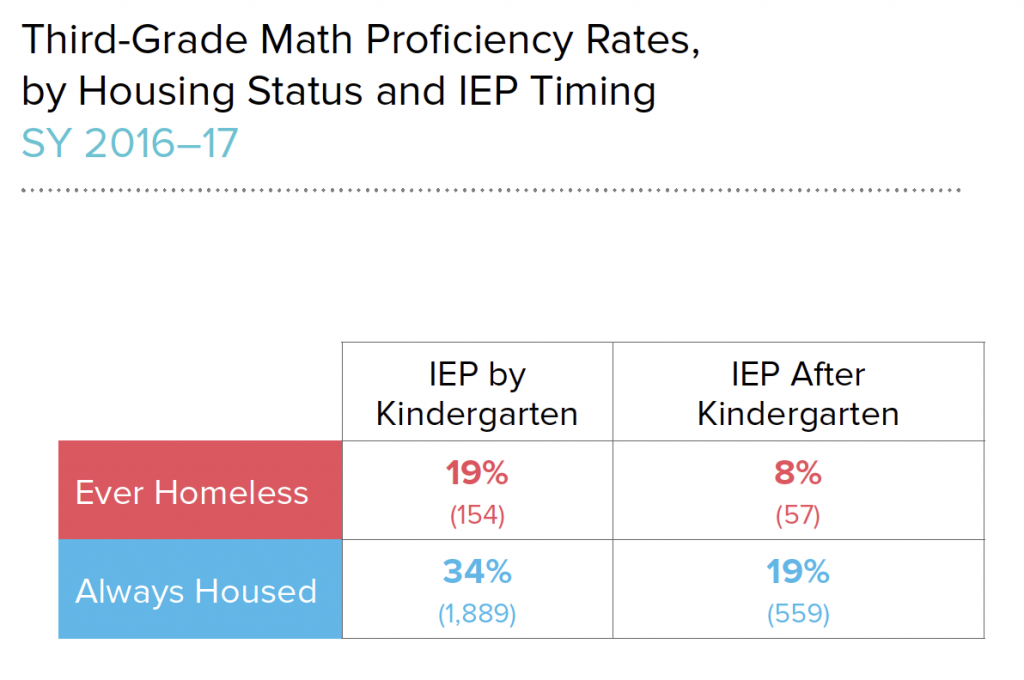
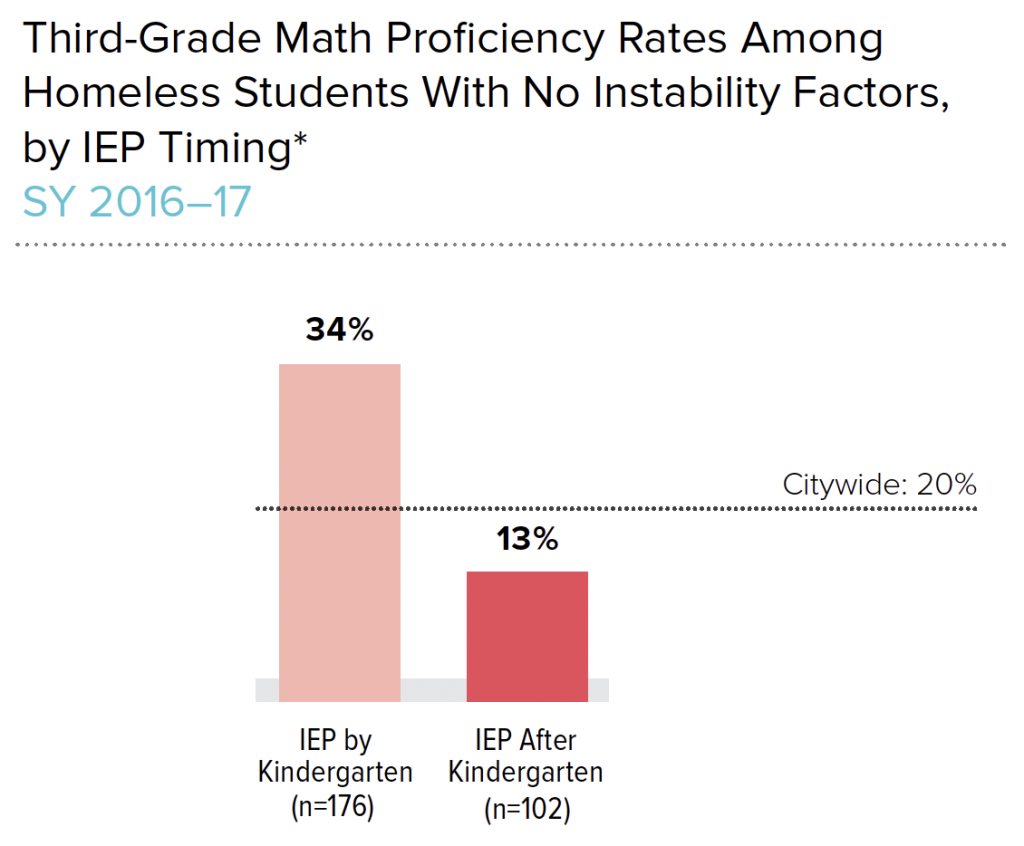
*Students shown here were never chronically absent and never transferred schools mid-year.
KEY TERMS
State Assessments
Assessments are administered every year for students in grades 3–8 in English Language Arts (ELA) and math. Students who score at levels 3 or 4 on a 4-point scale are considered proficient. Students who have resided in the United States for less than one year are not required to take the ELA exam until the following year. Some students with an IEP may take the New York State Alternate Assessments in place of the statewide assessments.
When homeless students have stability in school
by attending class regularly and remaining in the
same school the whole year, they perform better
academically. The lack of IEP supports can make it
difficult for a student to keep pace with classmates.
However, if homeless students are identified for
IEPs in Kindergarten and do not experience school
instability, they can perform at levels above the
citywide average.
3.4 What Percent of Homeless Students with IEPs Attend School in Each District?
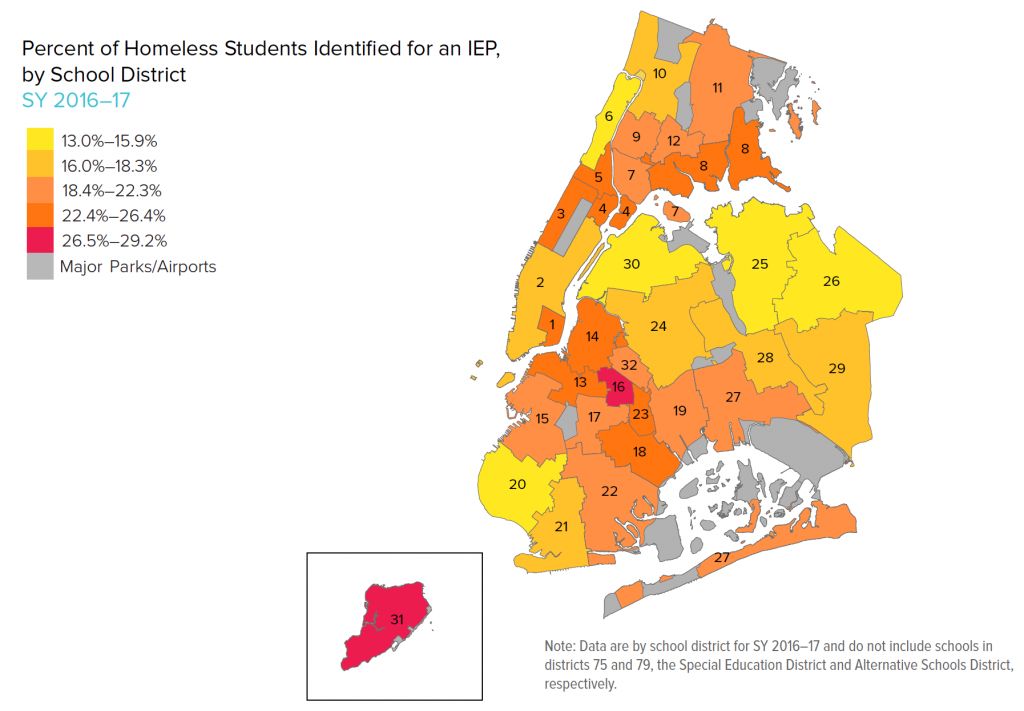
- Homeless students with IEPs attended schools in every district across the city. Overall, there was an 8% increase in the number of homeless students with IEPs from SY 2015–16 to SY 2016–17.
- Every district except East Harlem (District 4) saw an increase in the number of homeless students with IEPs over the previous year. Coney Island (District 21) had a 24% increase from approximately 320 to 400, between SY 2015–16 and SY 2016–17, followed by Flushing, which had a 20% increase, from 240 to 290 (District 25).
- Though 18% of homeless students had IEPs in Riverdale, the district served the largest number of homeless students with IEPs at nearly 1,900 (District 10). Three other districts in the Bronx (Highbridge, Huntspoint, and Williamsbridge) each served more than 1,000 homeless students with IEPs (Districts 9, 8, and 11, respectively).
- More than one in four (29%) homeless students had an IEP in Bedford-Stuyvesant (District 16) and Staten Island (District 31), the districts with the highest percentage of homeless students with an IEP.
- Less than one in seven homeless students had an IEP in Bay Ridge (13%), Flushing (14%), and Bayside (14%), the districts with the lowest IEP rates among homeless students (Districts 20, 25, and 26, respectively).

3.5 What Percent of Homeless Students Receive a Late IEP in Each District?
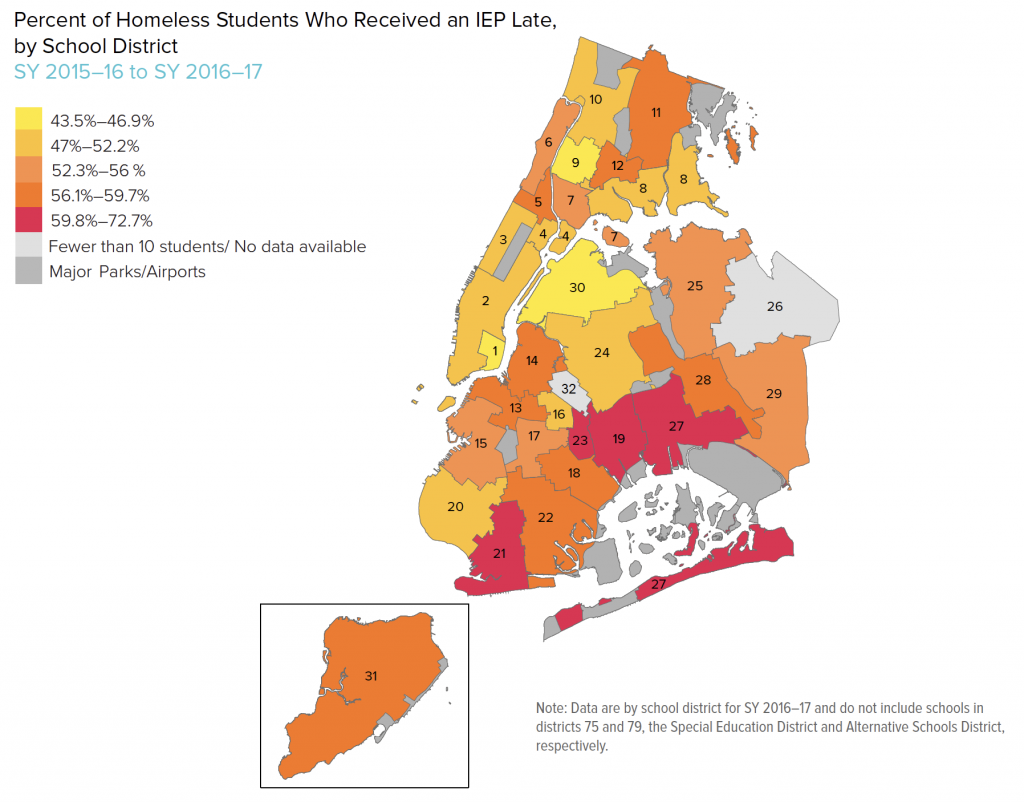
- A significant proportion of homeless students with IEPs received it late, ranging from 43% on the Lower East Side to 73% in Coney Island (Districts 1 and 21, respectively).
- Among geographic districts, East Harlem saw the greatest disparity in late IEP rates between homeless and housed students (District 4). In this district, homeless students were nearly twice as likely as their housed classmates to be identified for an IEP late (49% vs. 25%).
- Some students with disabilities attend schools located throughout the city that are part of the Special Education District (District 75, not mapped). This district saw the greatest disparity in IEP timing, with homeless students being almost four times as likely as housed students to have a late IEP (11% vs. 3%).
Appendix
The data for the Student Homelessness in New York City series were provided by the New York City Department of Education. Unless otherwise noted, the source is the New York City Department of Education, unpublished data tabulated by the Institute for Children, Poverty, and Homelessness, SY 2010–11 to SY 2016–17. At the time of publication, SY 2016–17 is the most recent year of data available for which analysis of homeless students is complete. Data will be updated for SY 2017–18 as it becomes available.
The numerators and rates are provided in the Appendix for several categories, including all students, all homeless students, and all housed students at each geographic level. Additionally, the rates of these instability factors for subpopulations of homeless students—those living in shelter and those living doubled up—are shown, along with housed students who are low-income.
In addition to this resource, the New York City Interactive Map of Student Homelessness allows users to view data specific to their district. ICPH’s report, School Instability Factors, explores mid-year school transfers and chronic absenteeism in greater depth. The recently released three-part series, What You Need to Know About NYC’s Homeless Students, explores student homelessness in New York City in elementary, middle, and high school.
Note: Data by school district do not include schools in districts 75 (Special Education) or 79 (Alternative Schools). Data by borough include these schools, resulting in small discrepancies. Separate appendices for these districts are forthcoming. Categories where the number of students is 30 or fewer have been redacted for the purpose of data reliability.
Note: Data by school district do not include schools in districts 75 (Special Education) or 79 (Alternative Schools). Data by borough include these schools, resulting in small discrepancies. Separate appendices for these districts are forthcoming. Categories where the number of students is 30 or fewer have been redacted for the purpose of data reliability.
Note: Data by school district do not include schools in districts 75 (Special Education) or 79 (Alternative Schools). Data by borough include these schools, resulting in small discrepancies. Separate appendices for these districts are forthcoming. Categories where the number of students is 30 or fewer have been redacted for the purpose of data reliability.
Note: Data by school district do not include schools in districts 75 (Special Education) or 79 (Alternative Schools). Data by borough include these schools, resulting in small discrepancies. Separate appendices for these districts are forthcoming. Categories where the number of students is 30 or fewer have been redacted for the purpose of data reliability.
Note: Data by school district do not include schools in districts 75 (Special Education) or 79 (Alternative Schools). Data by borough include these schools, resulting in small discrepancies. Separate appendices for these districts are forthcoming. Categories where the number of students is 30 or fewer have been redacted for the purpose of data reliability.
Ralph da Costa Nunez, PhD, President and CEO
Aurora Zepeda, Chief Operating Officer
Project Team:
Andrea Pizano, Chief of Staff
Josef Kannegaard, Principal Policy Analyst
Amanda Ragnauth, Senior Policy Analyst
Rachel Barth, Senior Policy Analyst
Kaitlin Greer, Policy Analyst
Mukta Ramola, GIS Analyst
Katie Linek Puello, Content Manager
Hellen Gaudence, Senior Graphic Designer