Overview
For the 105,000 students who experience homelessness every year in New York City, the ability to graduate high school is one of the most powerful tools they have for breaking the intergenerational cycle of poverty and instability. Unfortunately, housing instability brings with it challenges for students, such as school transfers, higher absenteeism, and a lack of timely access to educational supports. The increased school instability and frequent barriers to learning can cause these students to fall behind and ultimately hamper their academic achievement.
The full extent to which a student has fallen behind is often not measured until the start of standardized testing in the third grade. These exams, administered annually until eighth grade, assess a student’s ability to perform at grade level in mathematics and English Language Arts. Of the 40,000 homeless students who were of testing age, less than 25% scored high enough to be considered at grade level on either exam, compared to approximately 40% of housed students. Even when homeless students perform at grade level early in their education, they tend to see their academic performance decline faster than that of their housed classmates in later years.
When students fall behind academically and are unable to keep up with the rest of their peers, their ability to graduate high school on time is threatened. The risk of not graduating high school is even higher for students who experience school instability and are unable to attend class regularly or have to change schools mid-year. By understanding how homelessness can affect a student’s academic achievement, educators and policy makers can better target interventions to ensure that all students graduate high school on time and are able to access the same opportunities as housed students.
About Student Homelessness in New York City
One in 10 New York City public school students were identified as homeless during the 2016–17 school year, the most recent year of data available at the time of publication. Given the prevalence of homelessness among school-aged students, the specific educational challenges that students experiencing homelessness face need to be identified so that educators and policymakers can advocate for the resources to help these students reach their potential.
Student Homelessness in New York City sheds light on the more than 140,000 New York City public school students who have experienced homelessness over the past seven years. This series, which does not include data from charter schools, explores the geography of student homelessness; the prevalence of school instability factors like chronic absenteeism and mid-year school transfers; whether homeless children are participating in the city’s Pre-K for All program, and if the additional educational needs of language learners and students with disabilities are being met on time; the disproportionate rate of suspensions among students experiencing homelessness; and academic outcomes like graduation rates and test scores.
1.0 | Disparities in Academic Achievement: Meeting Grade-Level Standards on State Assessments
State Assessments
Assessments are administered every year for students in grades 3–8 in English Language Arts (ELA) and math. Students who score a 3 or above on a 4-point scale are considered proficient.
The disparity between students who have experienced homelessness and those who have not is evident by the third grade, when students begin taking state-mandated English Language Arts (ELA) and math exams. Overall, homeless students were about half as likely as their housed peers to receive a proficient score—which indicates they are performing at the appropriate level for their grade—and were more than one and a half times as likely to receive the lowest score on the exams’ 4-point scale. This disparity in academic performance leaves homeless students at a disadvantage and threatens their ability to be prepared for future coursework or even graduate from high school.
The presence of school instability factors—chronic absenteeism and mid-year transfers—further decreases the likelihood of a student receiving a proficient score. The importance of maintaining continuity through regular school attendance cannot be overstated, particularly for homeless students who already face many obstacles that affect their education. Exploring the ways housing instability can threaten a student’s academic performance can inform educators and policymakers as to what interventions can effectively counter the negative effects of homelessness for students.
1.1 Are Homeless Students Performing at Grade Level?
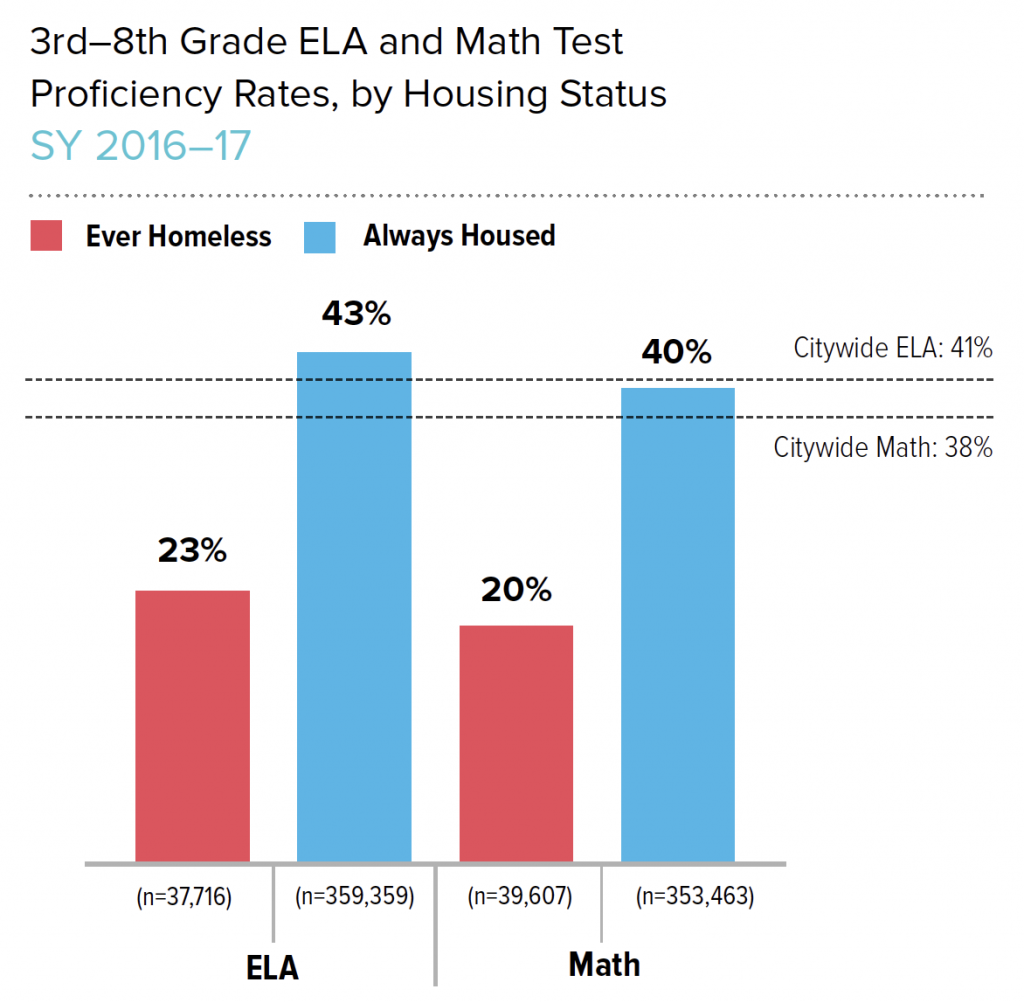
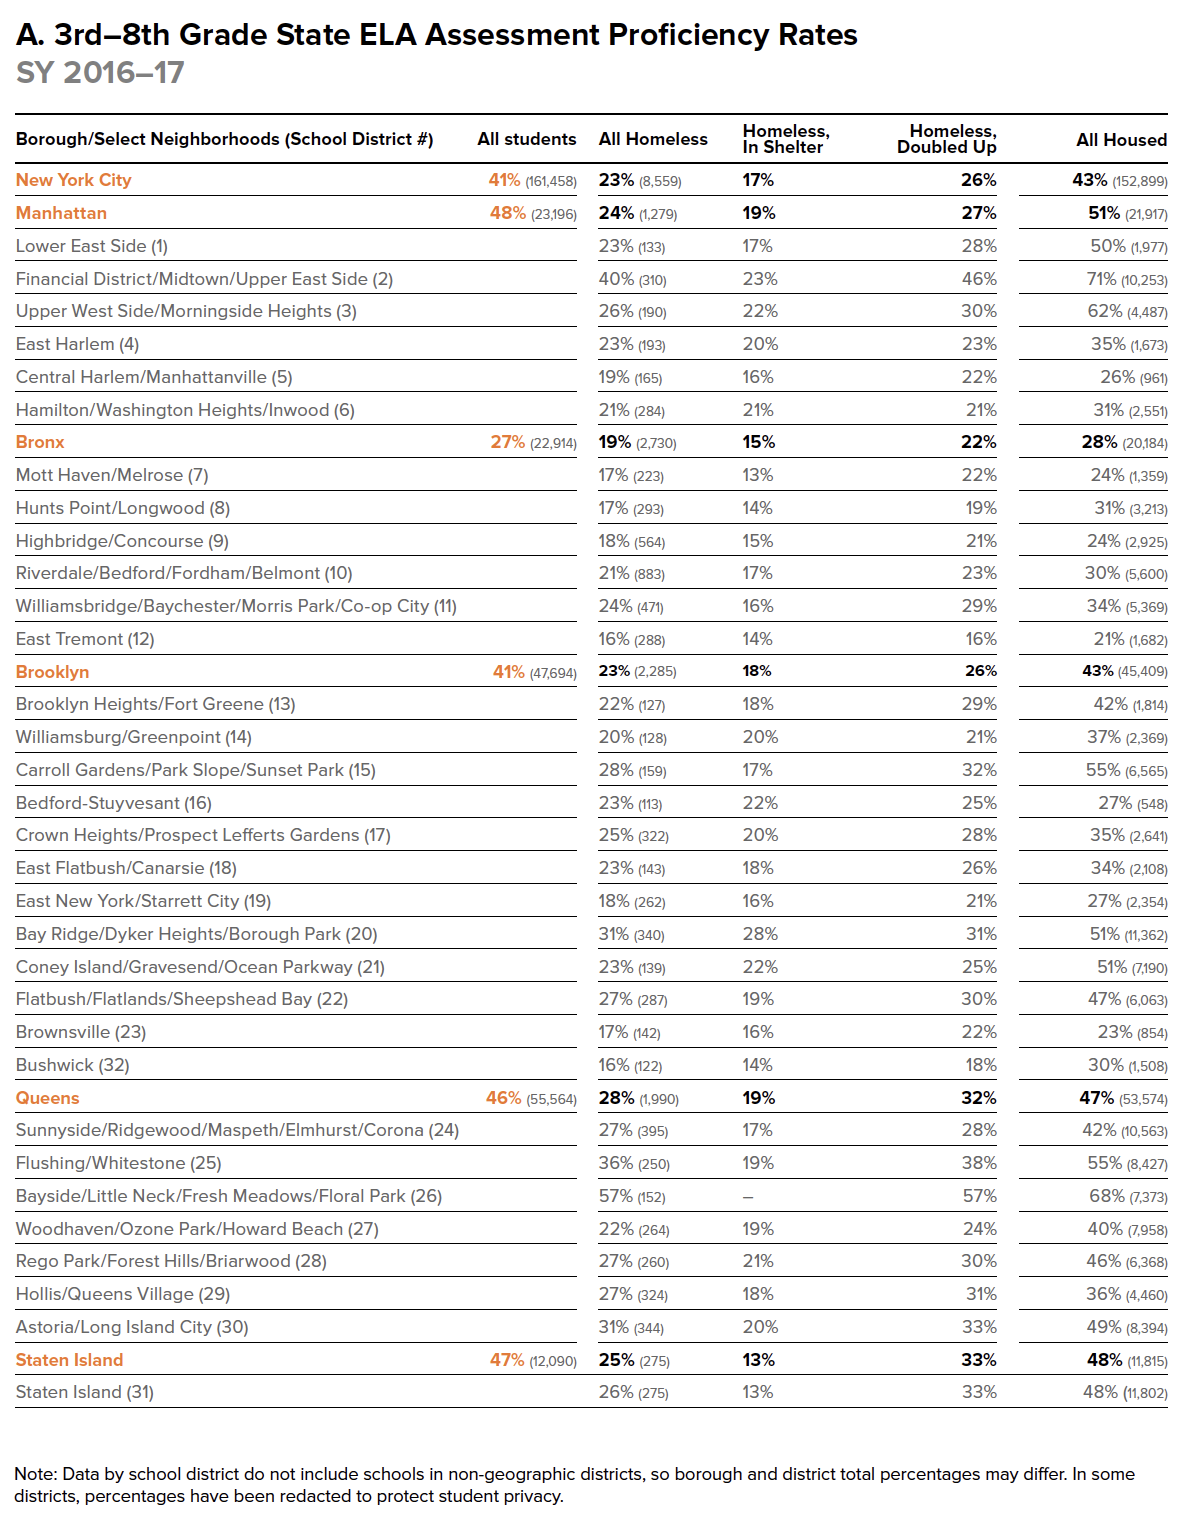
- In SY 2016–17, fewer than one in four homeless students (23%) met grade-level standards in ELA, meaning they scored proficient by earning a score of 3 or 4 on a 4-point scale. This is almost half the rate of housed students who scored proficient on the ELA assessment (43%).
- On the statewide math assessment, homeless students scored proficient at half the rate of their housed classmates (20% vs. 40%).
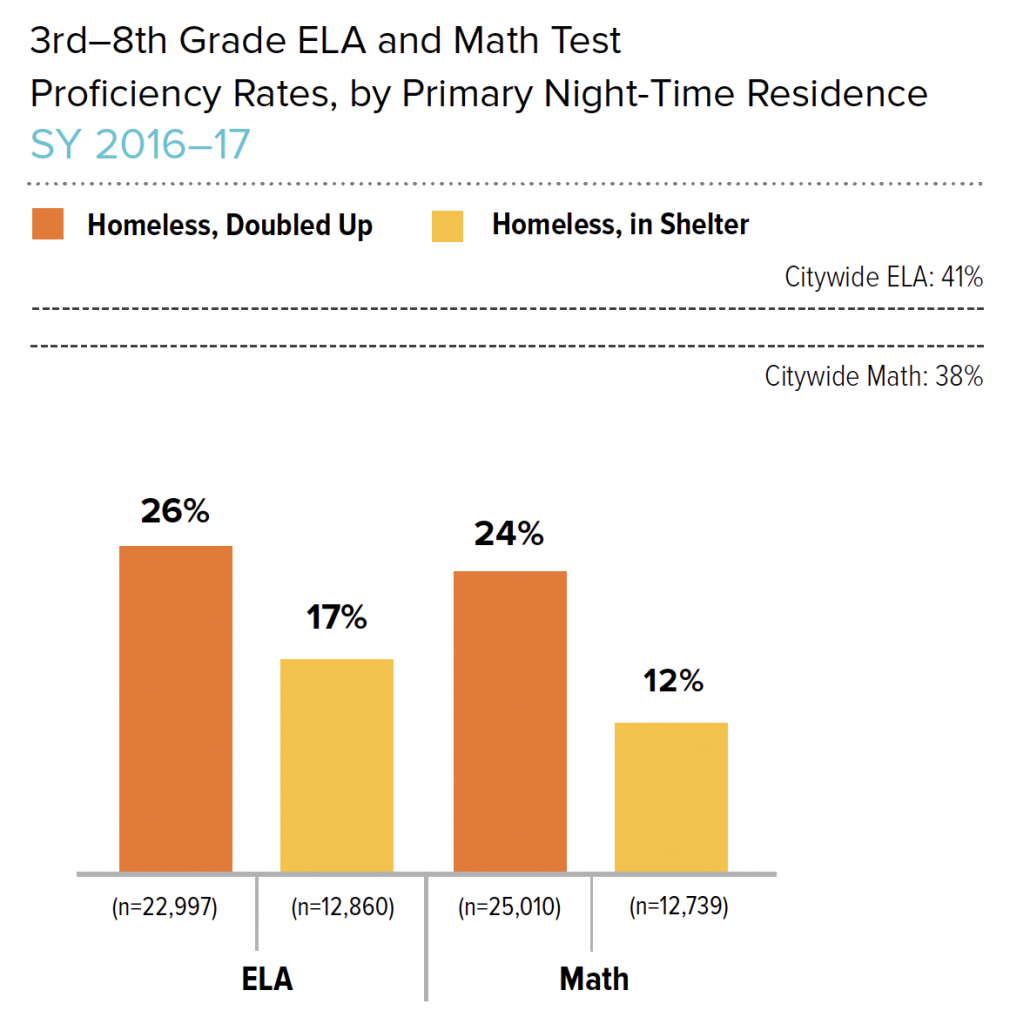
- Among homeless students, those living doubled up were more likely to meet grade-level proficiency standards on their ELA assessment (26%), while those living in shelter were less likely to score proficient (17%).
- This trend continued on the math assessment, in which 24% of homeless doubled-up students scored proficient compared to only 12% of students in shelter.
KEY TERMS
All Homeless
Students who were identified at any point during SY 2016–17 by the New York City Department of Education as meeting the McKinney-Vento definition of homelessness. This includes students in shelter, doubled up, in hotel/motels, or other temporary arrangements.
All Housed
Students who lived in a fixed, regular, and adequate housing situation throughout SY 2016–17.
Homeless, Doubled Up
Students who have found temporary accommodations with another family or other person due to loss of housing or economic hardship.
Homeless, In Shelter
Students who lived in emergency or transitional shelter.
Citywide English Language Arts (ELA) and math
state assessment proficiency rates improved
slightly from SY 2015–16 to SY 2016–17. The
citywide ELA proficiency rate increased from 38%
to 41%, and the math proficiency rate increased
from 36% to 38%.
During this period, proficiency rates for homeless
students also saw a slight improvement, rising from
21% to 23% in ELA and from 19% to 21% in math.
1.2 What Scores Are Homeless Students Receiving on Assessments?
- Homeless students were more likely than housed students to score at the lowest performance level on state assessments. On the ELA exam, more than two in five homeless students (42%) received the lowest score, level 1, compared to one in four housed students (24%).
- Only 5% of homeless students received the highest score of 4 on the ELA exam, less than one-third the rate at which housed students scored this high (16%).
- On the math assessment, homeless students were even more likely to score well below proficiency, with 51% scoring at performance level 1. Less than one-third of housed students, 31%, scored at level 1.
- Only 7% of homeless students scored at performance level 4 in math. This was almost one-third the rate for housed students (19%).
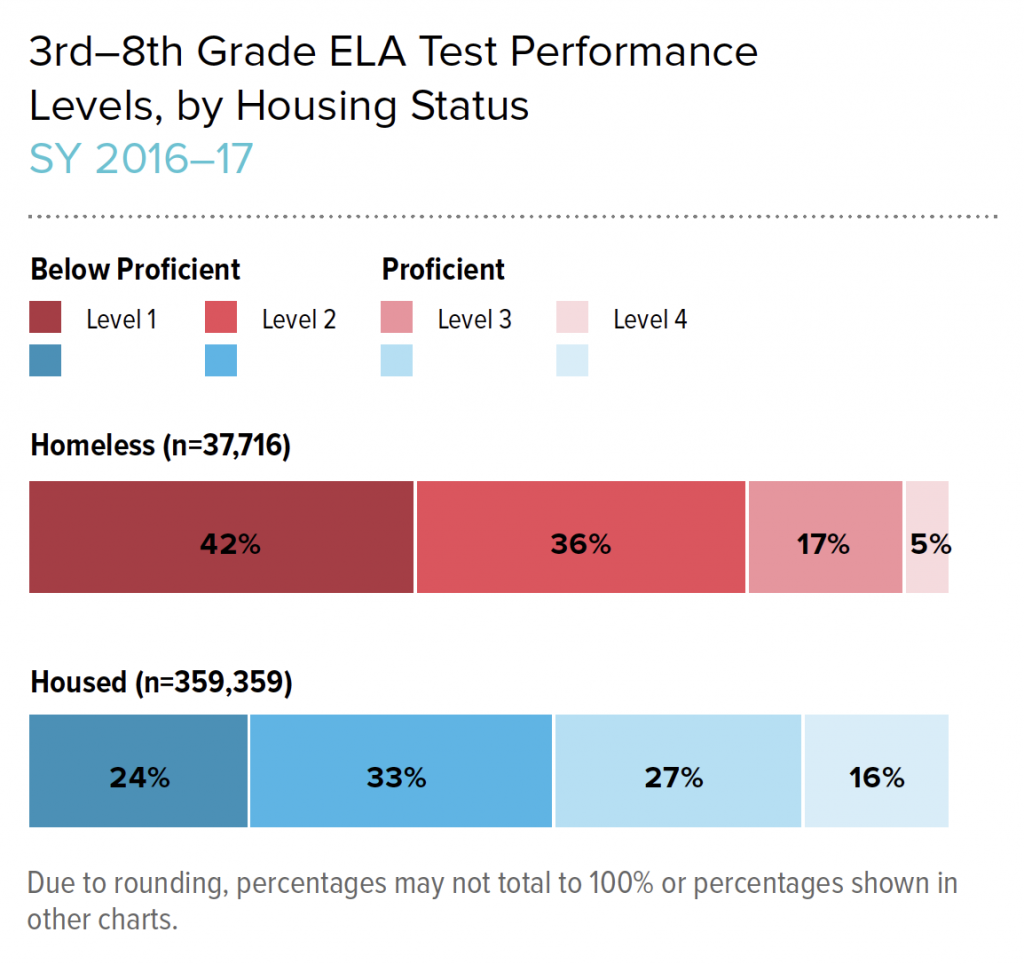

Performance levels 1 and 2 indicate a student
performed well below or below proficiency on the
New York State Department of Education math
or ELA assessment, and levels 3 and 4 indicate a
student performed at grade level or higher.
1.3 Do ELA and Math Proficiency Rates Change Over Time?
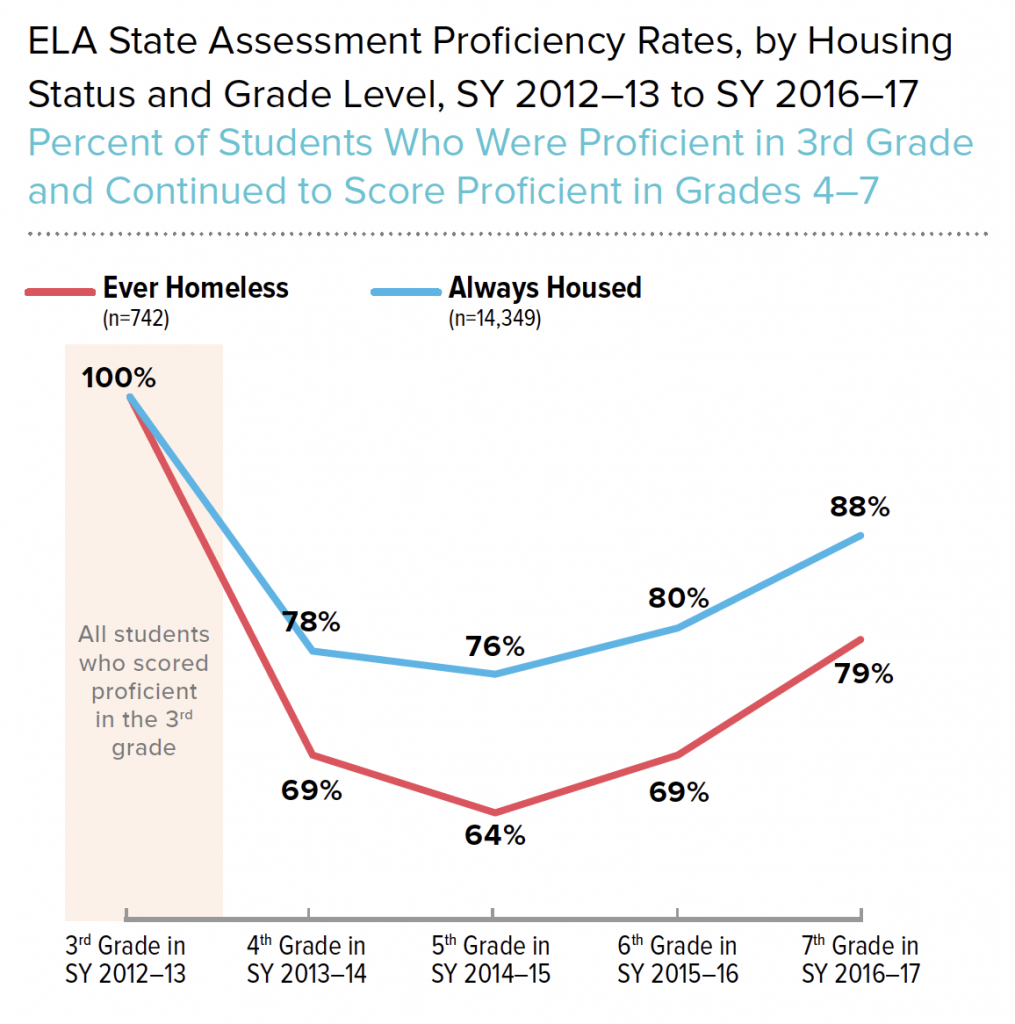
- Students who experienced homelessness at some point in their early education were more likely than their housed peers to see their academic performance suffer in later years. Less than two-thirds of homeless students (64%) who had been proficient in third grade ELA remained proficient in fifth grade, compared to 76% of students who were always housed.
- ELA proficiency rates followed a U-shaped pattern, increasing after fifth grade. Approximately four of five homeless students, 79%, who scored proficient in the third grade were still proficient in the seventh grade compared to 88% of housed students.
- In math, the decline in students’ performance was more linear. Of students who were ever homeless in grades 3–7 and scored proficient on their math exam in third grade, only 67% were still performing at grade-level standards in the seventh grade.
- Academic performance in math also declined among housed students, but to a lesser extent. Eighty-one percent of housed students who scored proficient in the third grade also scored proficient in the seventh grade.
KEY TERMS
Ever Homeless
Students who were in temporary housing during any of the school years shown.
Always Housed
Students who were never in temporary housing for all of the school years shown.
Over time, overall academic performance declined
for both homeless and housed students. However,
among students who scored proficient in the third
grade, those who experienced homelessness saw
their later academic performance decline more
sharply than their always-housed classmates.
1.4 How Do School Instability Factors Affect ELA and Math Proficiency?
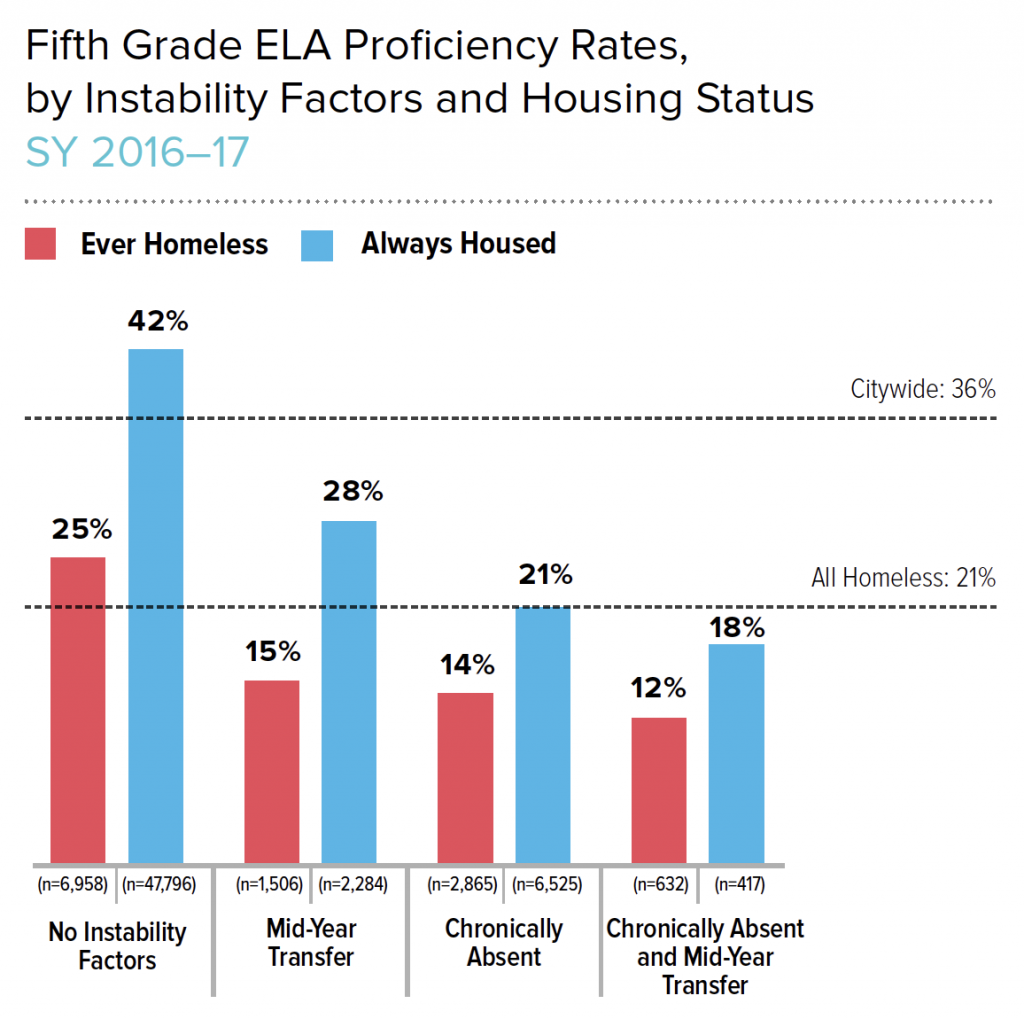
- Attendance and school instability are among the strongest factors correlated with student performance. By the time students reach fifth grade, there are significant academic disparities between those who experience school instability factors while homeless and those who do not.
- Even when students did not experience a mid-year transfer or chronic absenteeism, those who experienced homelessness scored proficient on the ELA exam at lower rates than housed students (25% vs. 42%).
- ELA proficiency rates dropped significantly for homeless students who experienced a mid-year transfer (15%) or chronic absenteeism (14%).
- Among homeless students, those who experienced no instability factors were twice as likely to score proficient as those who were both chronically absent and transferred mid-year (25% vs. 12%).
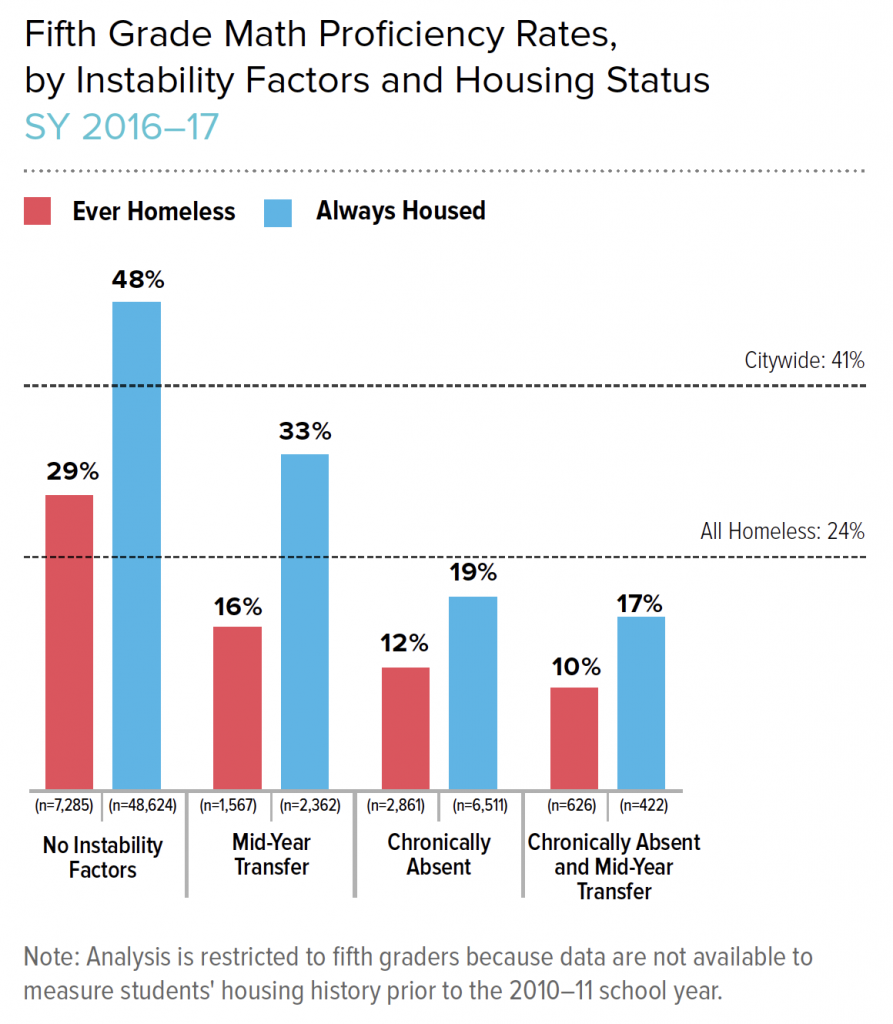
- Among students who experienced no school instability factors, homeless students were nearly one-third less likely to score proficient on the math exam (29% vs. 48%).
- Even among students who experienced chronic absenteeism and a mid-year transfer, homeless students were 40% less likely to score proficient in math compared to housed students (10% vs. 17%).
KEY TERMS
Mid-Year Transfer
Students who transfer from one school to another at any point during the school year.
Chronic Absenteeism
Missing more than 10%, or more than 18 days, of a 180-day school year.
When students can attend school regularly and
avoid mid-year school transfers, their likelihood of
performing at grade level increases.
By the end of elementary school, however, 91% of
homeless students have already experienced at
least one school instability factor.
1.5 What Are ELA Proficiency Rates in Each District?
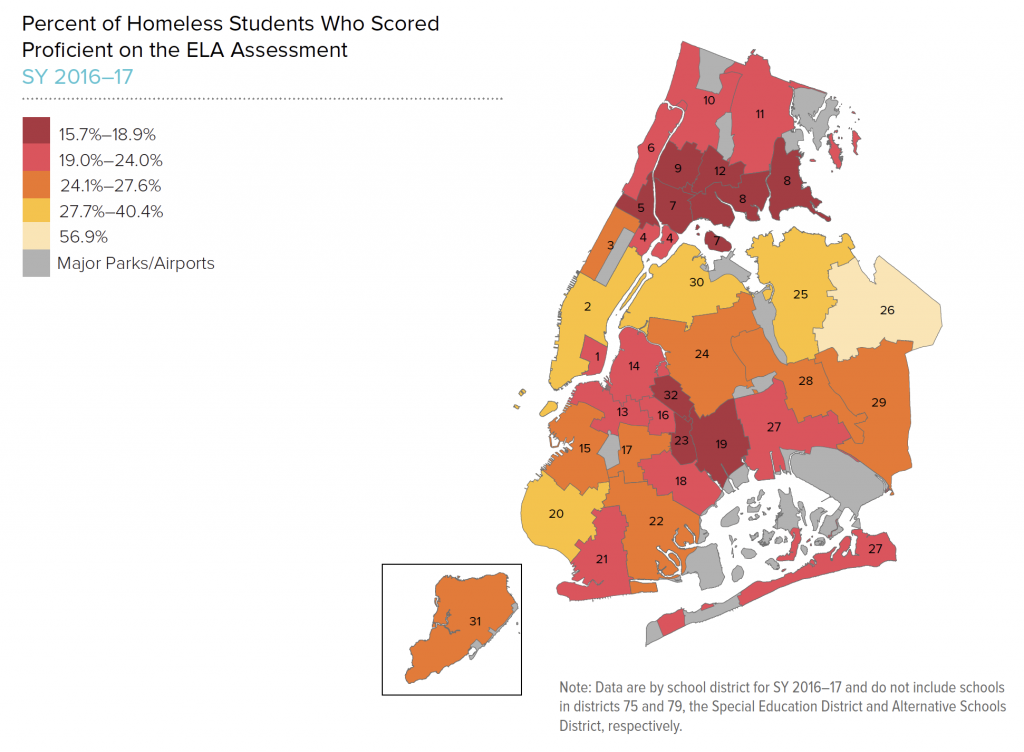
- ELA proficiency among homeless students varied widely among districts, ranging from a high of 57% in Bayside to a low of 16% in East Tremont (District 26 and District 12, respectively).
- After Bayside, there was a large drop in proficiency rates. The districts with the next-highest percentages of homeless students scoring proficient in ELA were Midtown (40%) and Flushing (36%) (Districts 2 and 25, respectively).
- At the borough level, fewer than one in five homeless students in the Bronx met grade-level standards (19%). Queens had the highest rate of ELA proficiency among homeless students, where more than a quarter of students scored proficient (28%).
- Four of the eight districts with the lowest percentages of homeless students performing at grade level were in the Bronx, (Districts 7, 8, 9, and 12) while three were in Brooklyn (Districts 19, 23, and 32).
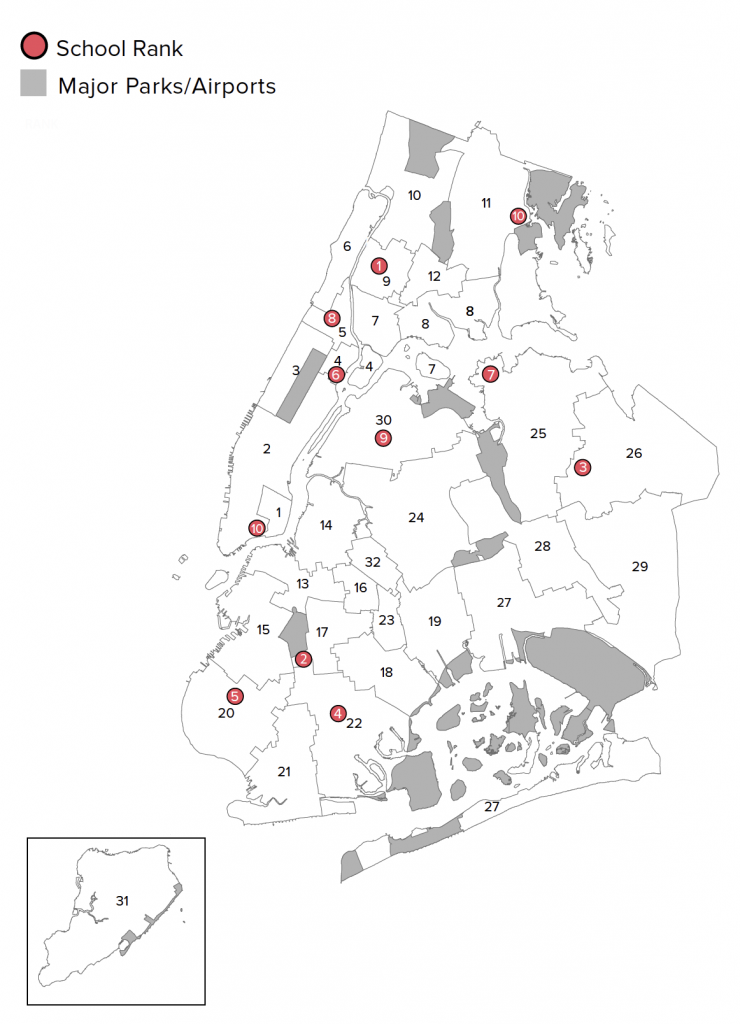
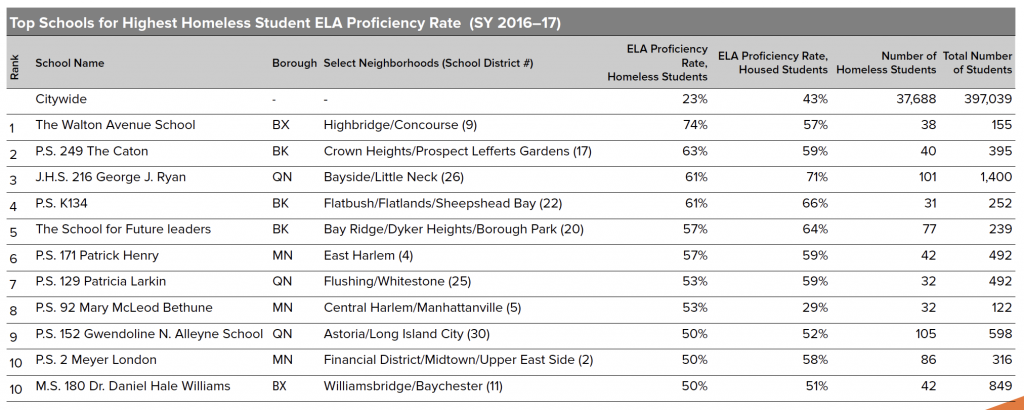
1.6 Which Schools Had the Highest ELA Proficiency Rates for Homeless Students?
- The schools with the highest rates of ELA proficiency for homeless students all had rates of 50% or higher. This was higher than the proficiency rate for all students citywide (41%). The Walton Avenue School in Highbridge had the highest proficiency rate (74%) for homeless students, though it is located in a district with one of the lowest rates (District 9).
- At two of the top schools, The Walton Avenue School in Highbridge and P.S. 249 in Crown Heights, homeless students scored proficient at a rate higher than their housed classmates (District 9, 74% vs. 57% and District 17, 63% vs. 59%, respectively).
- The other schools where homeless students were most likely to score proficient on their ELA exams were evenly spread throughout Manhattan, the Bronx, Brooklyn, and Queens.
Understanding what instructional and social-emotional
supports, along with training and professional
development for staff, are available to help homeless
students perform at grade level in the top schools can
help other schools raise proficiency rates for all students.
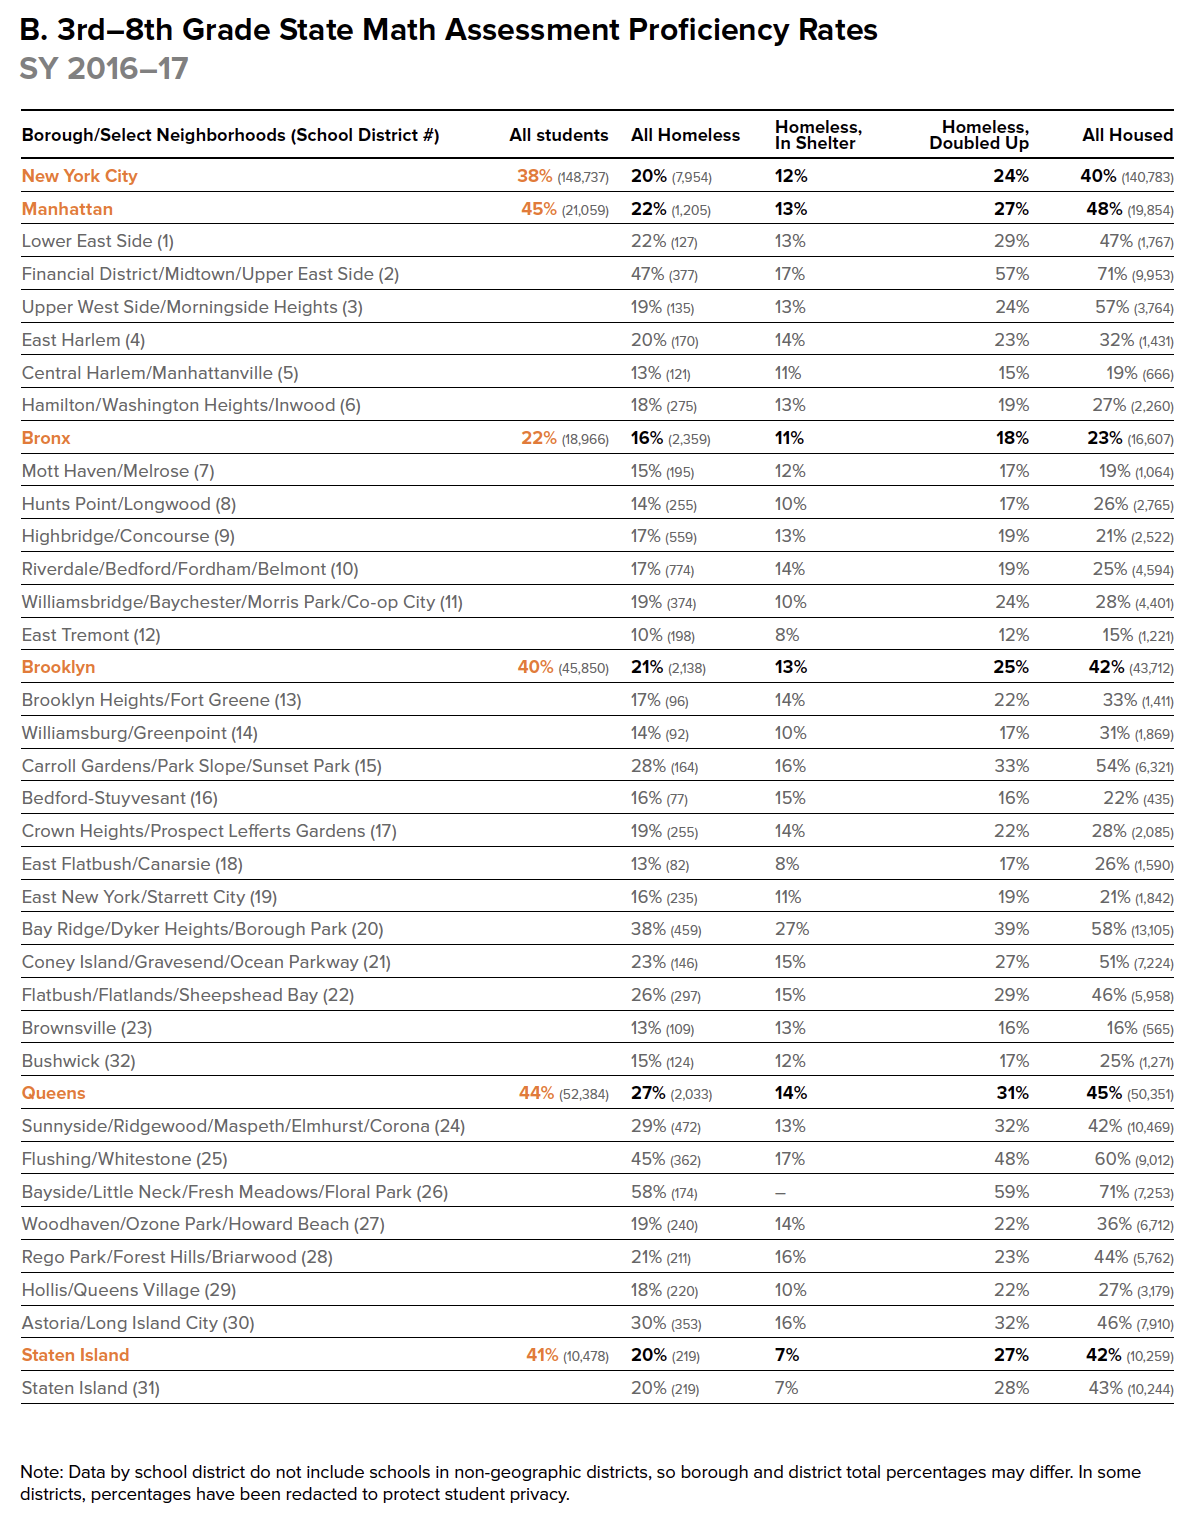
1.7 What Are Math Proficiency Rates in Each District?
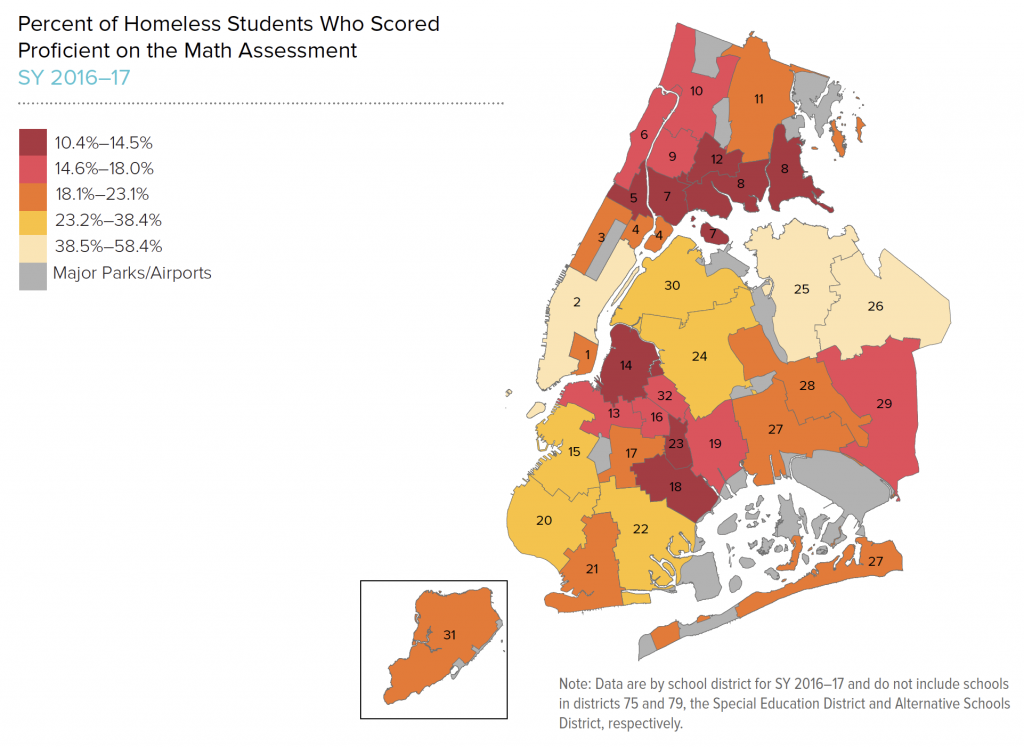
- Similar to trends in ELA proficiency rates, homeless students in Bayside (58%) were the most likely to score proficient on their math exams (District 26), while East Tremont (10%) students were the least likely (District 12).
- After Bayside, the districts with the next-highest percentages of homeless students scoring proficient in math were Midtown (47%) and Flushing (45%) (Districts 2 and 25, respectively).
- At the borough level, math proficiency rates for homeless students were highest in Queens, where more than a quarter of homeless students scored proficient on their math exams (27%). Proficiency rates were lowest in the Bronx, with fewer than one in six homeless students scoring proficient (16%).
- Three of the seven districts with the lowest percentages of homeless students who scored proficient were in the Bronx (Districts 7, 8, and 12) and three were in Brooklyn (Districts 14, 18, and 23).
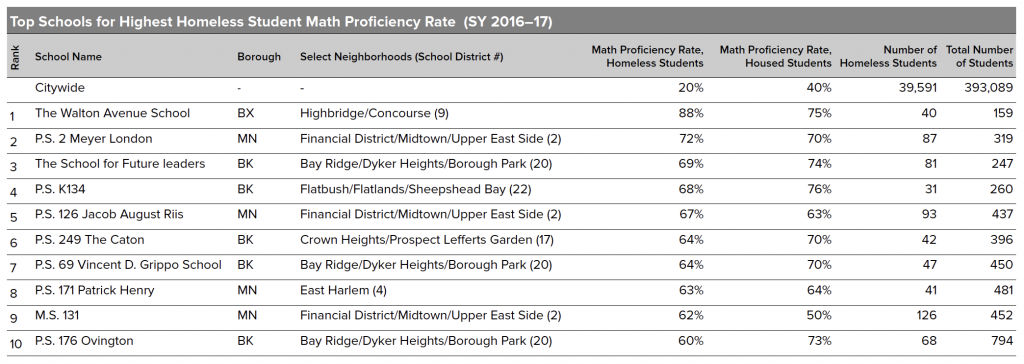
1.8 Which Schools Have the Highest Math Proficiency Rates for Homeless Students?
- The school with the highest math proficiency rate for homeless students was the same as for ELA proficiency—The Walton Avenue School in Highbridge, where nearly nine in 10 (88%) homeless students met grade-level standards in math (District 9). This is over twice the citywide proficiency rate of 38% for all students.
- In four of the top schools—the Walton Avenue School in Highbridge, and P.S. 2, P.S. 126, and M.S. 131 in Midtown—homeless students had higher proficiency rates than their housed classmates (Districts 9 and 2, respectively). The gap was widest at the Walton Avenue School, where 88% of homeless students scored proficient, compared to 75% of housed students.
- Five of the top schools were clustered in southern and central Brooklyn (Districts 17, 20, and 22), and three were clustered in lower Manhattan (District 2).
2.0 | Disparities in Academic Achievement: On-Time High School Completion
Four-Year Graduation Rate
The percentage of high school students who graduated with a Local or Regents diploma in 2017 and first entered ninth grade in SY 2013–14. Rates reported in this publication are for August and include summer graduates.
Four-Year Dropout Rate
The percentage of high school students who first entered ninth grade in SY 2013–14 and were no longer enrolled in 2017.
Graduating high school is critical to ensuring access to future opportunities and breaking the intergenerational cycle of poverty affecting many homeless students. Unfortunately, of the approximately 6,500 students in the class of 2017 who experienced homelessness at some point during high school, only 56% graduated on time with their class (i.e. in four years). An additional 25% were still enrolled after four years, with only 26% of these students graduating in the following year.
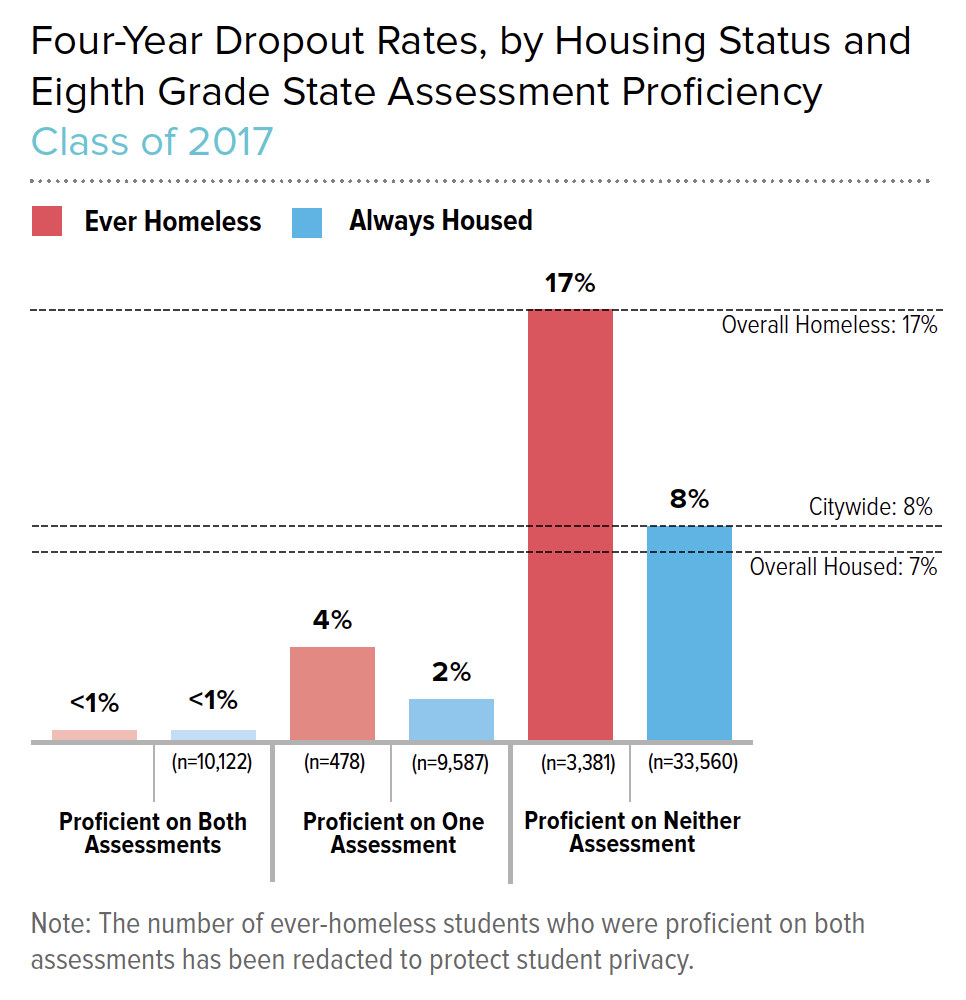
At the same time, nearly one in six homeless students (17%) dropped out of high school within four years, limiting their access to these same educational and career opportunities. However, homeless students who scored proficient on at least one of their eighth grade ELA and math state assessments dropped out at a far lower rate (4%). This highlights the need for targeted support to students experiencing homelessness even before they begin high school to ensure that they are entering ninth grade with the proper academic foundation.
Similarly, the presence of school instability factors affects graduation rates for all students. In fact, when homeless students were able to attend school regularly and did not have to transfer mid-year, they graduated at rates similar to their housed peers (90% vs. 96%), and well above the citywide graduation rate of 74%. Unfortunately, fewer than one in three homeless students (29%) experienced no school instability factors in high school. Educational supports that target these school instability risk factors and specifically address the challenges of homelessness can go a long way in helping all students graduate on time to a future that is not determined by their experience of homelessness.
2.1 How Does Homelessness Affect a Student’s Likelihood of Completing High School In Four Years?
- More than half of the nearly 6,500 students who were homeless at some point in high school (56%) graduated within four years—significantly lower than the 77% rate for students who were always housed during high school.
- Students who experienced homelessness during high school were less likely to graduate than those who were housed but were formerly homeless in middle school (56% vs. 65%).
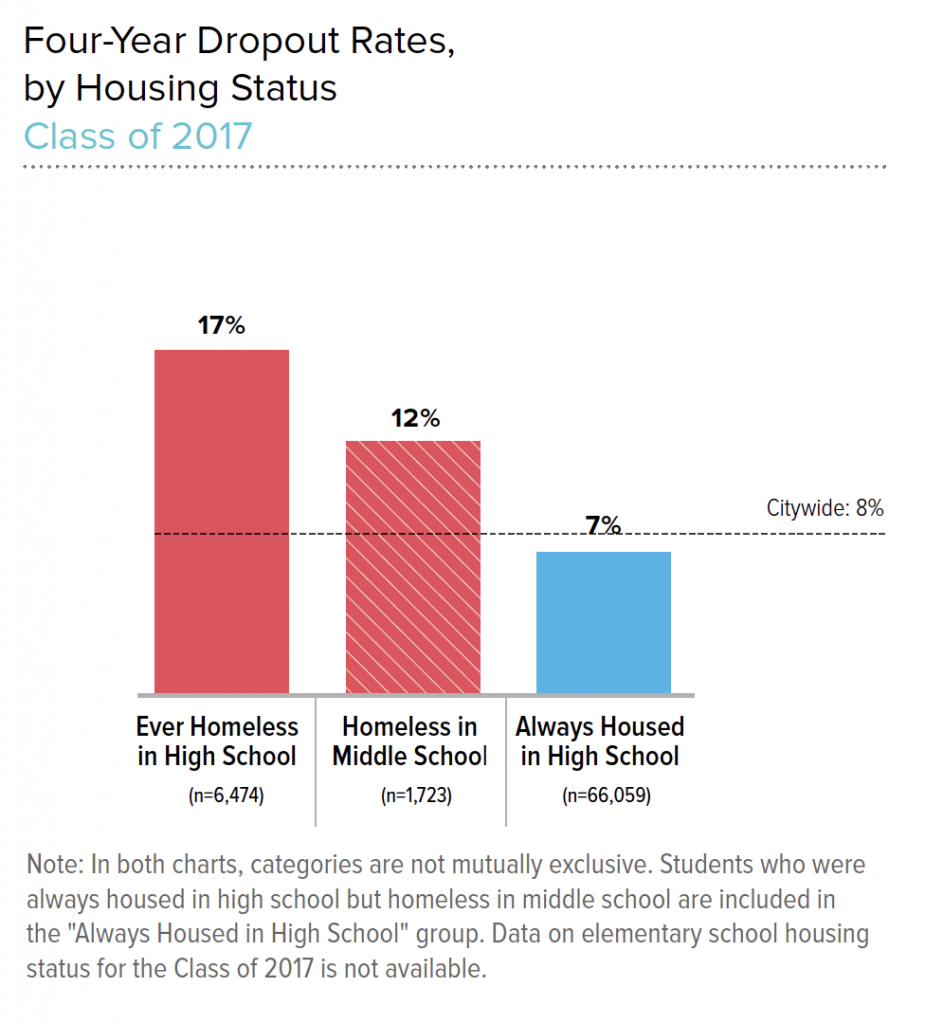
- Of students who were homeless during high school, one in six dropped out of school within four years (17%). This was more than twice the rate of students who were always housed (7%).
- Students who were homeless in middle school, but not high school, dropped out at a rate of 12%—lower than the 17% dropout rate for students who were homeless in high school, but still well above the citywide dropout rate of 8% for all students.
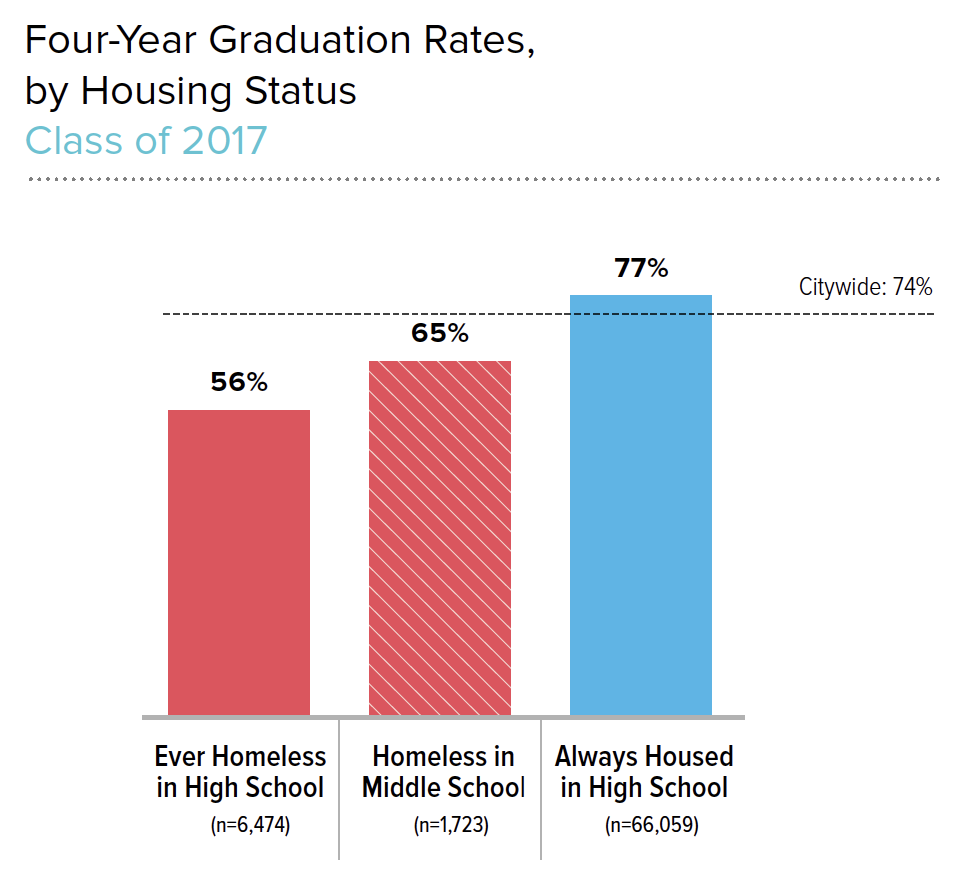
Low graduation rates for students who were
housed during high school but homeless during
middle school suggest that homelessness has a
prolonged effect on students’ ability to complete
high school on time.
2.2 Does Middle School Assessment Proficiency Affect Graduation and Dropout Rates?
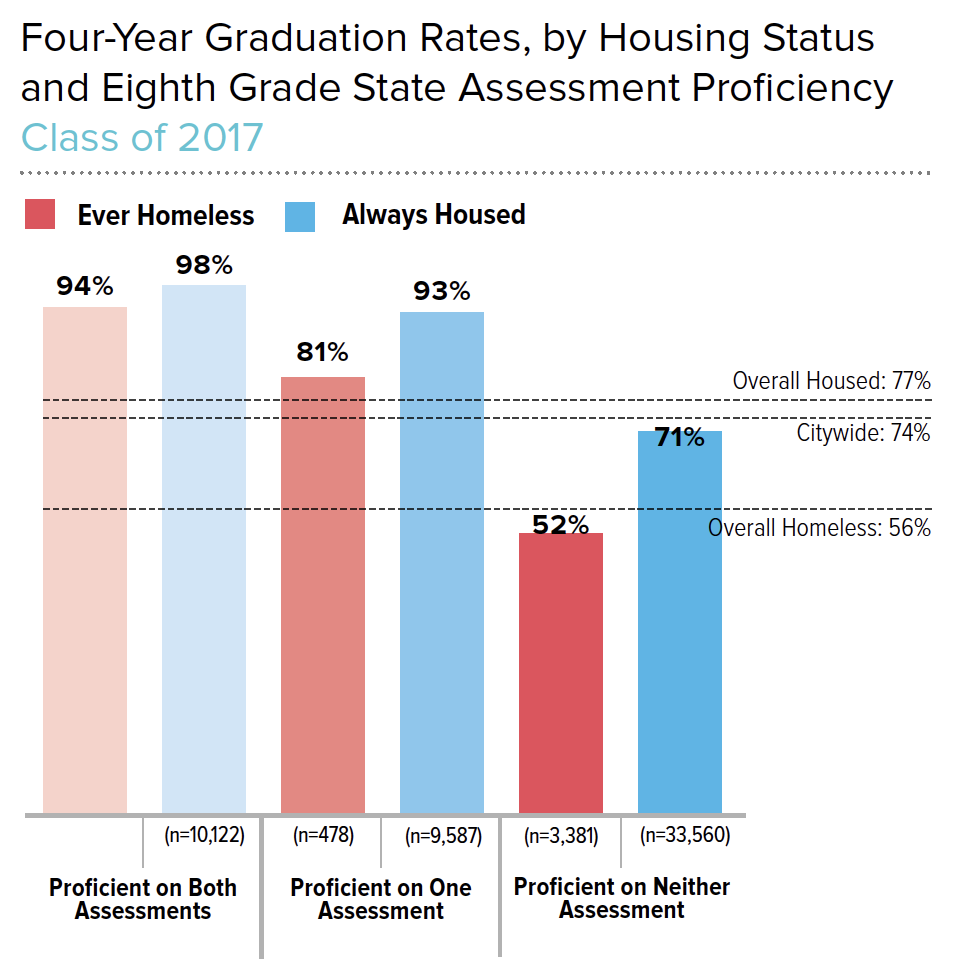
- Proficiency on eighth grade ELA and math assessments was associated with higher graduation rates for all students, but was especially significant for homeless students. Among homeless students who scored proficient on both assessments, nearly all, 94%, graduated on time.
- For homeless students who scored proficient on neither assessment, only half (52%) graduated on time—far lower than the 71% graduation rate for housed students who were also proficient on neither exam.
- When homeless students scored proficient on both their ELA and math state assessments in eighth grade, however, they dropped out at similarly low rates as housed students (<1%).
- Homeless students who scored proficient on neither assessment dropped out at about twice the rate of their housed classmates who scored below proficiency on both assessments (17% vs. 8%) and over twice the rate of the citywide average of 8%.
KEY TERMS
State Assessments
Assessments are administered every year for students in grades 3–8 in English Language Arts (ELA) and math. Students who score at levels 3 or 4 on a 4-point scale are considered proficient. Students who have resided in the United States for less than one year are not required to take the ELA exam until the following year. Some students with an IEP may take the New York State Alternate Assessments in place of the statewide assessments.
Nearly all students who scored proficient on eighth
grade ELA and math assessments graduated on
time, regardless of housing status. However, only
6% of homeless students fell into this category,
compared to 19% of housed students.
2.3 Does School Instability Affect Graduation and Dropout Rates?
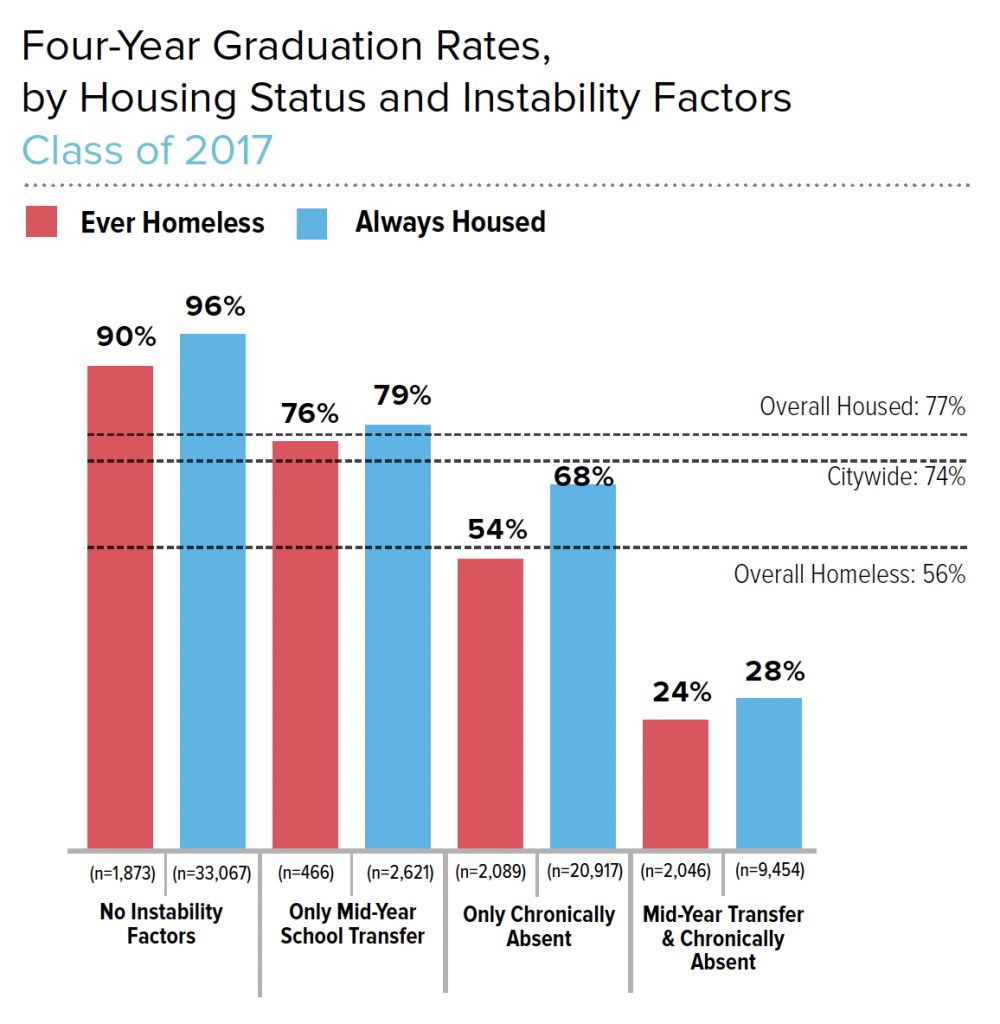
- In the absence of school instability factors—chronic absenteeism and mid-year school transfers—90% of homeless students graduated on time. This is well above the citywide graduation rate of 74% and almost as high as the 96% rate for their housed peers who also experienced no instability factors.
- Regardless of housing status, students who experienced school instability factors were less likely to graduate. When students were both chronically absent and transferred schools mid-year, only 24% of homeless students and 28% of housed students graduated on time.
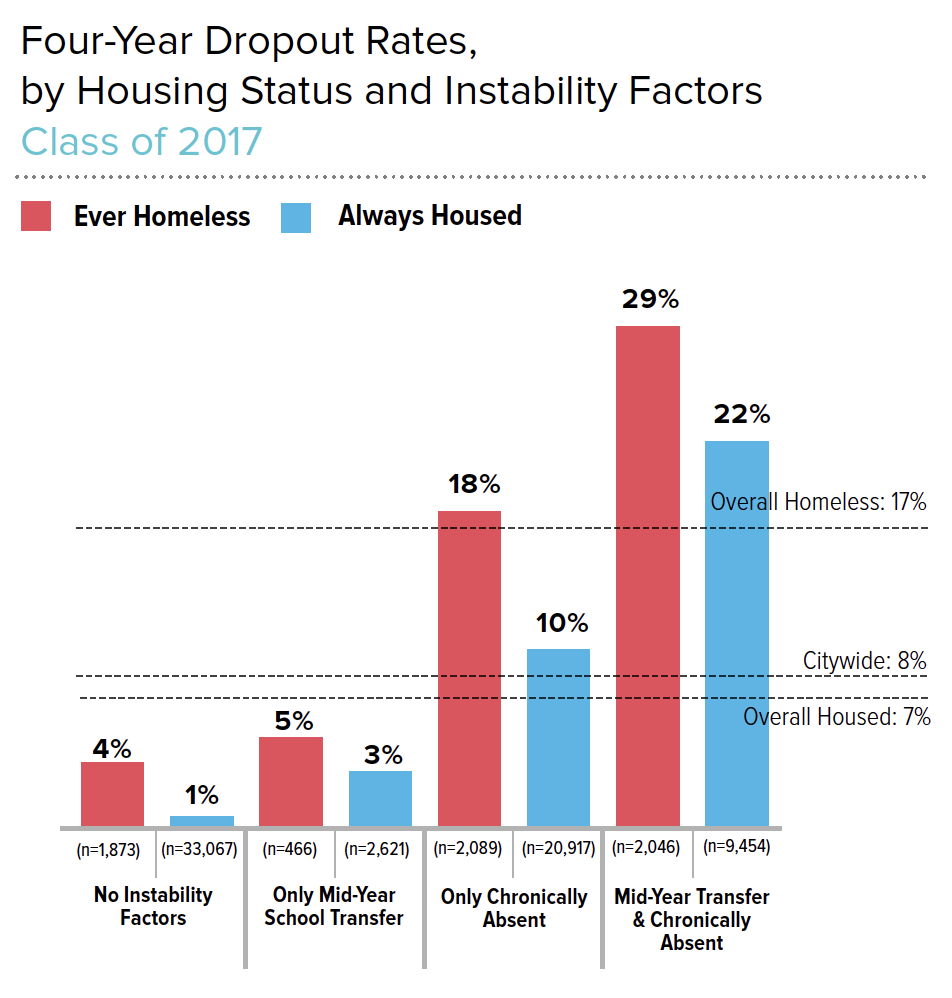
- Similar trends were seen with students’ dropout rates. Of homeless students who did not experience any instability factors, 4% dropped out of school—four times higher than the 1% of housed students with no instability, but only about half the citywide dropout rate of 8% for all students.
- Among homeless students who were chronically absent and transferred schools mid-year, more than one in four, 29%, dropped out. This was over seven times the rate of homeless students with no instability factors (4%).
KEY TERMS
Mid-Year Transfer
Students who transfer from one school to another at any point during the school year.
Chronic Absenteeism
Missing more than 10%, or more than 18 days, of a 180-day school year.
When homeless students are able to maintain
school stability, they graduate at rates higher
than the citywide average and close to those of
their housed classmates. However, only 29% of
homeless students do not experience any form of
school instability in high school, compared to 50%
of their housed classmates who do not experience
school instability.
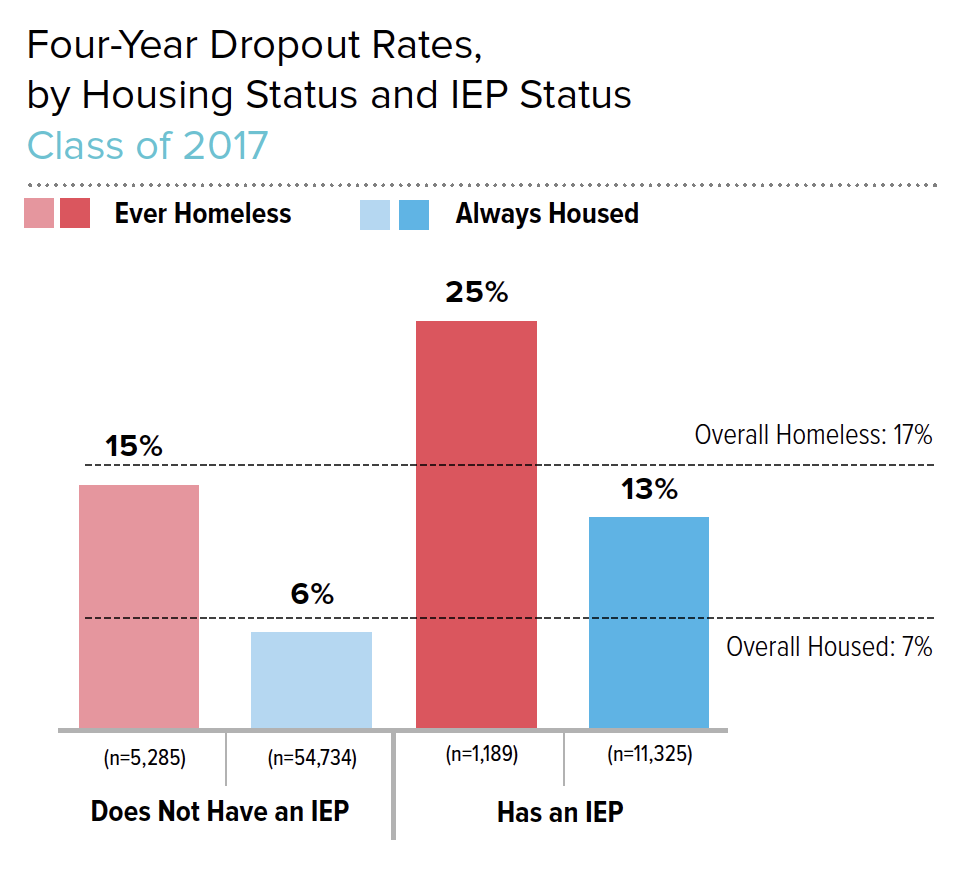
2.4 How Likely Are Homeless Students With Disabilities to Complete High School?
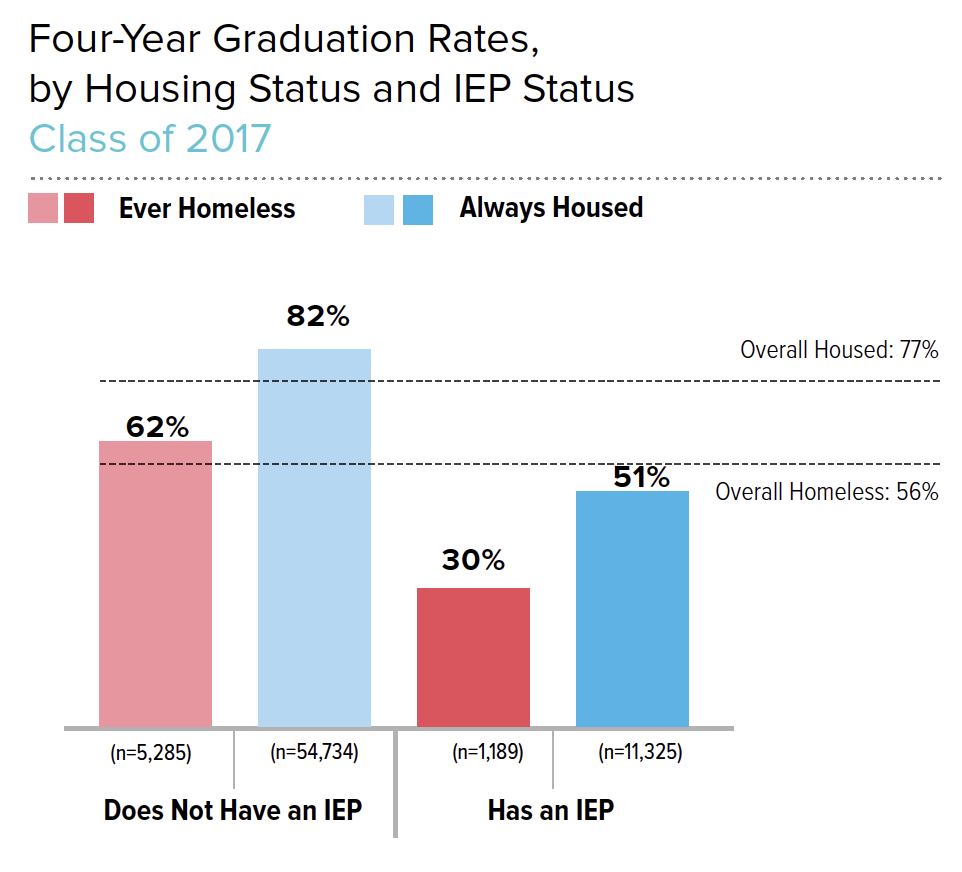
- The proportion of students with disabilities—those who had received an Individualized Education Plan (IEP)—were almost identical among homeless and housed students. Approximately 18% of students in the class of 2017 who had experienced homelessness during high school had an IEP, compared to 17% of students who were always housed.
- Regardless of their housing status, students with an IEP were less likely than their peers to graduate high school. However, even among students with an IEP, homeless students were far less likely to graduate than their housed classmates. Only 30% of homeless students who had an IEP graduated within four years, compared to 51% of housed students who had an IEP.
- Similar trends were seen in students’ dropout rates. Among homeless students who had an IEP, 25% dropped out of high school. This was nearly twice the rate of housed students who had an IEP (13%).
KEY TERMS
Individualized Education Plan (IEP)
An Individualized Education Plan (IEP) is a written statement from the NYC Department of Education to provide a free and appropriate public education for students in any of 13 disability categories in the least restrictive environment possible. The IEP outlines the specific individual supports and services that the student will receive, and is created through a collaborative process involving parents, teachers, and administrators, at a minimum.
Among homeless students with an IEP, those with
a speech or language impairment had the highest
graduation rate (49%) and the lowest dropout
rate (14%). Those with an intellectual disability or
emotional disturbance had the lowest graduation
rates (0% and 8%, respectively), and those with an
emotional disturbance had the highest dropout
rate (36%).
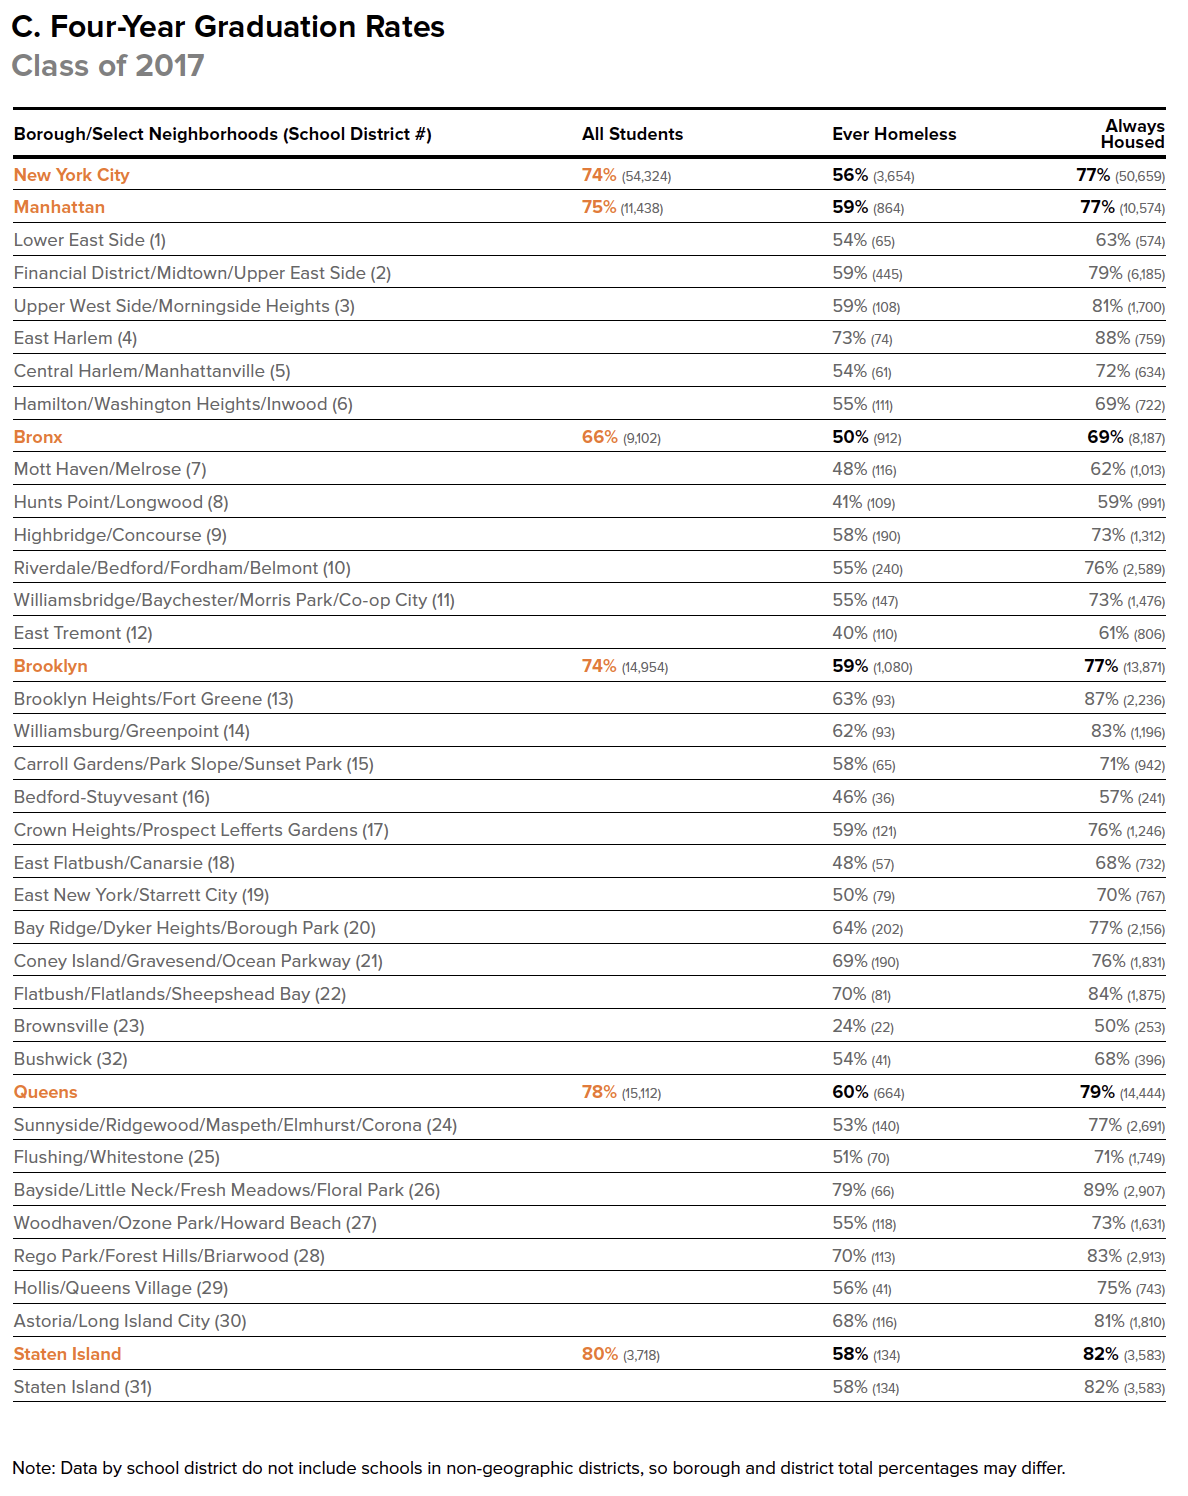
2.5 What Are Four-Year Graduation Rates For Homeless Students in Each District?
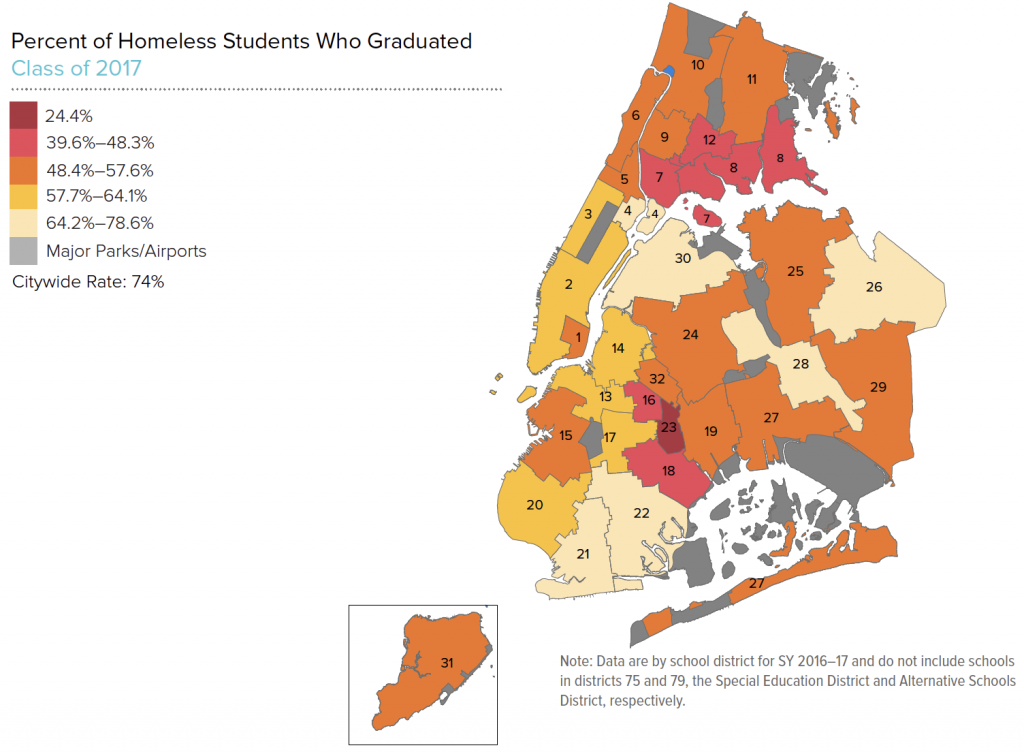
- The citywide graduation rate continues to increase slightly. For the class of 2017, the graduation rate was 74%—up from 73% for the class of 2016.
- Bayside had the highest graduation rate for homeless students, at 79%—four points above the citywide average for all students (District 26). After Bayside, graduation rates were the highest in East Harlem (73%) and Flatbush (70%) (Districts 4 and 22, respectively).
- Graduation rates for homeless students in Brownsville were far lower than in every other district, at only 24% (District 23). This was the only district where less than one-third of all homeless students graduated on time.
- In every district, homeless students were less likely to graduate than housed students. However, the greatest disparities in graduation rates between homeless and housed students were in Brownsville (24% vs. 50%) and Brooklyn Heights (63% vs. 87%) (Districts 23 and 13, respectively).
- Coney Island had the smallest gap between homeless and housed students’ graduation rates (69% vs. 76%) (District 21).
2.6 What Are Four-Year Dropout Rates For Homeless Students in Each District?
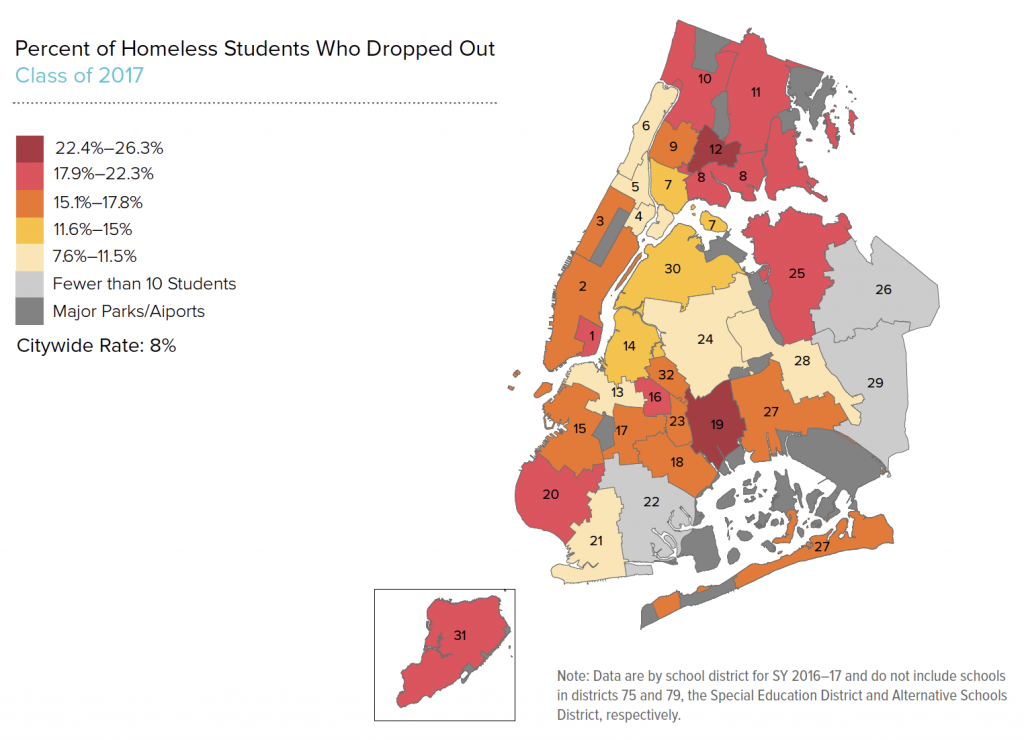
- The citywide dropout rate continues to slowly decline. For the class of 2017, the dropout rate was slightly below 8%—down from 9% the prior year.
- Dropout rates were highest in East Tremont where over one in four homeless students dropped out—twice the rate for housed students in the district (District 12, 26% vs. 13%). This was followed by East New York, where homeless students also dropped out at twice the rate for housed students (District 19, 24% vs. 12%).
- Coney Island was the only district where the dropout rate for homeless students was below the citywide average (District 21). East Harlem had the second-lowest rate at 10% (District 4). Homeless students had higher dropout rates than housed students in every district. Staten Island, however, had the greatest disparity between homeless and housed students (19% vs. 5%) (District 31).
- Homeless and housed students had nearly equal dropout rates in Coney Island (8% vs. 7%) and Washington Heights (10% vs. 9%) (Districts 21 and 6, respectively).

Appendix
The data for the Student Homelessness in New York City series were provided by the New York City Department of Education. Unless otherwise noted, the source is the New York City Department of Education, unpublished data tabulated by the Institute for Children, Poverty, and Homelessness, SY 2010–11 to SY 2016–17. At the time of publication, SY 2016–17 is the most recent year of data available for which analysis of homeless students is complete. Data will be updated for SY 2017–18 as it becomes available.
The numerators and rates are provided in the Appendix for several categories, including all students, all homeless students, and all housed students at each geographic level. Additionally, the rates of these indicators for subpopulations of homeless students—those living in shelter and those living doubled up—are shown, along with housed students.
In addition to this resource, the New York City Interactive Map of Student Homelessness allows users to view data specific to their district. ICPH’s report, School Instability Factors, explores mid-year school transfers and chronic absenteeism in greater depth. The report Addressing Barriers to Learning, examines pre-K participation trends, timely access to services for English Language Learners, and early identification of disabilities among students experiencing homelessness. The recently-released report Beyond Graduation: Are Homeless High School Students Prepared for College? examines college readiness among New York City graduates who experienced homelessness during high school.
Ralph da Costa Nunez, PhD, President and CEO
Aurora Zepeda, Chief Operating Officer
Project Team:
Andrea Pizano, Chief of Policy Research
Josef Kannegaard, Principal Policy Analyst
Amanda Ragnauth, Senior Policy Analyst
Kaitlin Greer, Policy Analyst
Mukta Ramola, GIS Analyst
Katie Linek Puello, Director of Communications
Hellen Gaudence, Senior Graphic Designer