On the Map
Community Profile
June 2016
Struggles with homelessness and poverty are not new to East New York. Between 2004-2014, more than 5,000 East New York families entered the City’s shelter system, more than any other neighborhood in New York City.1 With 29% of residents living below the poverty line and a median income of only $36,943 in 2013, East New York is one of the first neighborhoods in New York City currently designated for rezoning and affordable housing redevelopment.2
Crucially, not all of East New York faces the same level of economic instability; poverty is distributed unevenly block by block throughout the neighborhood. It remains to be seen whether the City’s proposed redevelopment will prevent more families from becoming homeless or how it will address this uneven experience of poverty. In fact, data suggest that affordable housing redevelopment plans that fail to address the neighborhood’s poorest residents will likely contribute to increasing family homelessness.
Key Findings
-
East New York has contributed more families to the City’s shelter system than any other New York City neighborhood. Over 5,000 families entered shelter from FY 2005 to FY 2014.
-
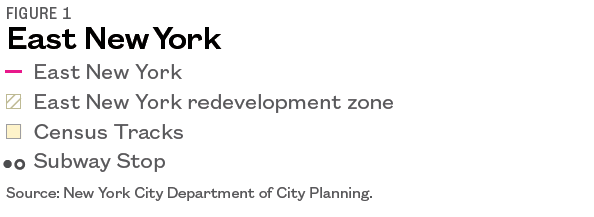
There was a loss of over 10,000 units of affordable housing renting for under $1,000 from 2005 to 2013. During this nine-year period, the share of affordable units declined from 71% of the rental stock to 39%.
-
Overcrowding in East New York nearly tripled from 2005 to 2013, growing from 6% to 16% of rental units.
-
The planned affordable housing units will be unaffordable for the 36% of East New York families who earn under 30% of the New York City Area Median Income (AMI) per year.
Growing Neighborhood Instability
At the same time as affordable housing declined, rental unit overcrowding—often a proxy for homeless families doubled up with friends or family, and the most frequent living situation of families prior to entering shelter—almost tripled, rising from 6% in 2005 to 16% in 2013.
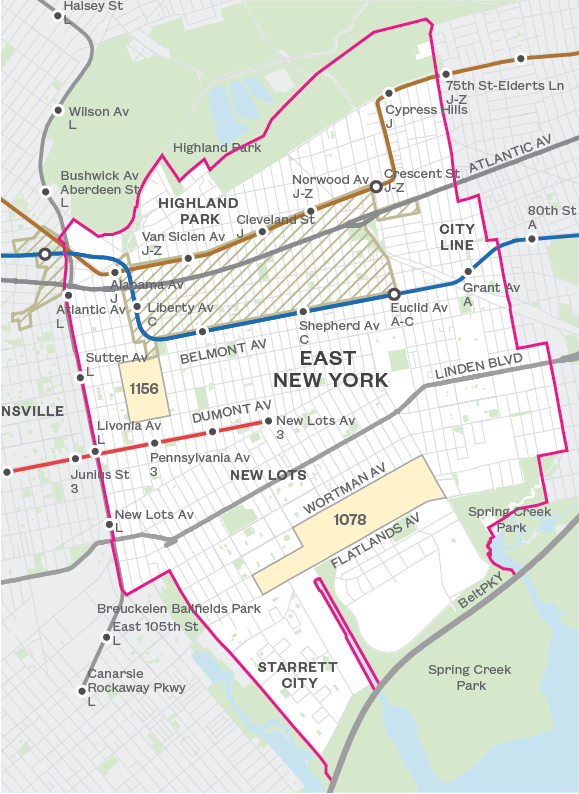
East New York is a neighborhood destabilized by poverty. In 2013, 29% of residents lived below the Federal Poverty Level.3 But as seen in the preceding map, the distribution of this poverty was not even. Nearly 60% of New York residents lived in poverty in neighborhoods such as Linden Park in the western part of East New York, bordered to the north by Belmont Avenue and to the south by Dumont Avenue (Census Tract 1156). Yet the share of residents living in poverty was only 6% in the blocks near Spring Creek Park bordered by Flatlands Avenue to the south and Wortman Avenue to the north (Census Tract 1078).4 Poverty and economic instability vary block by block, but a growing number of residents throughout East New York are feeling this pressure as the prospect of redevelopment grows and the number of existing affordable rental units declines.
In 2005, East New York had considerable affordable housing, with 71% of units renting for below $1,000 and a median rent of $749.5 But neighborhood median rent rose by close to 50% between 2005 and 2013, and the neighborhood lost over 10,000 units renting below $1,000 per month.6 By 2013 only 39% of units in East New York rented for below $1,000 per month (Figure 1). In contrast, the median household income in the neighborhood increased just 20% in the same time frame, with the median family earning merely $36,943 in 2013.
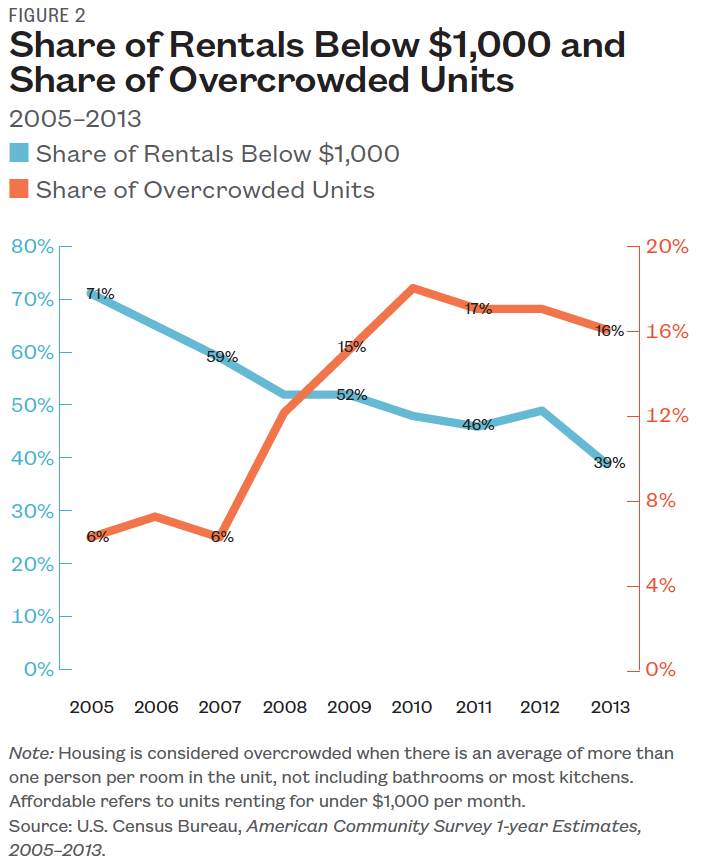
At the same time as affordable housing declined, rental unit overcrowding—often a proxy for homeless families doubled up with friends or family, and the most frequent living situation prior to entering shelter7—almost tripled, rising from 6% in 2005 to 16% in 2013 (Figure 2).8 This overcrowding is concentrated within a half-mile of the planned East New York redevelopment zone, where 20% of rental units were overcrowded compared to only 9% of units beyond a half-mile (Figure 4). The severity and intensity of overcrowding throughout East New York has increased as well—many bedrooms are crammed with two or three more occupants than intended, and living rooms sleep entire families. The percentage of severely overcrowded rental units has increased fivefold from less than 1% in 2005 to nearly 5% in 2013 (Figure 3).9 These trends highlight the growing financial strain and housing instability faced by East New York residents.
Amidst this financial and housing pressure, more families are turning to the City’s shelter system. Family shelter entry increased by 24% between FY 2005 and FY 2014, with 564 East New York families moving into shelter in FY 2014 and over 5,000 families entering the shelter system since 2005.10 In FY 2014 alone and over the cumulative ten-year period from FY 2005 to FY 2014, New York City shelters took in more families from East New York than from any other neighborhood. The extent of housing instability in the neighborhood is even greater than the shelter numbers show—neighborhood school data reveal that over 2,800 homeless students attended schools in District 19 in SY 2013–14, which serves East New York (Figure 4).11 This means that 11% of the neighborhood’s public school students are homeless—a higher rate than the New York City average (8%).12 Within the universe of homeless students, 46%, or over 1,300 students, live doubled up with another family due to loss of housing or economic hardship.13
New York City shelters took in more families from East New York than from any other neighborhood.
Poverty and Homelessness in the Proposed Redevelopment Area
East New York is one of the first areas designated by the City as a neighborhood to be rezoned and redeveloped as part of the de Blasio administration’s affordable housing plan.14 The redevelopment zone includes the northern region of East New York, with Fulton Street as the northern border and Pitkin Avenue as the southern border.15 Just 10% of new housing units planned for this redevelopment zone will be made affordable for those earning 30% of AMI or less.16 Based on the income of families living in East New York, however, these units would still be unaffordable for 36% of all the neighborhood’s families.17 As of April 2016, the plan guarantees only about 150 units for the almost 19,000 East New York households earning below 30% of AMI.18
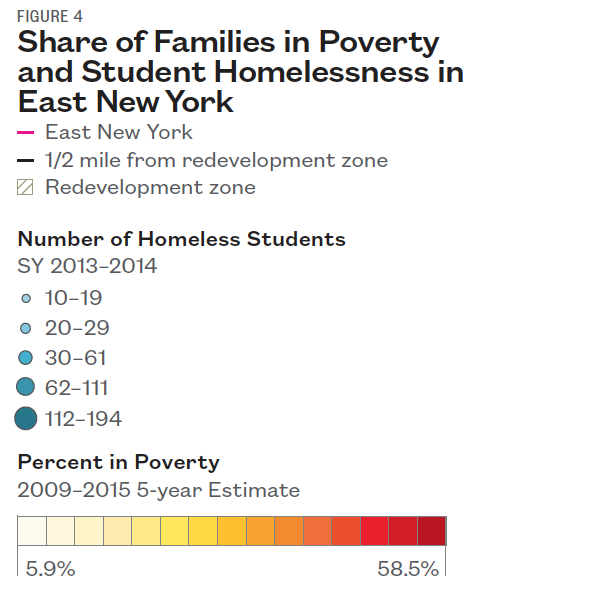
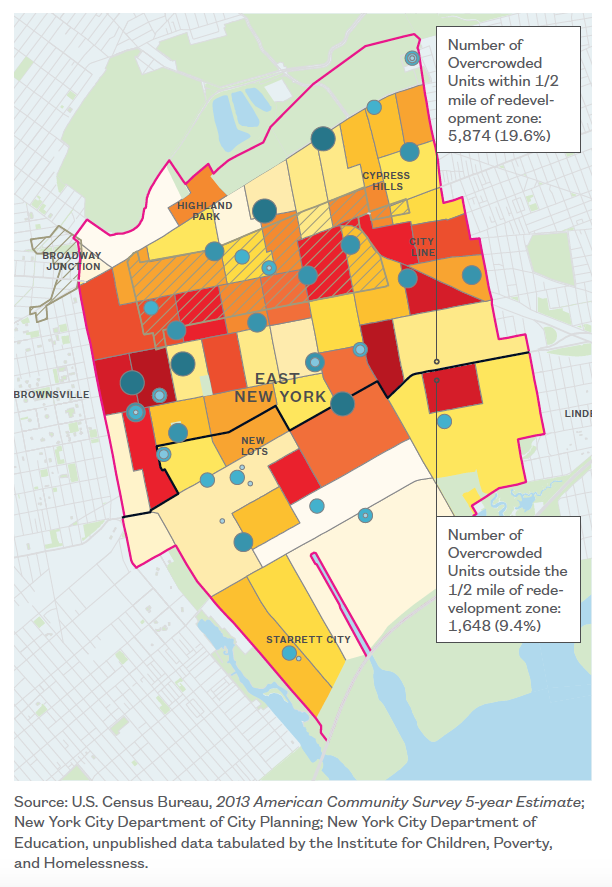
In addition to the unaffordability of the planned “affordable” units to over one-third of East New York families, the location of the redevelopment zone and the likely effects of gentrification call into question the impact of redevelopment on the neighborhood’s children, who are most at risk for housing instability and homelessness. Within the half-mile around the redevelopment zone in East New York, one in four families with children lives in poverty, including roughly 800 single mothers with children under five (Figure 4). Children, particularly those under age five living in poverty in a single-parent household, are at the greatest risk of homelessness. With so many vulnerable children in the neighborhood, there is a strong need for services, including affordable childcare and job training, to increase economic stability and social support.
Jeopardizing or Creating a Future?
… just 150 or 11% of the 1,310 units planned for East New York will go to the 19,000 families with the greatest risk of becoming homeless.
East New York faces instability driven by a rapid loss of affordable housing, dramatic increase in over-crowding, concentrated poverty, and a large number of families entering shelter. The City plans to develop new housing units, but how those units will impact the already unstable housing market will depend on the units’ prices. Current projections show that 36% of East New York’s families would not be able to afford the new affordable units, and even fewer would likely be able to pay for the market rate apartments. Redevelopment that does not take into account affordability in the neighborhood, the gap between the number of lower-cost units and families who need those units, or the service needs for residents of the neighborhood could contribute to further destabilization of the community. This would place more children and families at risk for homelessness and entering shelter. As East New York has been the primary feeder of families into the City shelter system, it should be a primary beneficiary of Mayor de Blasio’s affordable housing plan. However, that will not likely be the case: just 150 or 11% of the 1,310 units planned for East New York will go to the 19,000 families with the greatest risk of becoming homeless.
With current affordable units in decline, the number of overcrowded and doubled-up units increasing an average 23% per year, and a homeless student population that is 37% higher than the citywide average, is the administration aware and equipped to deal with the reality of families on the edge in East New York? Why does this community appear to be getting shortchanged on the allocation of new affordable units for its neediest residents, and does the same fate await other poor communities where affordable units are planned? Is the purpose of redevelopment to help maintain the current community or to replace it with more affluent transplants? These difficult questions merit serious discussion; East New York may serve as an early barometer of the impact that the de Blasio administration’s affordable housing plan may have on roughly two dozen communities and untold numbers of families citywide.
Endnotes
1 Citizens’ Committee for Children of New York, Keeping Track Database, FY 2005–FY 2014.
2 David J. Goodman, “New York Passes Rules to Blunt Gentrification,” New York Times, March 22, 2016, http://www.nytimes.com/2016/03/23/ nyregion/new-york-council-passes-zoning-chang- es-de-blasio-sought.html, accessed March 29, 2016; “Text of Mayor de Blasio’s State of the City Address,” New York Times, February 3, 2015, http://www.nytimes.com/2015/02/04/nyregion/ new-york-mayor-bill-de-blasios-state-of-the-city- address.html, accessed March 29, 2106.
3 U.S. Census Bureau, 2013 American Community Survey 1-year Estimates.
4 U.S. Census Bureau, 2013 American Community Survey 5-year Estimates.
5 U.S. Census Bureau, 2005 and 2013 American Community Survey 1-year Estimates.
6 Ibid.
7 The Institute for Children, Poverty, and Homelessness, The Invisible Majority: Doubled-up Students in New York City Public Schools, May 2015.
8 Ibid.
9 Ibid.
10 Citizens’ Committee for Children of New York, Keeping Track Database, FY 2005–FY 2014.
11 The Institute for Children, Poverty, and Homelessness, The Atlas of Student Homelessness in New York City, August 2015.
12 Ibid.
13 Ibid.
14 “Text of Mayor de Blasio’s State of the City Address,” New York Times, February 3, 2015, http://www.nytimes.com/2015/02/04/nyregion/ new-york-mayor-bill-de-blasios-state-of-the-city- address.html, accessed March 29, 2106.
15 New York City Council, “East New York: Final Zoning Modifications,” http://labs.council.nyc/land- use/neighborhood-plans/east-new-york/resourc- es/East-New-York-City-Council-Modifications.pdf, accessed 9 May 2016.
16 New York City Council, “East New York Plan – Summary,” http://labs.council.nyc/land-use/ neighborhood-plans/east-new-york/resources/ East-New-York-plan-summary.pdf, accessed 9 May 2016.
17 U.S. Census Bureau, 2013 American Community Survey 1-year Estimates; U.S. Department of Housing and Urban Development, FY 2013 Income Limits Documentation System. 30% of Area Median Income (AMI) for a family of three was $23,200 in 2013. Figure refers to the 30% of households in East New York that earned under $25,000 in 2013.
18 New York City Department of Housing Preservation and Development, “East New York Housing Plan”, September 21, 2015. Accessed 9 May 2016, https://www1.nyc.gov/assets/hpd/downloads/pdf/ East-New-York-housing-plan.pdf.