What Is New?
Key Findings
- While the shelter census in New York City has stabilized over the last year, the number of families entering the system continues to grow—increasing by 33% between FY 2012 and FY 2015.
- More than one-quarter of the citywide increase in family shelter entry between FY 2012 and FY 2015 can be traced back to six of New York City’s 59 neighborhoods—Mott Haven, Morrisania, East Harlem, Brownsville, East Flatbush, and East New York.
- The number of families in hotel shelter units grew by 20%—almost 400—twice the rate of growth of Tier II units. (July 2014–December 2015)
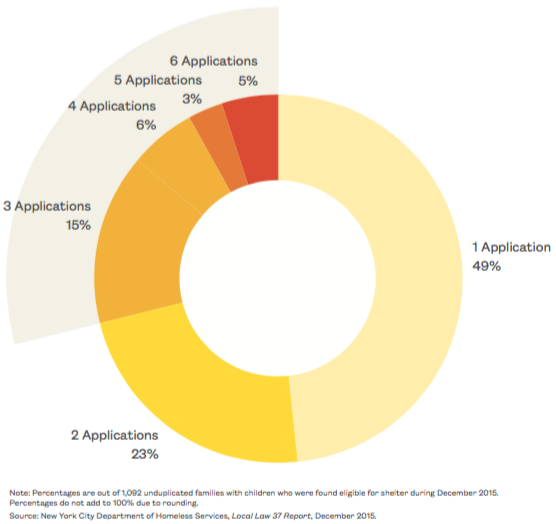
- Over half of families in shelter had to apply more than once before eventually being found eligible for shelter, with 29% having to apply three or more times.
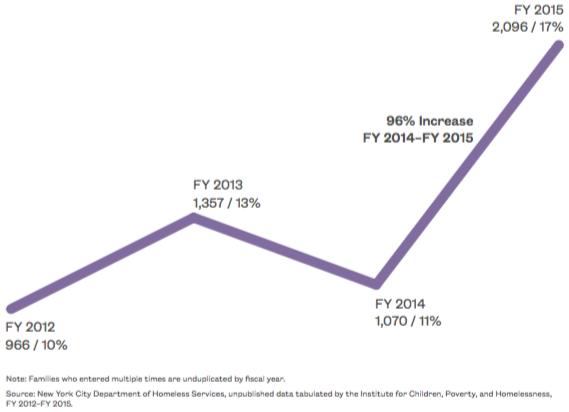
- The number of families immediately returning to shelter—within 30 days of exit—doubled in just one year, increasing from roughly 1,000 in FY 2014 to 2,000 in FY 2015.
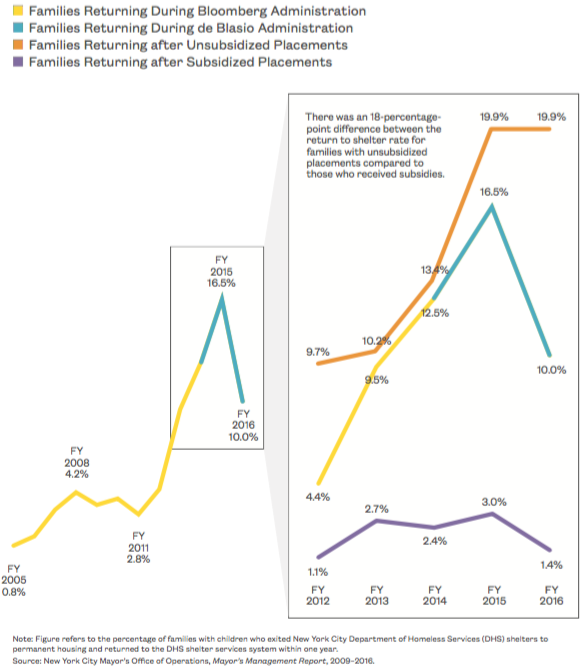
- Half of all families exited shelter with no form of housing subsidy in FY 2015. One in five families who exited shelter without any form of housing subsidy returned to shelter within one year.
Introduction
Homelessness in New York City continues to destabilize families and whole communities. While over 12,000 families—including 25,000 children—call a City shelter their home, the experience of housing instability and homelessness in New York City’s neighborhoods goes far beyond what shelter numbers alone show. In SY 2015–16, City schools identified four times as many homeless students as there were children living in shelter, and the current structure of the City’s shelter system is ill-equipped to meet the long-term stability needs of homeless children and families living both in and outside of the City’s family shelters.
The de Blasio administration released their new plan to address homelessness, Turning the Tide on Homelessness in New York City, at a critical time. Having now acknowledged the far-reaching negative consequences associated with homelessness and housing instability, the City faces an enormous challenge. The City’s homelessness crisis is the greatest threat to the well-being, health, and safety of children that the City has seen since the Great Depression. Homelessness places children at risk for developmental delays, trauma, educational setbacks, and poor physical and mental health; homeless parents face a dual burden of addressing their own housing and employment instability while also supporting their children through the experience of homelessness. While efforts by the de Blasio administration have maintained the monthly number of families living in shelter at roughly those of the year prior, these numbers mask the larger trend of growth in family homelessness.
Growing Instability
Over 12,000 separate families with children entered shelter in FY 2015—a 23% increase from the year prior, and a 33% increase from 2012 when roughly 9,000 unduplicated families entered the system. Likewise, in just one year, the number of students experiencing homelessness jumped from roughly 86,000 to 105,000—a 22% increase. Housing instability is an ever-growing reality for families in New York City and the total number of families living in shelter has remained steady only as a result of the City’s push to increase shelter exits.
The Revolving Shelter Door
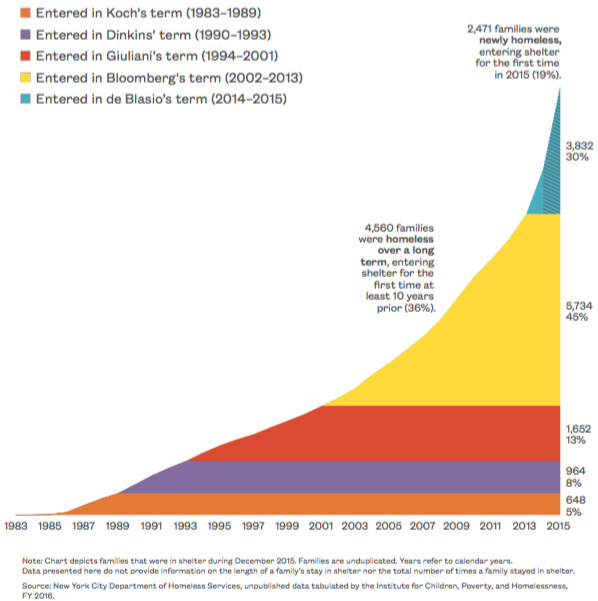
In FY 2015, close to 9,000 families with children exited the shelter system—the equivalent of three-quarters of all families living in shelter that year. The push for families to exit shelter in order to make room for new families in need is a worthy goal; unfortunately, the majority of families entering shelter are the same families that previously exited the system. In a snapshot of families with children living in shelter in December 2015, only 19% had entered shelter for the first time that year—that is the equivalent of only about 2,500 of the more than 12,000 families in shelter. Homelessness in New York City has become a cycle of instability where families leave the system only to return again in the future. Alarmingly, this cycle is becoming more rapid. Between FY 2014 and FY 2015 the number of families who entered shelter due to immediately returning to the system doubled to almost 2,000. This rapid cycle of family homelessness is both costly to the City and detrimental to families—children suffer academically while parents struggle just to meet their family’s most basic needs due to the repercussions of housing instability.
In the midst of these disturbing trends, it is critical to recognize that the City’s family homelessness crisis was not created overnight. Twenty-five percent of families in shelter in December 2015 entered for the first time prior to 2002, and 45% entered between 2002 and 2014. The vast majority of families in the shelter system has been mired in this cycle of housing instability for years, if not decades. If we are to truly see a decline in the number of families experiencing housing instability and homelessness, breaking this cycle is critical.
How do we help families meet their needs for long-term stability both while they are in shelter and after they have left? Opportunities exist to re-envision New York City’s shelter system and transform shelters into places where families stay out of desperation, and simultaneously grow into stability; places that provide resources not only to sheltered families, but also to those in the community who are at risk of homelessness.
A Deeper Understanding
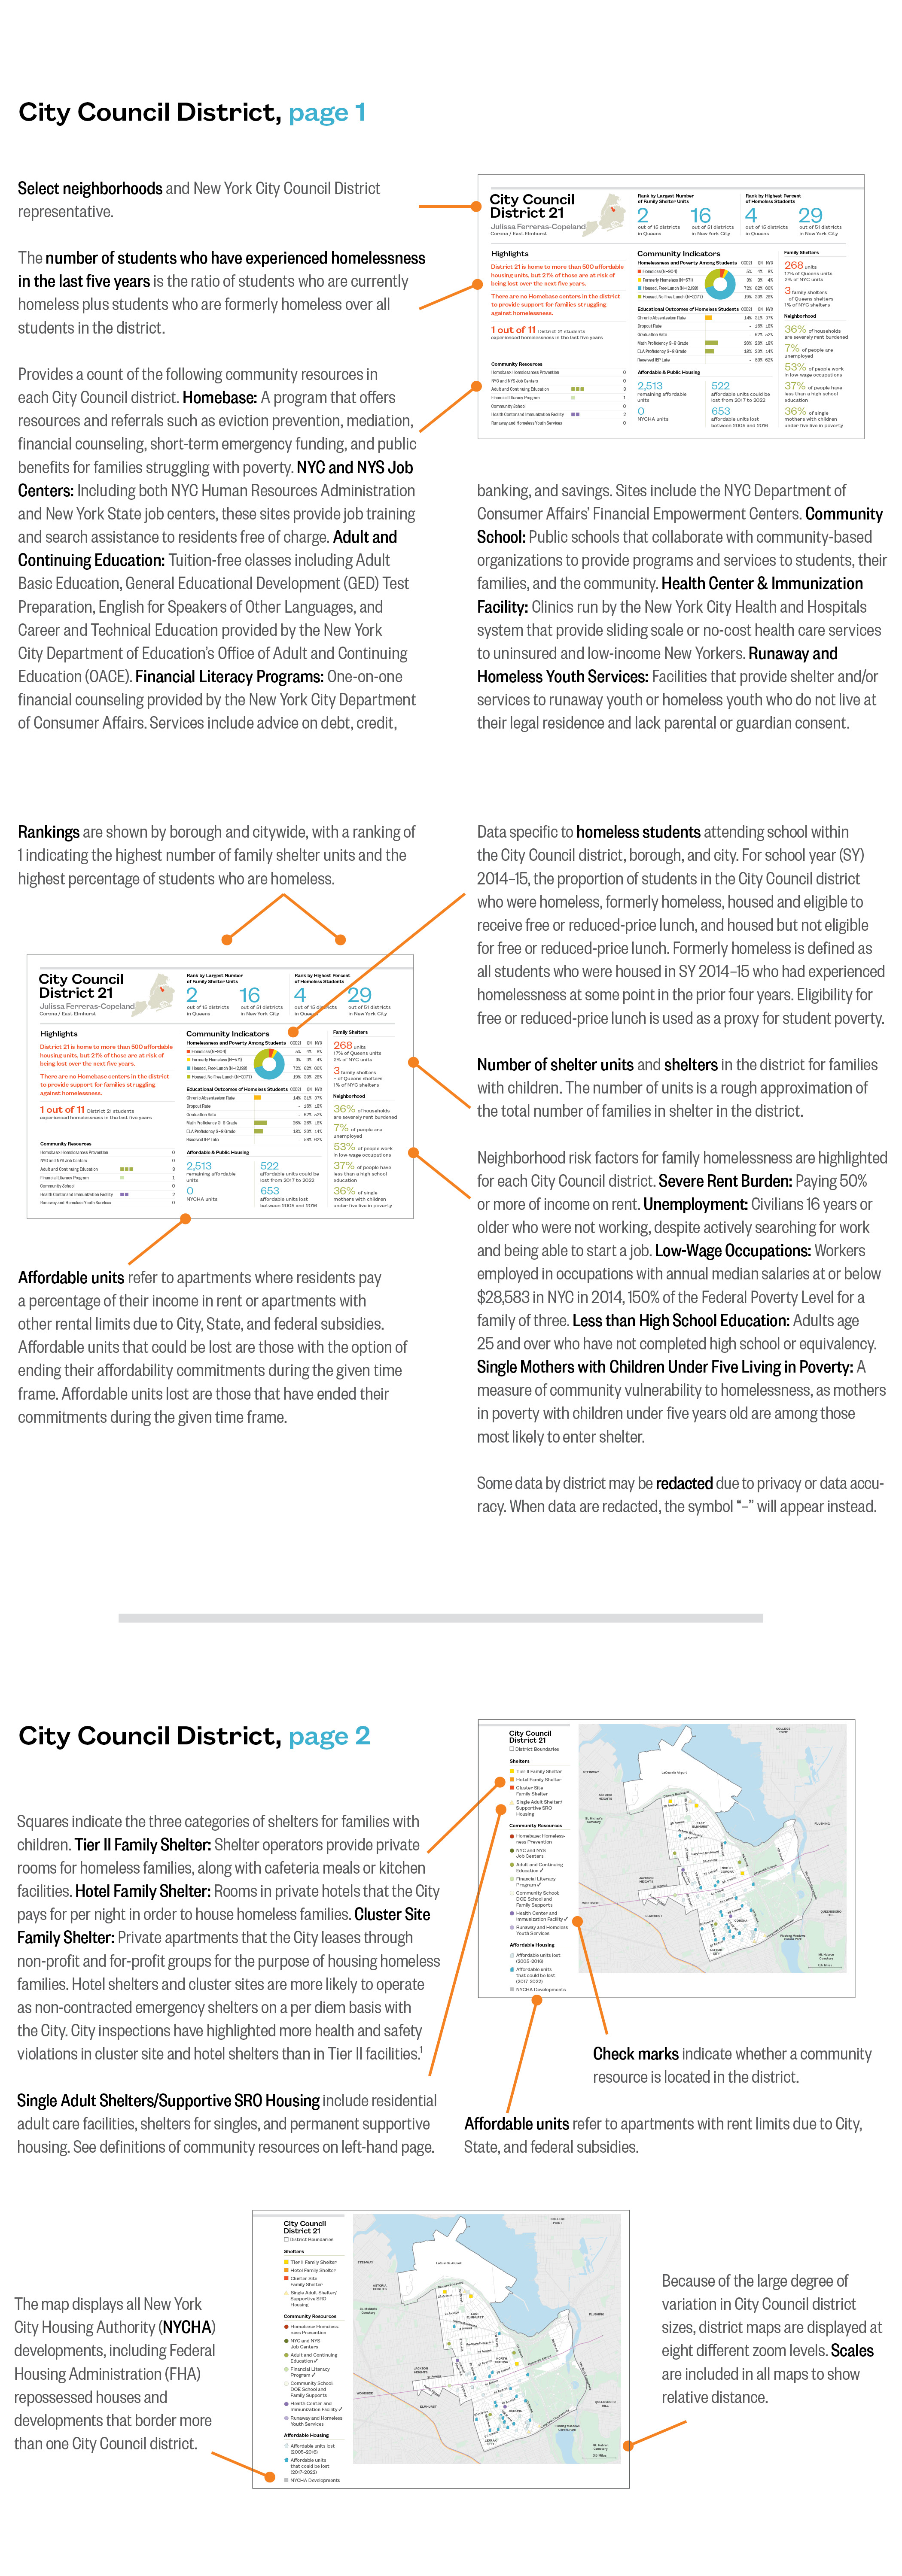
In order to further the conversation about the factors that continue to drive New York City’s family homelessness crisis, the 2017 On the Map: The Dynamics of Family Homelessness in New York City provides analysis of citywide homelessness trends, as well as an in-depth look at local patterns. Building off the 2016 On the Map: The Dynamics of Family Homelessness in New York City, this updated publication goes beyond its predecessor by providing “snapshots” for each of the 51 City Council districts. On the Map is an easy-to-use resource for policymakers, budget analysts, service providers, community leaders, and organizations.
Policy Considerations
A growing number of families in the city struggle with chronic housing instability. Twenty-five percent of families in shelter in December 2015 entered for the first time prior to 2002, and 45% entered between 2002 and 2014. In other words, the vast majority of families in the shelter system have been mired in a cycle of housing instability for years or even decades. These families need more than a home—they need help to address the underlying reasons that they became homeless in the first place, such as underemployment, lack of education, rent burden, and family violence. The City’s family homelessness crisis was not created overnight. To truly see the tide turn, the status quo for approaching family homelessness must be altered.
- We must better support families before, during, and after homelessness to meet adult education and workforce development needs so that parents can find jobs that will provide economic stability. At the same time, we must ensure those jobs exist within New York City.
- Shelters could be leveraged as community resource centers to provide services to both the families who are currently homeless and those at risk of homelessness.
- Streamlining the application process so family eligibility is determined more efficiently would lessen trauma for children and would improve educational outcomes by reducing school absences.
- Resources that exist in communities can be tailored to address local factors driving family homelessness and housing instability. The exact needs of families in Brownsville will not be the same as those in Elmhurst. How can we work strategically to match existing local resources with neighborhood and family dynamics?
Family Homelessness in New York City
“When I was 13 years old my mom was diagnosed with cancer. She lost her battle in 2010, and unfortunately six months after her death my grandmother, brother, and I had to move into shelter in Brooklyn. Before I moved into the shelter I lived doubled up with family. We were 11 people in a one-bedroom apartment and so that’s why we had to move into shelter. I have a physical disability— cerebral palsy—and I am in a wheelchair. One of the reasons I had to move was our living situation at the time was affecting my health.”
—20-year-old, formerly homeless
and disabled college student
Homelessness in New York City continues to destabilize families and whole communities. While over 12,000 families—including 25,000 children—called a City shelter their home, the experience of housing instability and homelessness in New York City’s communities goes far beyond what the shelter numbers alone show. In SY 2015–16, City schools identified four times as many homeless students as there were children living in shelter, but the current structure of the City’s shelter system is ill-equipped to meet the long-term stability needs of homeless children and families living both in and outside of the City’s family shelters. In order to shed light on the shelter system as well as the extent of family homelessness by community, this section explores trends in the number of families in shelter, the location of family shelters overall and by shelter type across City Council districts, student homelessness by City Council district, and newly available data on shelter growth, type, and locations.
New Trends
- The number of families in hotel shelter units grew by 20% over an eighteen-month period from July 2014 to December 2015—an increase of almost 400 families—twice the rate of growth of Tier II units.
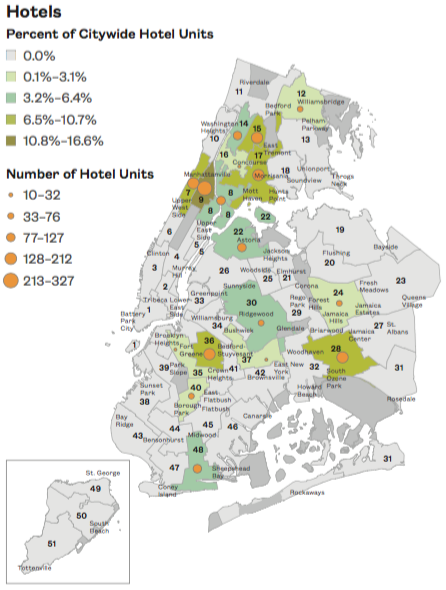
- City Council District 9 located in Central Harlem had the largest number of hotel shelter units and was among the six districts where the most common type of shelter was a hotel. (Districts 9, 22, 28, 30, 36, and 48)
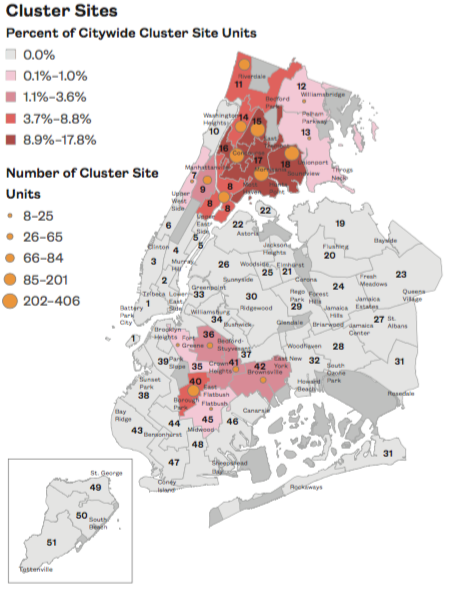
- Concourse and Highbridge in District 16 had the most cluster sites in New York City, as well as the largest number of total shelter units.
Key Findings
- Over two-thirds of people living in New York City’s shelter system—more than 44,000 people—were parents and their children. (December 2015)
- The seven City Council districts with the highest rates of student homelessness were East Harlem/Mott Haven, Central Harlem, Morris Heights, Belmont, Concourse, Hunts Point, and Bedford-Stuyvesant. (Districts 8, 9, 14, 15, 16, 17, and 36)
- While student data show that homeless children are in every New York City Council district, 17 City Council districts have no shelters for families with children.
Family Homelessness Remains High
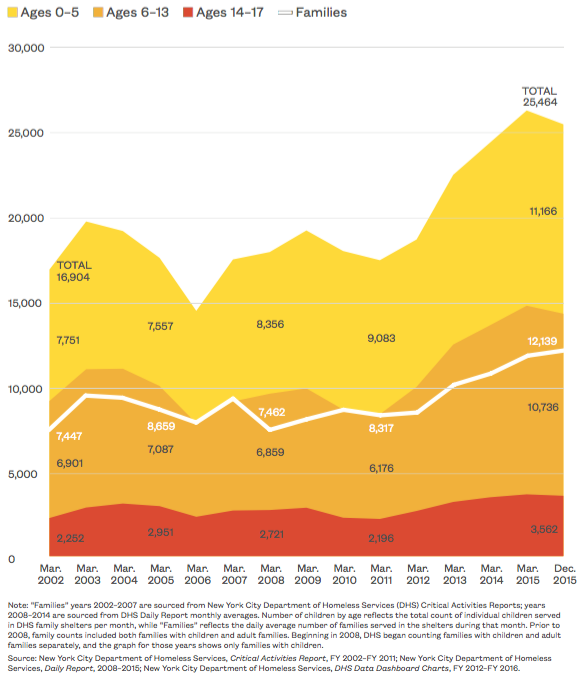
- Over 12,000 families, including more than 25,000 children, were living in New York City shelters in December 2015.
- The number of families with children in the City shelter system has increased by over 60% since March 2008.
- Children age five and under continue to make up the largest group of children living in family shelters. In December 2015, 44% of children were age five or younger.
Families and Children Living in New York City Shelters
March 2002–December 2015, by Month and Year
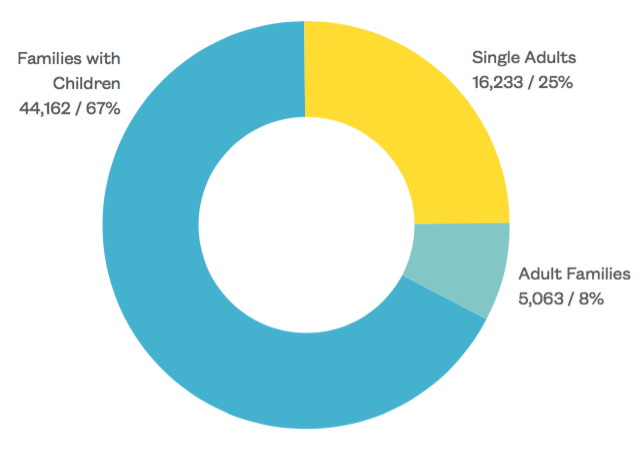
Parents and Children Are Largest Group in Shelter
- Over two-thirds of people living in New York City’s shelter system—more than 44,000 people—were parents and their children. (December 2015)
- Only one-quarter of homeless people living in shelter were single adults.
We know these already high shelter numbers do not tell the full story of homelessness in New York City. The 25,000 children in shelter are a fraction of the more than 100,000 school-age children across the city. As we weigh policy options to meet the needs of homeless families, how do we ensure we reach all families experiencing housing instability?
Individuals in Shelter, by Family Type
December 2015
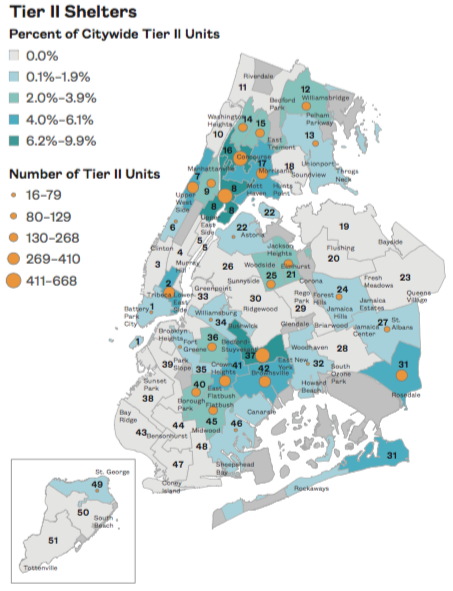
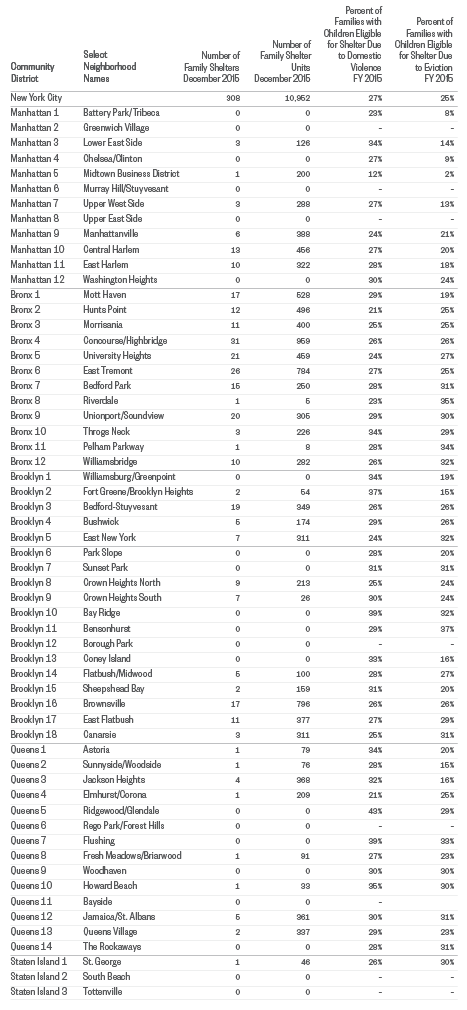
Locations of Family Shelters
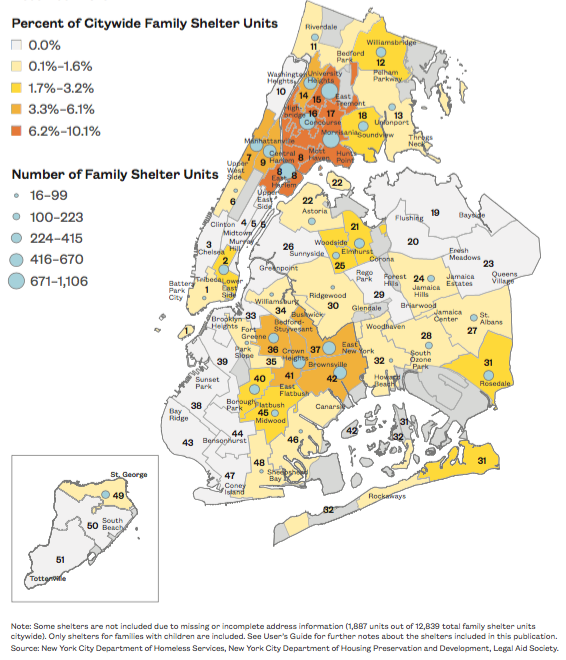
- Four City Council districts are home to 33% of the city’s entire family shelter capacity. These districts include East Harlem/Mott Haven, Belmont, Concourse, and Hunts Point. (Districts 8, 15, 16, and 17)
- While student data show that homeless children live in every NYC City Council district, 17 districts have no shelters for families with children.
The same neighborhoods come up in conversations about homelessness and poverty again and again. Is there a way to reimagine the family shelter as a true community resource?
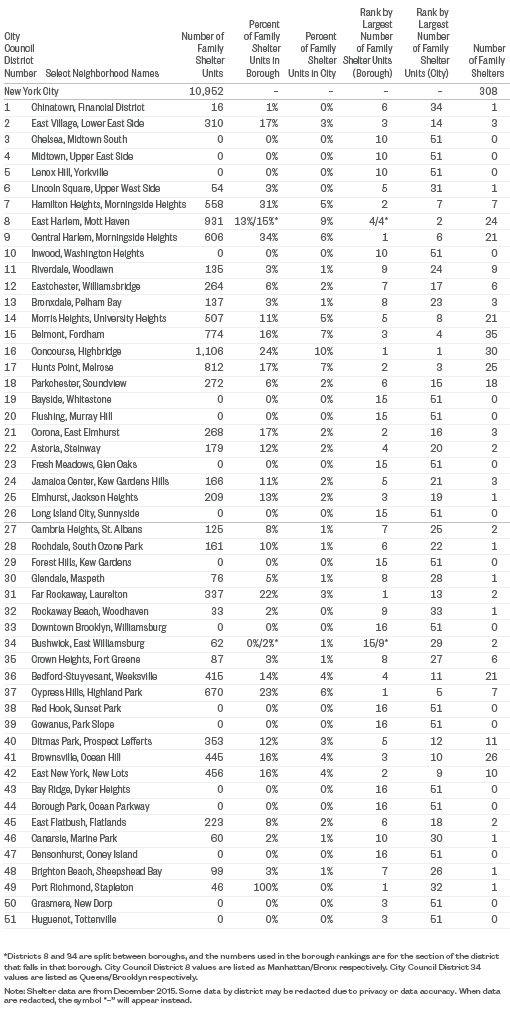
Where Are Family Shelters?
Percent and Number of Family Shelter Units, by City Council District
December 2015
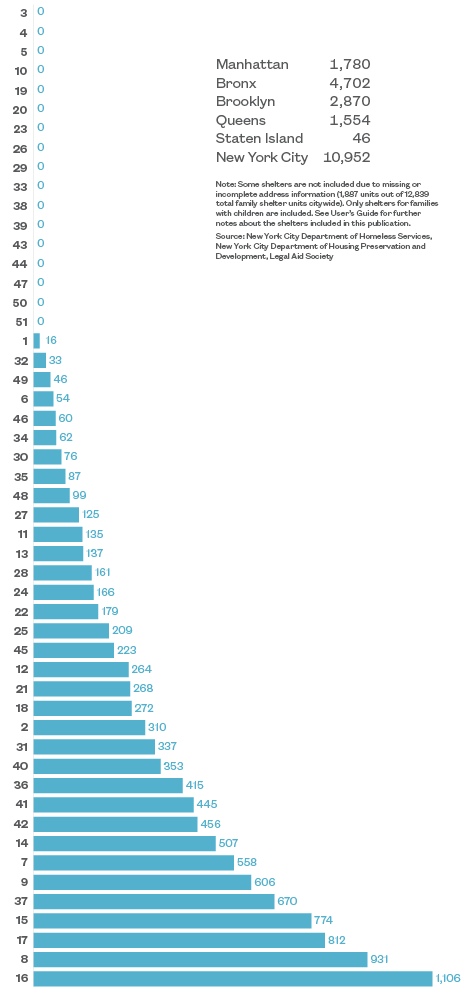
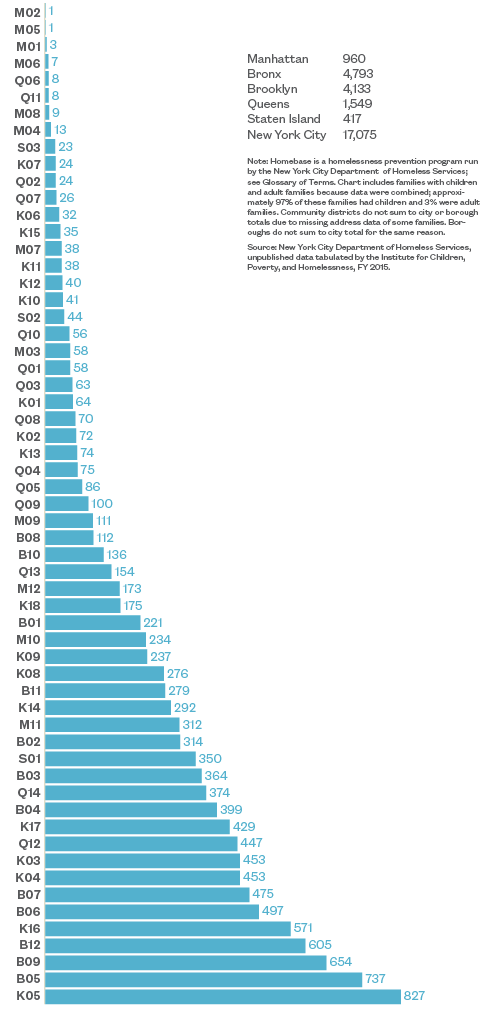
Where Are Family Shelters?
Number of Family Shelter Units, by City Council District
December 2015
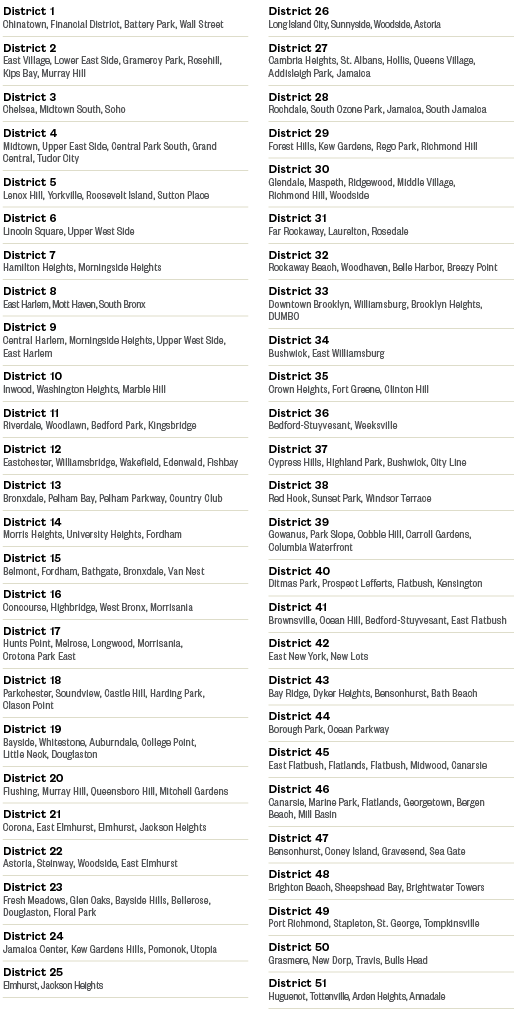
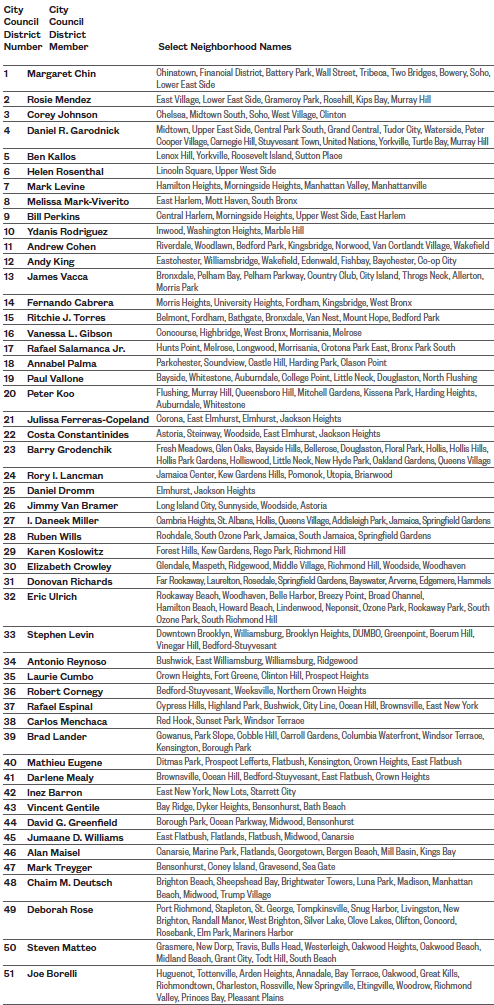
City Council Districts and Select Neighborhoods
Family Shelter Type Differs by Community
- The type of shelters available for families struggling with homelessness varies by City Council district.
- In the majority of City Council districts that had a family shelter, the most common type was a Tier II family shelter.
- City Council District 9 located in Central Harlem had the largest number of hotel shelter units and was among the six districts where the most common type of shelter was a hotel. (Districts 9, 22, 28, 30, 36, and 48)
- Concourse and Highbridge in District 16 had the most cluster sites in New York City, as well as the largest number of total shelter units.
- In three districts in the Bronx including Riverdale, Belmont, and Parkchester, cluster sites were the most common type of family shelter. (Districts 11, 15, and 18)
- Only areas of northern Manhattan, the Bronx, and central Brooklyn were home to all three types of shelters.
“My family and I have been in the Department of Homeless Services (DHS) on and off since 2006. For the last four years, my mother, two siblings and I have lived in two different shelters called cluster sites in the Bronx. The living conditions are horrible. I work two part-time jobs to ensure that they have food and clothes to go to school in and keep warm with. I attend college with the intention of breaking the cycle of poverty and homelessness in my community and family.”
—22-year-old, formerly
homeless college student
Family Homeless Shelters
Number and Type of Family Shelters and Units, by City Council District
December 2015
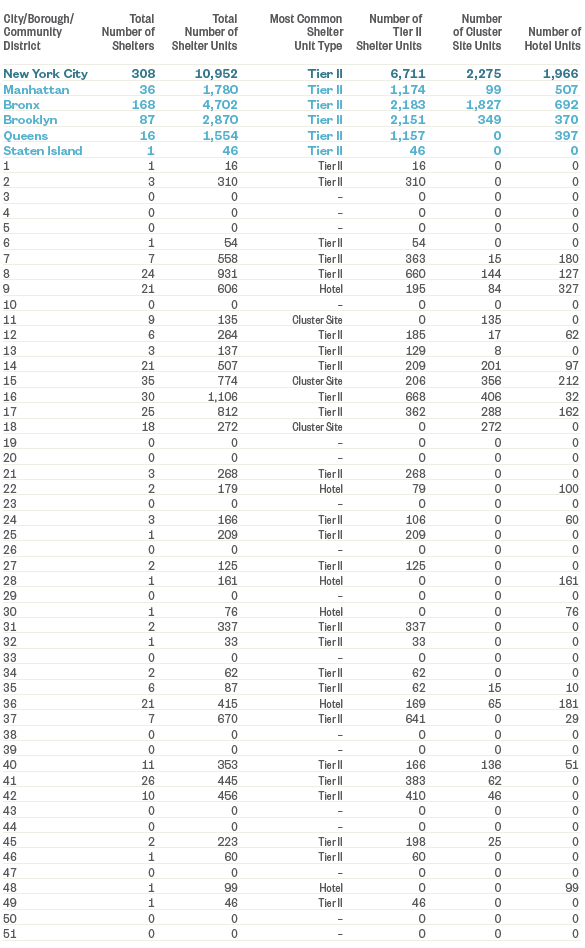
Note: Some shelters are not included due to missing or incomplete address information (1,887 units out of 12,839 total family shelter units citywide). Only shelters for families with children are included. See User’s Guide for further notes about the shelters included in this publication. Source: New York City Department of Homeless Services, New York City Department of Housing Preservation and Development, Legal Aid Society.
Family Homeless Shelters, by City Council District
Geographic Patterns of Family Shelter Units by Shelter Type
December 2015
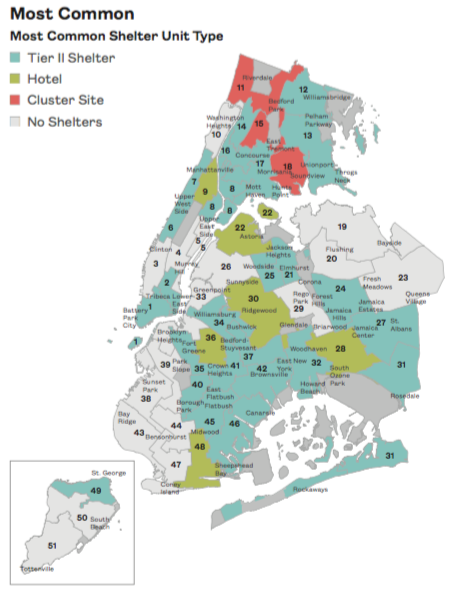
Note: Some shelters are not included due to missing or incomplete address information (1,887 units out of 12,839 total family shelter units citywide). Only shelters for families with children are included. See User’s Guide for further notes about the shelters included in this publication. Source: New York City Department of Homeless Services, New York City Department of Housing Preservation and Development, Legal Aid Society.
Note: Some shelters are not included due to missing or incomplete address information (1,887 units out of 12,839 total family shelter units citywide). Only shelters for families with children are included. See User’s Guide for further notes about the shelters included in this publication. Source: New York City Department of Homeless Services, New York City Department of Housing Preservation and Development, Legal Aid Society.
Hotel Use Is Growing
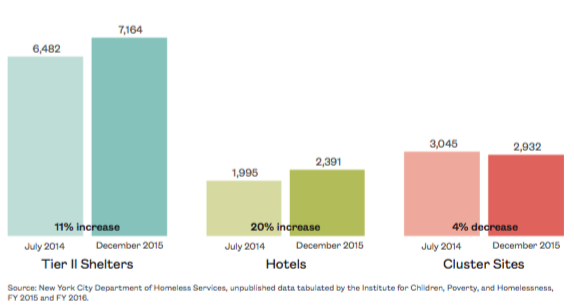
- The number of families in hotel shelter units grew by 20% over an eighteen-month period from July 2014 to December 2015— an increase of almost 400 families—twice the rate of growth of Tier II facilities.
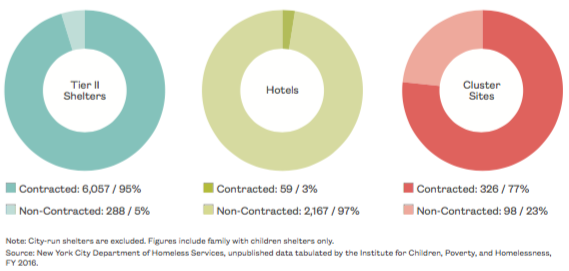
- Hotels are the least likely type of family shelters to have contracts with the City. Only 3% of all hotel shelters had contracts in December 2015. Non-contracted emergency shelters operate on a per-diem basis with the City, often lacking services available at other contracted sites.
Changes in Type of Shelter
Average Monthly Census by Family Shelter Type, with Percent Change
July 2014 and December 2015
City Shelter Contracts, by Shelter Type
Number of Family Shelter Units that Have Contracts with the New York City Department of Homeless Services
December 2015
Cluster Sites and Hotels Remain Common
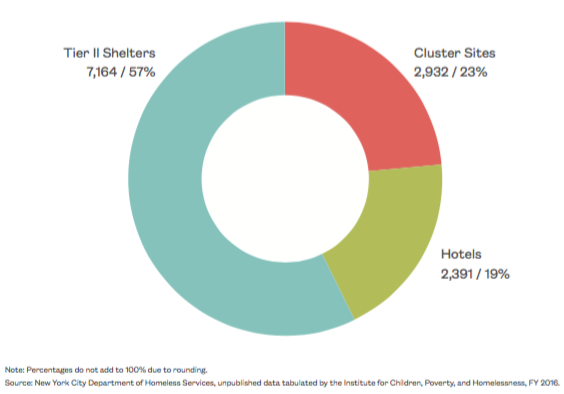
- More than 12,000 families with children lived in City shelter facilities during December 2015. Almost half (43%) lived in cluster sites or hotels.
Cluster site apartments and most hotels often lack the scale and scope of services for parents and children that are available through contracted Tier II shelters. With close to half of all families with children living in these settings, thousands of families are not receiving the assistance they need to end their homelessness.
What Type of Shelter Do Families Live In?
Average Census of Families with Children
December 2015
Risk of Homelessness by City Council District
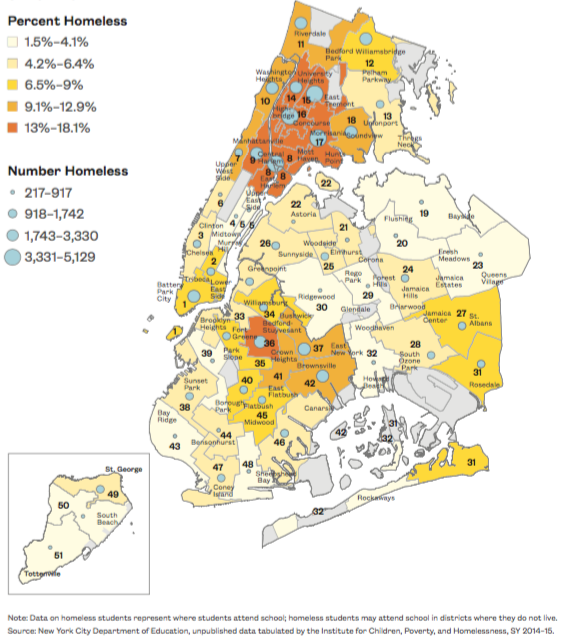
- The full extent of family homelessness in New York City is not represented by the number of families living in shelter. Over 80,000 homeless students attended New York City Public Schools in SY 2014–15. These students serve as a proxy for the larger number of families in the city experiencing homelessness.
- Homeless students attended schools in every New York City Council district; however, areas of the Bronx, central Brooklyn, and northern Manhattan saw the greatest concentrations.
- The seven City Council districts with the highest rates of student homelessness were East Harlem/Mott Haven, Central Harlem, Morris Heights, Belmont, Concourse, Hunts Point, and Bedford-Stuyvesant. (Districts 8, 9, 14, 15, 16, 17, and 36)
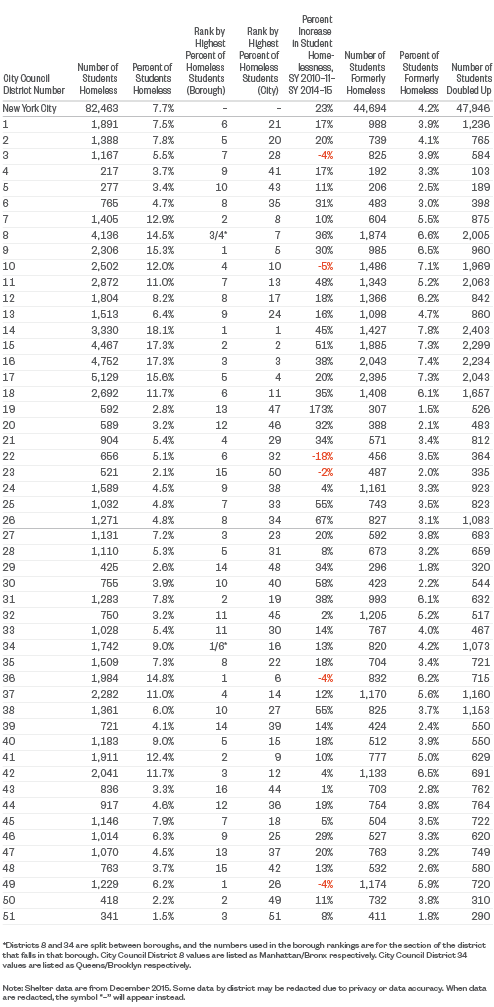
Where Are Homeless Students?
Percent and Number of Students Who Were Homeless, by City Council District
SY 2014–15
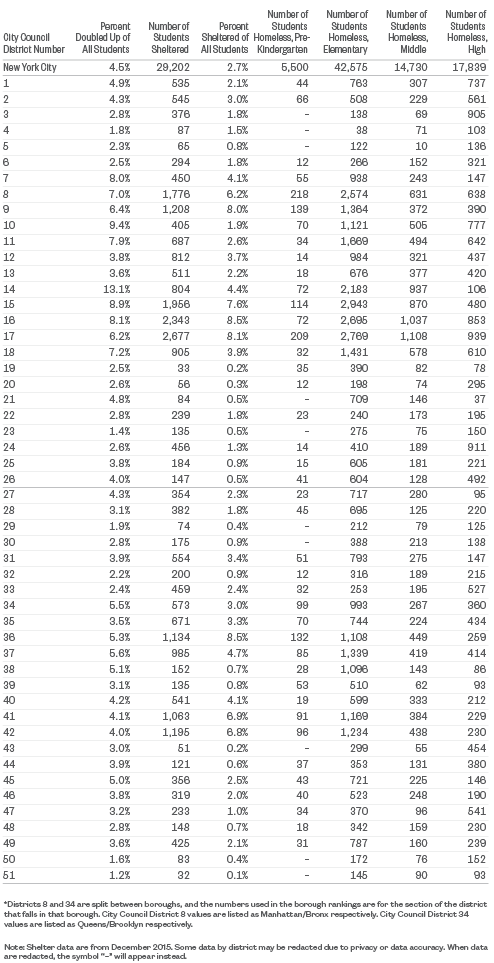
Where Are Homeless Students?
Student Homelessness, by City Council District
SY 2014–15
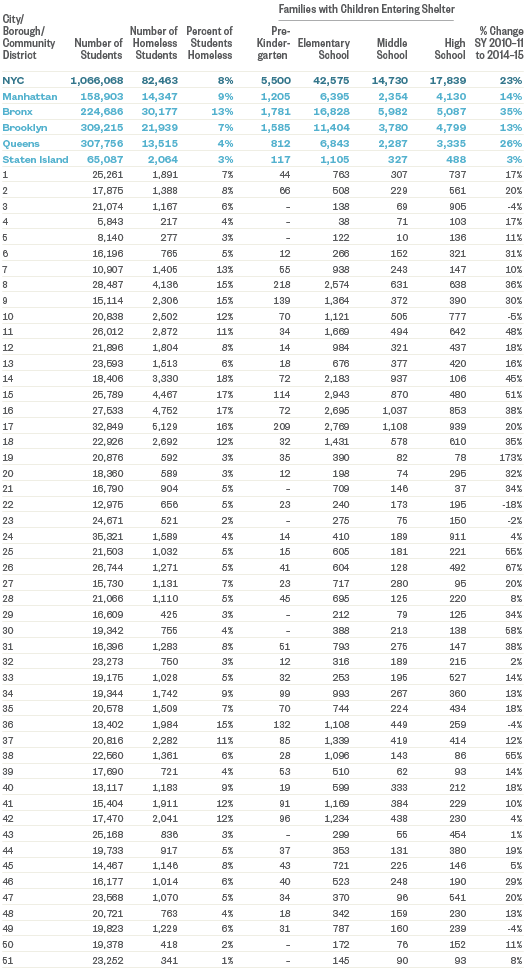
Note: The number of homeless students by grade does not add up to the total number of homeless students because of students whose grade level data are missing and are not counted in grades pre-K–12. In order to protect student privacy and adhere to the Federal Education Rights and Privacy Act, numbers that would display 10 or fewer homeless students were redacted. Data on homeless students represent where students attend school; homeless students may attend school in districts where they do not live. Source: New York City Department of Education, unpublished data tabulated by the Institute for Children, Poverty, and Homelessness, SY 2010–11 and SY 2014–15.
The Revolving Shelter Door
“They placed me in the shelter. I can only stay ten days if they say I am ineligible again, then I have to stay homeless for ten days and come back and do it over and over again. I will have to pack my bags, pregnant as I am, and drag it but I have no where to go. They want information from two or three years ago. My ID is from South Carolina. They told me that I have to have my Dad write a letter that he won’t let me go back and stay with him, but I can’t get my mail, he throws it out, I’ve been moving from place to place. How am I supposed to get the information they want? Just thinking about it makes me cry, it really hurts, and I don’t have anywhere to go.”
—21-year-old, homeless and pregnant
In just four and a half years, more than 99,000 applications for shelter in New York City were made by families with children, and over 35,000 families entered shelter—some more than once. Despite the relative stability of the City’s shelter census, the number of families with children entering the system continues to grow— increasing by 33% between FY 2012 and FY 2015. The information in this section describes the revolving door of the City’s shelter system with a focus on cycles of application and entry over time, differences in family shelter entry by community district, reasons for shelter exit, and the rate at which families with children are returning to shelter. It also highlights newly available data on the communities where the number of families with children entering shelter are growing, and the need to address return to shelter if the City is to see a long-term decline in its family shelter numbers.
New Trends
- The number of families with children entering City shelters grew by 33% from FY 2012 to FY 2015. More than one-quarter of this increase took place in just six of New York City’s 59 community districts. These neighborhoods included Mott Haven, Morrisania, East New York, Brownsville, East Flatbush, and East Harlem. (B01, B03, K05, K16, K17, and M11)
- Over half of families with children living in shelter applied multiple times before being deemed eligible to enter the system. Among families that did not get into shelter on their first application, over half had to apply three or more times before their application was accepted. (December 2015)
- One in five families with children who exited shelter without a housing subsidy returned to shelter within one year of their exit. In FY 2015 half of all families who exited the shelter system left with no form of housing subsidy.
Key Findings
- Only 2,500 of the close to 13,000 families living in shelter during the month of December 2015 were new to the shelter system. Roughly 10,000—over 80% of all families living in shelter—had entered shelter for the first time prior to 2015.
- The family shelter entry rate was two to three times the citywide average in the south and west Bronx, East New York, and Bedford-Stuyvesant. (B01/B02, B03/B06, B04, B05, K03, and K05)
- Among families who were found eligible for shelter, domestic violence continued to be the leading driver of homelessness. In FY 2015, 27% of families with children in shelters entered due to domestic violence.
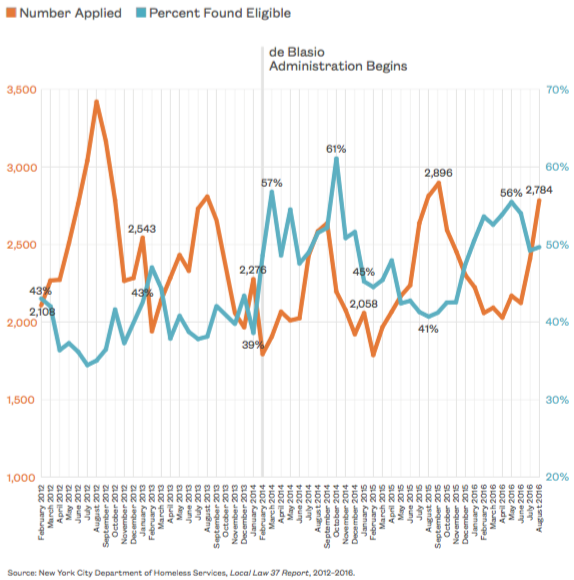
Applications and Eligibility Rate in New York City
- Since January 2014 the number of families applying to shelter each month ranged from a low of roughly 1,800 to a high of 2,900.
- At the same time the monthly eligibility rate fluctuated by 22 percentage points, declining as the number of applicants in- creased. This variation possibly underscores the lack of capacity in the City’s family shelters, which can usually only take in new families as others exit the system.
- Monthly family shelter applications continue to peak seasonally in the summer and early fall—a pattern that may highlight parents’ attempts to minimize disruption in their children’s educations.
How can service providers and City agencies better anticipate these fluctuations to improve support for families before they even apply for shelter?
Family Shelter Applications and Eligibility Rate in New York City
Number of Families with Children Applying for Shelter and Percent of Applications Found Eligible
2012–2016, by Month
First-Time Homeless Are Smallest Proportion of Families in Shelter
- Just 19% of families living in shelter during December 2015 were newly homeless, entering for the first time in the same calendar year.
- Roughly 10,000—over 80% of all families living in shelter during December 2015— were not new to the system and had entered shelter for the first time in a prior year.
- Growth in the number of families living in shelter in New York City is driven primarily by families returning to the shelter system, not those who are newly homeless.
More needs to be done both during a family’s shelter stay and after exit to ensure that families leaving shelter are able to remain stably housed.
First Date of Entry into the New York City Shelter System
Number and Percent of Families with Children Living in Shelters During December 2015, by Year of First Ever Entry into the New York City Shelter System
The Revolving Door
- From FY 2014 to FY 2015 the number of families immediately returning to shelter within 30 days of exit doubled—increasing by more than 1,000 families.
- Over 500 families exited the shelter system due to 48-hour curfew violations in FY 2015, an increase of 45% from the prior year. With the growing use of hotel placements that lack contracted social services and oversight, families may be at greater risk of losing shelter placement due to family or medical needs, only to immediately return to shelter.
This high rate of immediate return calls into question the permanency of shelter exits.
Immediate Return to Shelter
Number and Percent of Families with Children Eligible for Shelter Due to Immediate Return
FY 2012–FY 2015
Return to Shelter Remains High
- In FY 2016 one out of every ten families with children who exited shelter returned within one year of leaving.
- While this rate of rapid return to shelter saw a decline from 16.5% in FY 2015 to 10% in FY 2016, the rate remained over twice as high as it was just four years prior when only 4.4% of families returned to shelter within one year of their exit.
- Among families with children who exited shelter without a housing subsidy, the rate of rapid return (within one year) was much higher. One in five families exiting shelter without housing assistance returned to the system within one year of exit.
What happens when short-term housing subsidies run out? With data tracking on families’ return to shelter ending after one year, a better understanding of what drives families to return to shelter is needed.
Return to Shelter Rate in New York City
Percent of Families with Children that Returned to Shelter Within One Year
FY 2005–FY 2016
Multiple Applications Required
- Over half (51%) of families with children in shelter had to apply multiple times before being deemed eligible to enter the system. Among families that did not get into shelter on their first application, over half had to apply three or more times before being granted entry.
- A full 29% of families living in shelter in December 2015 submitted three or more applications before being found eligible.
Streamlining the application process so family eligibility is determined more efficiently would lessen trauma for children and would improve educational outcomes by reducing school absences.
Families Must Apply Multiple Times
Number of Shelter Applications Submitted by Families with Children Found Eligible for Shelter
December 2015
Missing Information
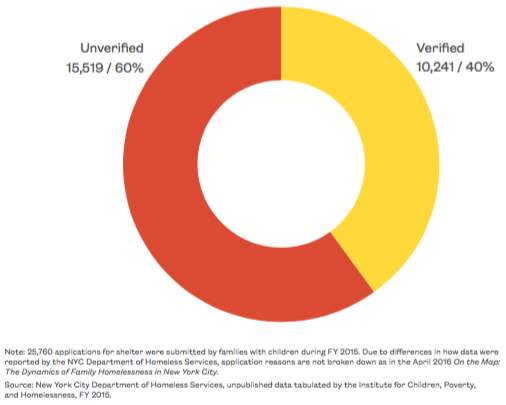
- In FY 2015 there were roughly 25,000 applications for shelter made by families with children. For almost two-thirds (60%), the applicants were unable to document their need for shelter (leaving their application unverified).
- For these applicants whose need for shelter was not verified by the NYC Department of Homeless Services, no information on their reason for applying to shelter was available, nor on what prevented verification.
This highlights why so many families must apply for shelter more than once before gaining entry. Tracking this type of information and maintaining transparency could o er tools for improving the shelter application process in a way that reduces negative consequences and costs for both families and the City.
Unverified Shelter Applications
Number and Percent of Shelter Applications from Families with Children with Unverified Reason for Homelessness
FY 2015
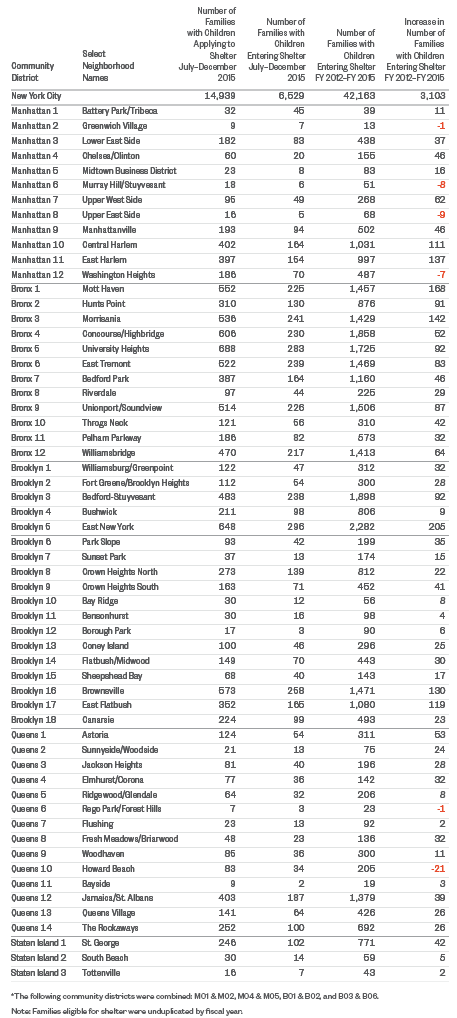
Communities Where Families Lived Before Entering Shelter
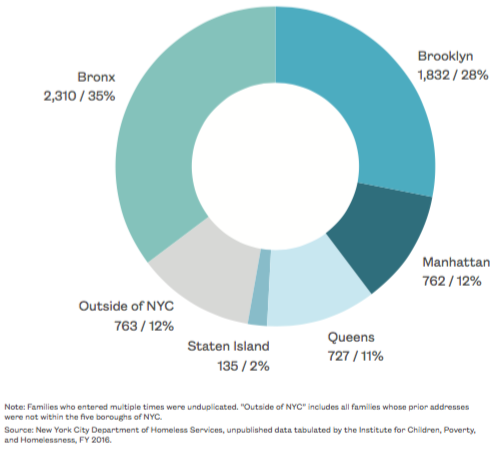
- Just over 6,500 families with children were found eligible for shelter of the 15,000 applications submitted during the last six months of 2015.
- The Bronx saw more families entering shelter than any other borough. Over one-third of all shelter entrants came from the Bronx—or more than 2,300 families in just the last six months of 2015.
- Seven of the top ten community districts for shelter entry were located in the Bronx, and three in Brooklyn. These included the Bronx neighborhoods of Mott Haven, Morrisania, Concourse/Highbridge, University Heights, East Tremont, Unionport/Soundview, and Williamsbridge, and the Brooklyn neighborhoods of Bedford-Stuyvesant, East New York, and Brownsville. (B01, B03–B06, B09, B12, K03, K05, and K16)
Families Found Eligible to Enter Shelter by Borough
Number and Percent of Families with Children Entering Shelter
July–December 2015
Family Applications and Eligibility for Shelter
Number of Homeless Families with Children Applying for and Entering Shelter, by Community District
July–December 2015
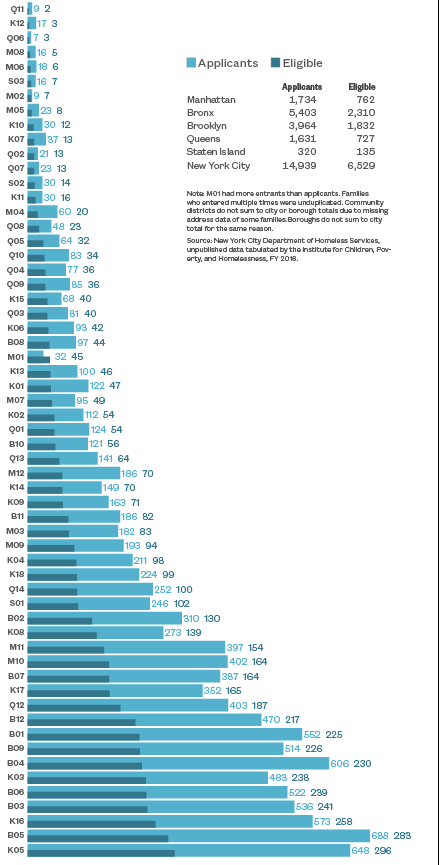
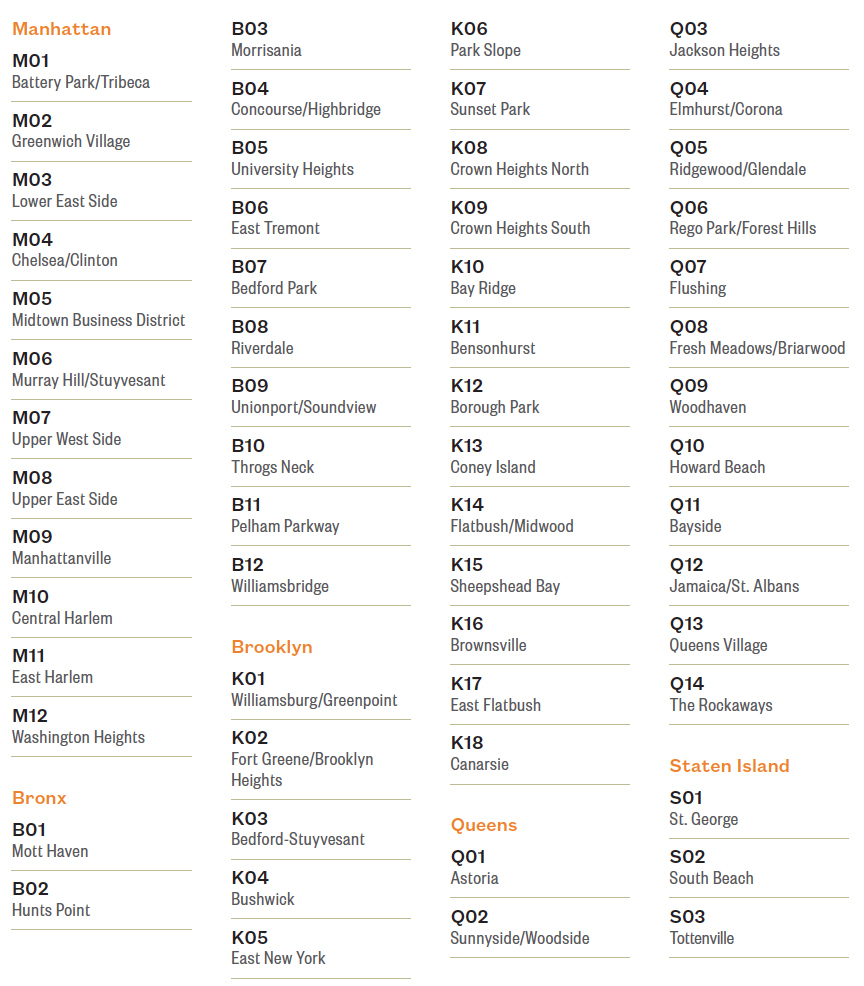
Community Districts and Select Neighborhoods
Where Are Families Most at Risk for Entering Shelter?
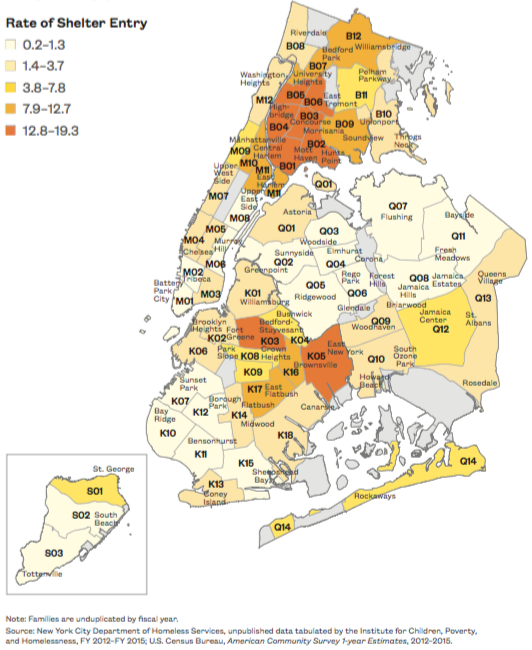
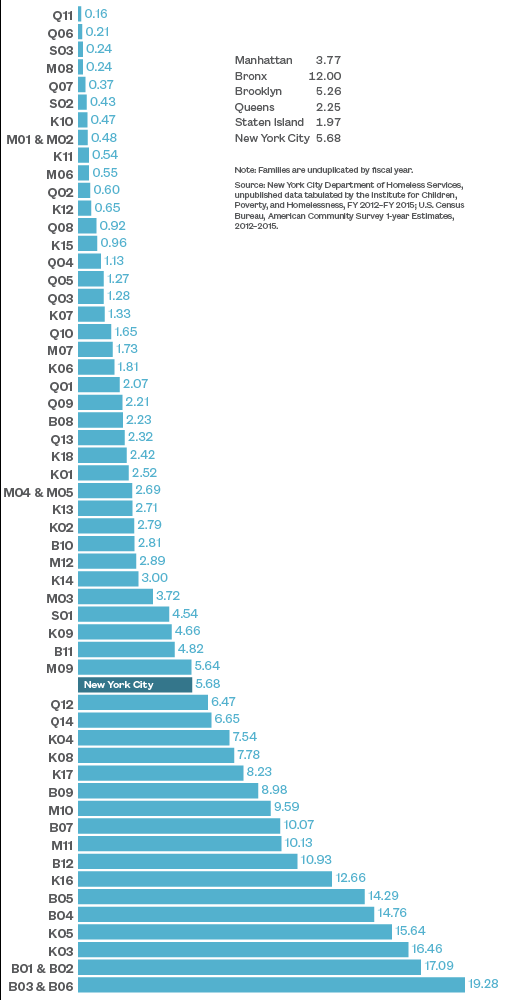
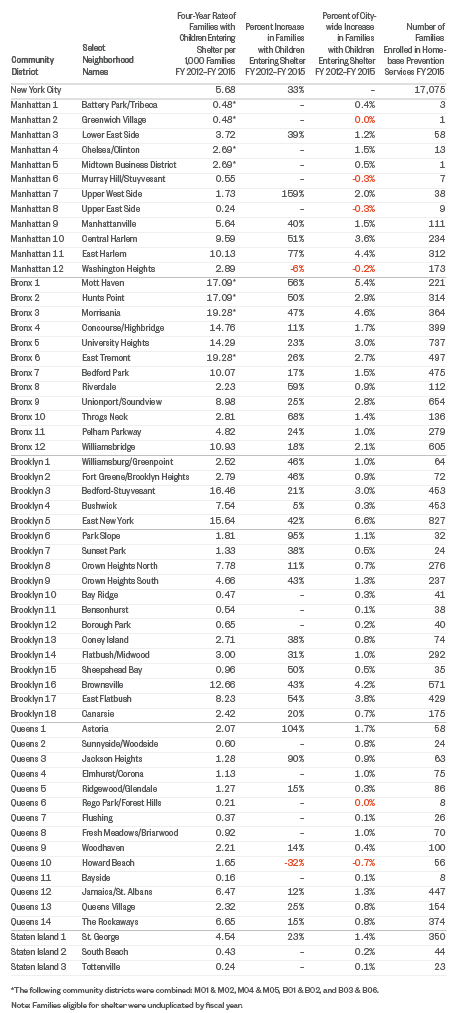
- The overall annual rate of family shelter entry in New York City was 5.7 per 1,000 families between FY 2012 and FY 2015. However, the rate varied greatly by community district, ranging from a low of 0.2 per 1,000 families in Bayside in Queens to a high of 19.3 per 1,000 families in Morrisania and East Tremont in the Bronx. (Q11 and B03/B06)
- In the south and west Bronx, East New York, and Bedford-Stuyvesant, the family shelter entry rate was two to three times the citywide average. (B01/B02, B03/B06, B04, B05, K03, and K05)
Taking the total population of each community district into account and calculating the shelter entry rate per 1,000 families allows for a more accurate comparison across communities. It also highlights communities whose shelter entry numbers are lower but are significantly affected by homelessness.
Where Families Lived Prior to Shelter
Four-Year Rate of Families with Children Entering Shelter per 1,000 Families, by Community District
FY 2012–FY 2015
Where Families Lived Prior to Shelter
Four-Year Rate of Families with Children Entering Shelter per 1,000 Families, by Community District
FY 2012–FY 2015
Community Districts and Select Neighborhoods
Where Is Homelessness Growing?
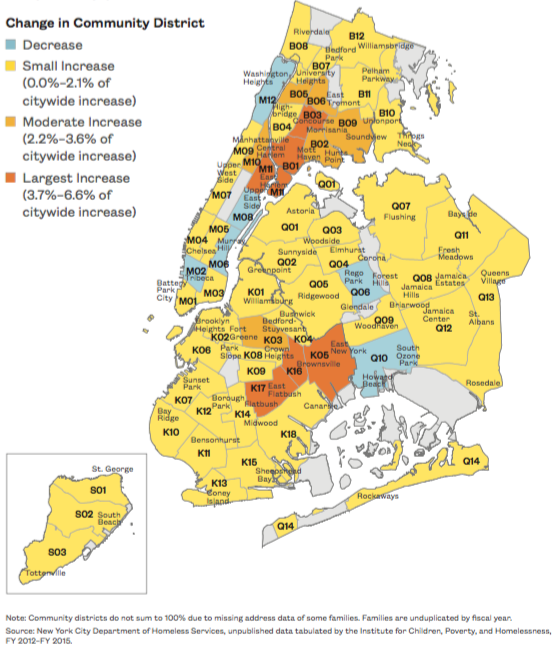
- The number of families with children entering City shelters grew by 33% from FY 2012 to FY 2015. This growth was not even across neighborhoods, with some community districts seeing a decline in family shelter entry while others saw large increases.
- More than one-quarter of the citywide increase in family shelter entry between FY 2012 and FY 2015 took place in just six of New York City’s 59 community districts. These neighborhoods included Mott Haven, Morrisania, East New York, Brownsville, East Flatbush, and East Harlem. (B01, B03, K05, K16, K17, and M11)
Examining patterns of growth in shelter entry provides insight into where housing instability is an increasing problem, even if the community is not among one of the top neighborhoods for families entering shelter.
Where Is Homelessness Growing?
Distribution of Citywide Increase in Families with Children Entering Shelter, by Community District
FY 2012–FY 2015
Where Is Homelessness Growing?
Families with Children Entering Shelter, by Community District
FY 2012–FY 2015
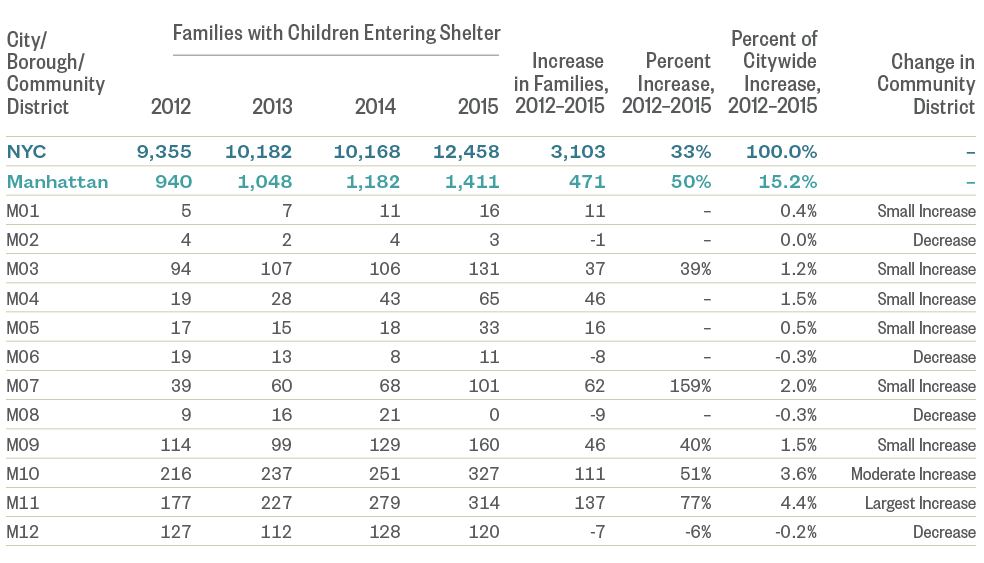
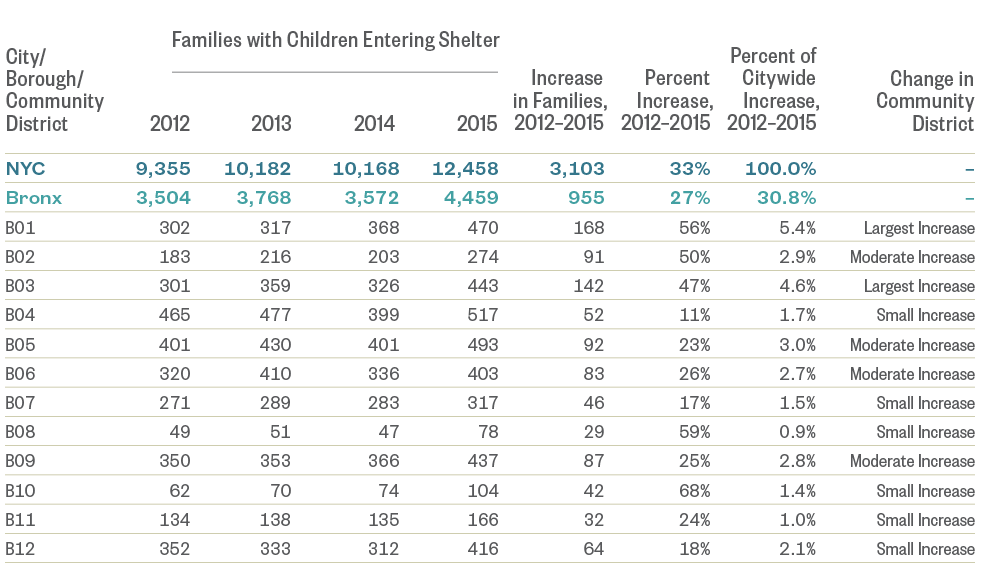
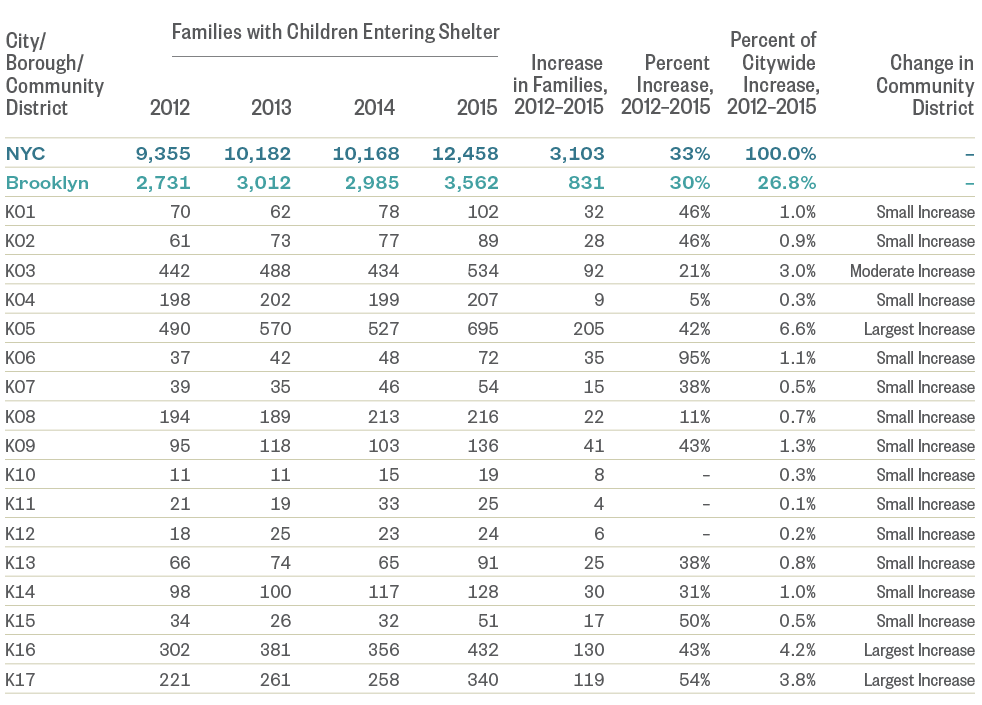
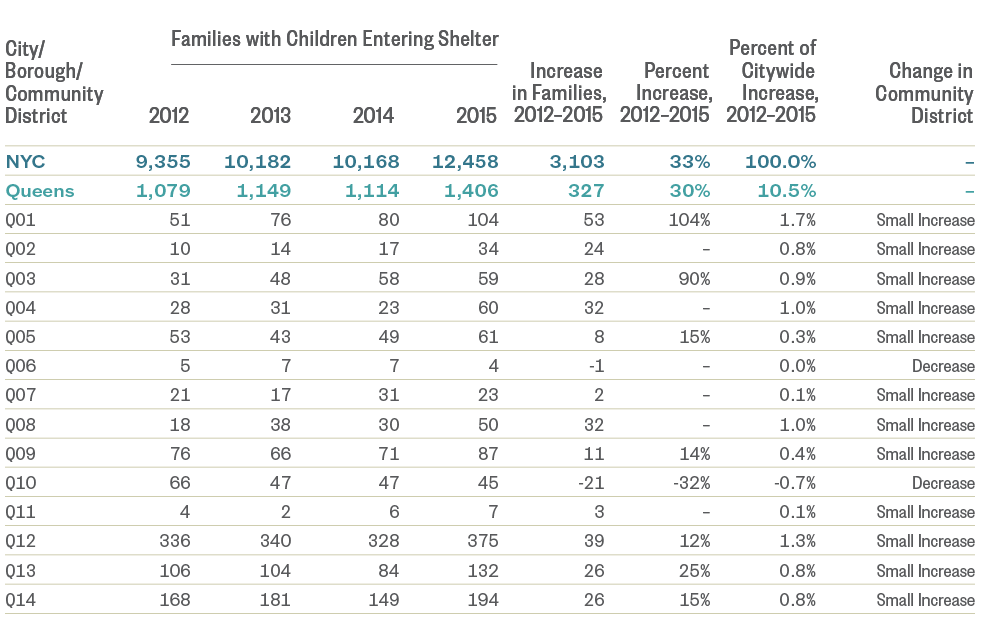
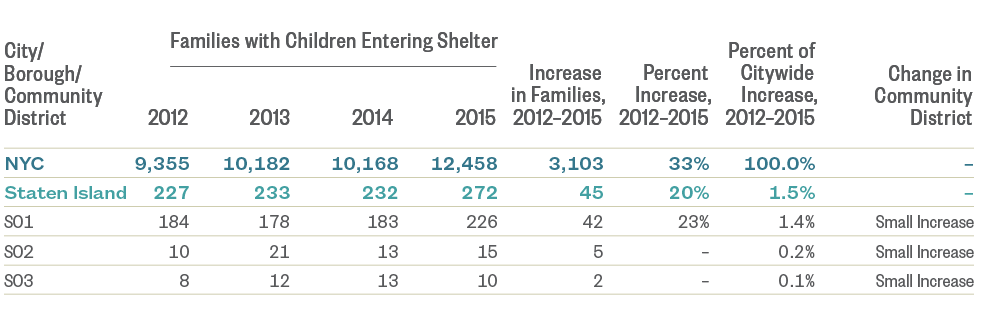
Note: Community districts do not sum to city or borough totals due to missing address data of some families. Boroughs do not sum to city total for the same reason. “Percent Increase” column was redacted for data accuracy if the number of families entering shelter in 2012 was fewer than 30. Families are unduplicated by fiscal year. Source: New York City Department of Homeless Services, unpublished data tabulated by the Institute for Children, Poverty, and Homelessness, FY 2012–FY 2015.
Drivers of Shelter Entry
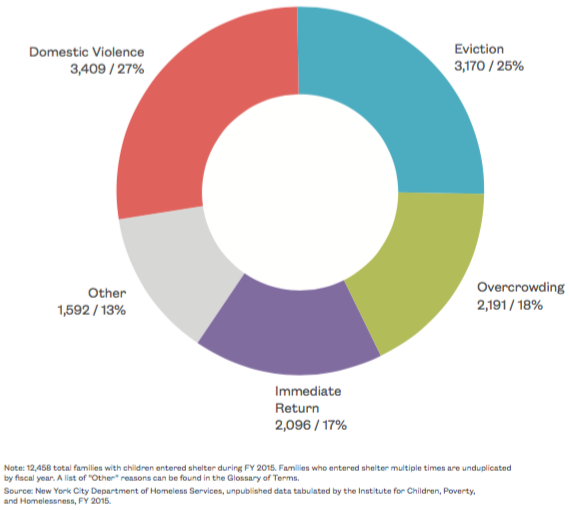
- Among families who were found eligible for shelter, domestic violence continued to be the leading driver of homelessness. In FY 2015, 27% of families with children in shelter entered due to domestic violence.
- The other top reasons for shelter entry among families with children were eviction (25%), overcrowding (18%), and immediately returning to shelter within 30 days of exit (17%).
Why Do Families Enter Shelter?
Number and Percent of Families with Children Found Eligible for Shelter, by Primary Reason for Eligibility
FY 2015
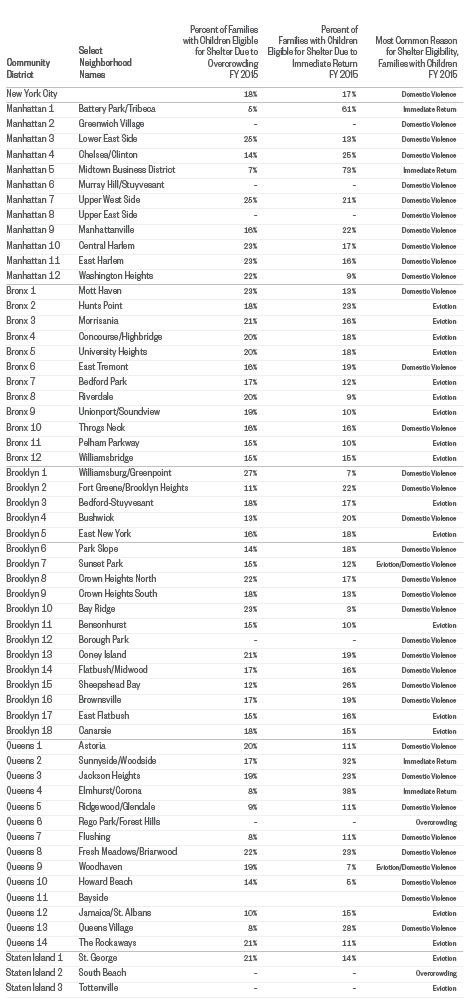
Geographic Differences in Reason for Shelter Entry
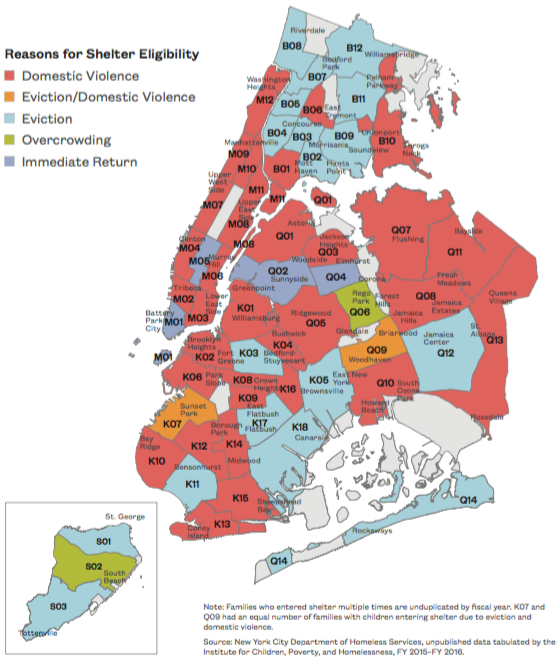
- The leading factor driving shelter entry in New York City differed by community, highlighting the need to tailor interventions aimed at reducing housing instability.
- Domestic violence was the most common reason for shelter entry in 33 communities, with an additional two neighborhoods where domestic violence and eviction were equally common.
- Eviction was the leading cause for shelter entry in 18 communities, while families immediately returning to shelter was the most common reason in four neighborhoods (Tribeca, Midtown, Sunnyside/Woodside, Elmhurst/Corona) and overcrowding was the most common reason in two neighborhoods (Rego Park/Forest Hills and South Beach). (M01, M05, Q02, Q04, Q06, and S02)
Most Common Reason for Shelter Eligibility
Most Common Reason Families with Children Were Found Eligible to Enter Shelter, by Community District
July 2014–December 2015
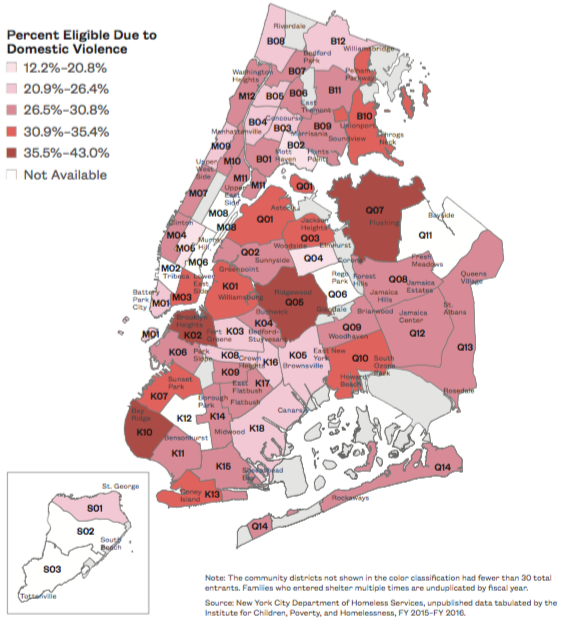
The Local Nature of Domestic Violence as a Driver of Shelter Entry
- Domestic violence was a significant contributor to family shelter entry across the city, representing at least 12% of shelter entrants from every community with available data.
- Four communities saw particularly high rates of domestic violence-driven shelter entry, accounting for 36%–43% of all entrants. These communities included the neighborhoods of Fort Greene/Brooklyn Heights, BayRidge, Ridgewood/Glendale, and Flushing. (K02, K10, Q05, and Q07)
Domestic Violence as a Reason for Shelter Eligibility
Percent of Families with Children Eligible for Shelter Due to Domestic Violence, by Community District
July 2014–December 2015
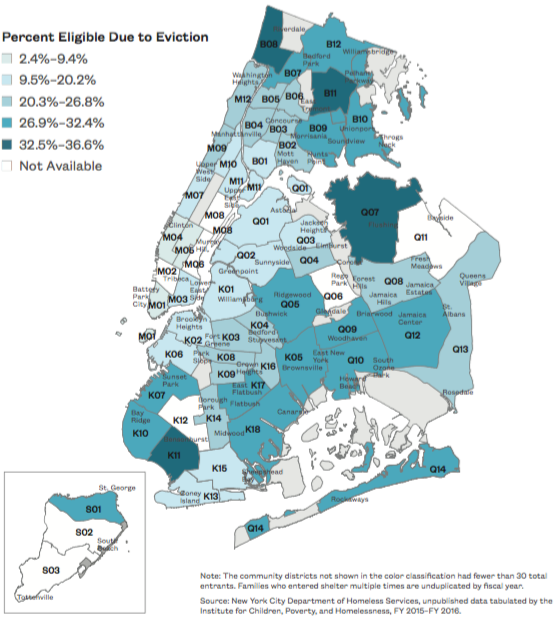
The Local Nature of Eviction as a Driver of Shelter Entry
- Eviction was the second leading driver of family shelter entry citywide, accounting for 25% of families with children entering the City shelter system overall. This ranged widely by community district from 2% in Midtown Manhattan to 37% in Bensonhurst in Brooklyn. (M05 and K11)
- The top four neighborhoods where eviction drove one-third or more of family shelter entry were Riverdale and Pelham Parkway in the Bronx, Bensonhurst in Brooklyn, and Flushing in Queens. (B08, B11, K11, and Q07)
Eviction as a Reason for Shelter Eligibility
Percent of Families with Children Eligible for Shelter Due to Eviction, by Community District
July 2014–December 2015
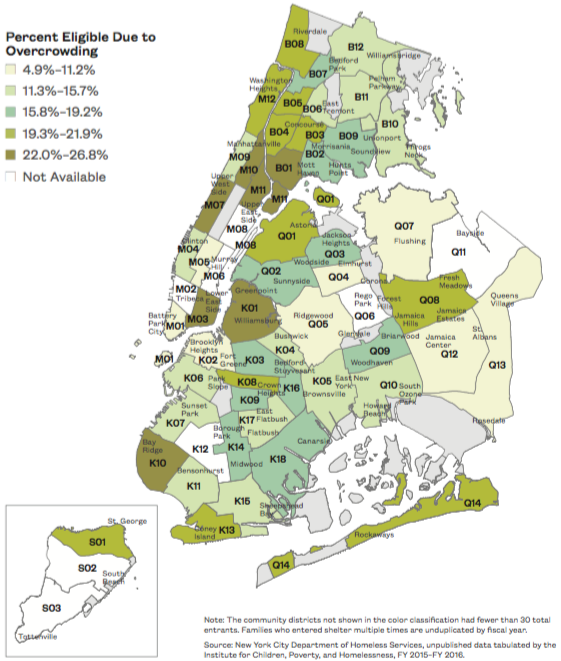
The Local Nature of Overcrowding as a Driver of Shelter Entry
- While less prevalent as a reason for shelter entry than either domestic violence or eviction, overcrowding contributed significantly to family shelter entry, representing 18% of entrants citywide. By neighborhood overcrowding accounted for a low of 5% of entrants in Tribeca to a high of 27% of entrants in Williamsburg/Greenpoint. (M01 and K01)
- In seven communities between 22% and 27% of families with children entered shelter due to overcrowding. These neighborhoods included Mott Haven, Williamsburg/Greenpoint, Bay Ridge, Lower East Side, Upper West Side, Central Harlem, and East Harlem. (B01, K01, K10, M03, M07, M10, and M11)
Overcrowding as a Reason for Shelter Eligibility
Percent of Families with Children Eligible for Shelter Due to Overcrowding, by Community District
July 2014–December 2015
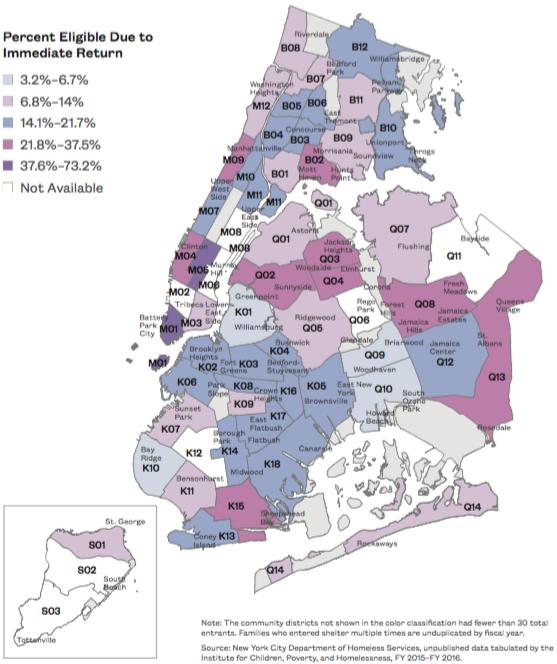
The Local Nature of Immediate Return as a Driver of Shelter Entry
- Citywide, more than one in every six (17%) families entering shelter were immediately returning to the system within 30 days of exiting.
- Entry due to immediate return ranged dramatically by community district, from a low of 3% in Bay Ridge in Brooklyn to a high of three in every four families (73%) in Midtown Manhattan. (K10 and M05)
Understanding what is placing families in some communities at greater risk for returning to the shelter system so quickly is critical to effectively plan for family exit from shelter. When families are forced to quickly return to the shelter system, it is both costly to the City and detrimental to the well-being of families and children.
Immediate Return as a Reason for Shelter Eligibility
Percent of Families with Children Eligible for Shelter Due to Immediate Return, by Community District
July 2014–December 2015
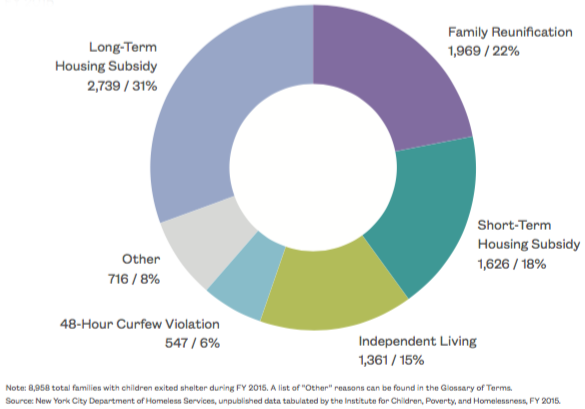
Little Support After Exit
- Close to 9,000 families exited the shelter system in FY 2015. Roughly half of these families left shelter with some form of housing subsidy or rental assistance—31% with a long-term housing subsidy (such as NYCHA) and 18% with a short-term subsidy (ranging from one-time rental assistance to a five-year subsidy).
- The remaining families who left the shelter system exited due to family reunification (22%), independent living (15%), 48-hour curfew violations (6%), or other reasons (8%).
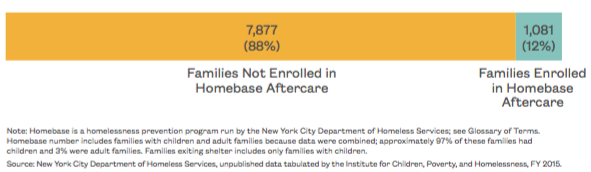
- Only 1,000 families—or just 12% of all families who exited shelter in FY 2015—were enrolled in aftercare services through Homebase that same year.
Given that 80% of families in the shelter system are not new to shelter, addressing this aftercare gap is critical to improving long-term stability.
Why Do Families Exit Shelter?
Number and Percent of Families with Children Exiting Homeless Shelters, by Exit Reason
FY 2015
Support After Exiting Shelter
Comparison of Number of Families Exiting Homeless Shelters and Number of Families Receiving Aftercare Services
FY 2015
Neighborhood Dynamics and Housing Instability
“My mother had my older sister when she was 17—she had to drop out of school. She got a GED and she attended a college but they never sent her degree. It was a constant blow.”
—20-year-old college student,
repeatedly homeless since 2006
The factors driving housing instability and homelessness in New York City go far beyond housing. This reality is underscored by the fact that one in five residents lacks a high school diploma and a growing number of families across the city are working in low-wage industries, struggling to make ends meet. In order to highlight the intersection of these economic pressures as well as opportunities to tailor interventions to local needs, this section uses U.S. Census, housing, and community resource data to highlight geographic factors driving housing instability across New York City as well as patterns in existing resources that present opportunities to increase community stability. Maps are shown at the City Council district level along with figures highlighting either overarching trends in the data or where each City Council district ranks in comparison to other districts.
New Trends
- Since 2005 over 13,000 units with affordability restrictions have been lost citywide. In the next five years close to 110,000 more units are at risk for ending their affordability requirements.
- In the south and west Bronx, upper Manhattan, and south and central Brooklyn, over 40% of single mothers with young children were living in poverty. Single mothers with young children living in poverty face the greatest risk of homelessness in New York City.
- The Bronx is home to 43% of all family shelter units but has only 21% of the City’s Adult and Continuing Education centers. Ensuring that homeless families can access infrastructure to address adult education needs is critical to long-term family and housing stability.
Key Findings
- In eight City Council districts, over 30% of adults had less than a high school degree and 51% of workers were employed in low-wage occupations. These districts included the neighborhoods of East Harlem/Mott Haven, Morris Heights, Belmont, Concourse, Hunts Point, Corona, Cypress Hills, and Red Hook. (Districts 8, 14, 15, 16, 17, 21, 37, and 38)
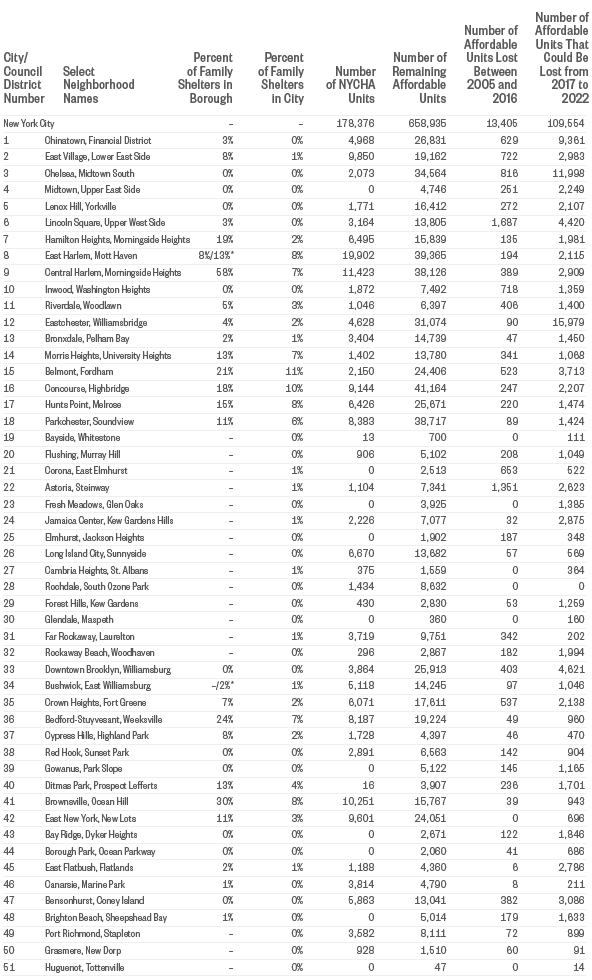
Neighborhoods Slated to Lose Affordable Housing
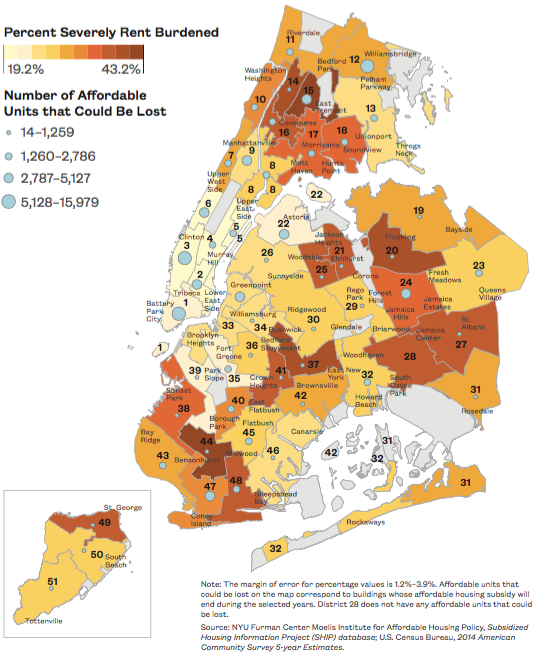
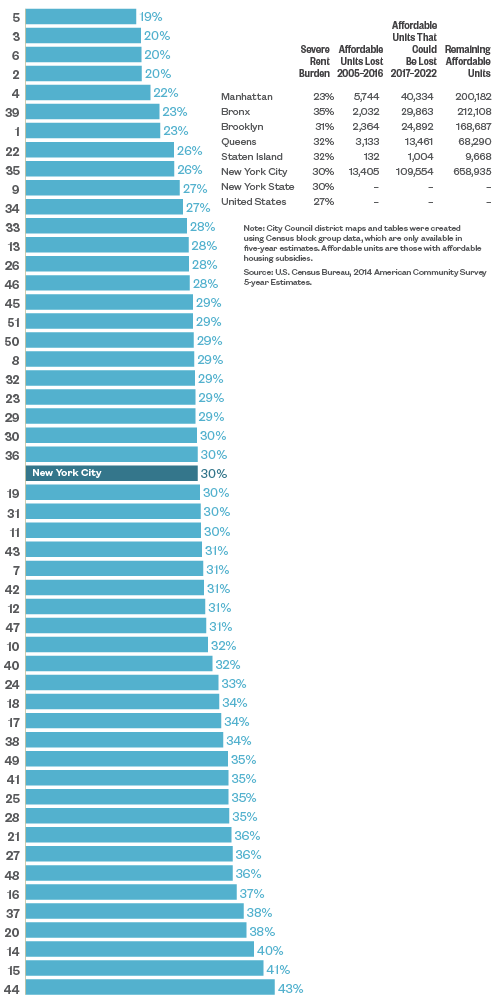
- Severe rent burden and loss of affordable housing are increasing the pressure on families already struggling with housing instability. Since 2005 over 13,000 units with affordability restrictions have been lost citywide. In the next five years close to 110,000 more units are at risk for ending their affordability clauses.
- The top five City Council districts for severe rent burden were in the Morris Heights and Belmont areas of the Bronx, Flushing in Queens, and Cypress Hills and Borough Park in Brooklyn. (Districts 14, 15, 20, 37, and 44)
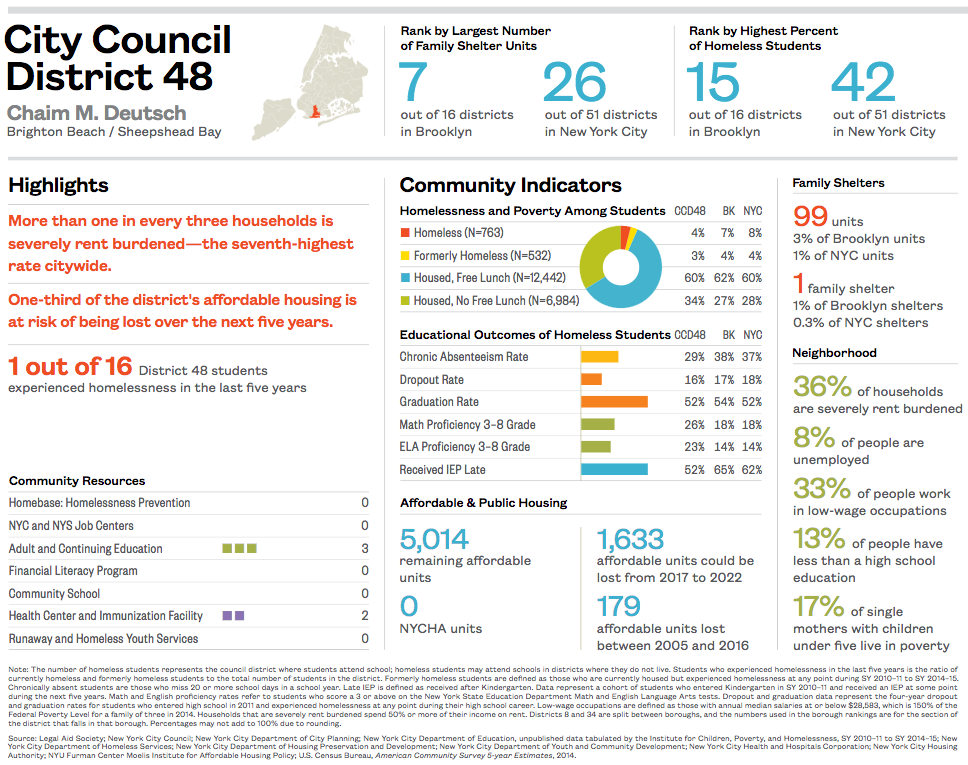
- At particularly high risk are those areas of the city with higher than average rent burden where many affordable units could be lost over the next five years. These included Belmont in the Bronx, Jamaica Center in Queens, and Bensonhurst in Brooklyn. (Districts 15, 24, and 47)
Affordable and low-income housing are not always the same. These losses likely underestimate the true decline in low-cost housing that is needed by families on the edge of homelessness.
Severe Rent Burden and Disappearing Affordable Units
Percent of Households Spending 50% or More of Income on Rent and Number of Affordable Units that Could Be Lost from 2017 to 2022, by City Council District
2010–2014 5-year Estimate
Severe Rent Burden
Percent of Households Spending 50% or More of Income on Rent, by City Council District
2010–2014 5-year Estimate
Community Districts and Select Neighborhoods
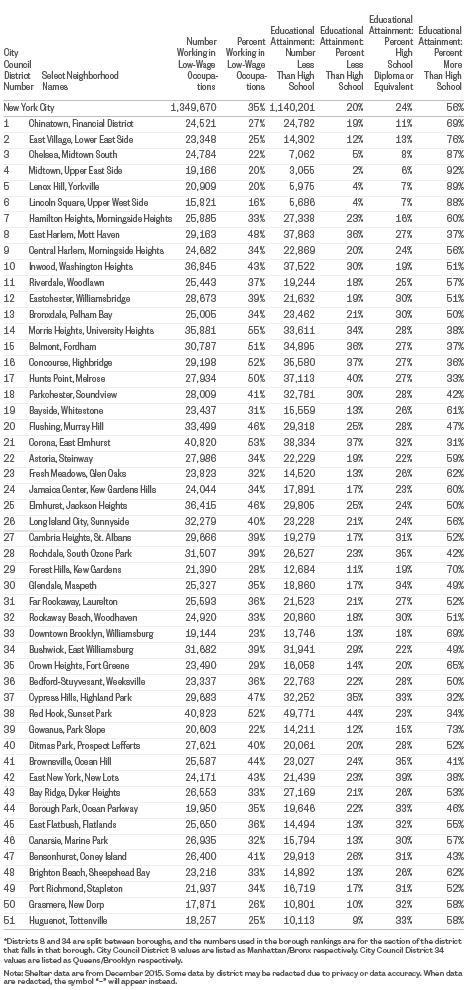
Why Education Matters
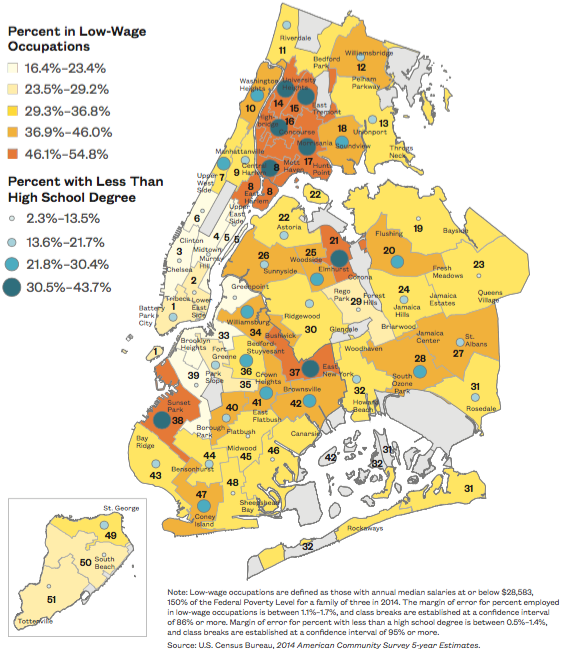
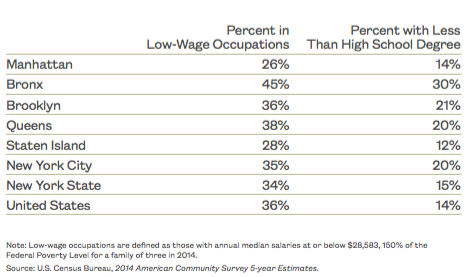
- In eight City Council districts, over 30% of adults had less than a high school degree. These included the neighborhoods of East Harlem/Mott Haven, Morris Heights, Belmont, Concourse, Hunts Point, Corona, Cypress Hills, and Red Hook. (Districts8,14,15, 16, 17, 21, 37, and 38)
- In these eight neighborhoods with the lowest educational attainment combined, over half (51%) of workers were employed in low-wage occupations.
Low-wage work and incomplete educations place families at risk for housing instability. Addressing the educational and employment needs of families in New York City is critical to reducing homelessness.
Low-Wage Occupations and Educational Attainment
Percent of Employed People Working in Low-Wage Occupations (Median Income Less Than $29,000 per Year) and Percent of Adults 25 Years or Older with Less Than a High School Degree, by City Council District
2010–2014 5-year Estimate
Low-Wage Occupations and Educational Attainment
Percent of Employed People Working in Low-Wage Occupations (Median Income Less Than $29,000 per Year) and Percent of Adults 25 Years or Older with Less Than a High School Degree, by City Council District
2010–2014 5-year Estimate
Percent of Workers in Low-Wage Occupations, by District’s Educational Attainment
Employed People Working in Low-Wage Occupations (Median Income Less Than $29,000 per Year), by City Council District’s Educational Attainment (Percent of Adults 25 Years or Older with Less Than a High School Degree)
2010–2014 5-year Estimate

Are Education Centers Reaching Homeless Families?
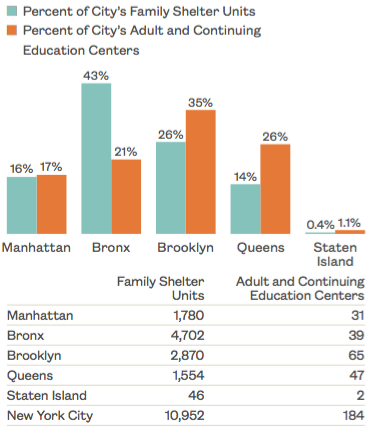
- Despite the demonstrated need of parents in shelter to access continuing education classes, City Council districts where shelter units are concentrated do not have more Adult and Continuing Education centers. Only 30% of centers were located in the ten City Council districts that are home to 70% of all family shelter units citywide.
- This trend was true by borough as well. The Bronx, which is home to 43% of all family shelter units, had only 21% of the city’s Adult and Continuing Education centers.
Placing adult education classes in existing shelters could increase the capacity of these programs to serve homeless families and reduce barriers that prevent homeless parents from completing the program.
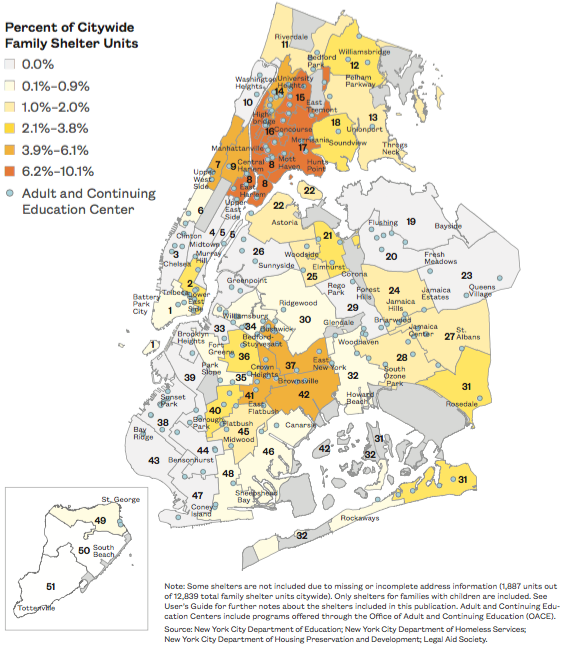
Family Shelter Units and Adult and Continuing Education Centers
Percent of Citywide Family Shelter Units and Locations of Adult and Continuing Education Centers, by City Council District
December 2015
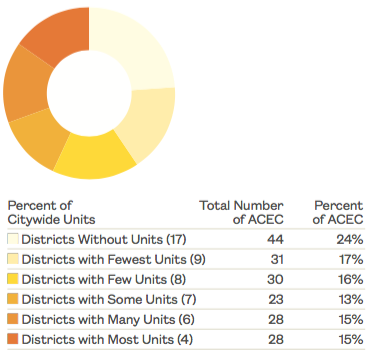
New York City’s Adult and Continuing Education Centers (ACEC), by Shelter Distribution
December 2015
Almost one-quarter (24%) of the city’s Adult and Continuing Education centers were found in the 17 districts without any family shelter units.
Family Shelter Units and Adult and Continuing Education Centers, by Borough
December 2015
Note: Some shelters are not included due to missing or incomplete address information (1,887 units out of 12,839 total family shelter units citywide). Only shelters for families with children are included. See User’s Guide for further notes about the shelters included in this publication. Adult and Continuing Education Centers include programs offered through the Office of Adult and Continuing Education (OACE). Source: New York City Department of Education; New York City Department of Homeless Services; New York City Department of Housing Preservation and Development; Legal Aid Society.
Where Are Employment Services Needed?
- Families experiencing unemployment and underemployment are at high risk for housing instability and homelessness.
- Families living in some communities with high unemployment lack services in their own neighborhoods. These neighborhoods include the Eastchester and Parkchester areas of the Bronx and Cypress Hills, Ditmas Park, Brownsville, and East New York in central Brooklyn. (Districts 12, 18, 37, 40, 41, and 42)
Some areas with few job centers have many shelters. Shelter infrastructure could be leveraged to provide job search and training services not only to homeless families, but also to those living in the surrounding community who are struggling with employment.
Unemployment and Job Centers
Percent of People Who Are Unemployed and Locations of NYC and NYS Job Centers, by City Council District
2010–2014 5-year Estimate
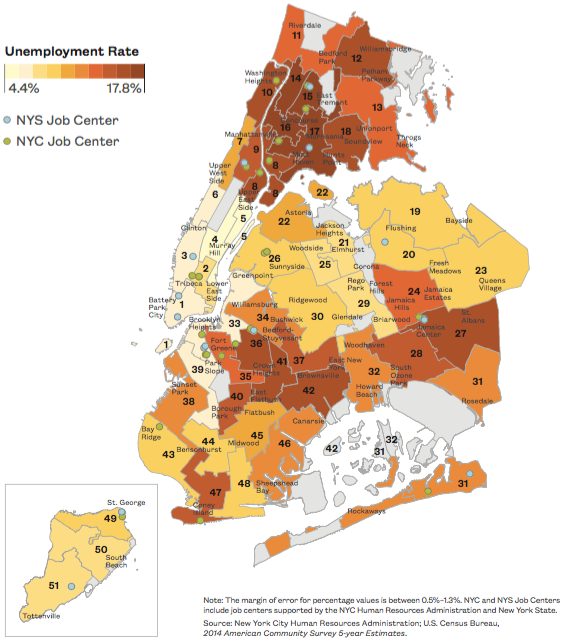
Unemployment
Percent of People Who Are Unemployed, by City Council District
2010–2014 5-year Estimate
City Council Districts and Select Neighborhoods
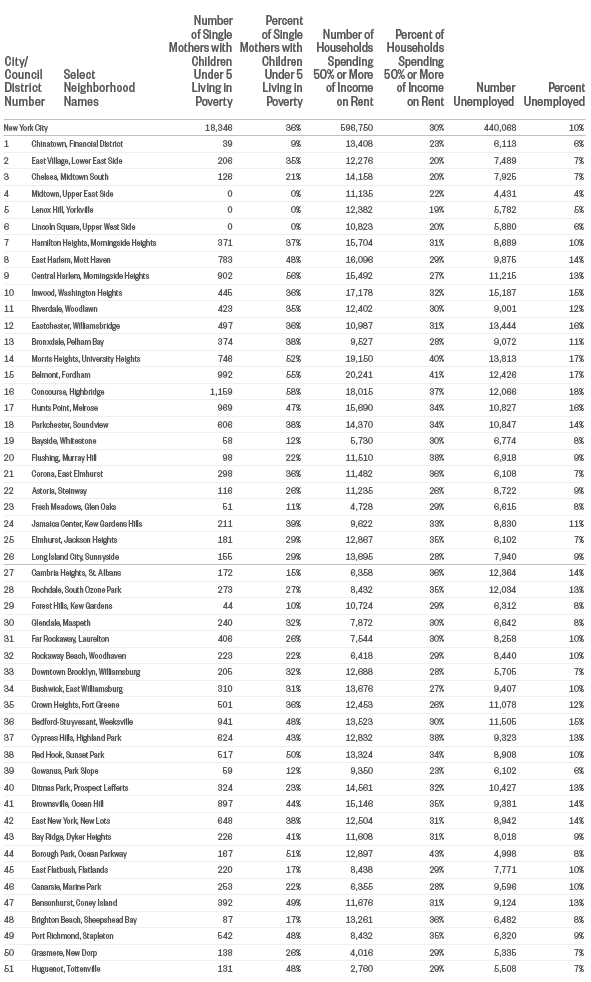
Where Are Young Families at Risk for Homelessness?
- One out of every six individuals living in family shelters is a child age five or younger.
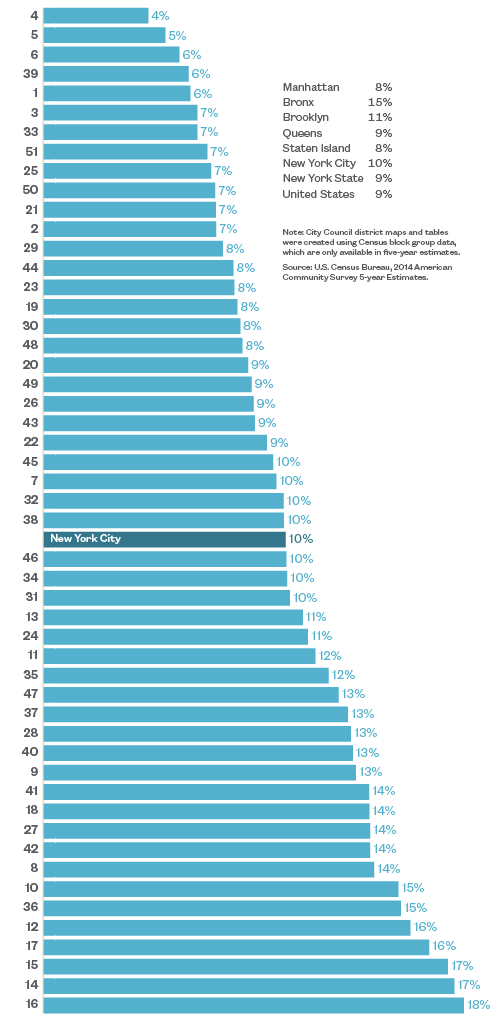
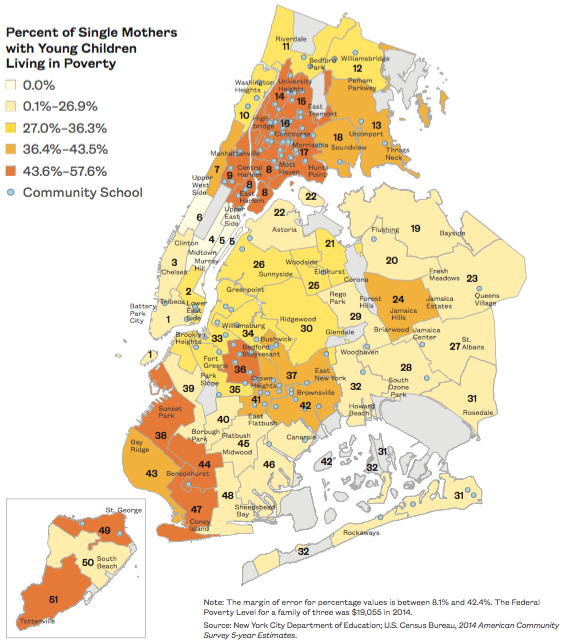
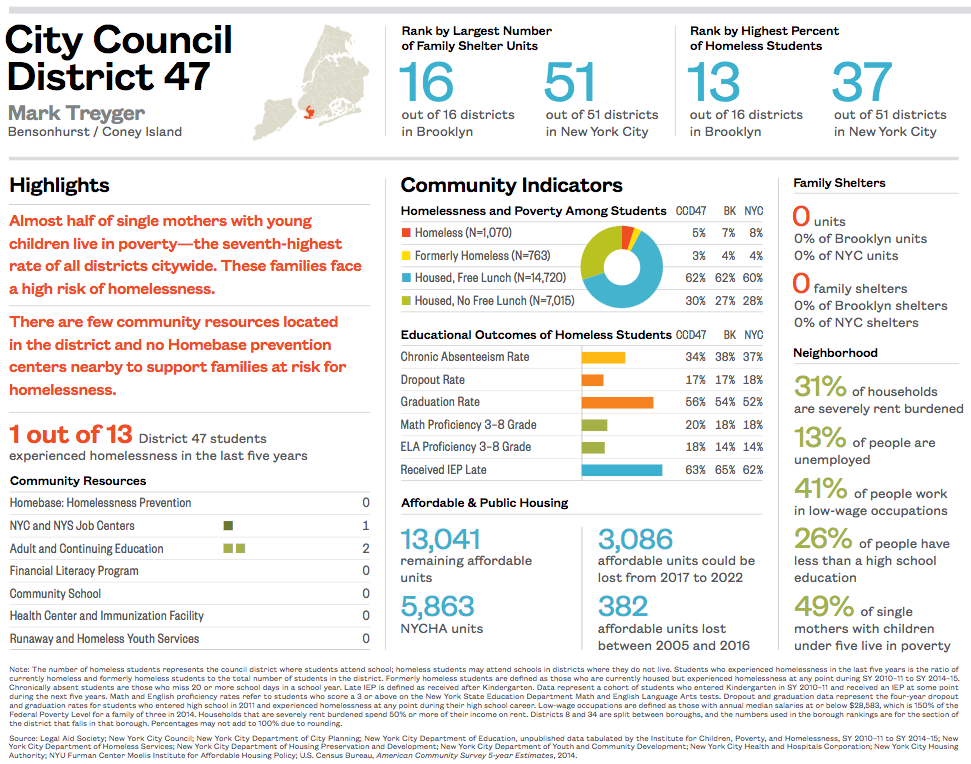
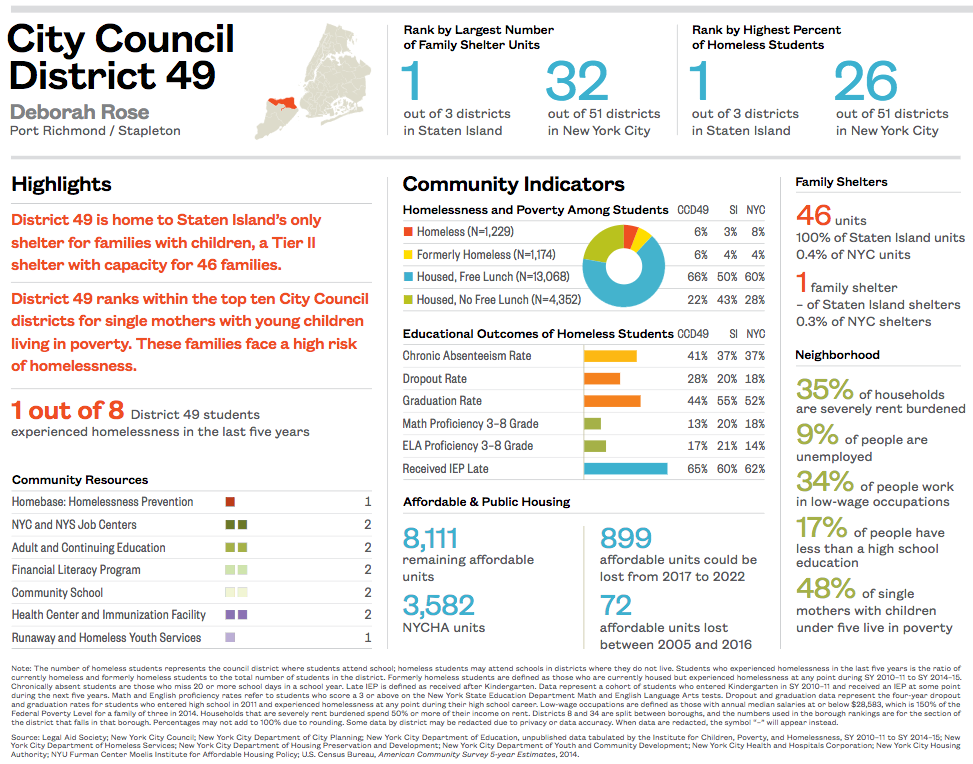
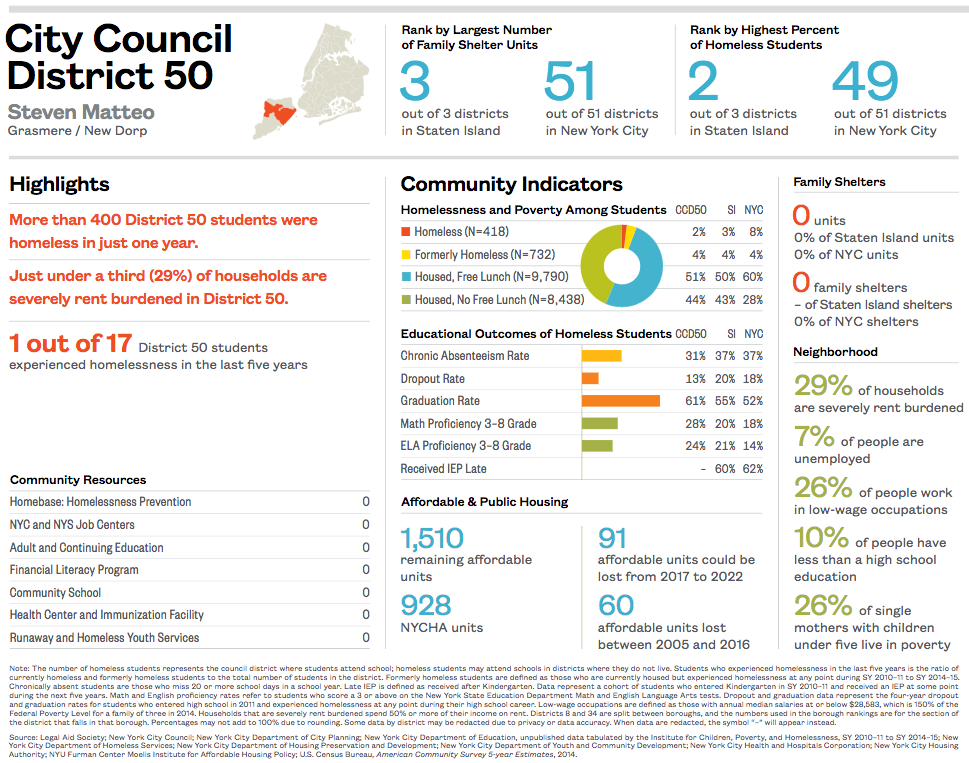
- Poverty among single mothers with children under five years old ranged widely in the city. In three Manhattan districts, none of these families lived in poverty (Districts 4, 5, and 6), while in the south and west Bronx, upper Manhattan, and south and central Brooklyn, between 44%–58% of these families lived in poverty. (Districts 8, 9, 14–17, 36, 38, 44, 47, 49, and 51)
Community schools are neighborhood hubs that not only educate students, but also provide social services to families and resources to communities.
Single Mothers with Young Children Living in Poverty and Community Schools
Percent of Single Mothers with Children Under Five Years Old Earning Below the Federal Poverty Level and Locations of Community Schools, by City Council District
2010–2014 5-year Estimate
Single Mothers with Young Children Living in Poverty
Percent of Single Mothers with Children Under Five Years Old Earning Below the Federal Poverty Level, by City Council District
2010–2014 5-year Estimate
City Council Districts and Select Neighborhoods
Are Families Accessing Homelessness Prevention Services?
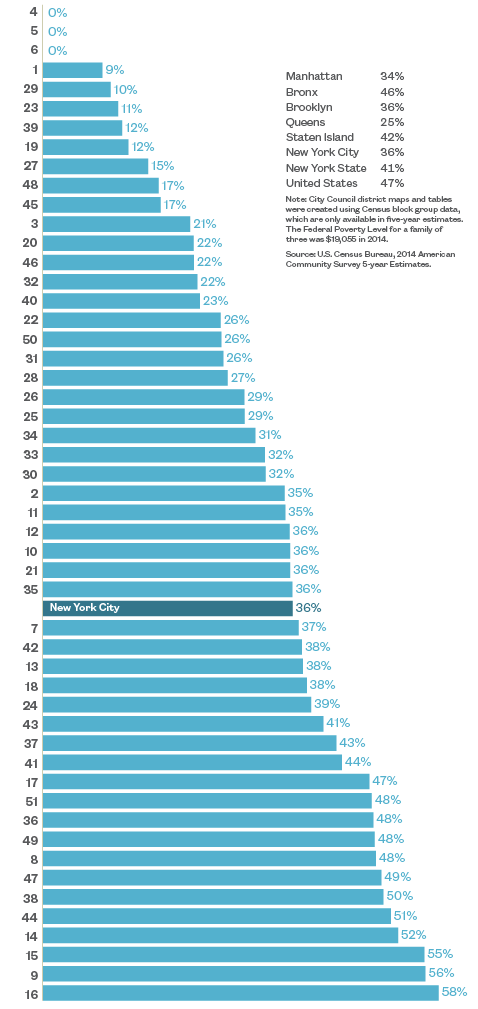
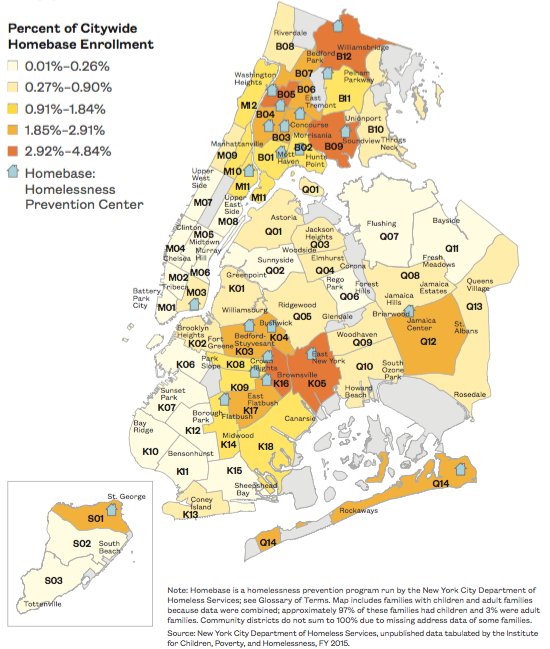
- While residents from all New York City community districts used Homebase prevention services, use was most heavily concentrated in University Heights, Unionport/Soundview, Williamsbridge, East New York, and Brownsville. (B05, B09, B12, K05, and K16)
- Both Mott Haven and East Harlem stand out for having lower Homebase prevention program use than would be expected. These neighborhoods saw only moderate use of Homebase prevention programs but were among the six communities that saw the largest increase in shelter entry from FY 2012–FY 2015. (B01 and M11)
Ensuring access to these services for families is key not only in areas with high homelessness, but also areas where homelessness is growing.
Homebase: Homelessness Prevention
Percent of New York City Families Enrolled in Homebase Prevention Services and Locations of Homebase: Homelessness Prevention Centers, by Community District
FY 2015
Homebase: Homelessness Prevention
Number of New York City Families Enrolled in Homebase Prevention Services, by Community District
FY 2015
Community Districts and Select Neighborhoods
Homelessness by City Council District
“Our landlord was not paying the bills for the building. He collected the rent but then he went AWOL. There was no hot water, no gas, people were living on the building’s steps, people were doing drugs out in the hallway. I had kids. I couldn’t stay there. We were just making ends meet at the rent we were paying. We couldn’t find another apartment that we could afford and we had no more money, so we went to the shelter.”
—Homeless mother and father with
two children living in shelter
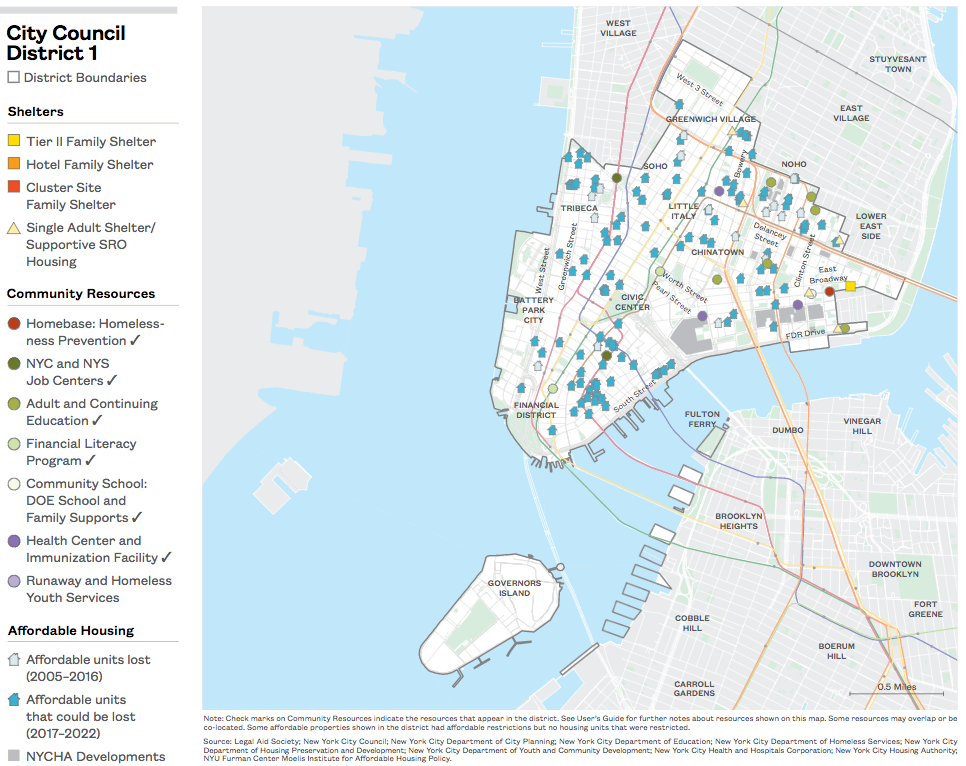
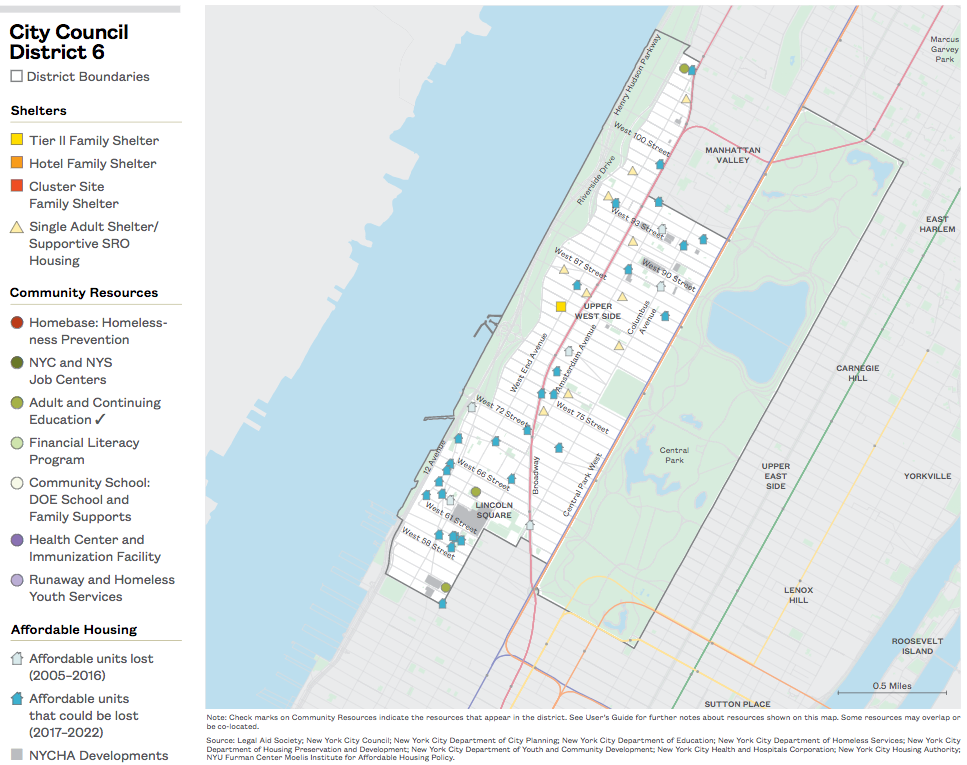
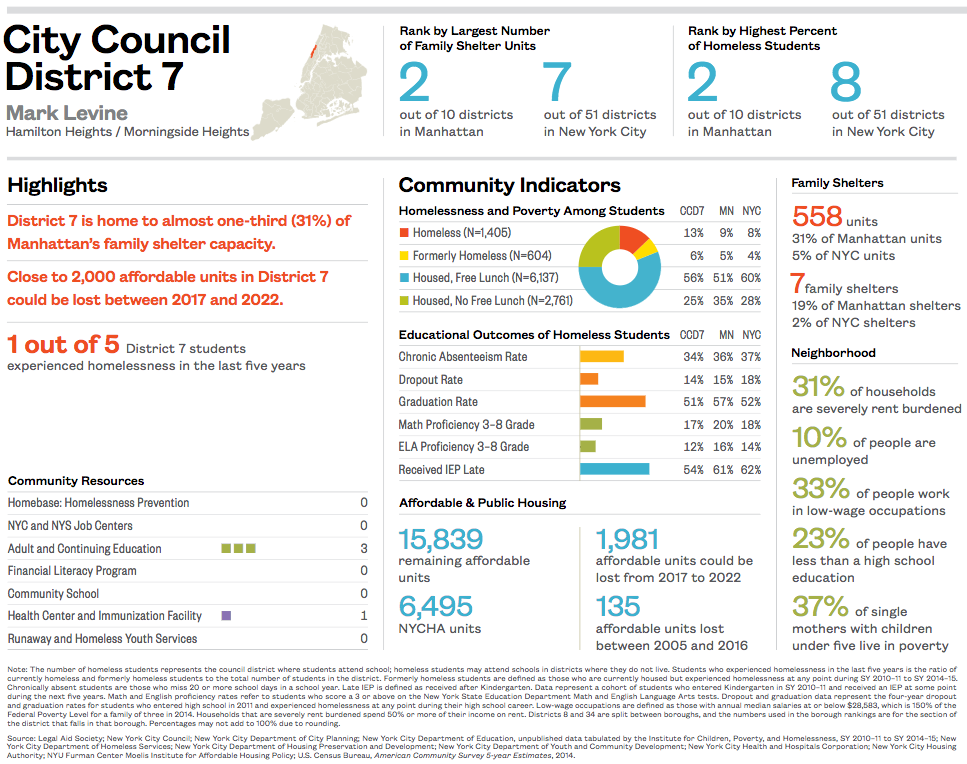
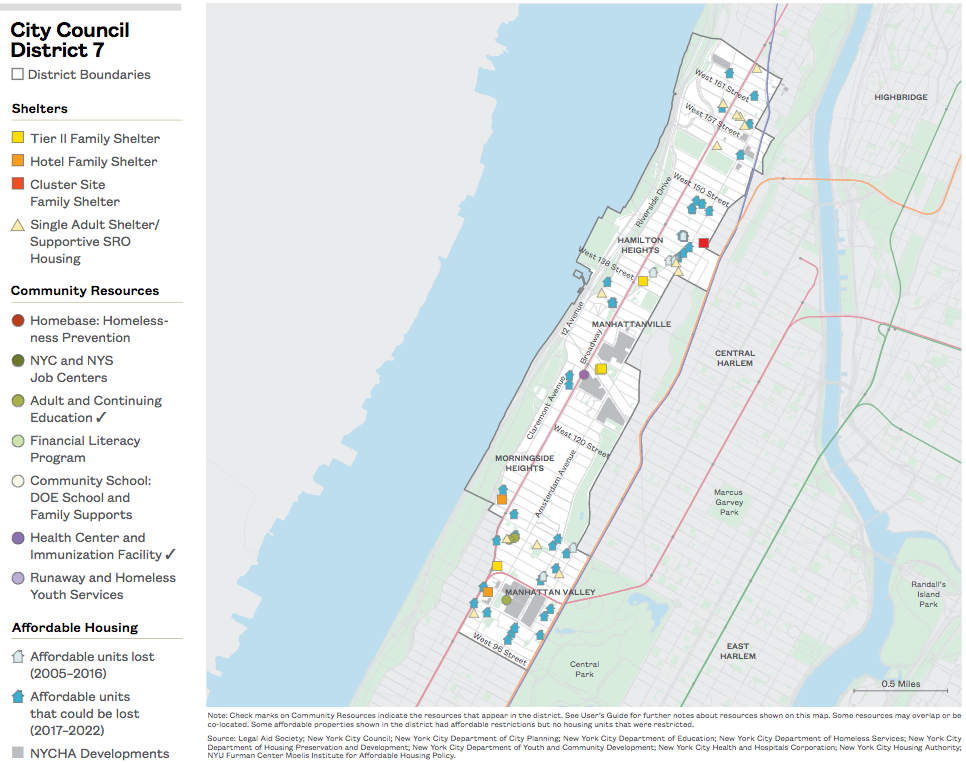
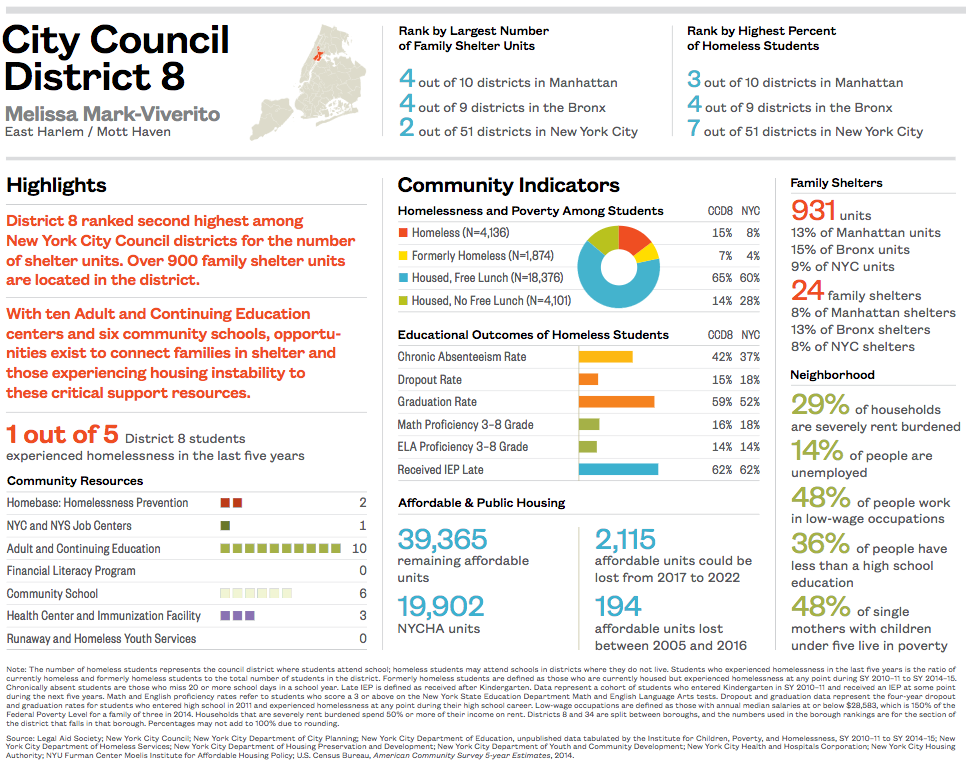
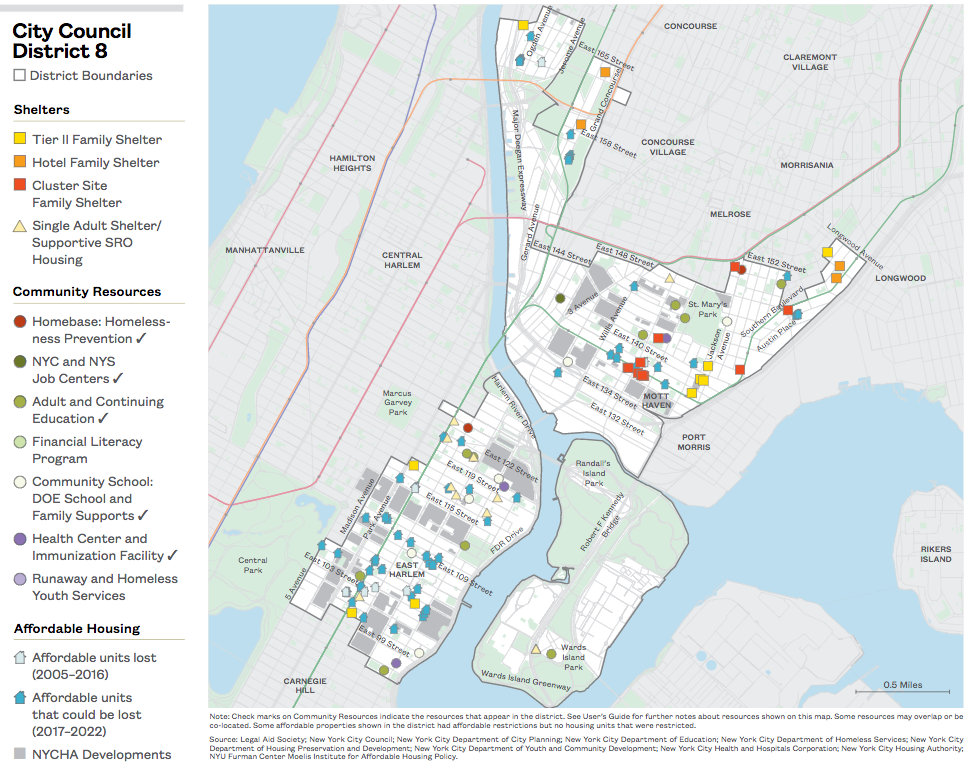
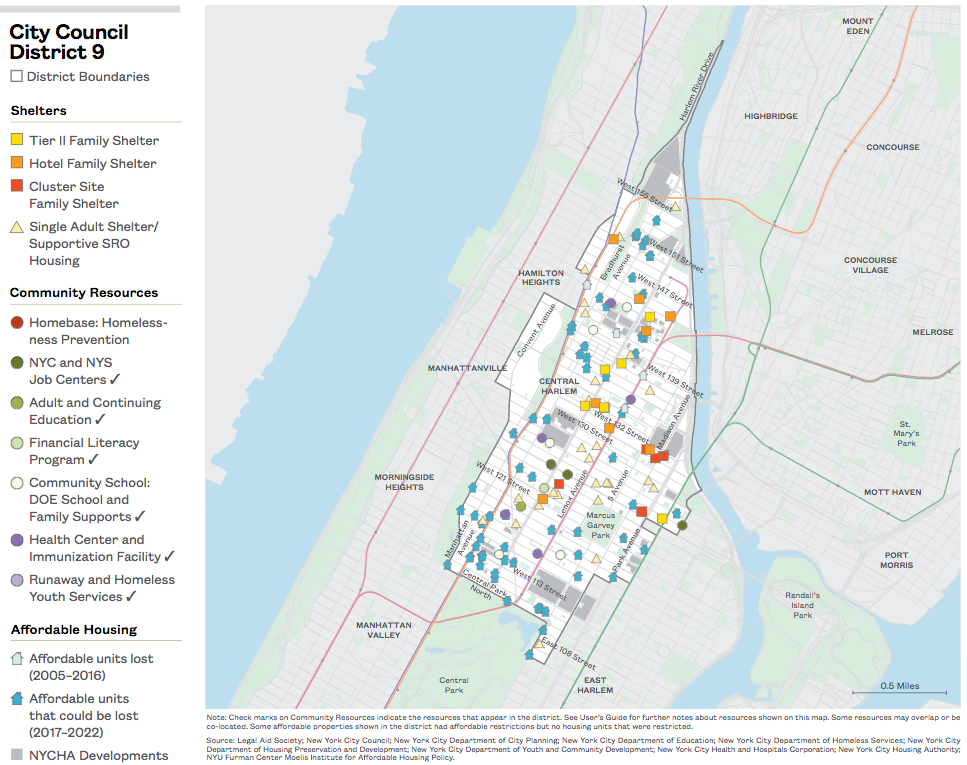
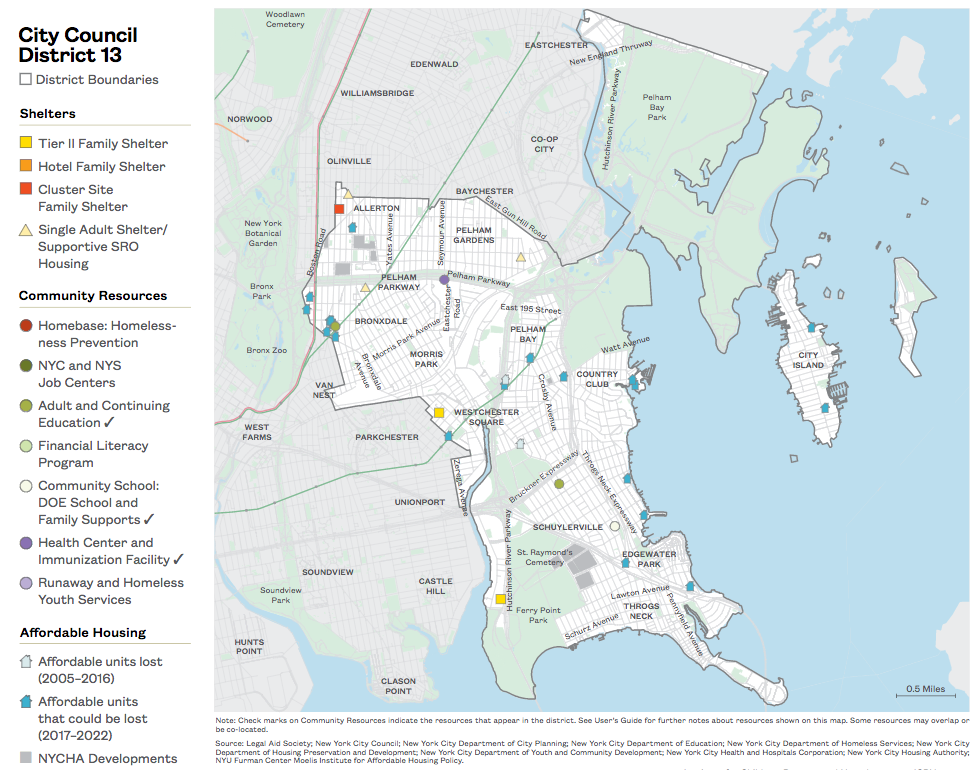
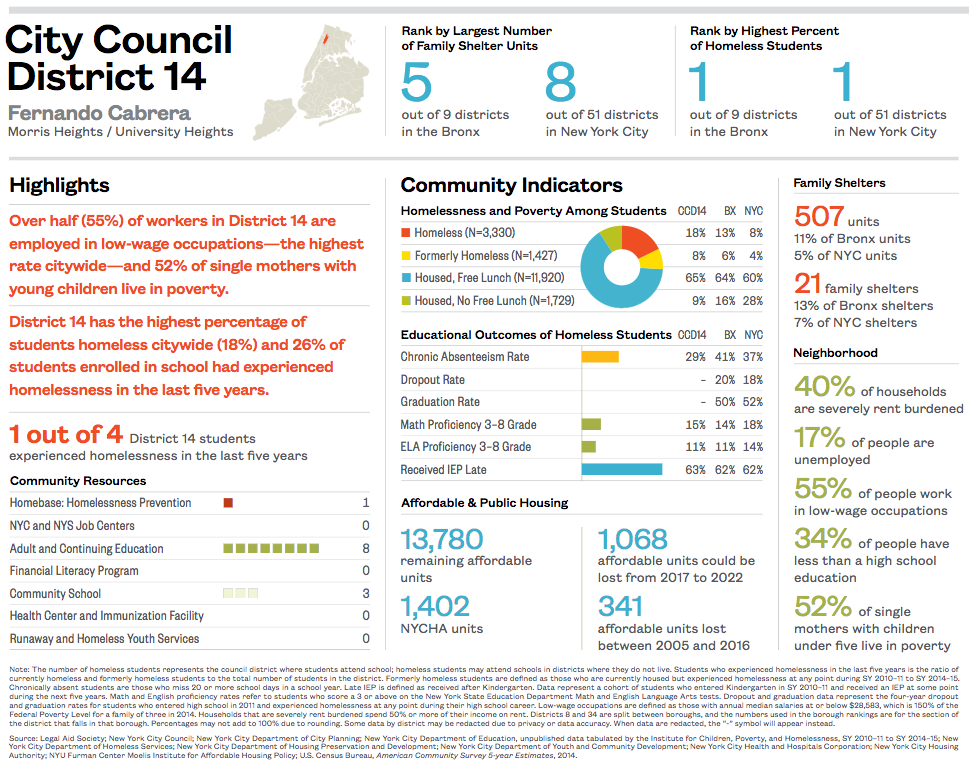
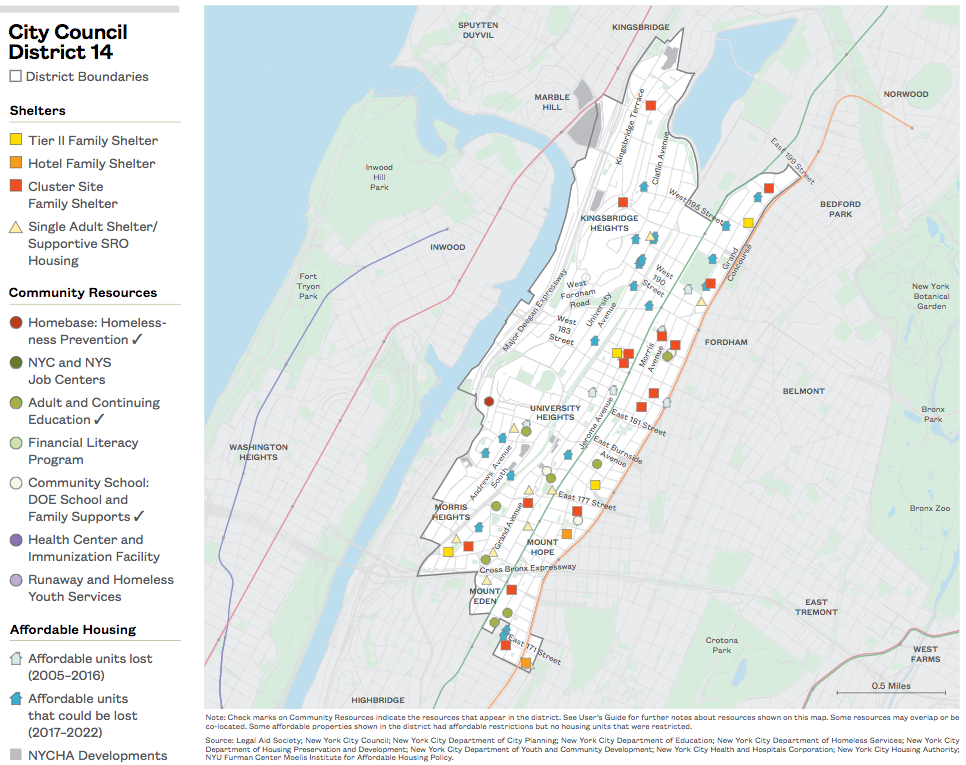
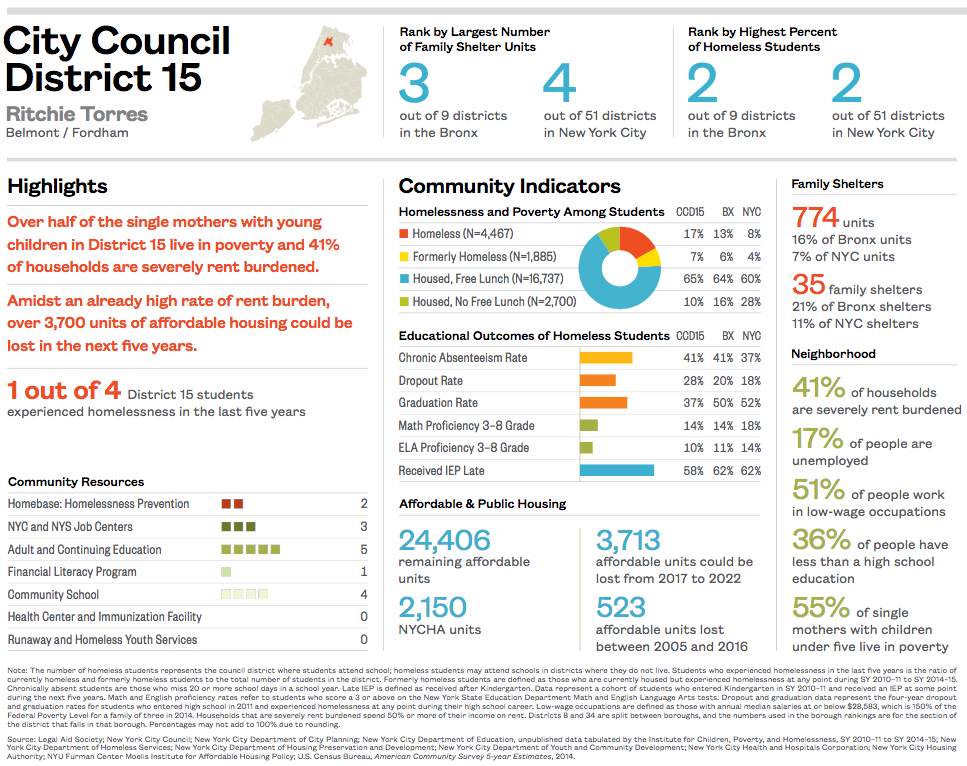
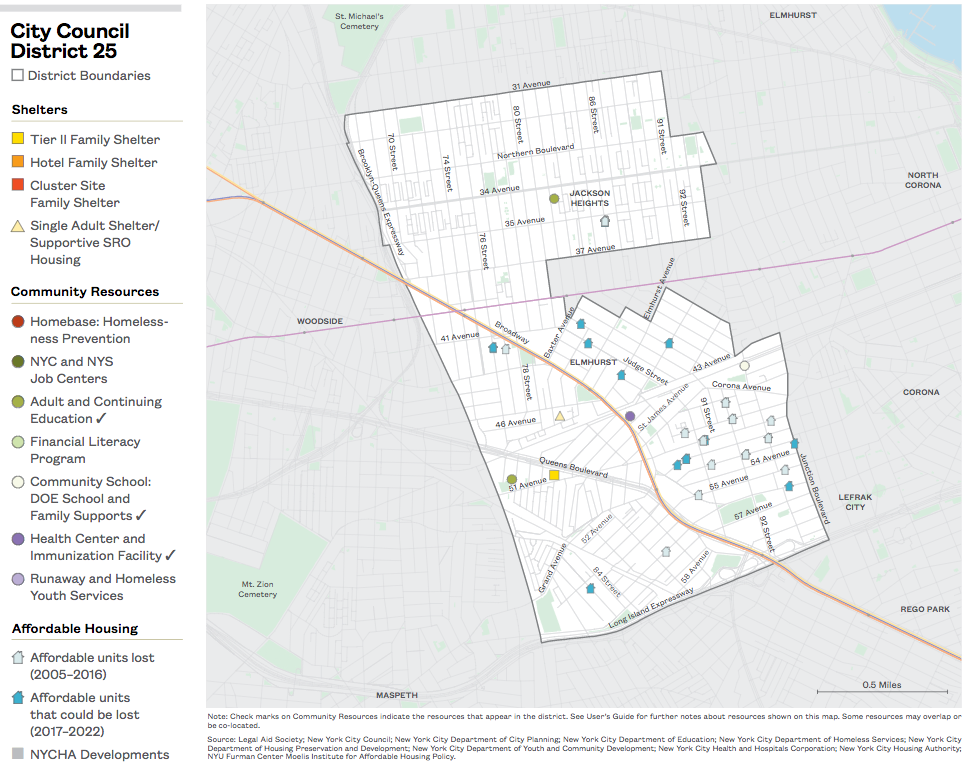
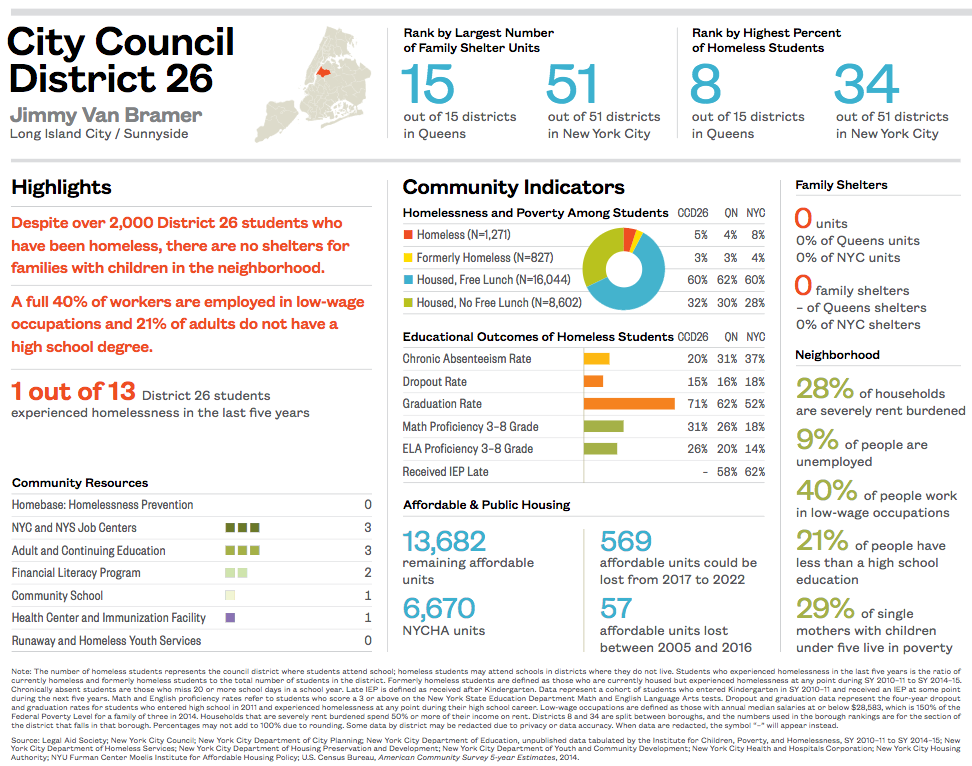
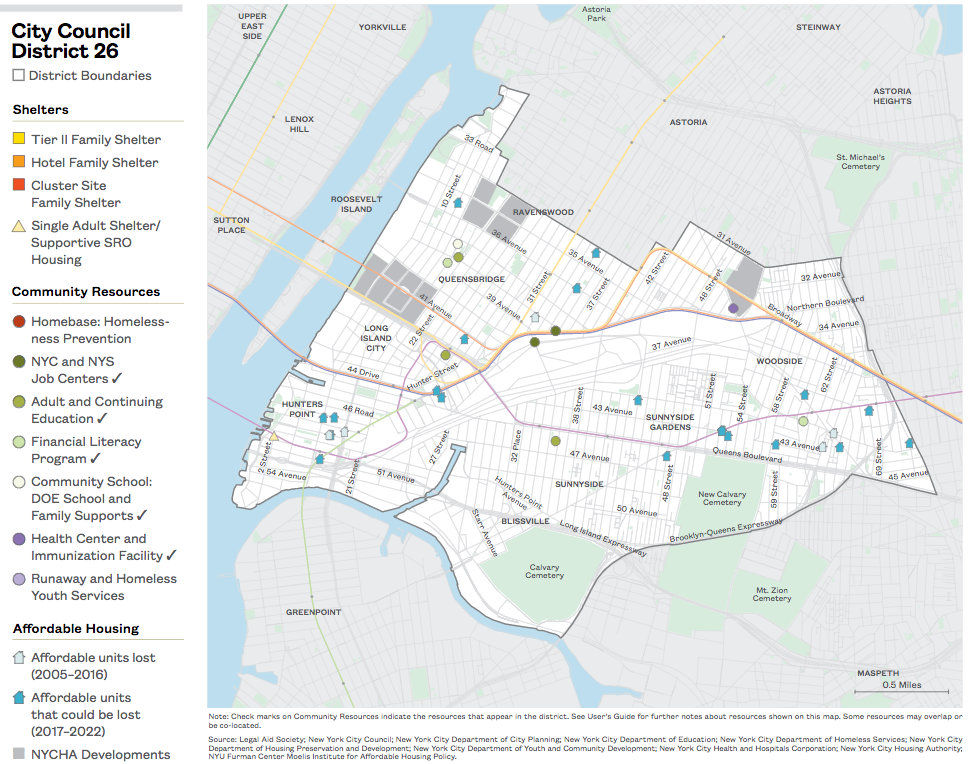
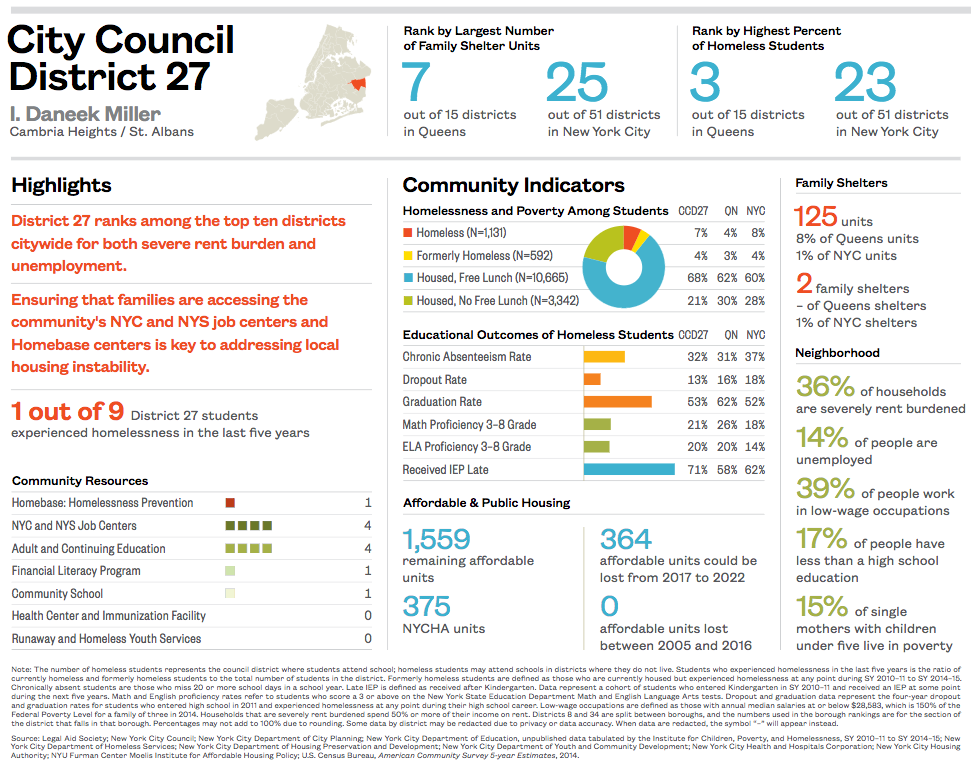
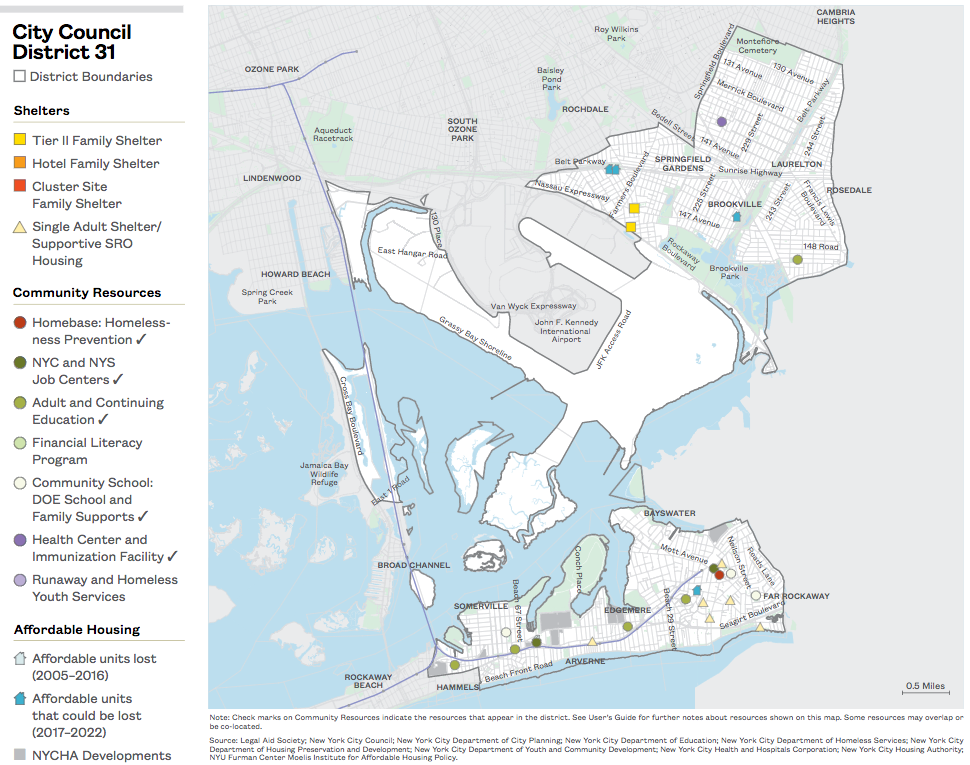
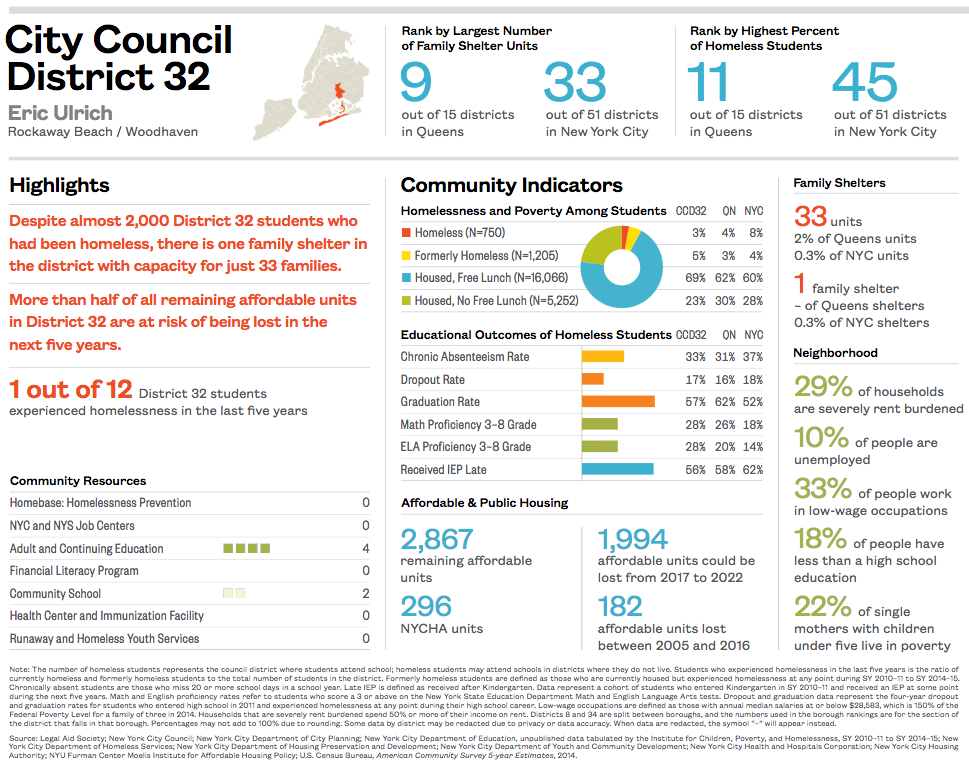
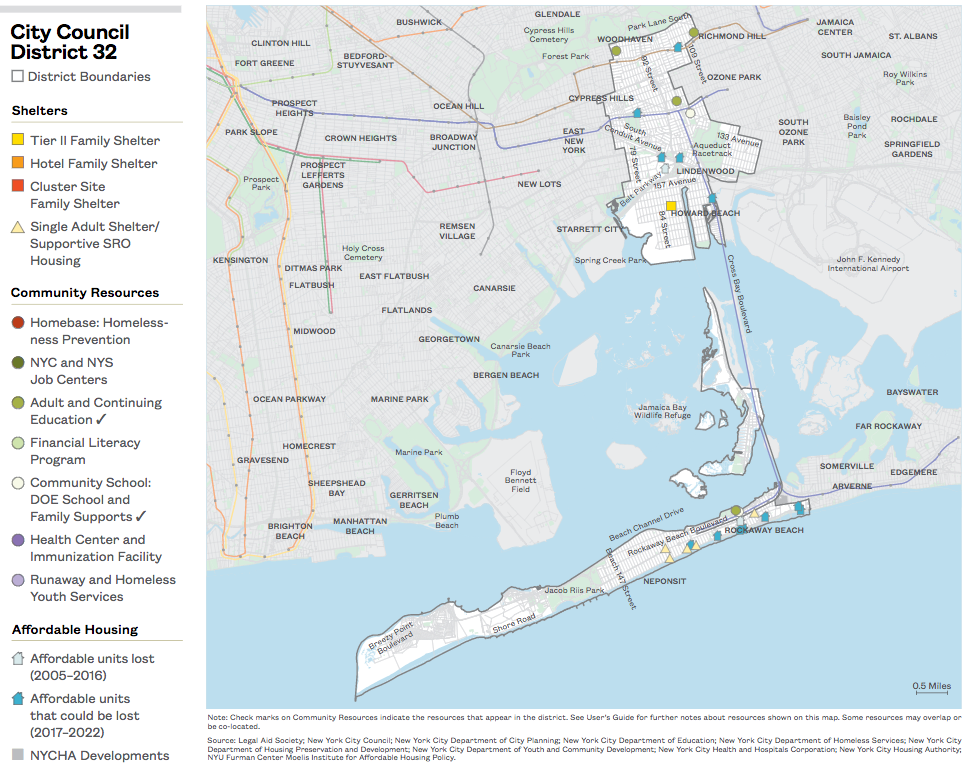
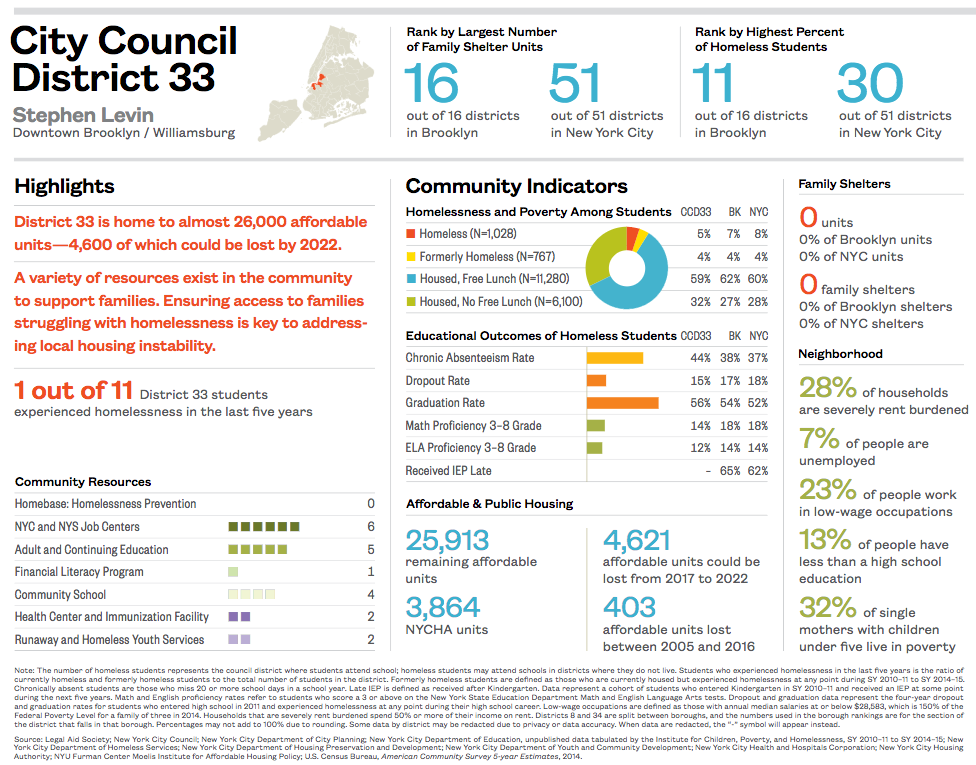
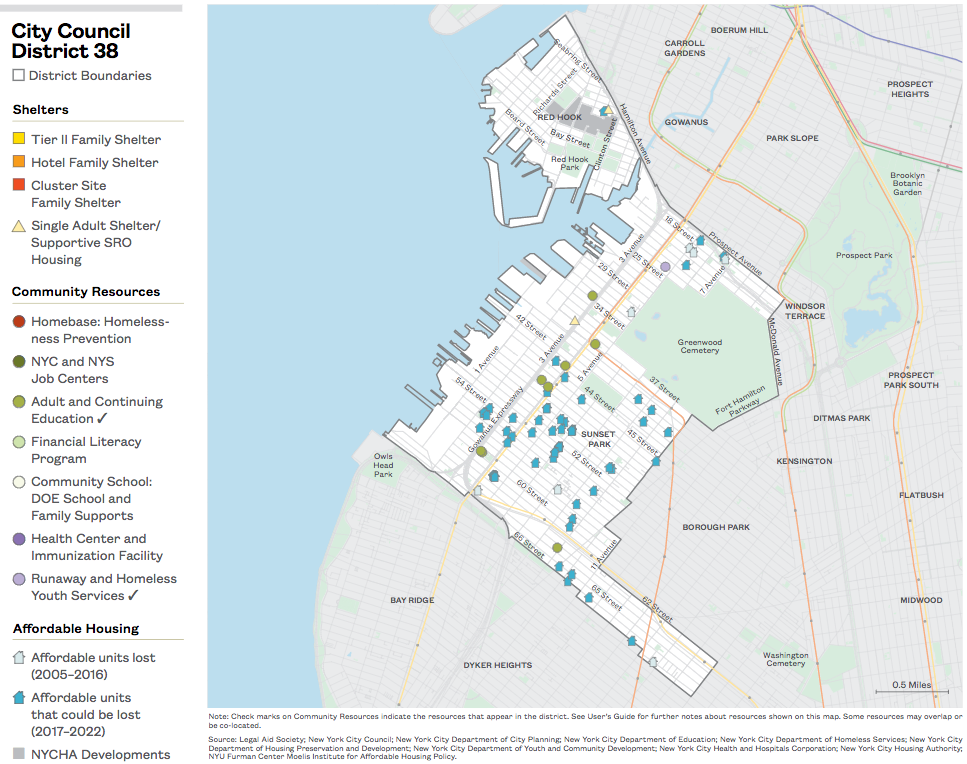
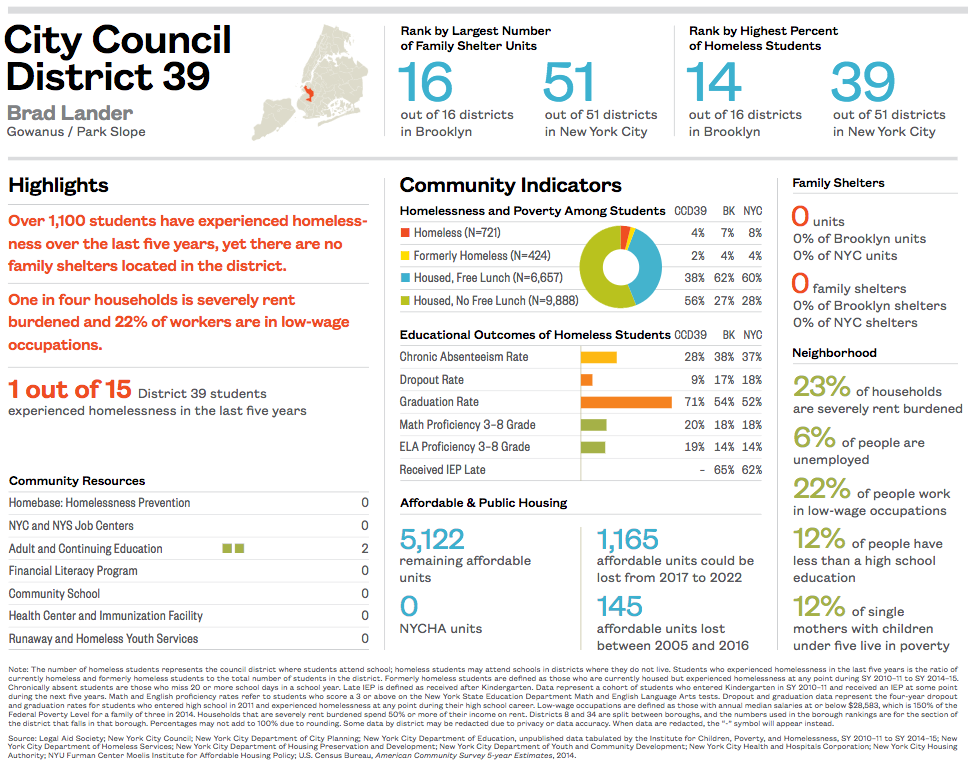
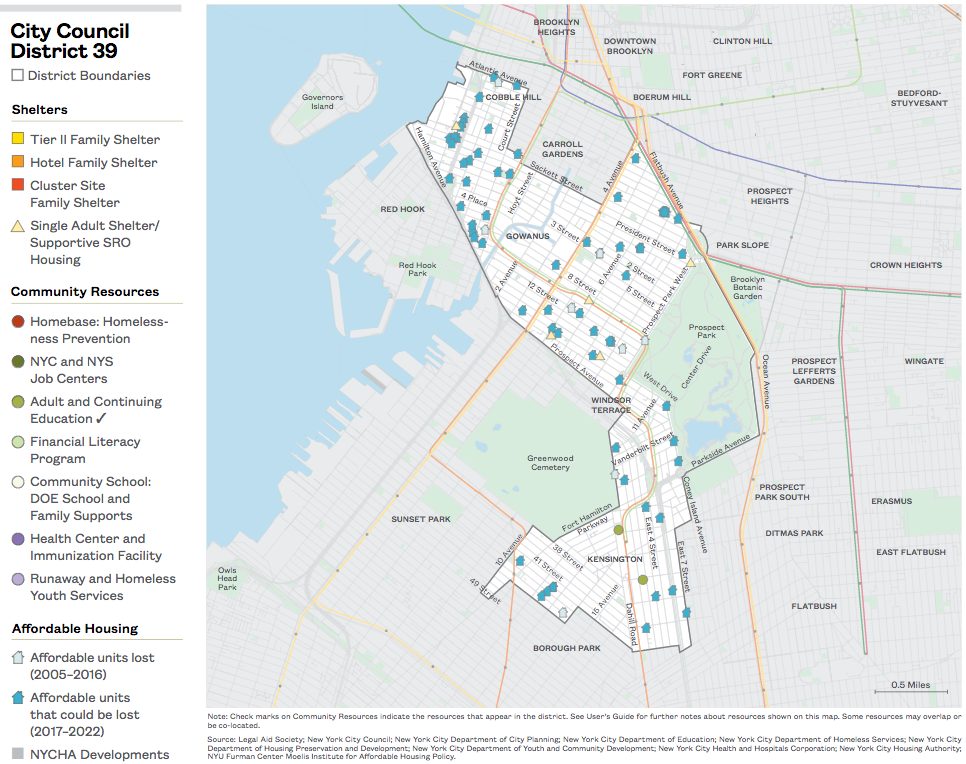
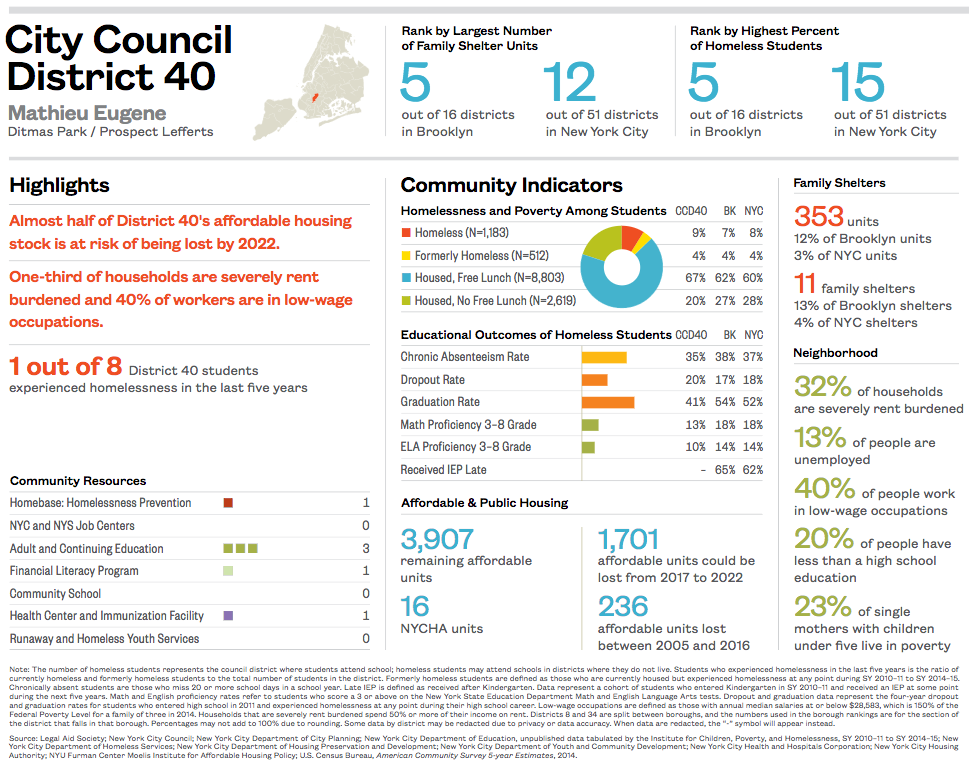
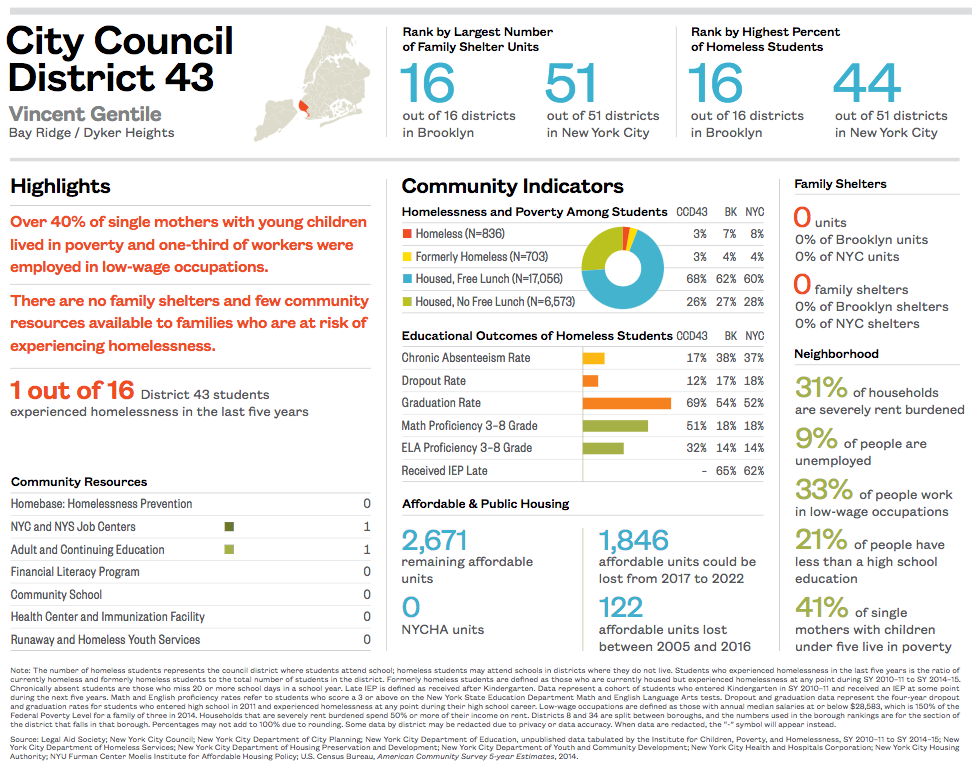
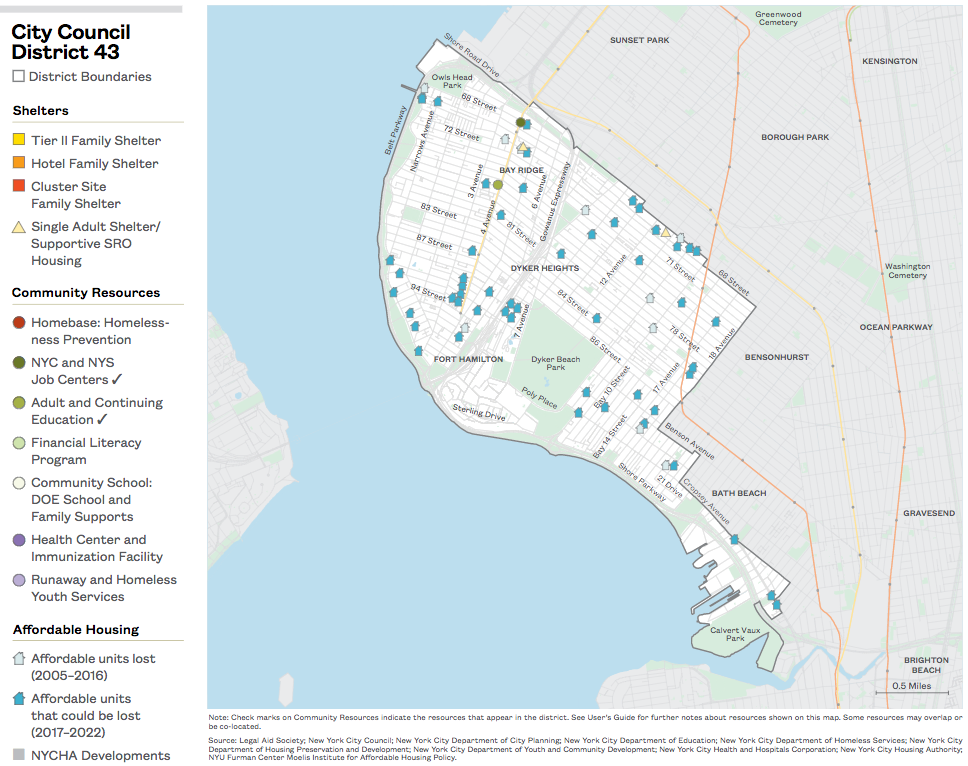
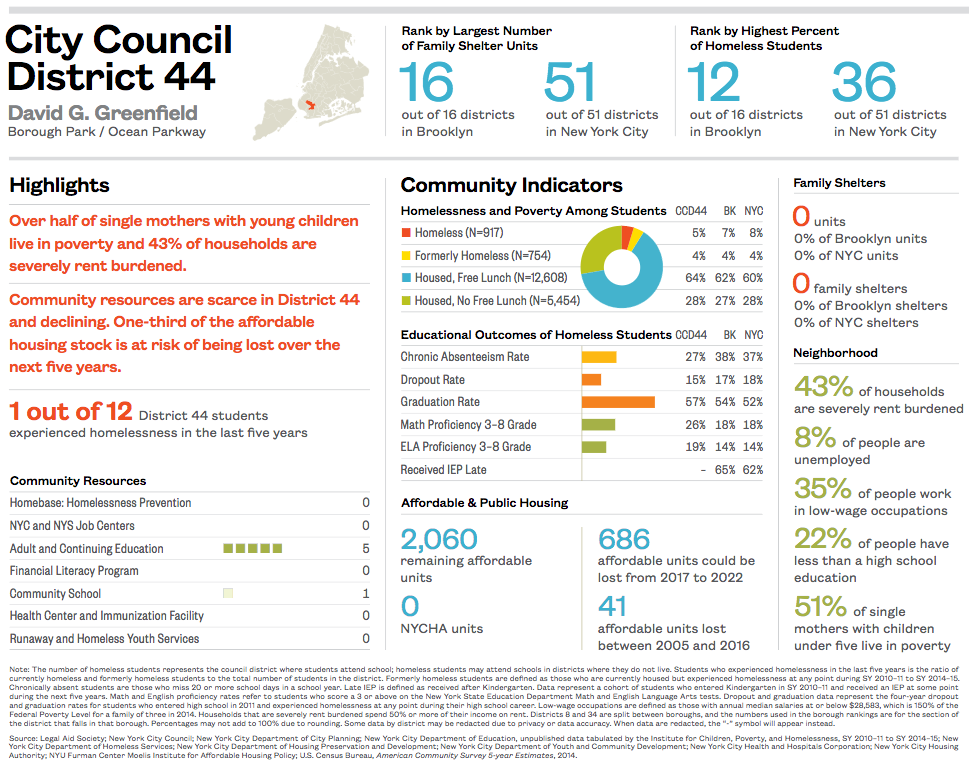
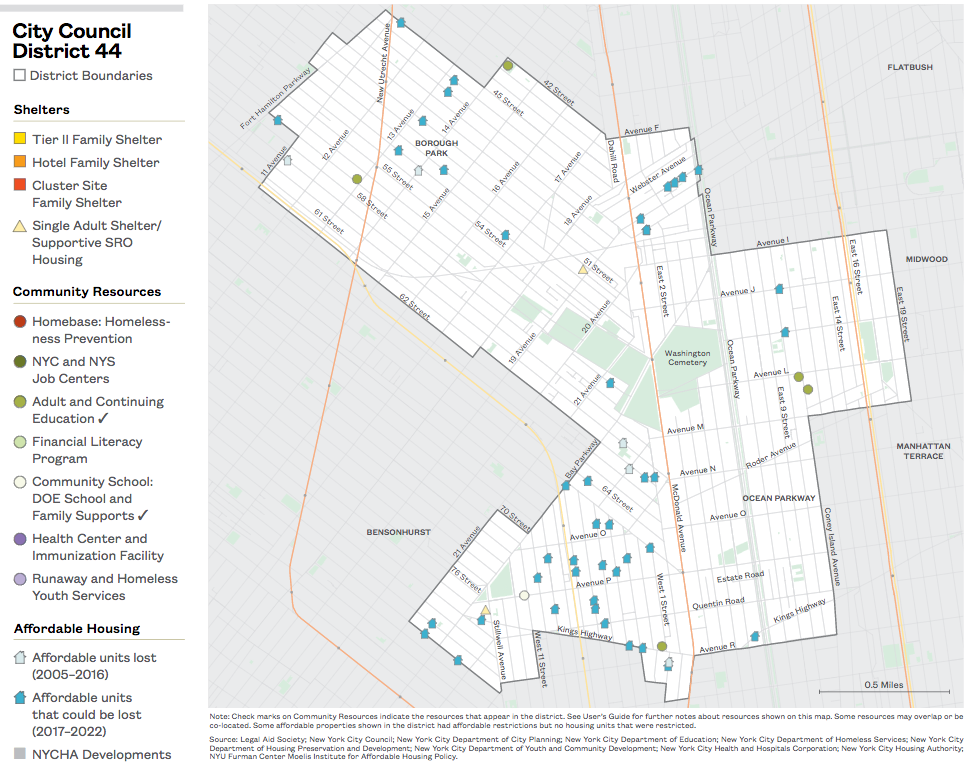
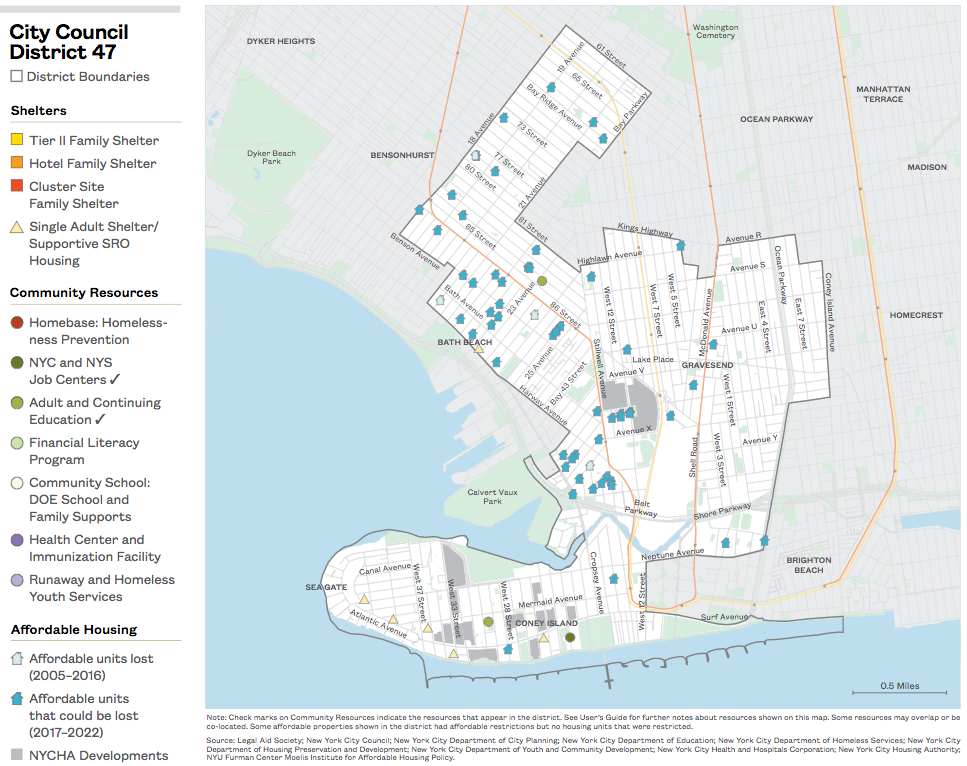
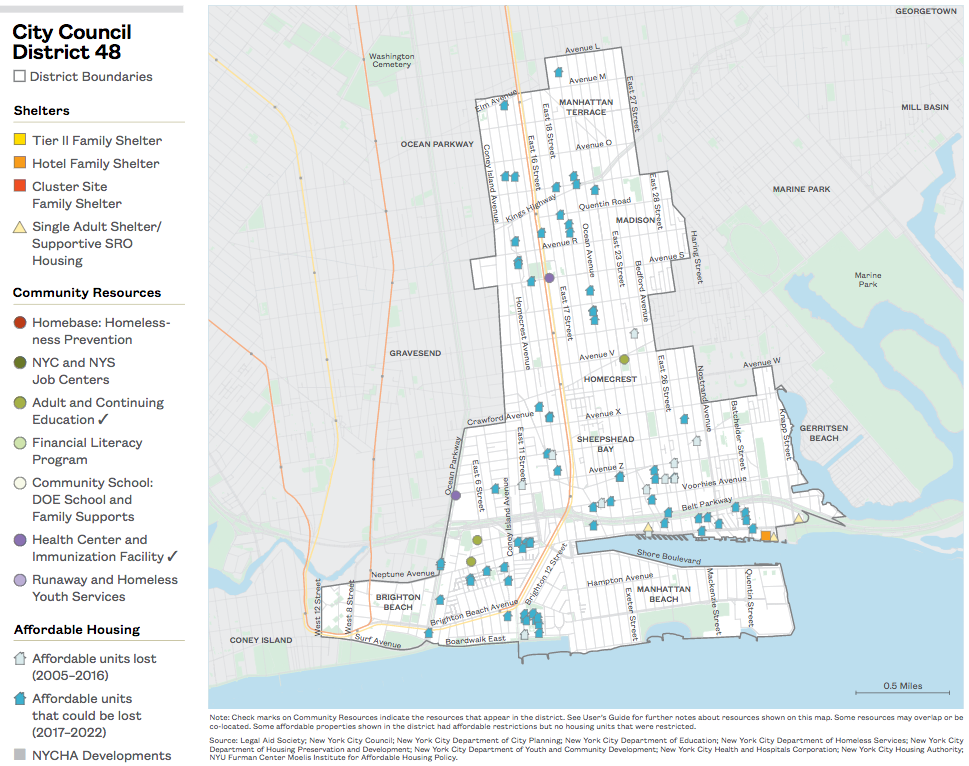
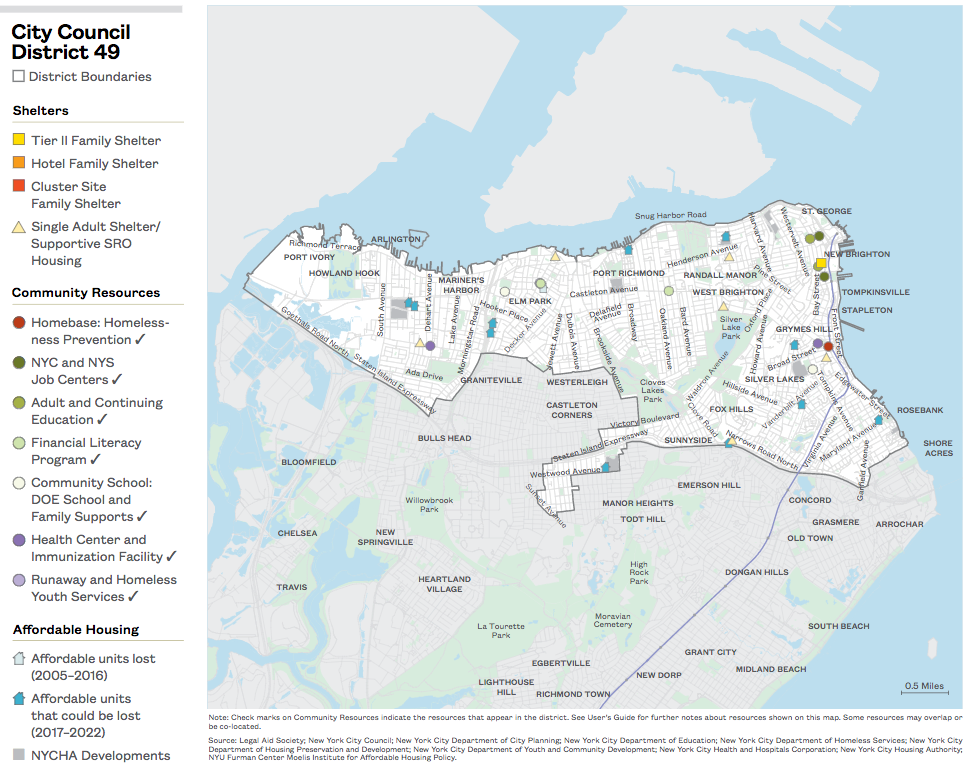
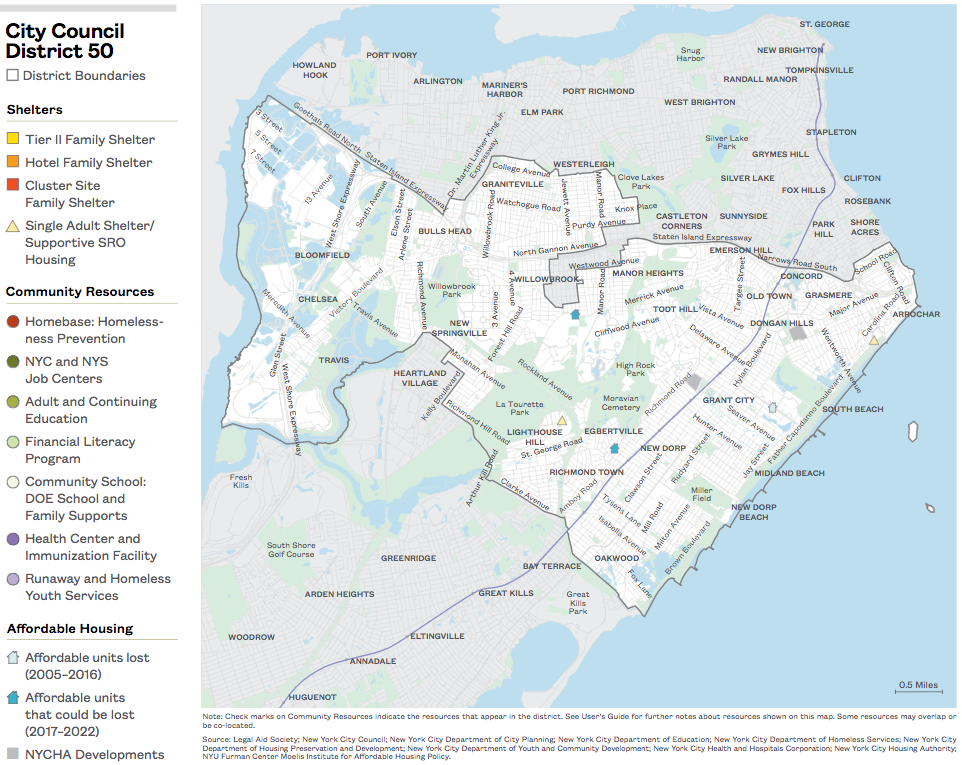
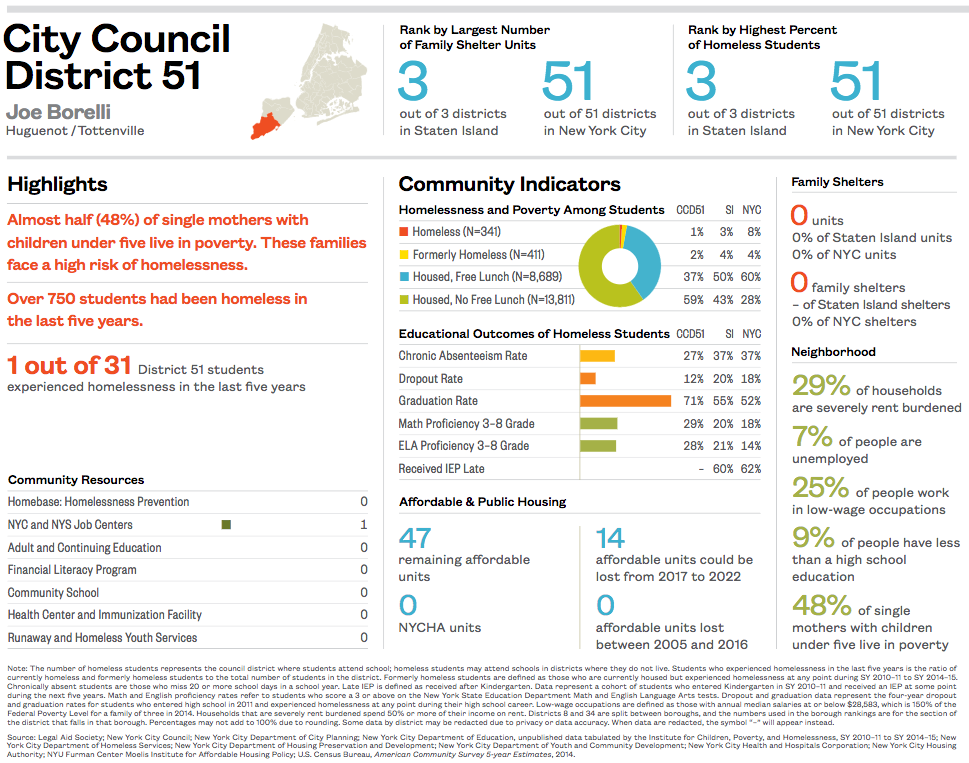
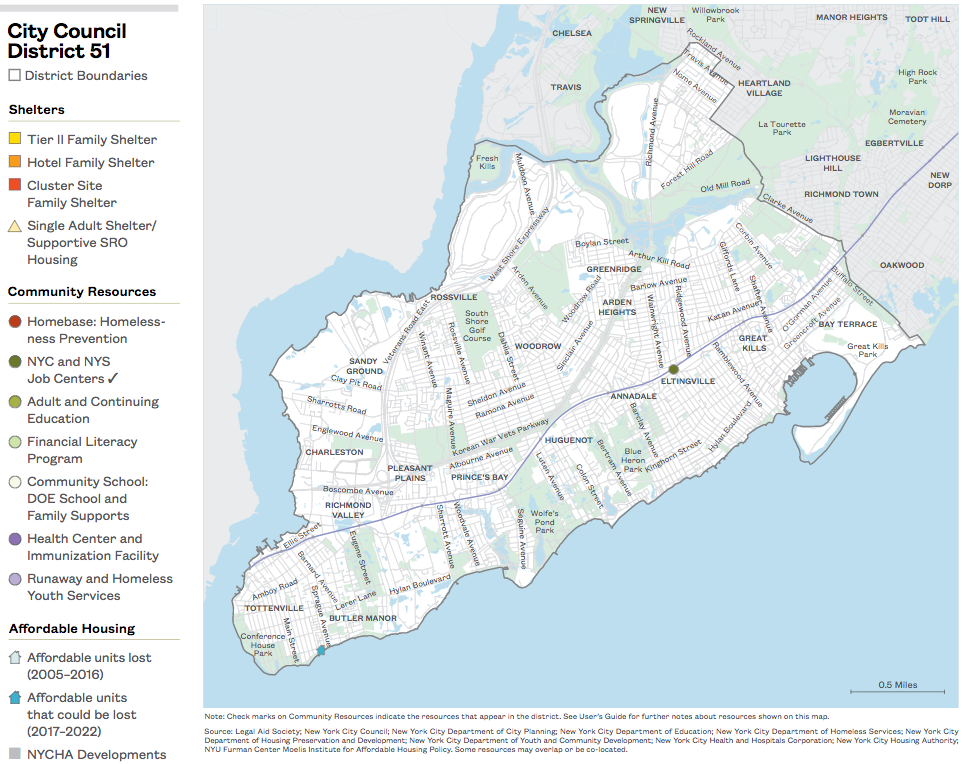
Family homelessness impacts every community in New York City, but the exact picture of what homelessness looks like can vary dramatically. City Council districts are a key element in New York City’s policy and programmatic landscape. This section provides an in-depth look at family homelessness, including risk factors and resources in each City Council district—information critical to tailoring effective programs to local needs. Each City Council district page includes a map with the locations of shelters, selected community resources, NYCHA housing developments, and affordable housing units lost and at risk of disappearing. In addition, each district map is accompanied by a data summary page enabling comparisons across City Council districts.
New Trends and Key Findings
- City Council District 8 in East Harlem and Mott Haven has the largest number of NYCHA units at close to 20,000, accounting for 11% of all NYCHA public housing in the city.
- City Council District 16 in the Highbridge/Concourse neighborhood has over 1,100 family shelter units representing 10% of all shelter units in the city—the largest number of shelter units in any one City Council district.
- The top five City Council districts for the number of family shelter units are Districts 8, 15, 16, 17, and 37 including the neighborhoods of East Harlem/Mott Haven, Belmont, Concourse, Hunts Point, and Cypress Hills.
- Lincoln Square/Upper West Side in Manhattan and Astoria/Steinway in Queens saw the largest numbers of units with affordability clauses lost between 2005 and 2016 with over 1,600 and 1,300 units lost respectively in these neighborhoods. (Districts 6 and 22)
- The top five City Council districts at risk of losing the most affordable units due to affordability clauses that are set to expire in the next five years are Chinatown/Financial District, Chelsea/Midtown South, and Lincoln Square/Upper West Side in Manhattan, Eastchester/Williamsbridge in the Bronx, and Downtown Brooklyn/Williamsburg in Brooklyn. District 12 alone, including Eastchester/Williamsbridge, is at risk of losing close to 16,000 units by 2022. (Districts 1, 3, 6, 12, and 33)
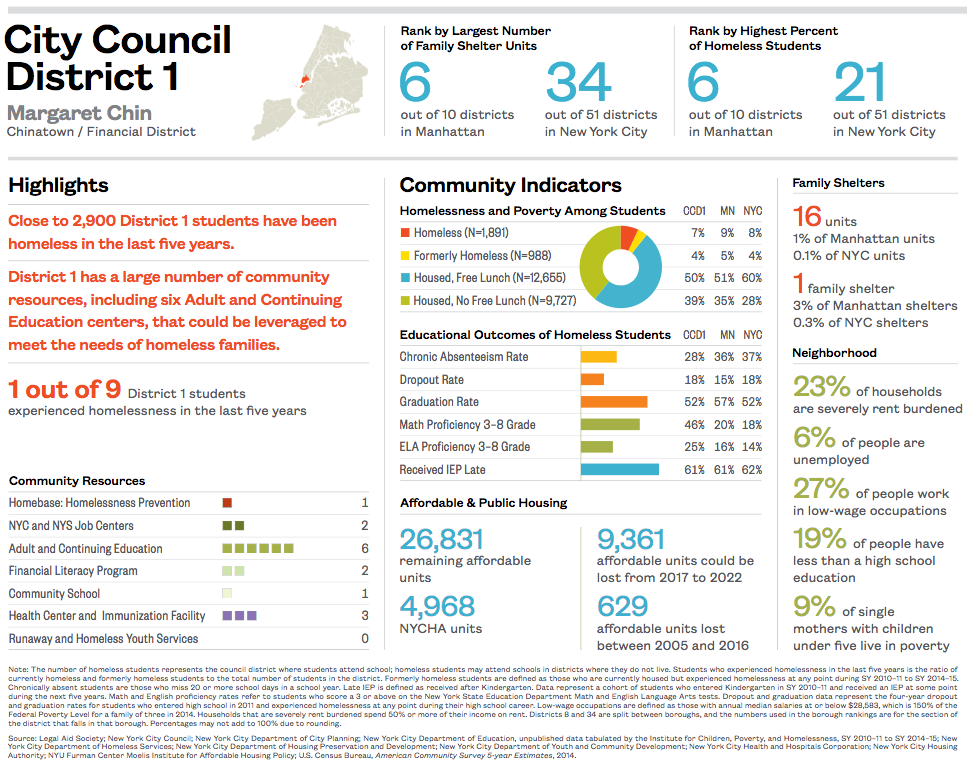
City Council District 1
Download City Council District 1
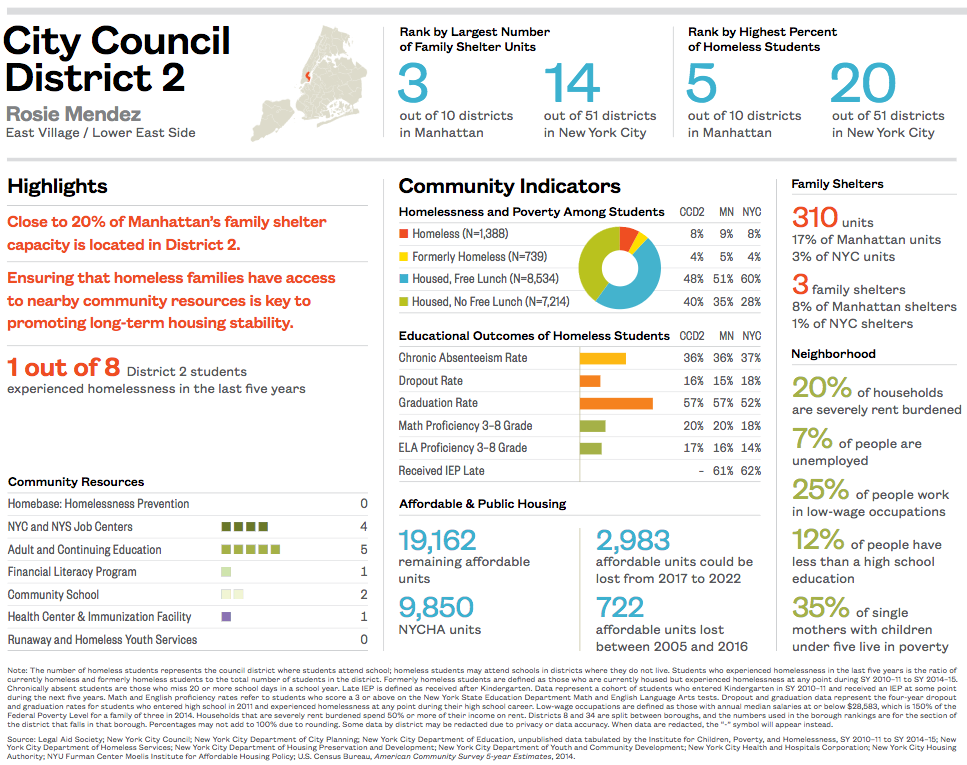
City Council District 2
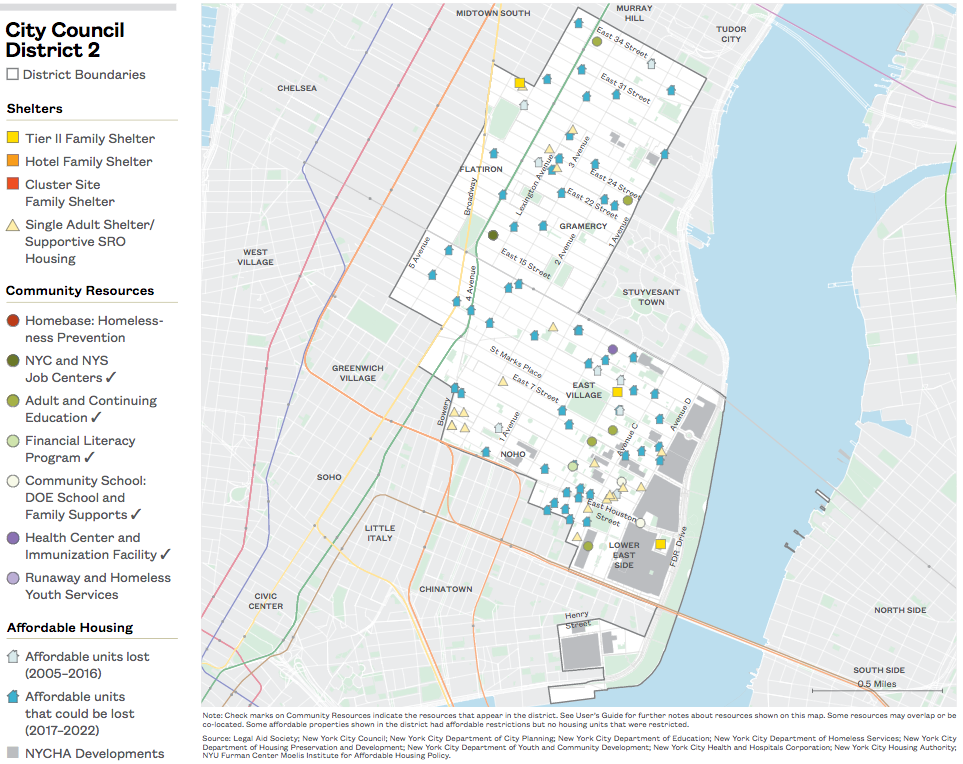
Download City Council District 2
City Council District 3
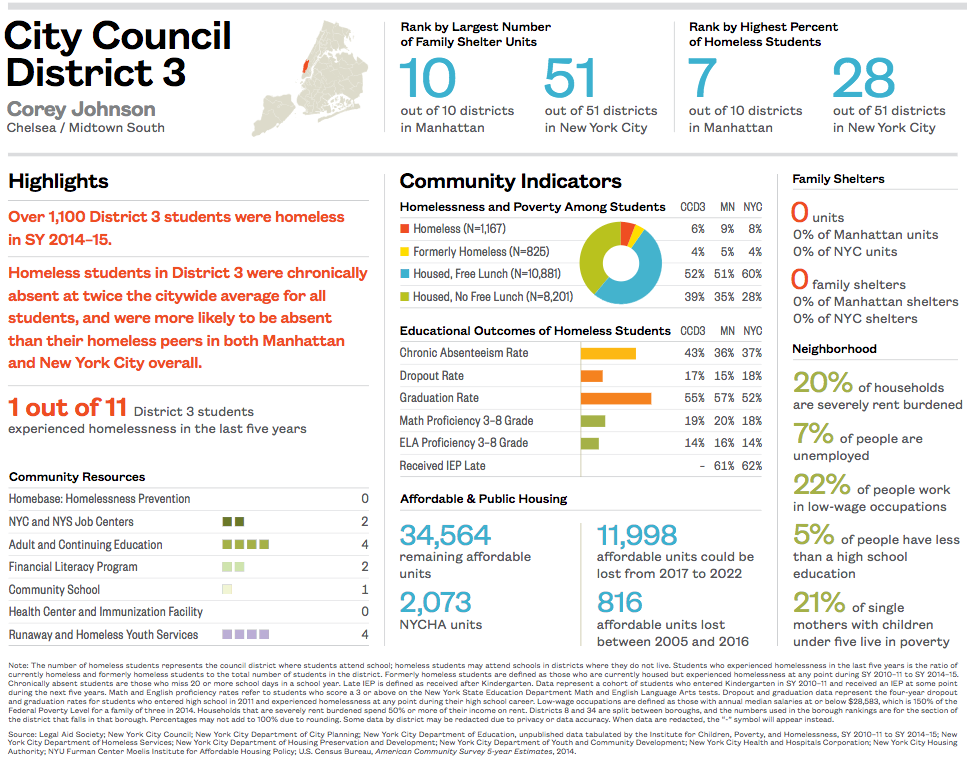
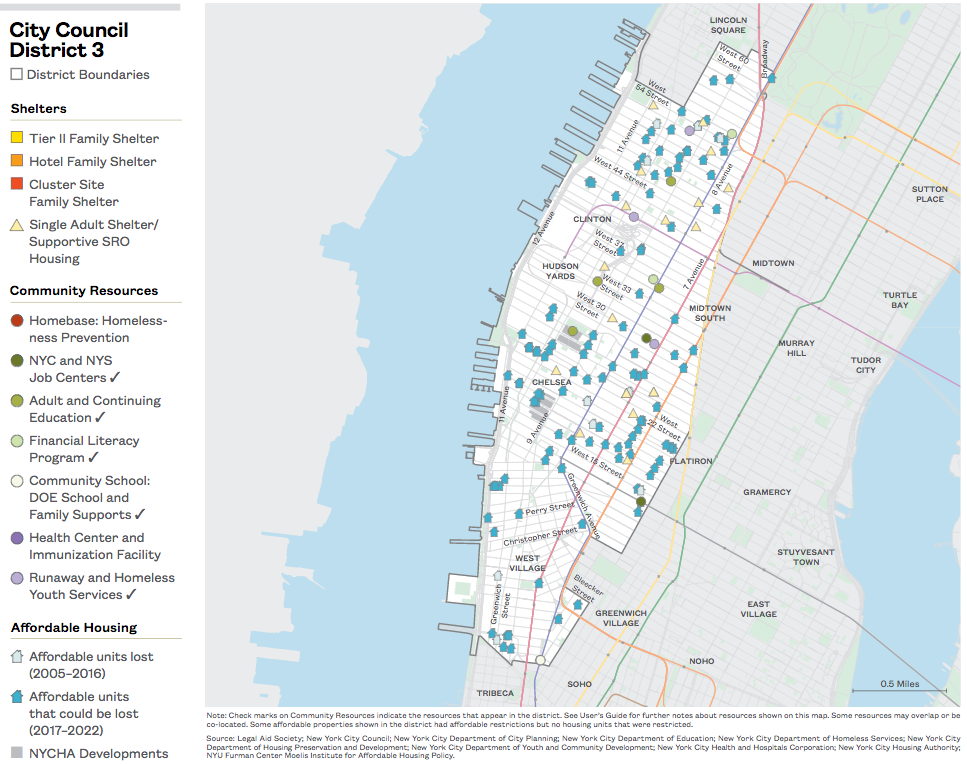
Download City Council District 3
City Council District 4
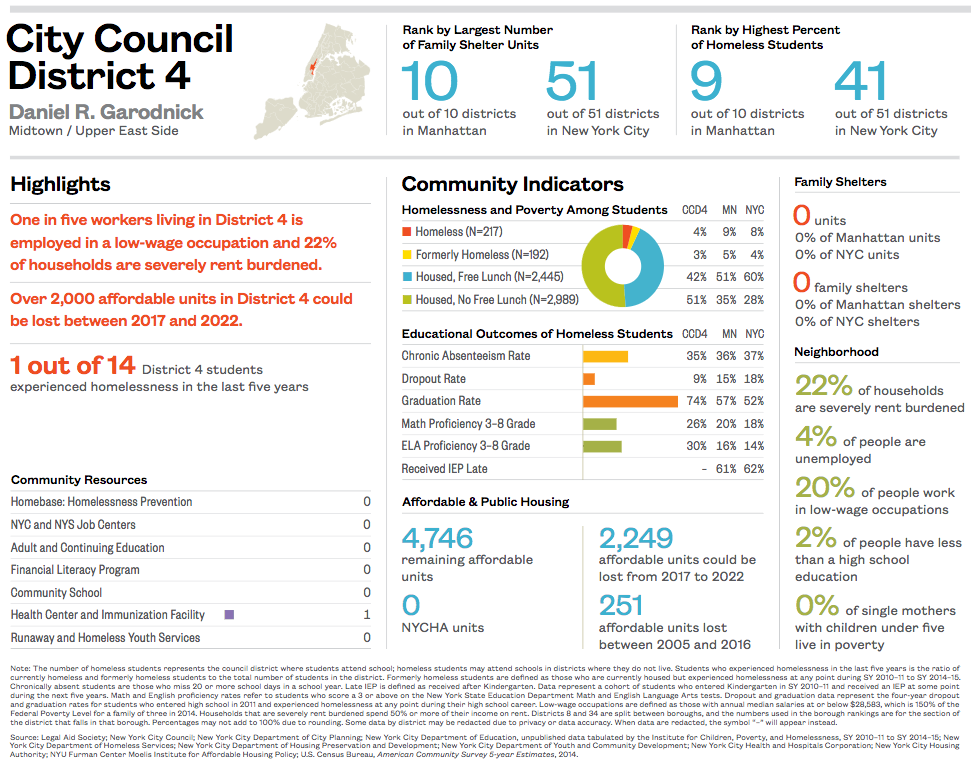
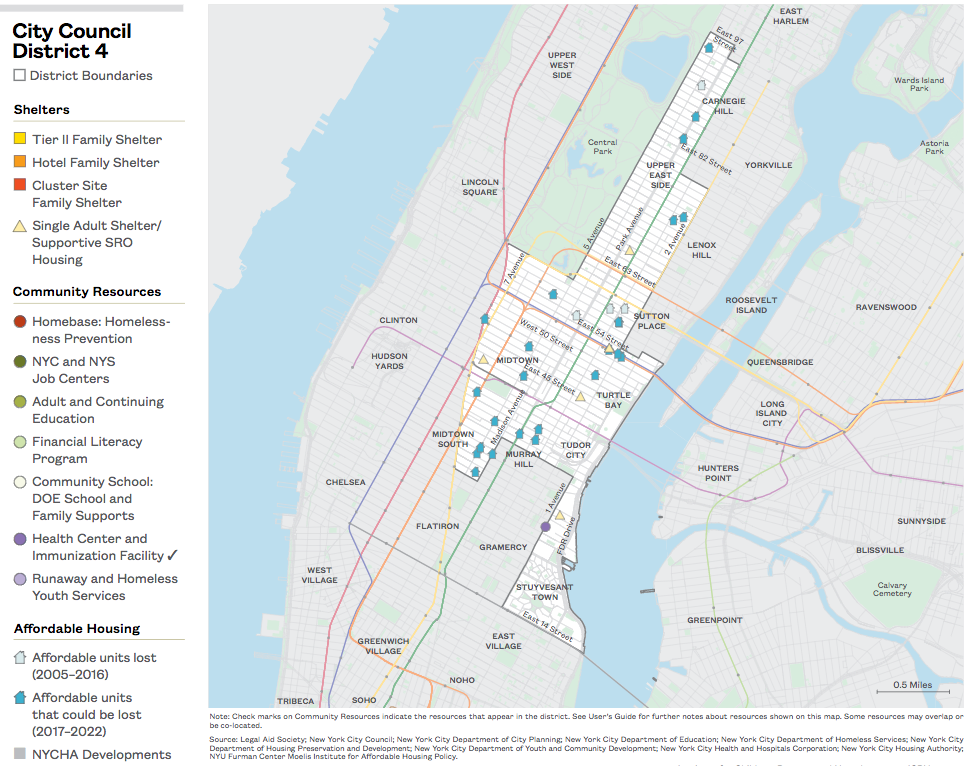
Download City Council District 4
City Council District 5
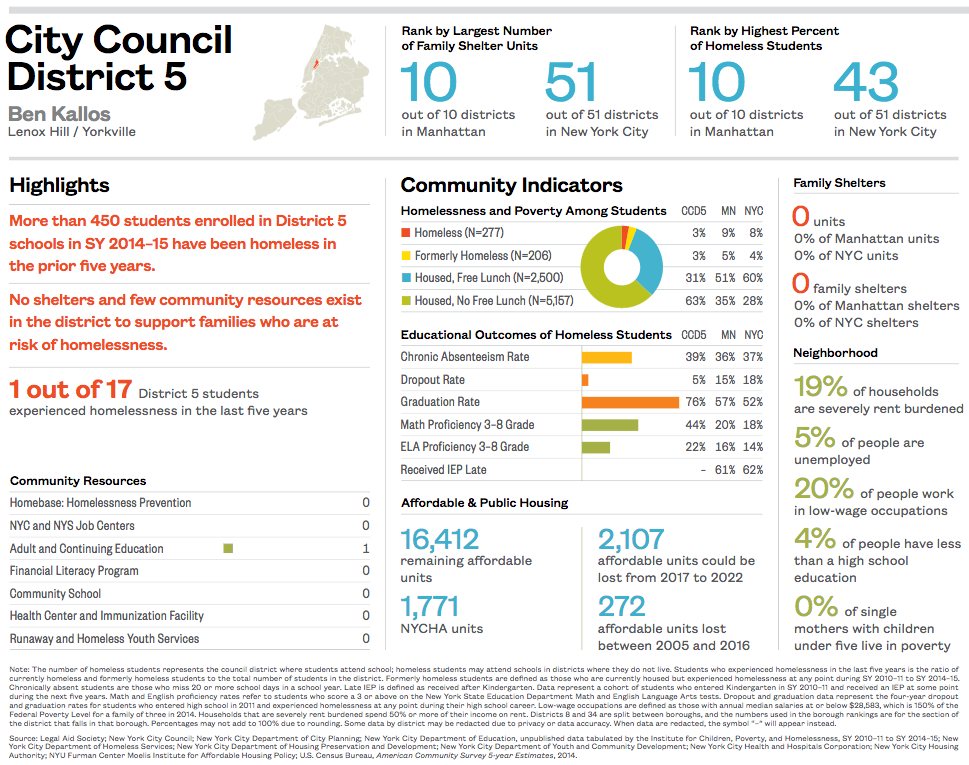
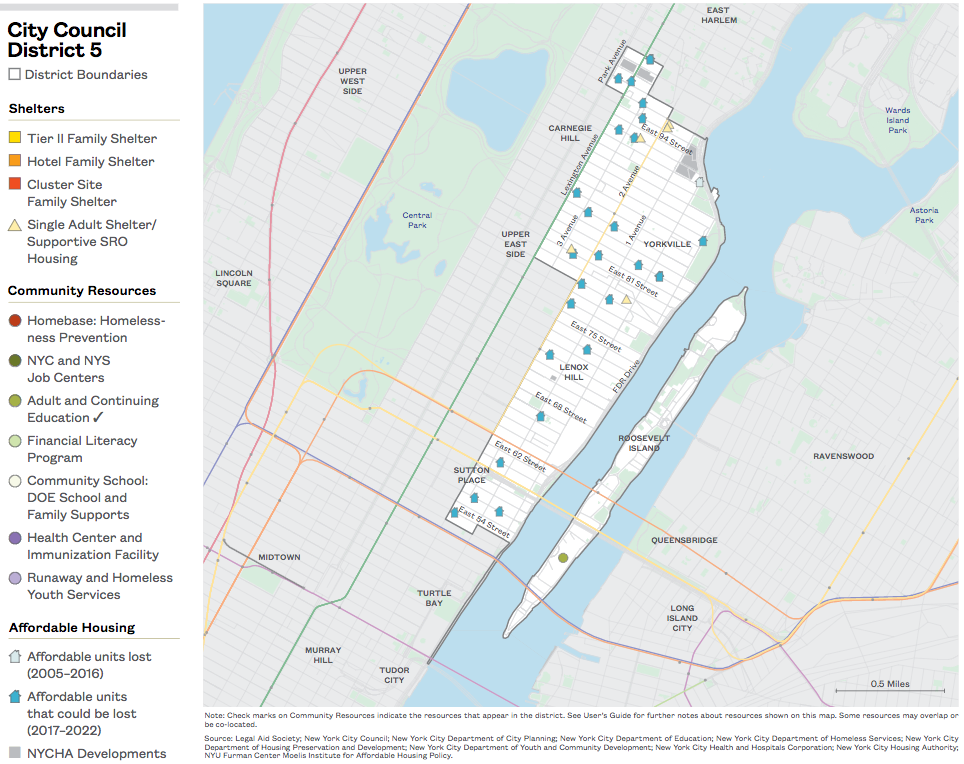
Download City Council District 5
City Council District 6
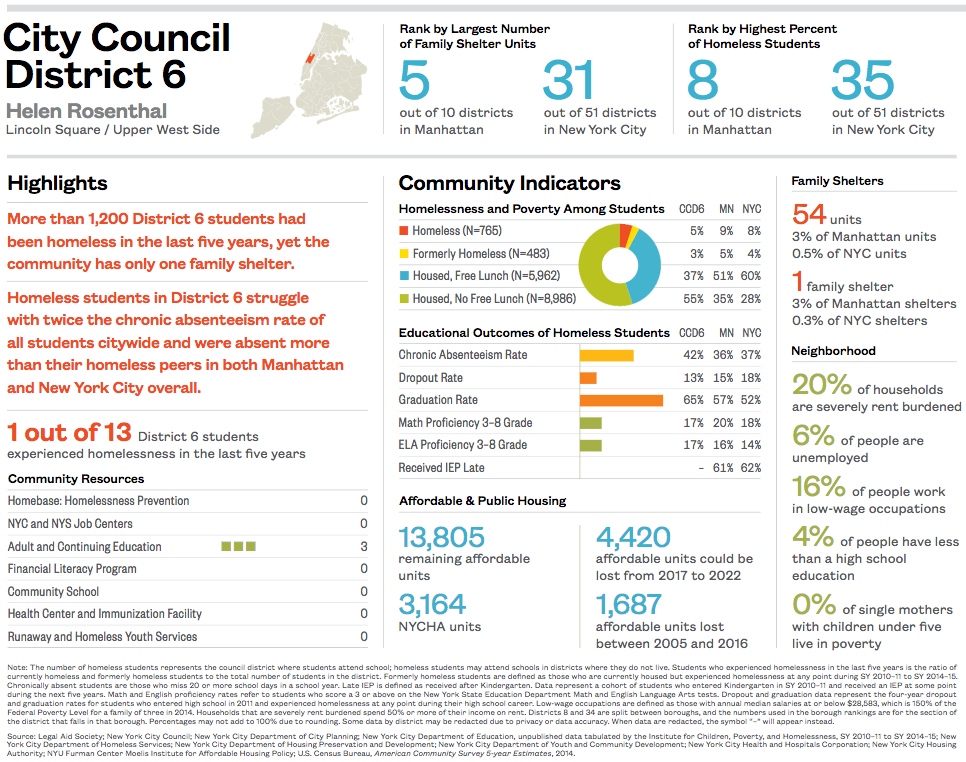
Download City Council District 6
City Council District 7
Download City Council District 7
City Council District 8
Download City Council District 8
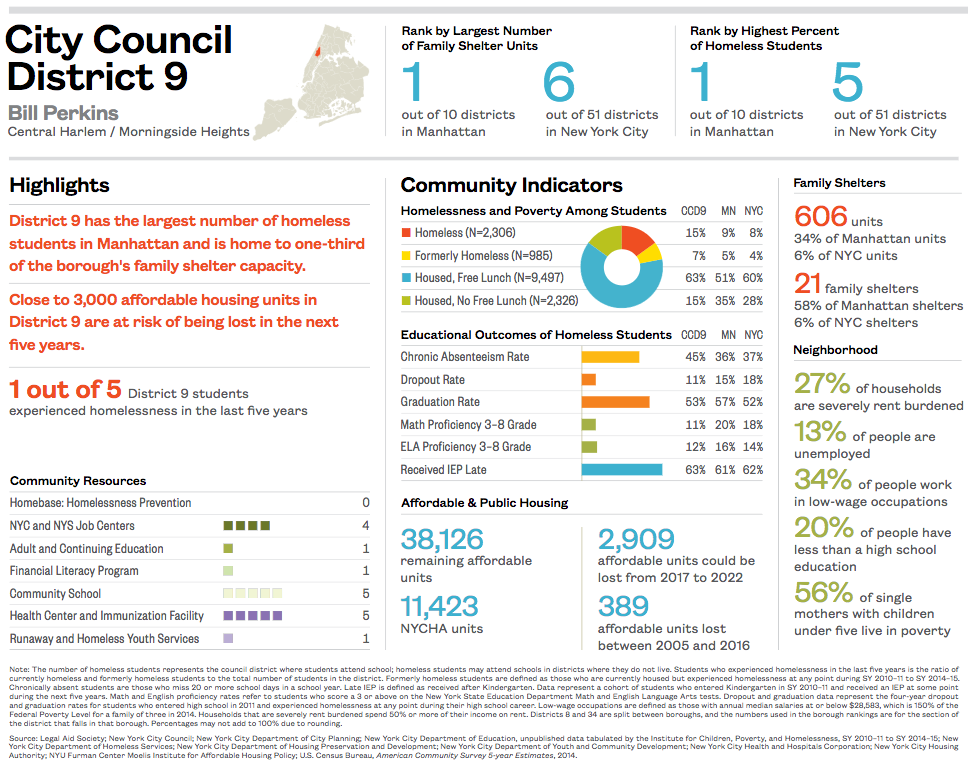
City Council District 9
Download City Council District 9
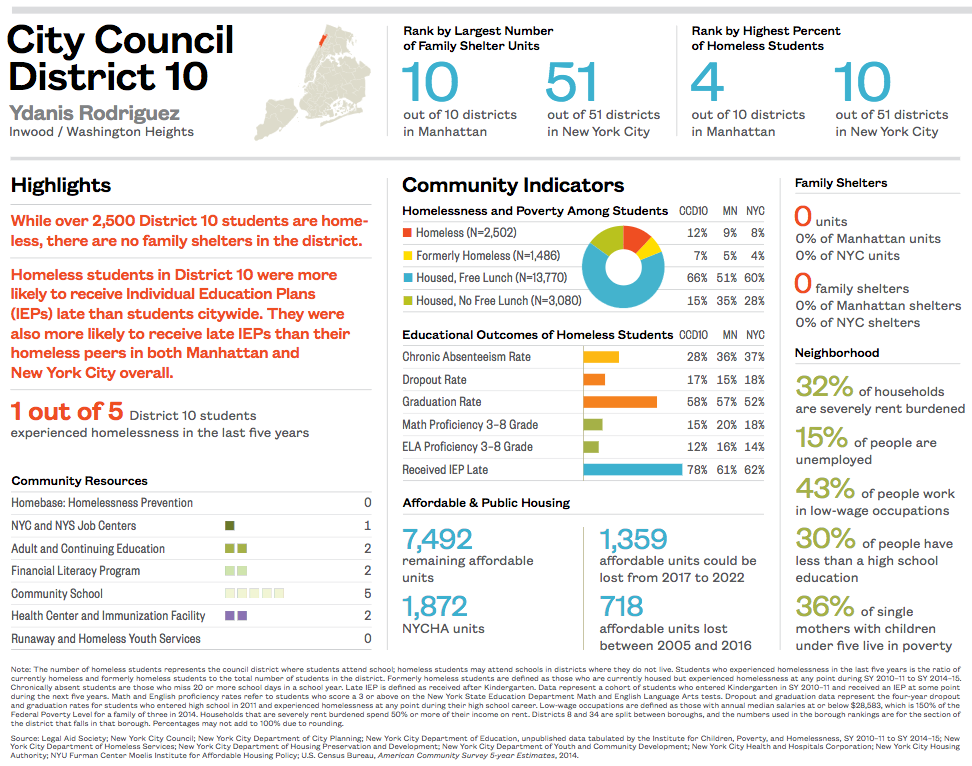
City Council District 10
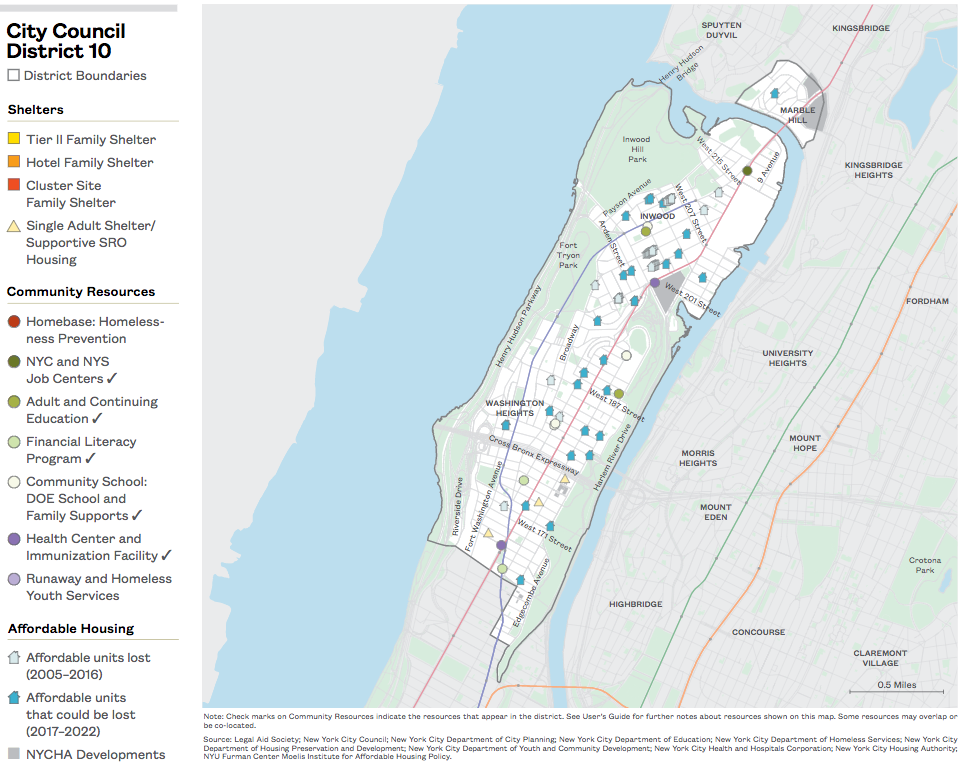
Download City Council District 10
City Council District 11

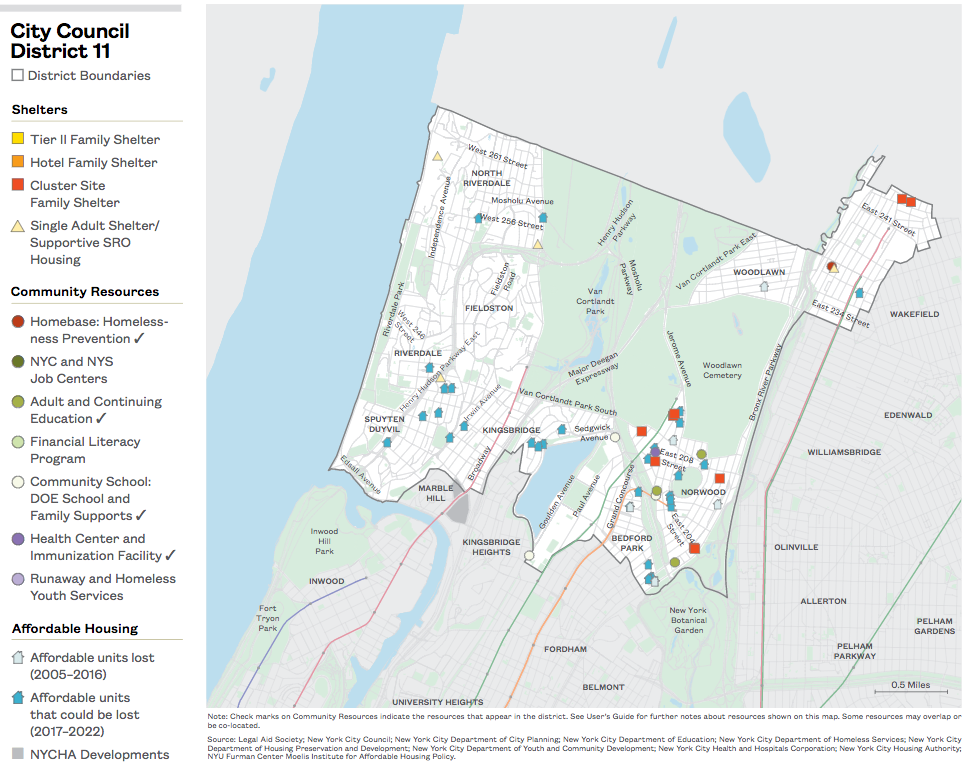
Download City Council District 11
City Council District 12

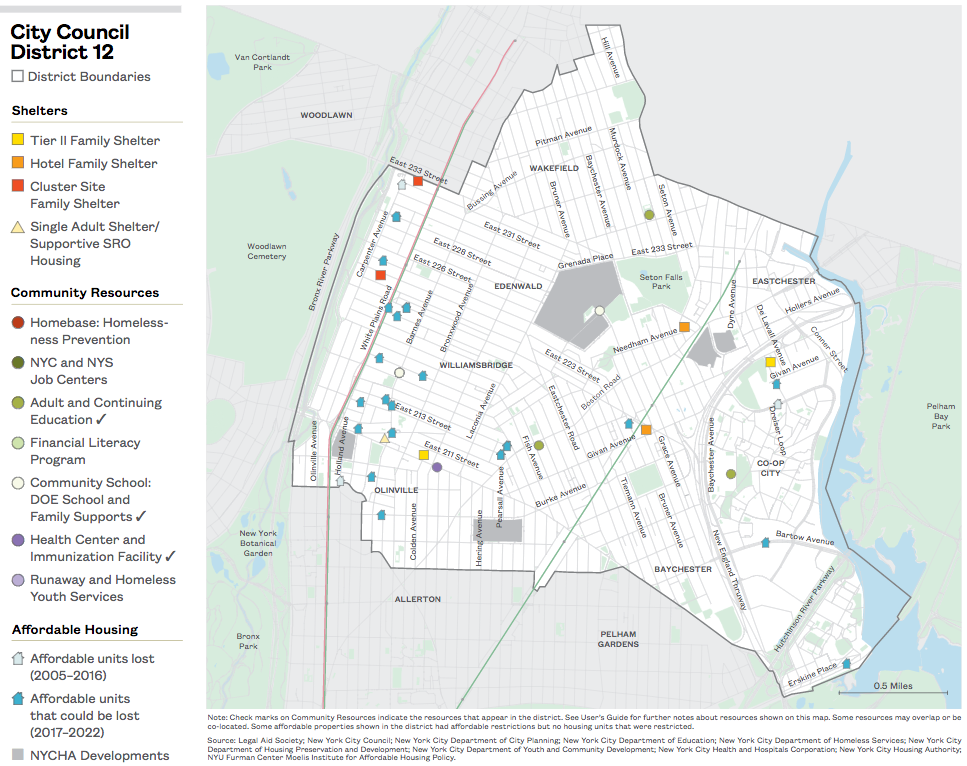
Download City Council District 12
City Council District 13
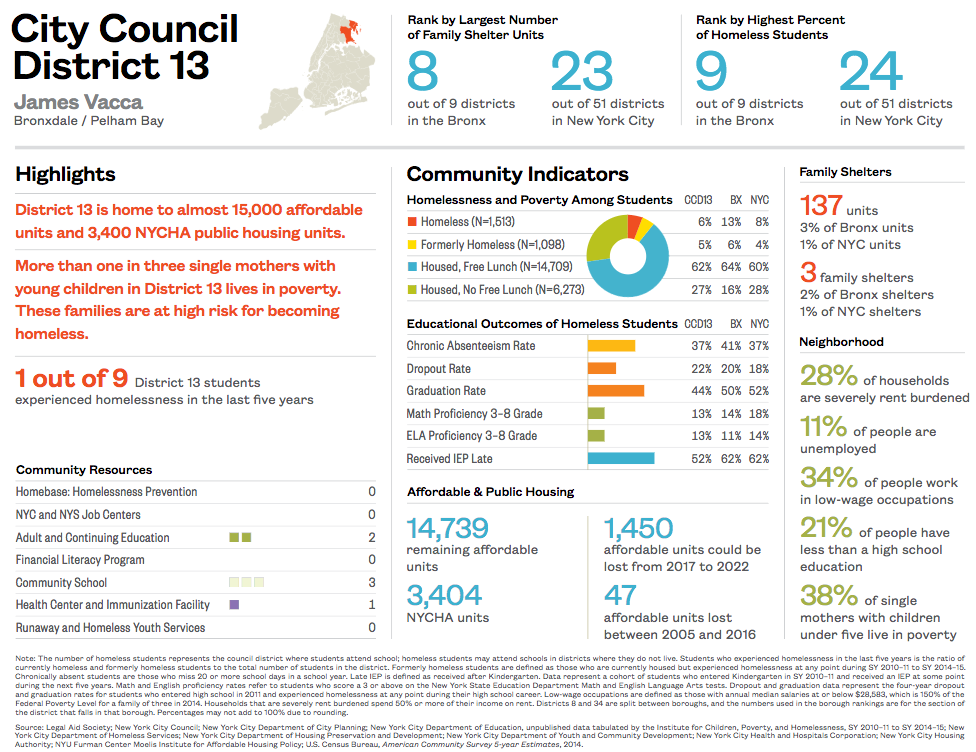
Download City Council District 13
City Council District 14
Download City Council District 14
City Council District 15
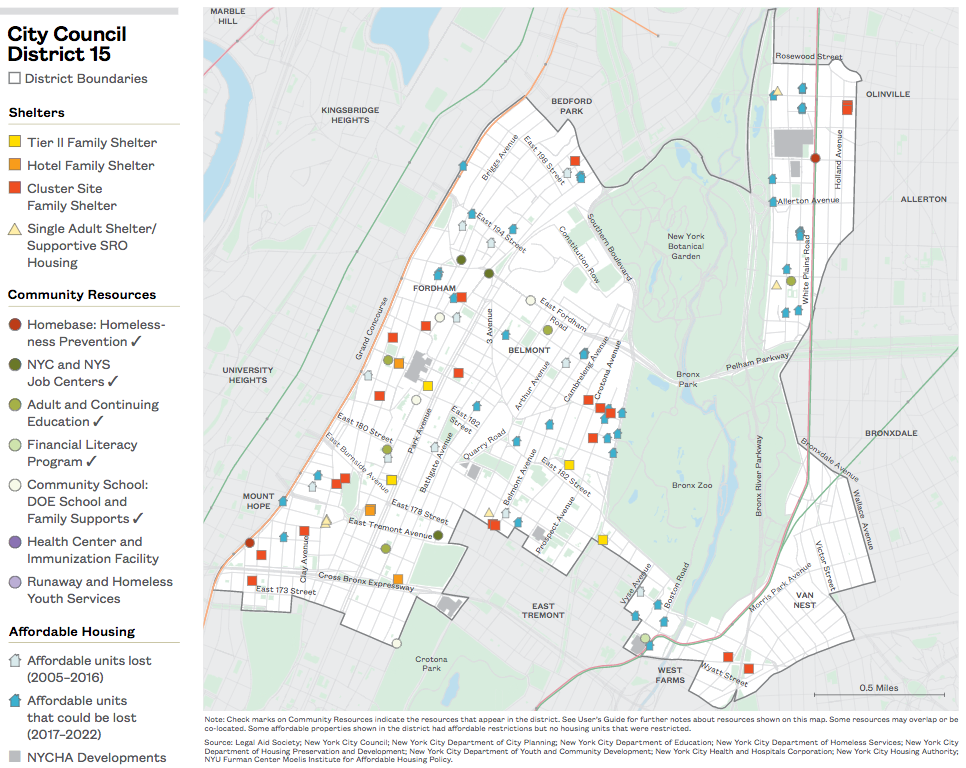
Download City Council District 15
City Council District 16
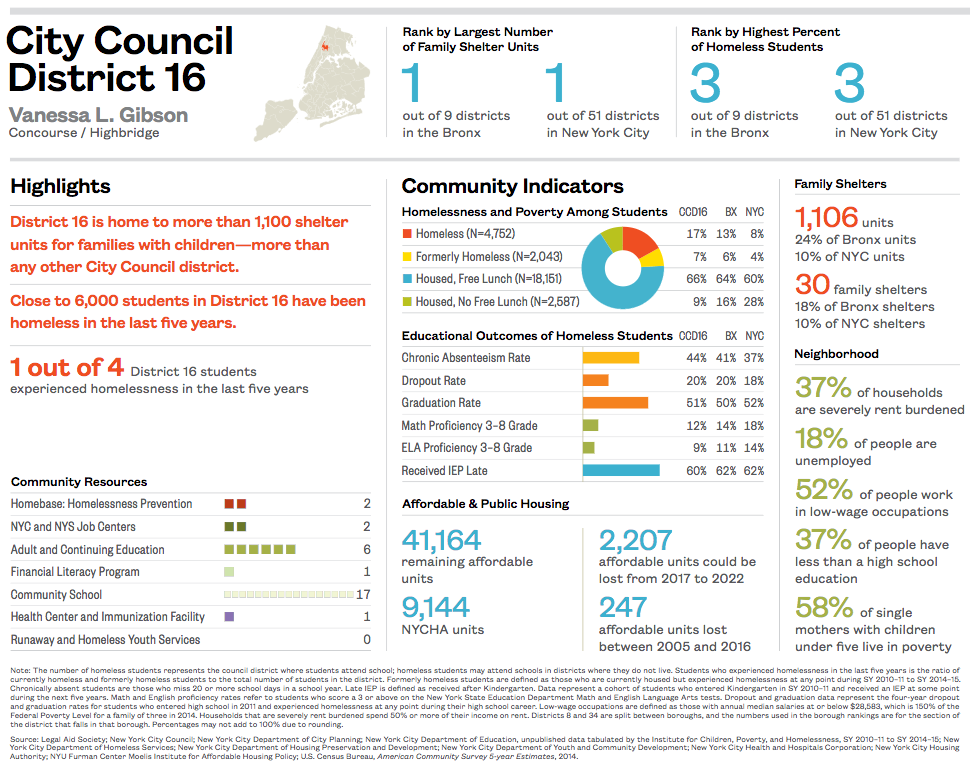
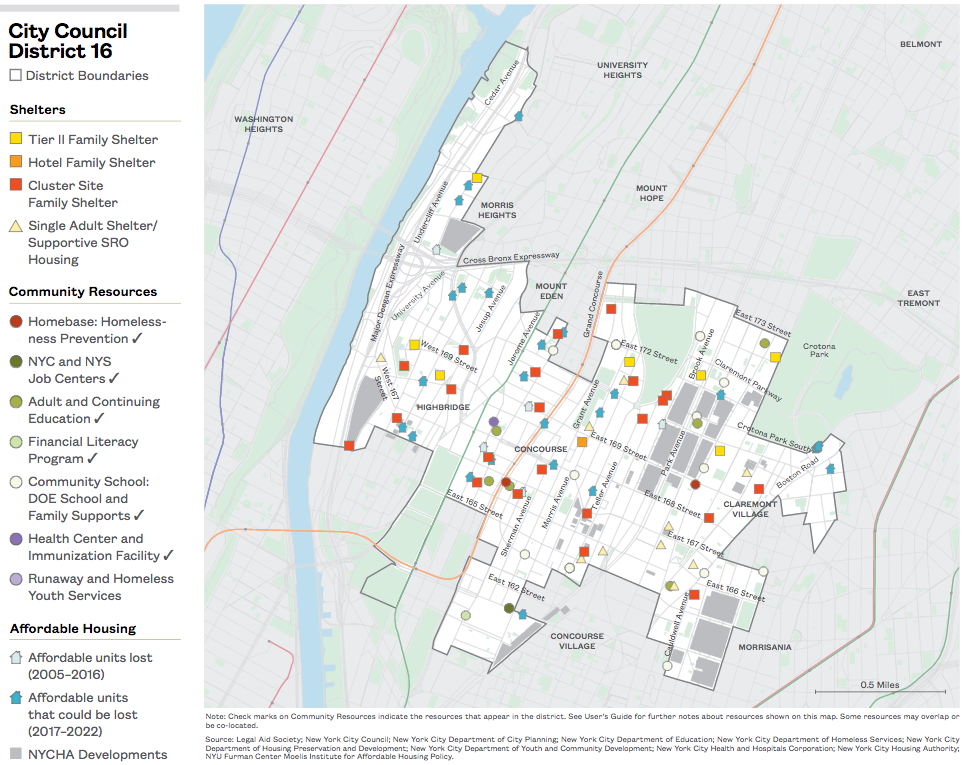
Download City Council District 16
City Council District 17
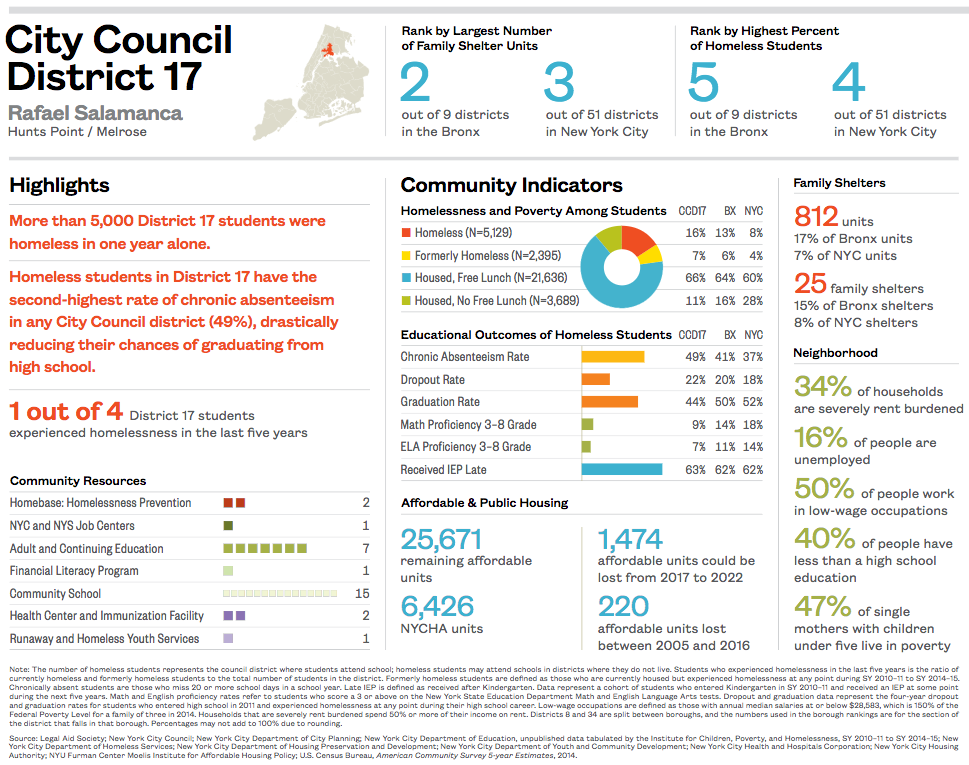
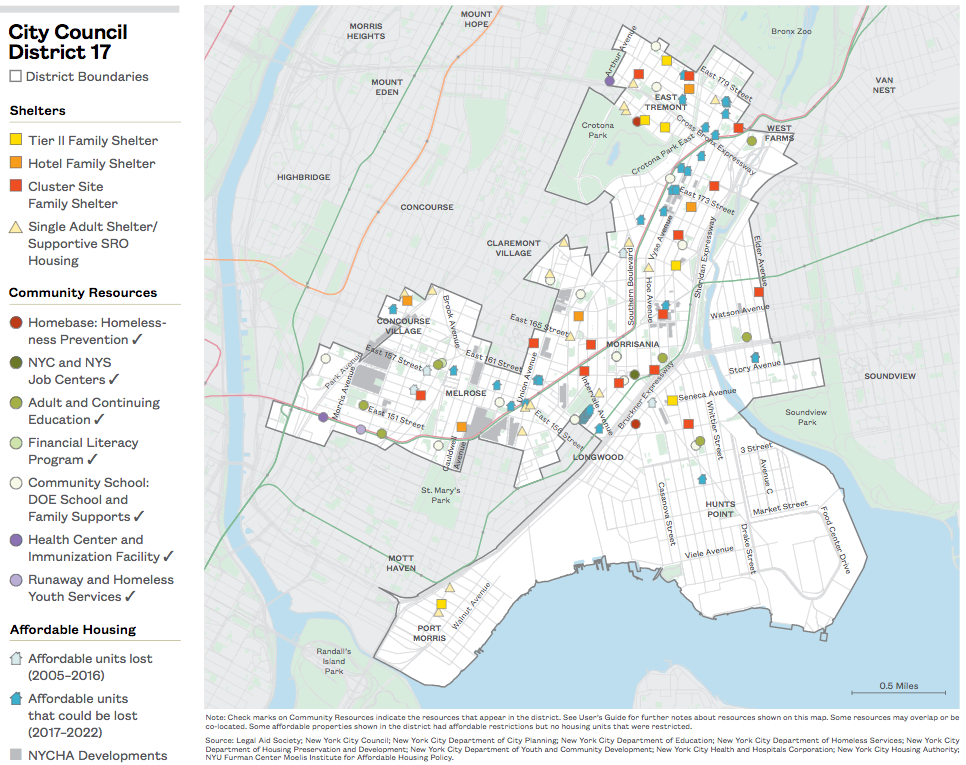
Download City Council District 17
City Council District 18
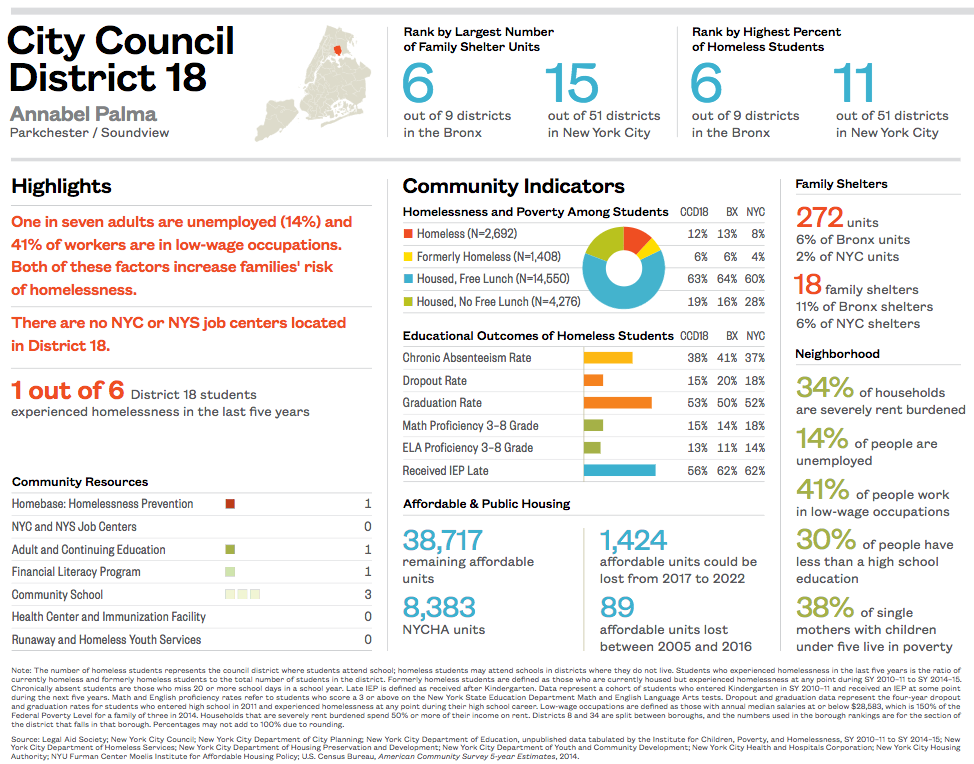
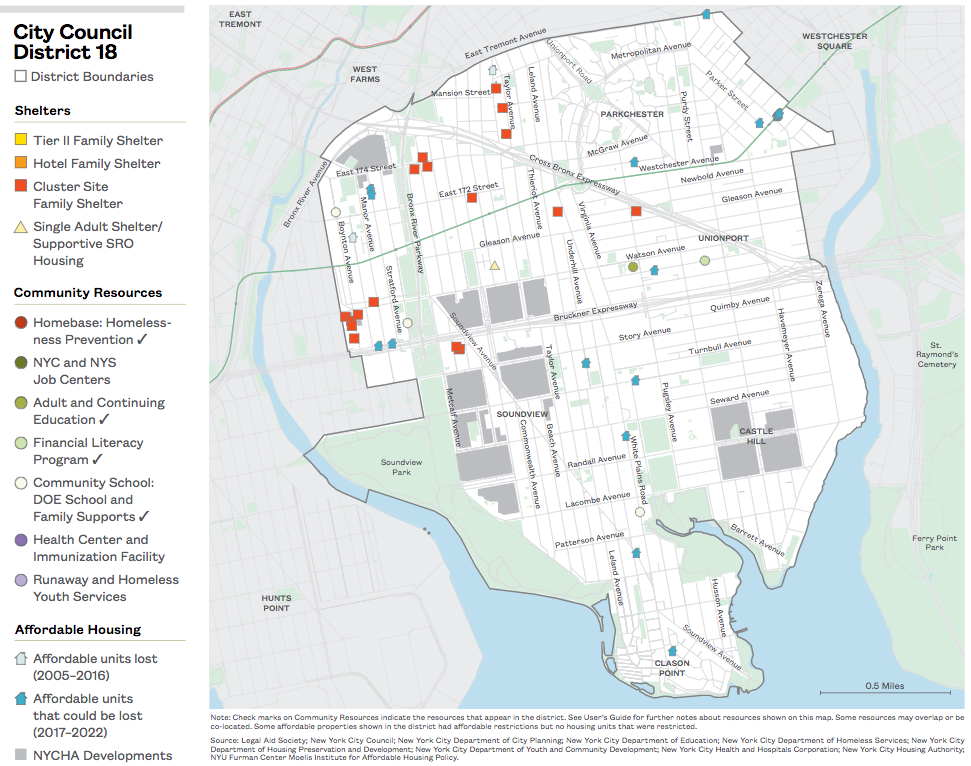
Download City Council District 18
City Council District 19
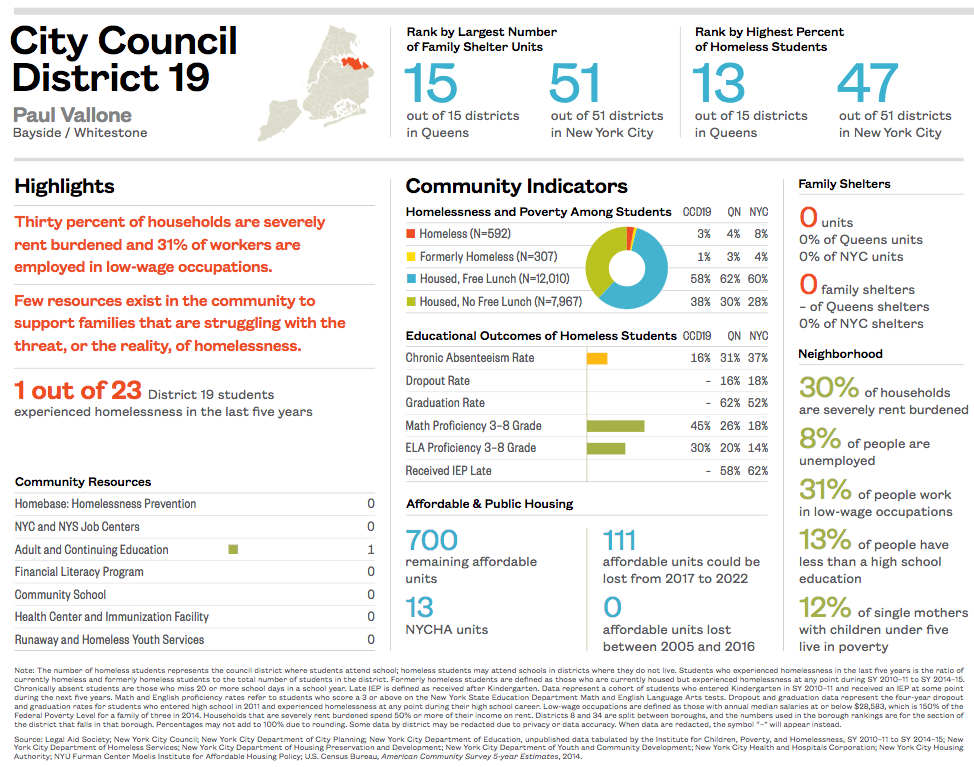
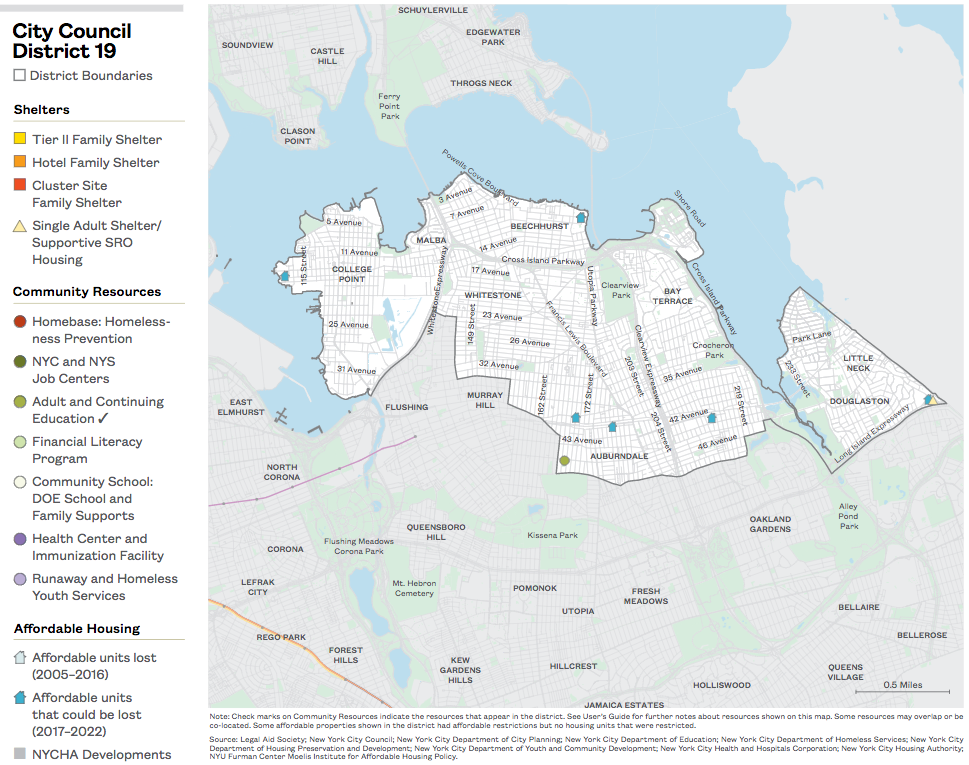
Download City Council District 19
City Council District 20
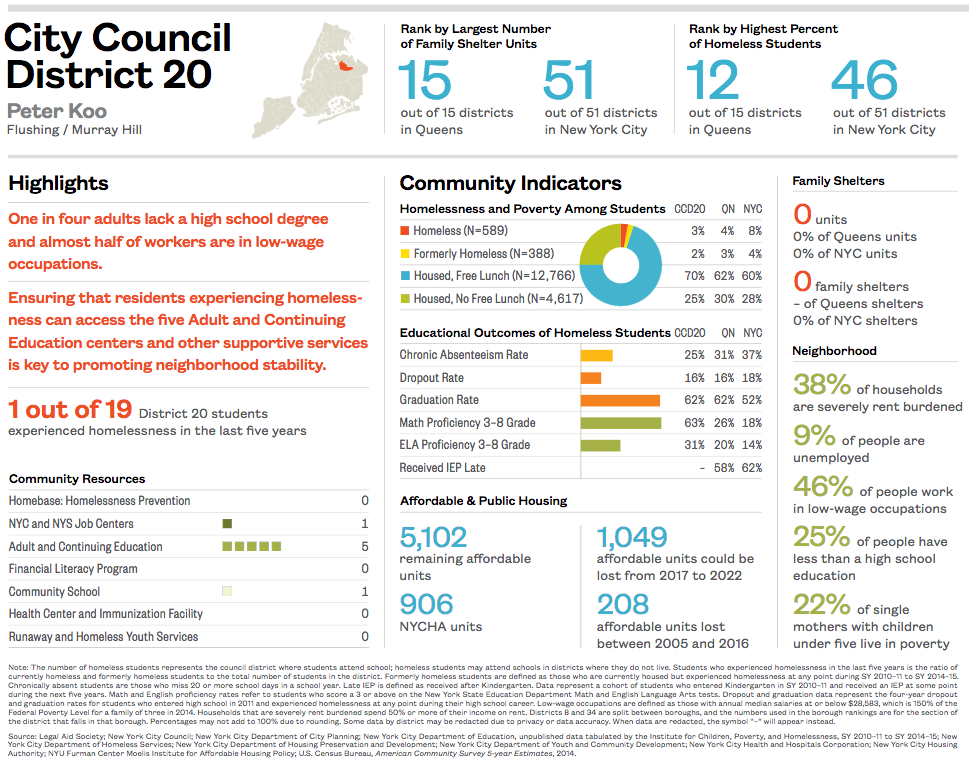
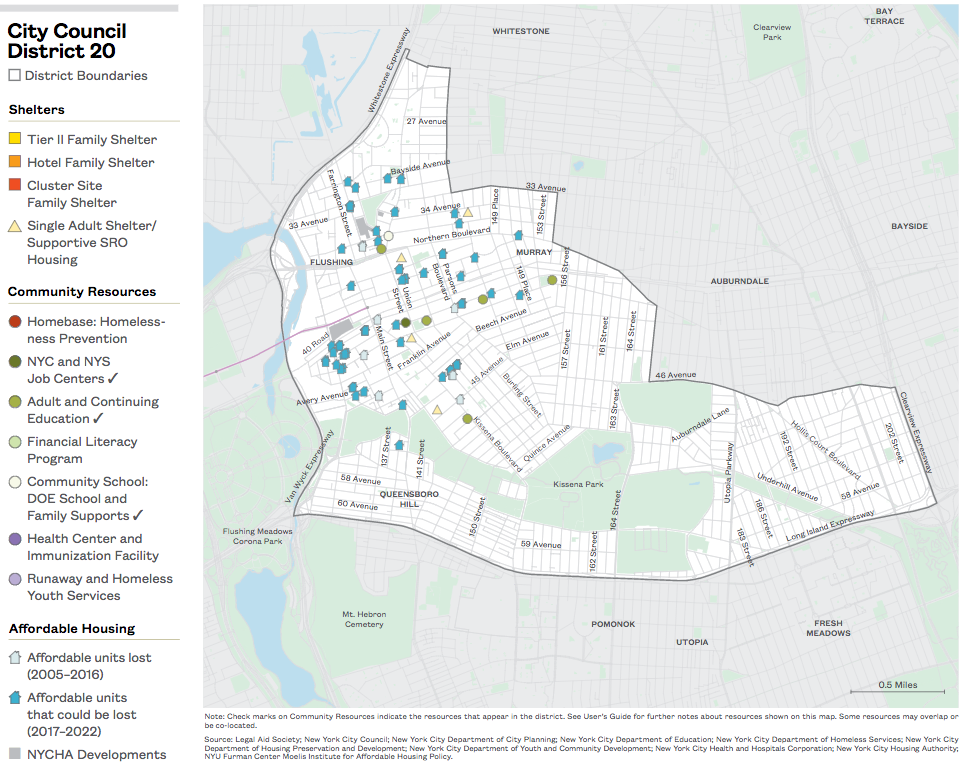
Download City Council District 20
City Council District 21
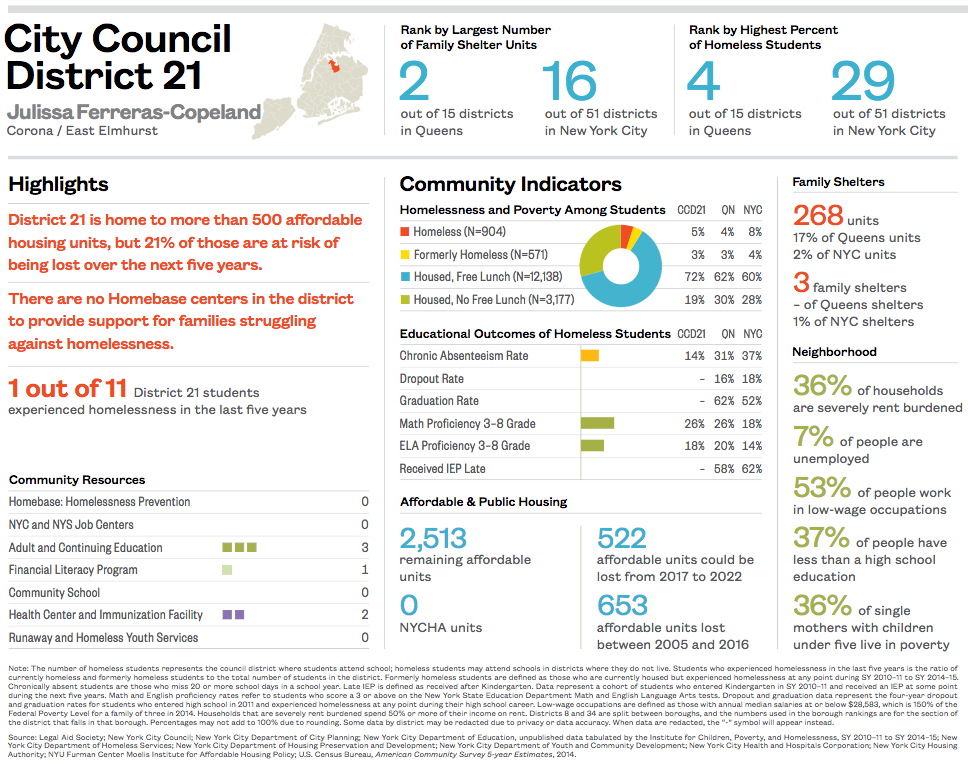
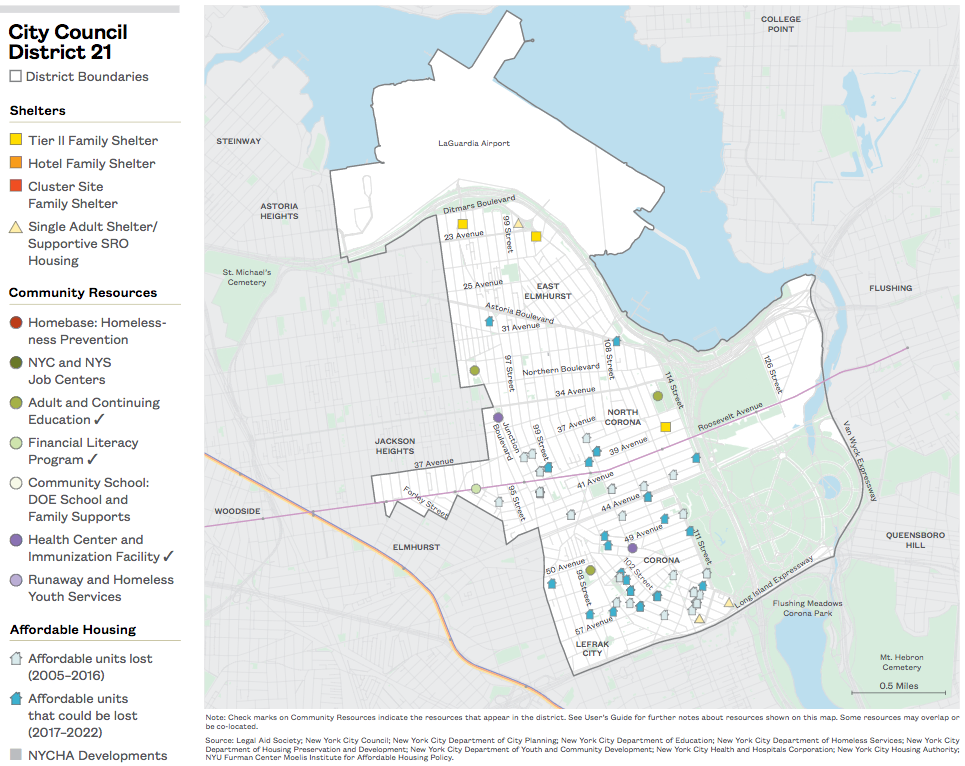
Download City Council District 21
City Council District 22
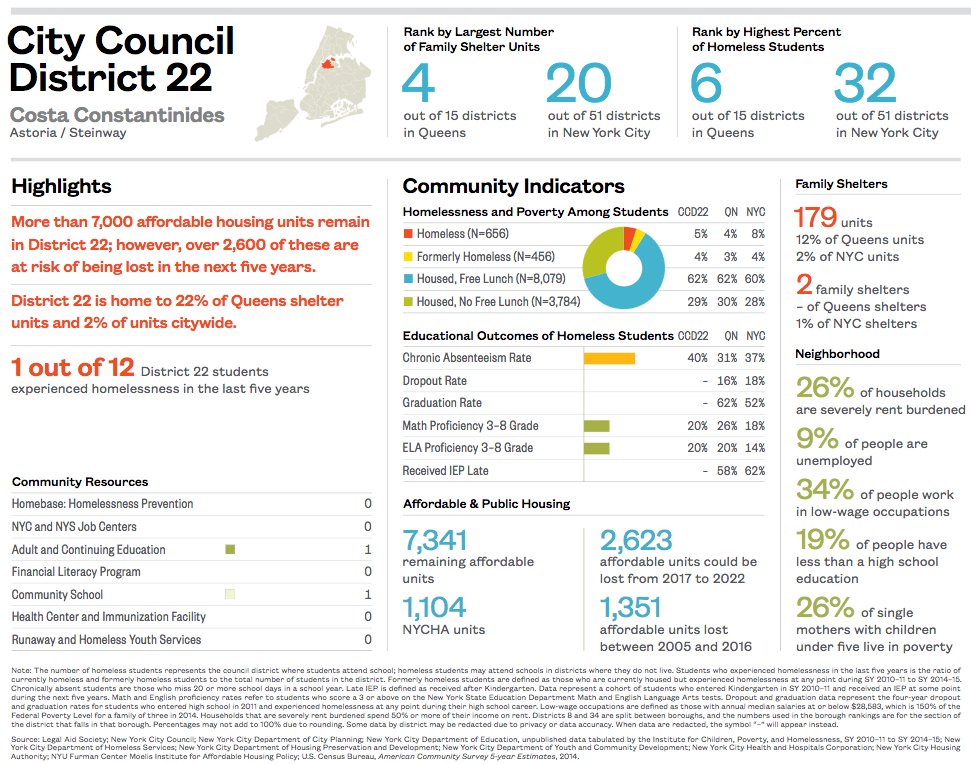
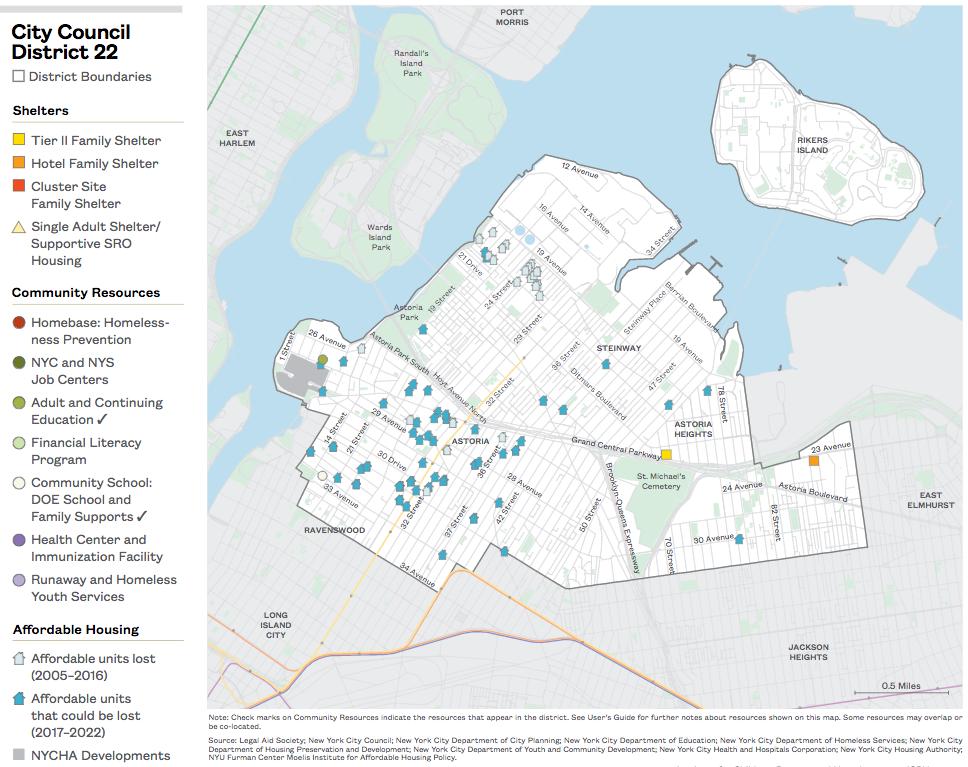
Download City Council District 22
City Council District 23
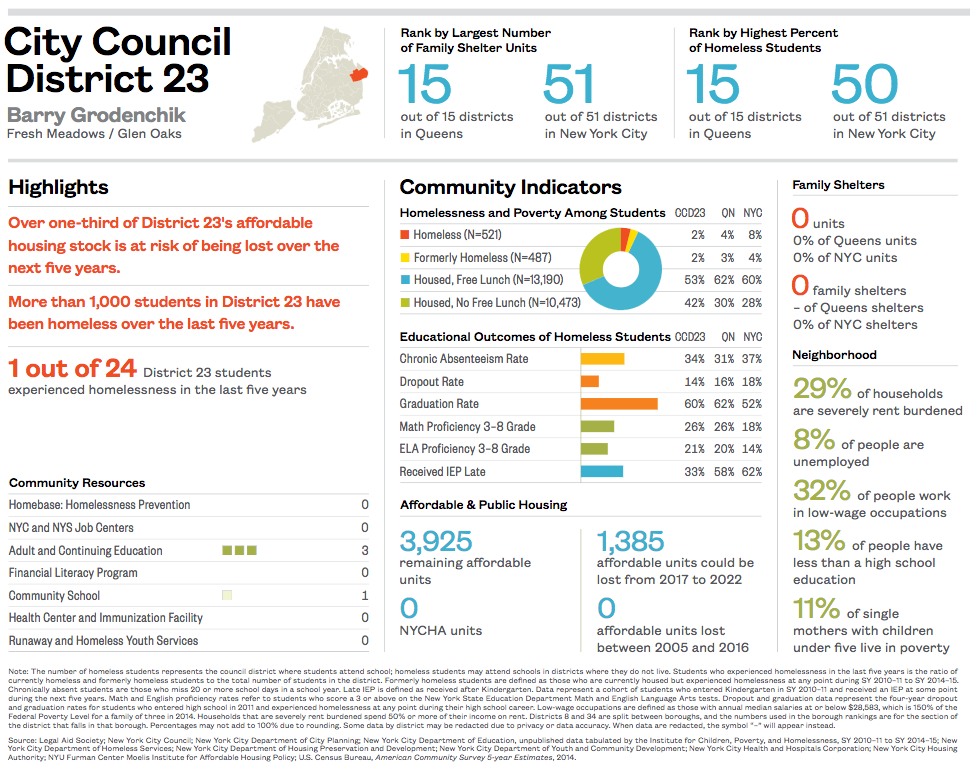
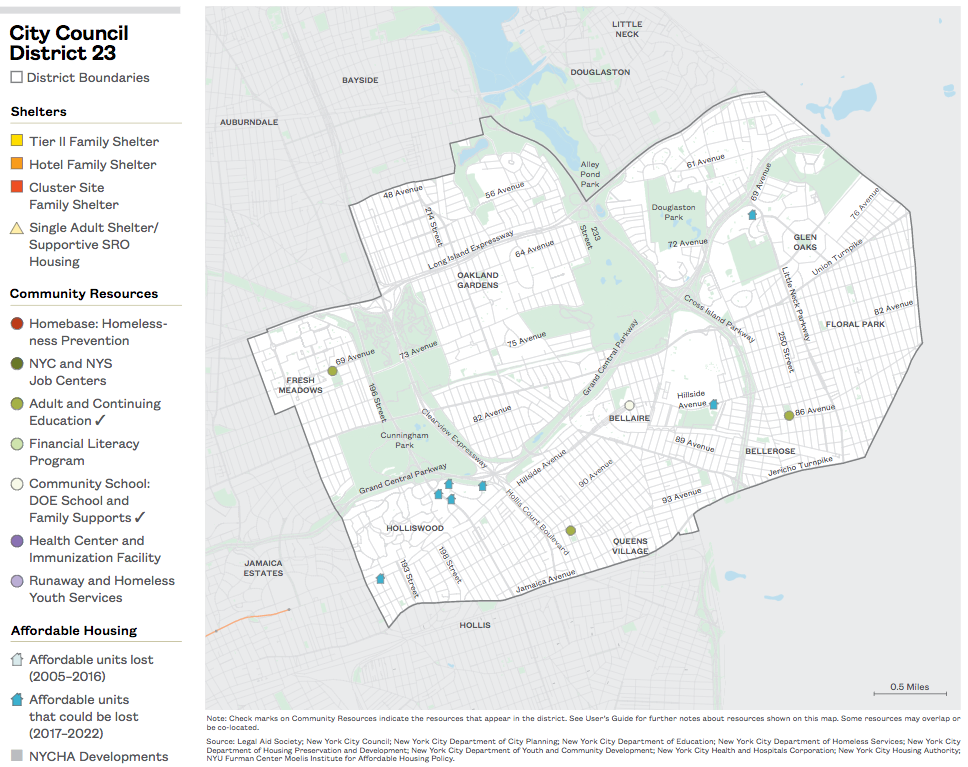
Download City Council District 23
City Council District 24
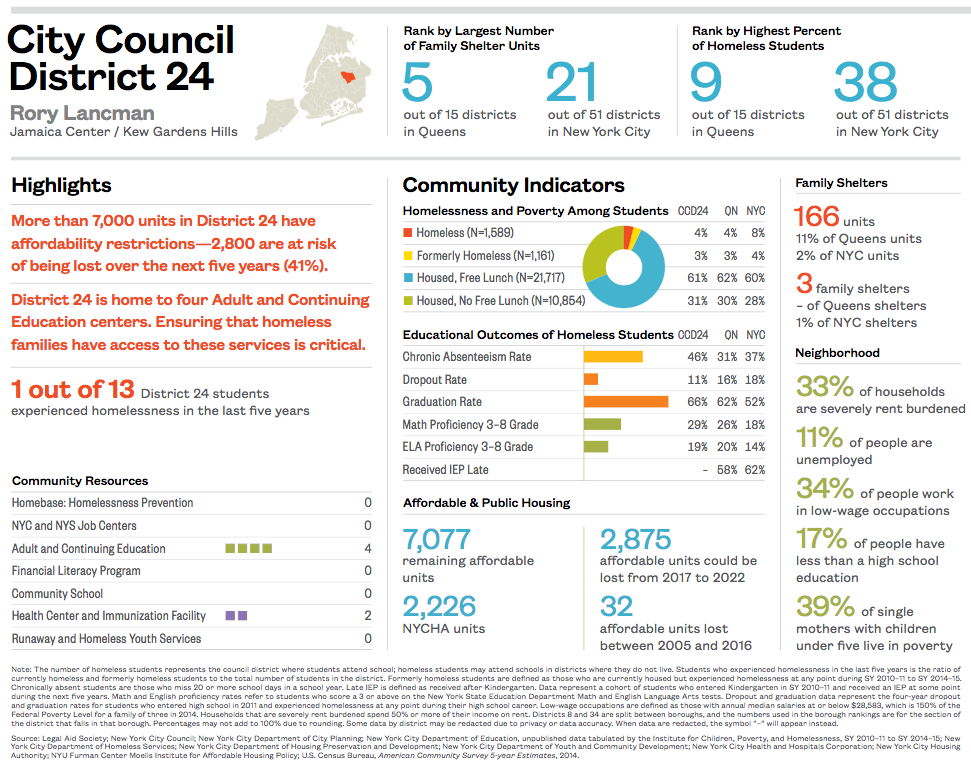
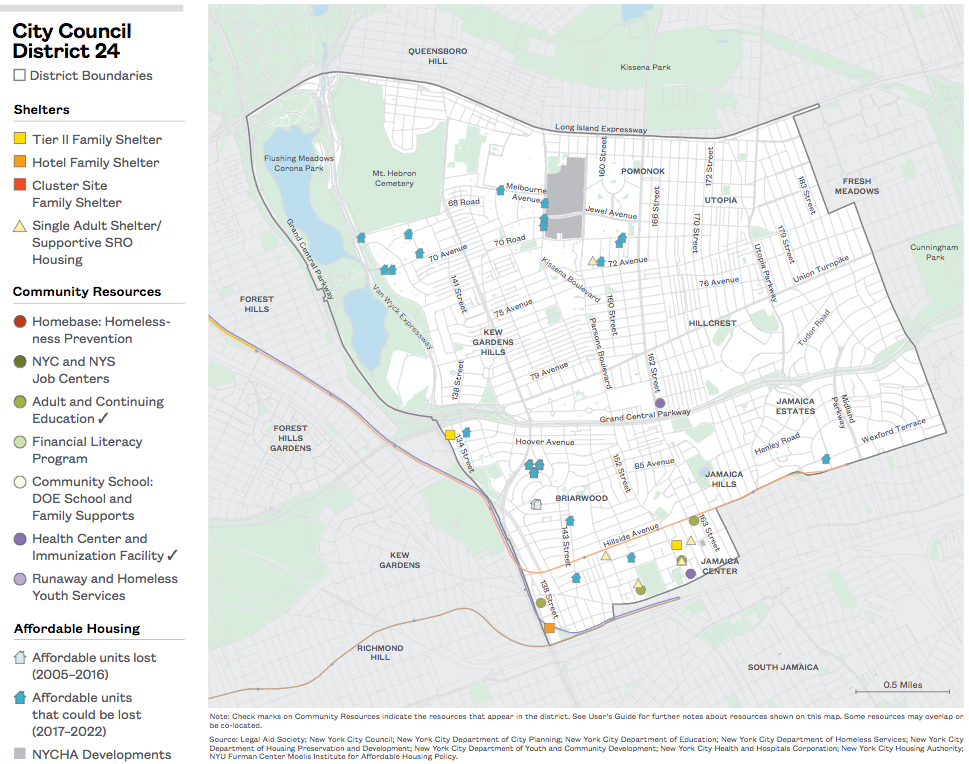
Download City Council District 24
City Council District 25
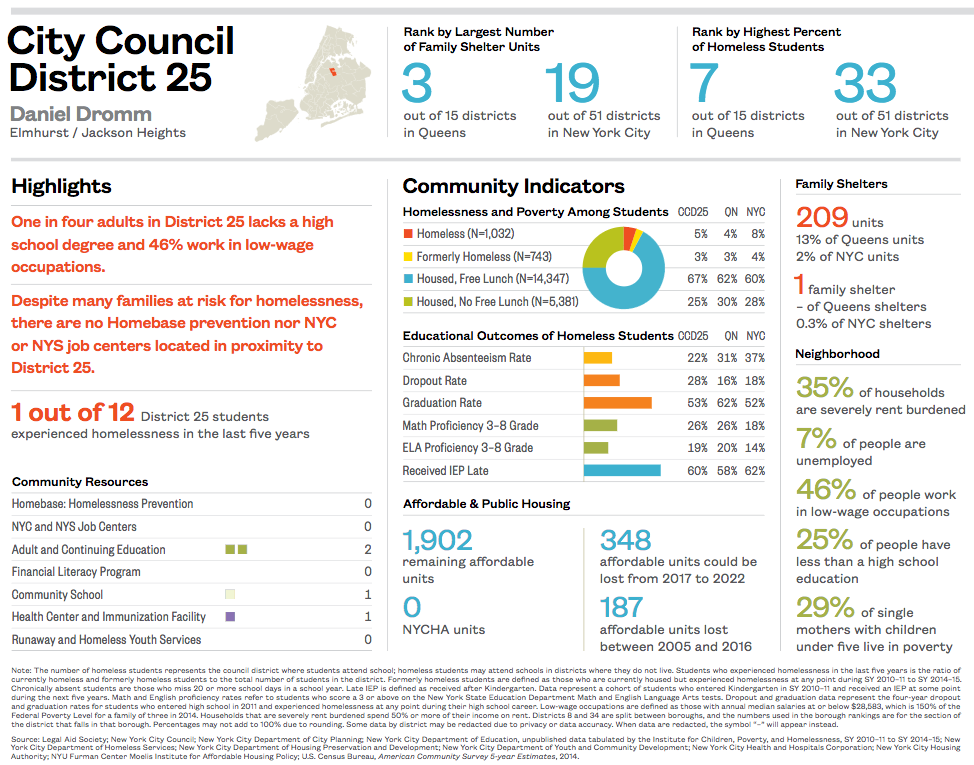
Download City Council District 25
City Council District 26
Download City Council District 26
City Council District 27
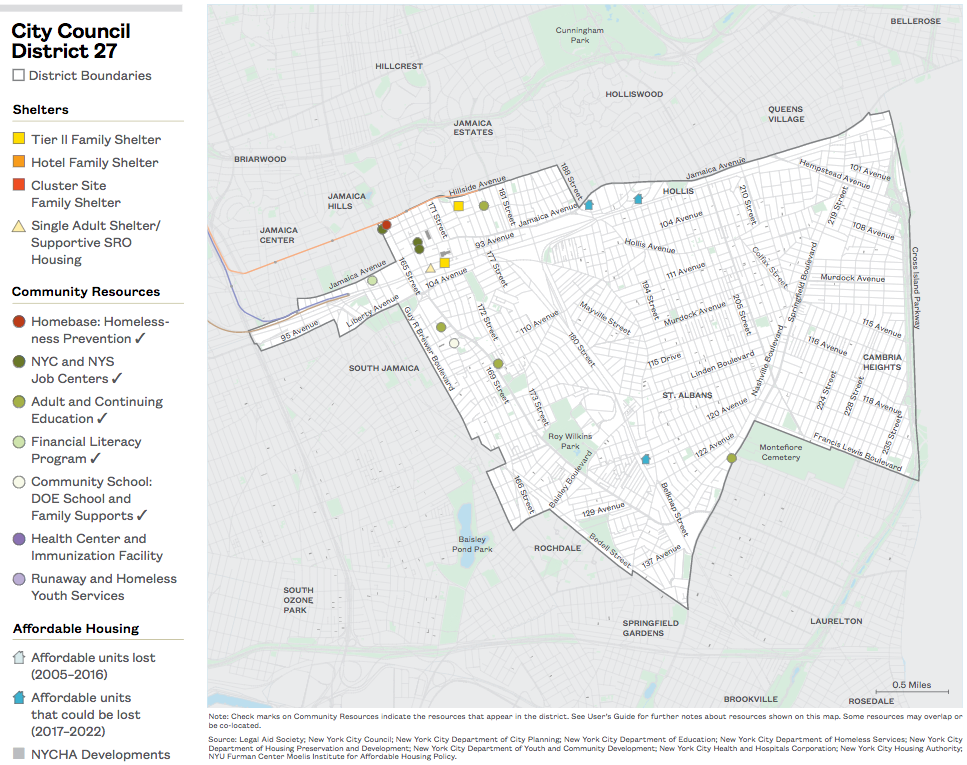
Download City Council District 27
City Council District 28
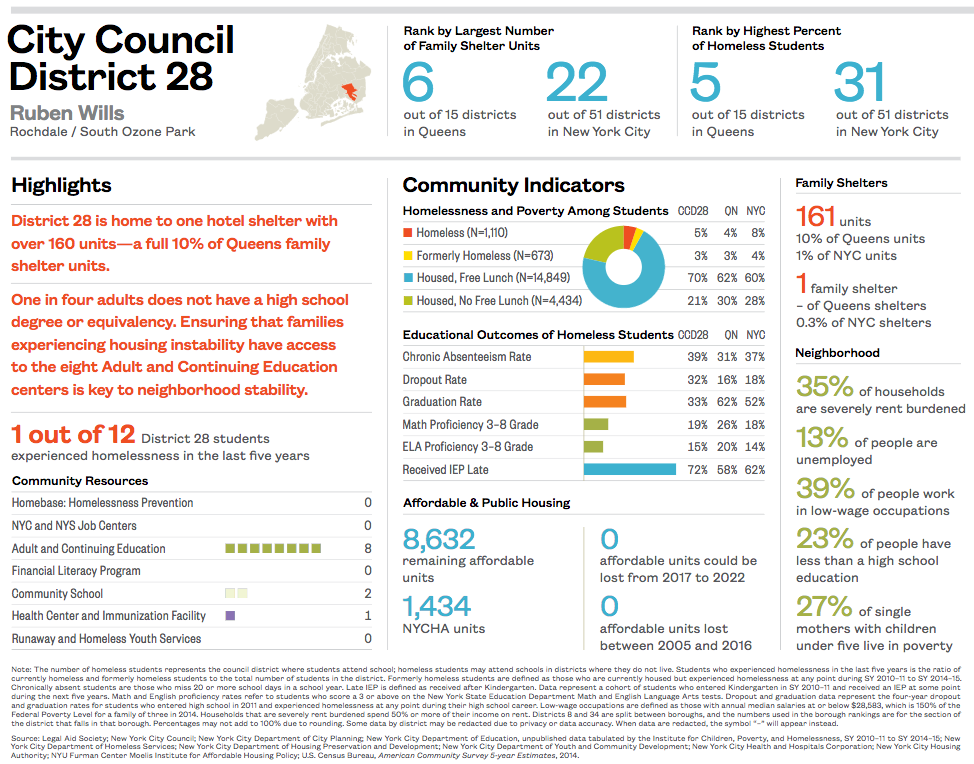
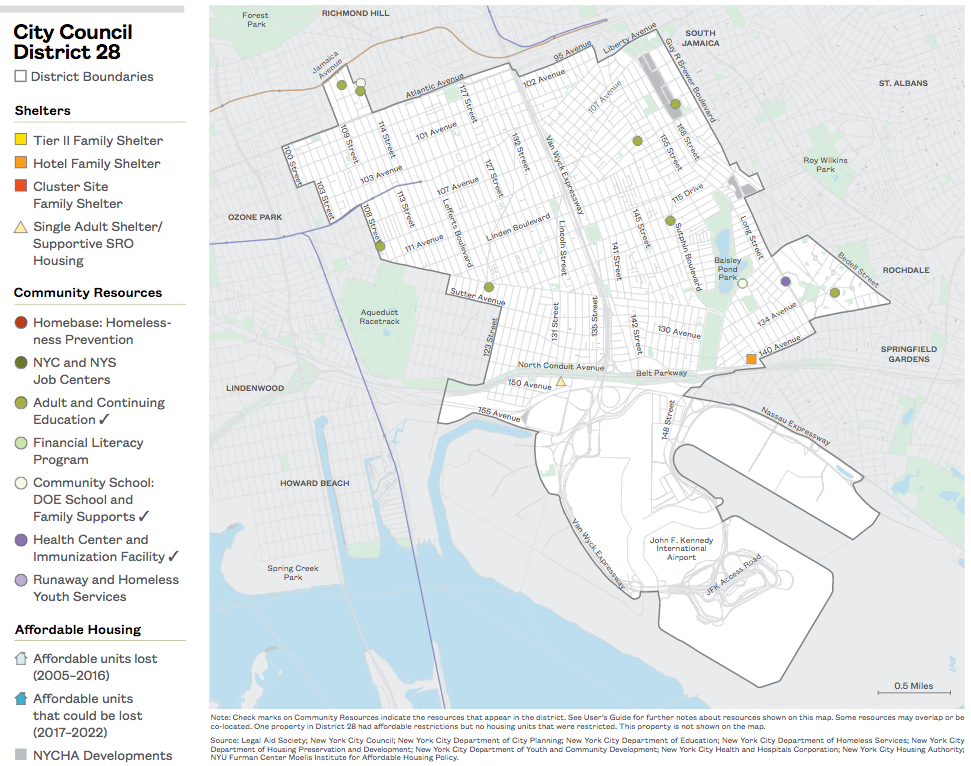
Download City Council District 28
City Council District 29
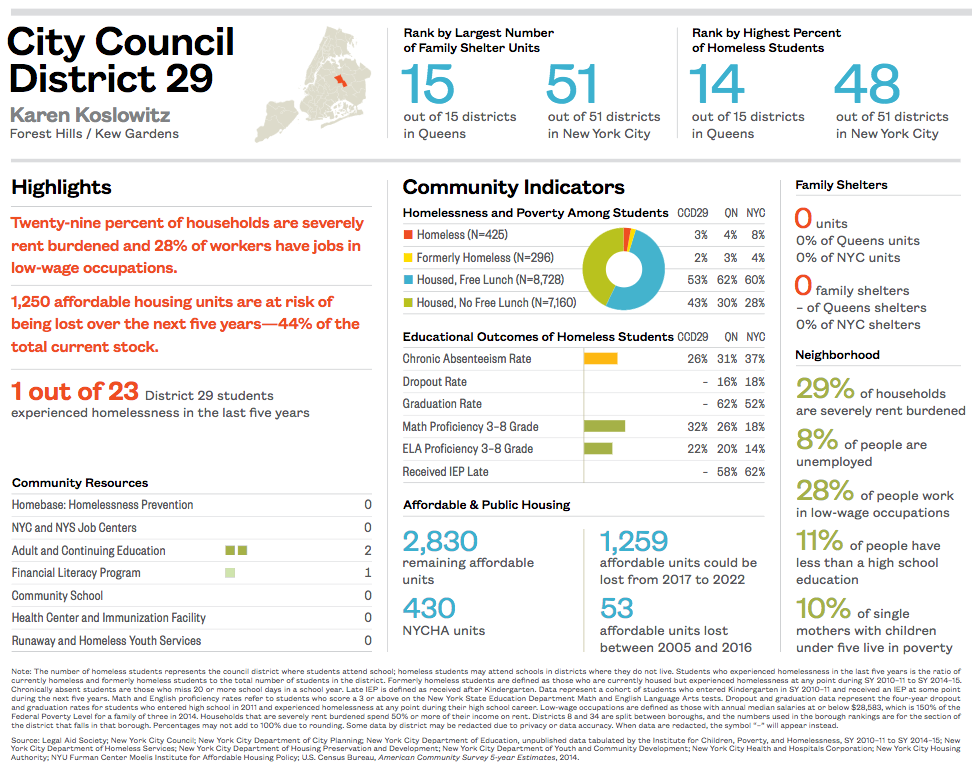
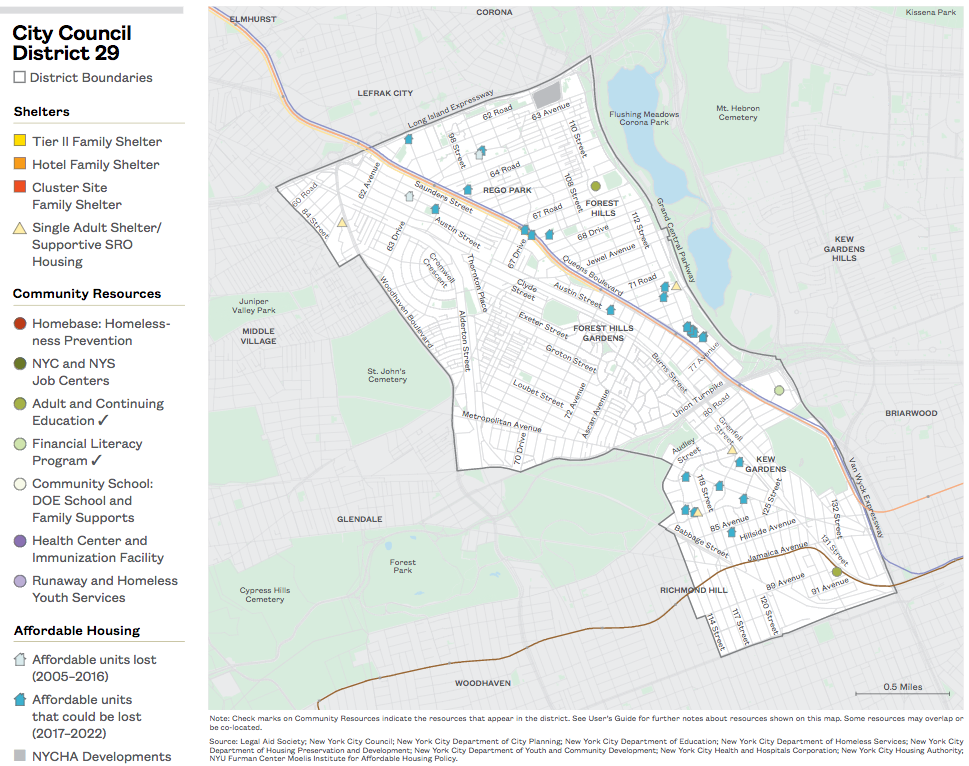
Download City Council District 29
City Council District 30
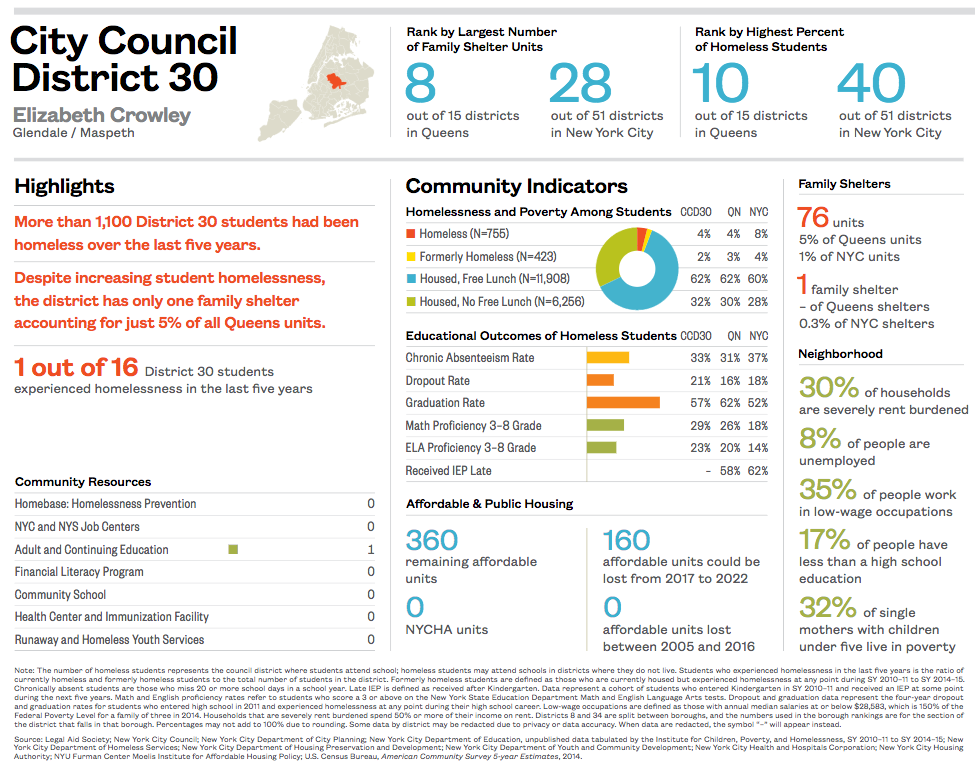
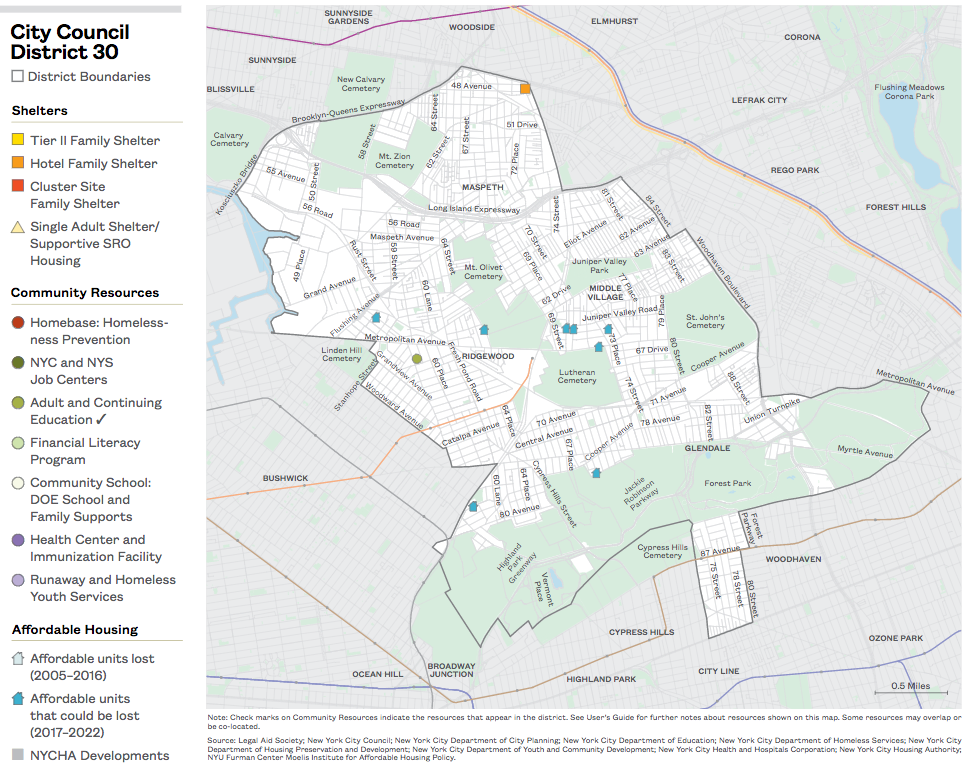
Download City Council District 30
City Council District 31
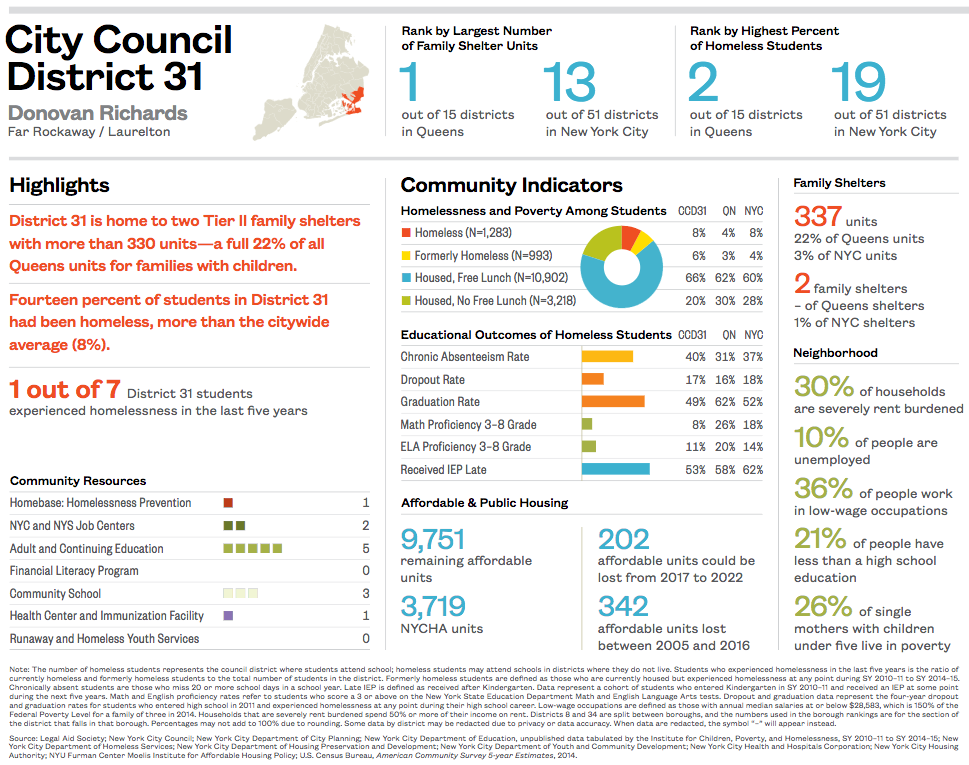
Download City Council District 31
City Council District 32
Download City Council District 32
City Council District 33
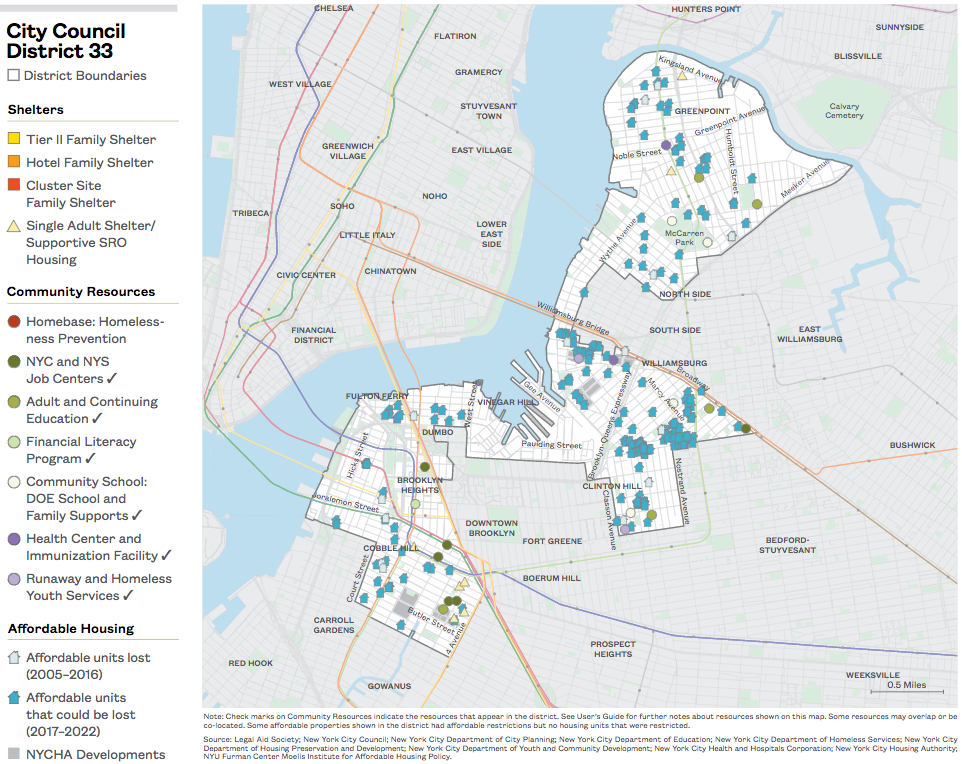
Download City Council District 33
City Council District 34
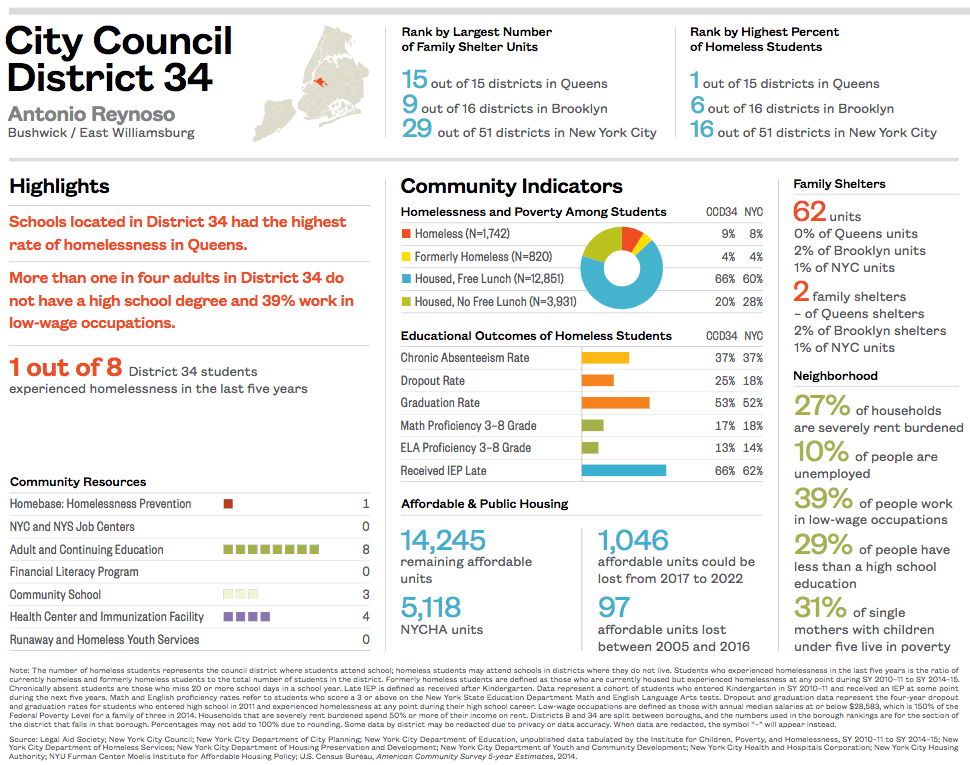
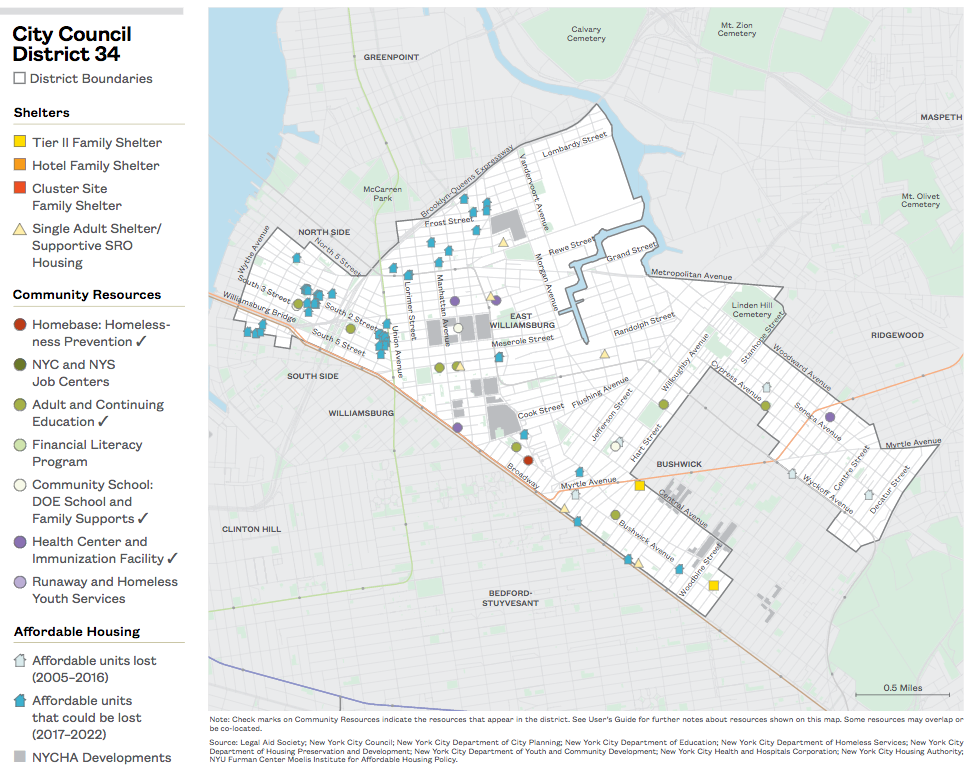
Download City Council District 34
City Council District 35
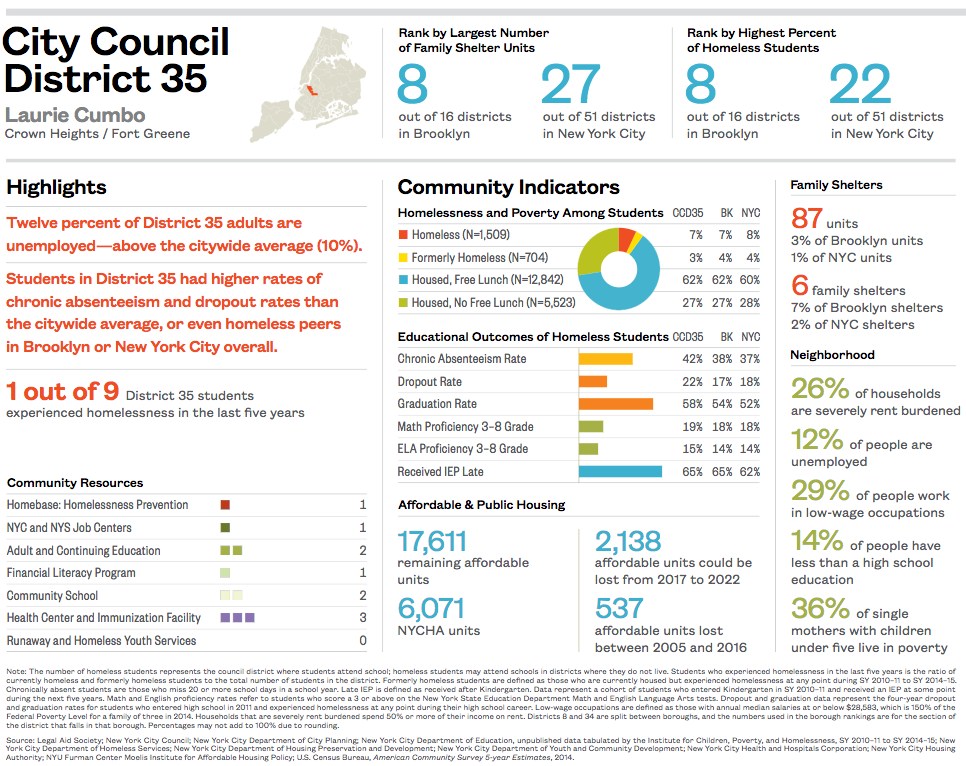
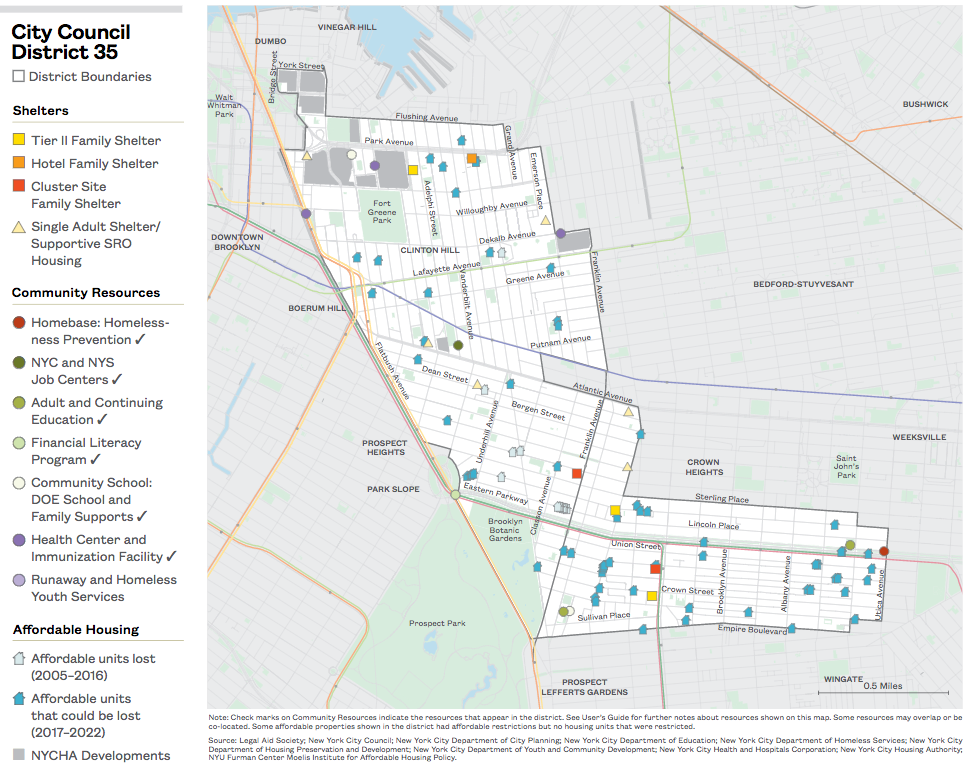
Download City Council District 35
City Council District 36

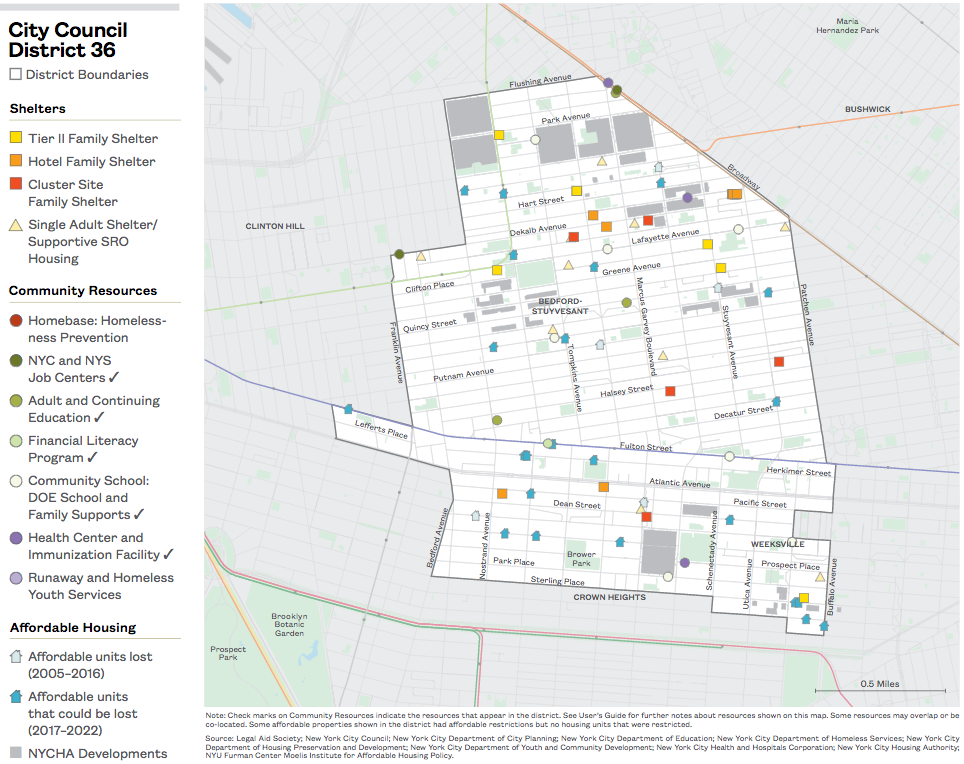
Download City Council District 36
City Council District 37
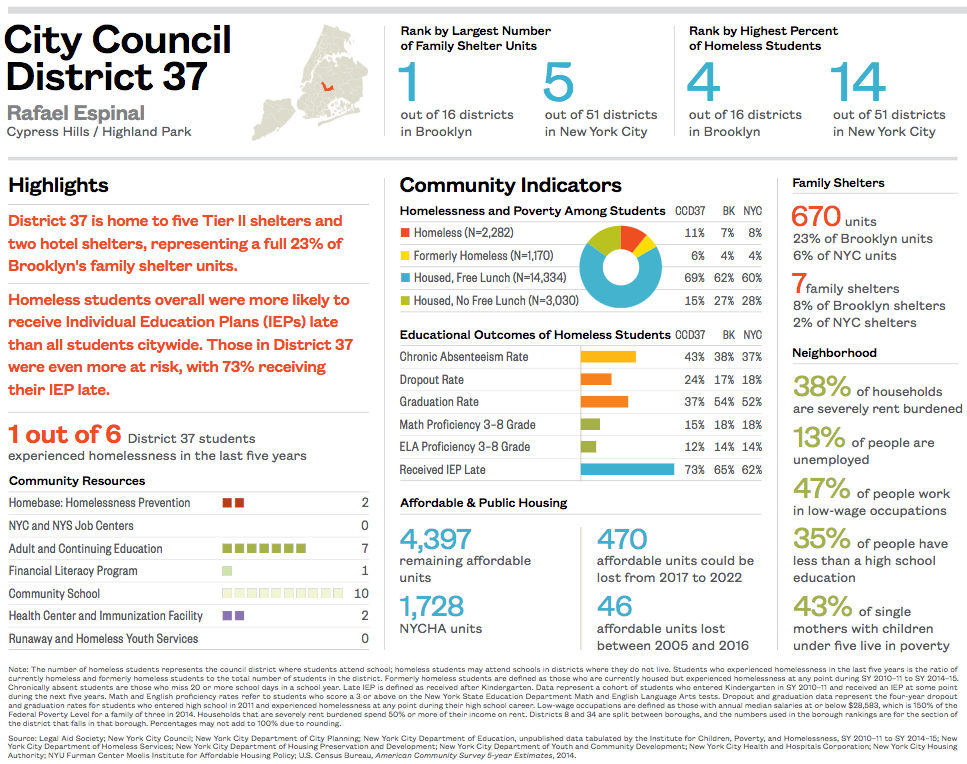
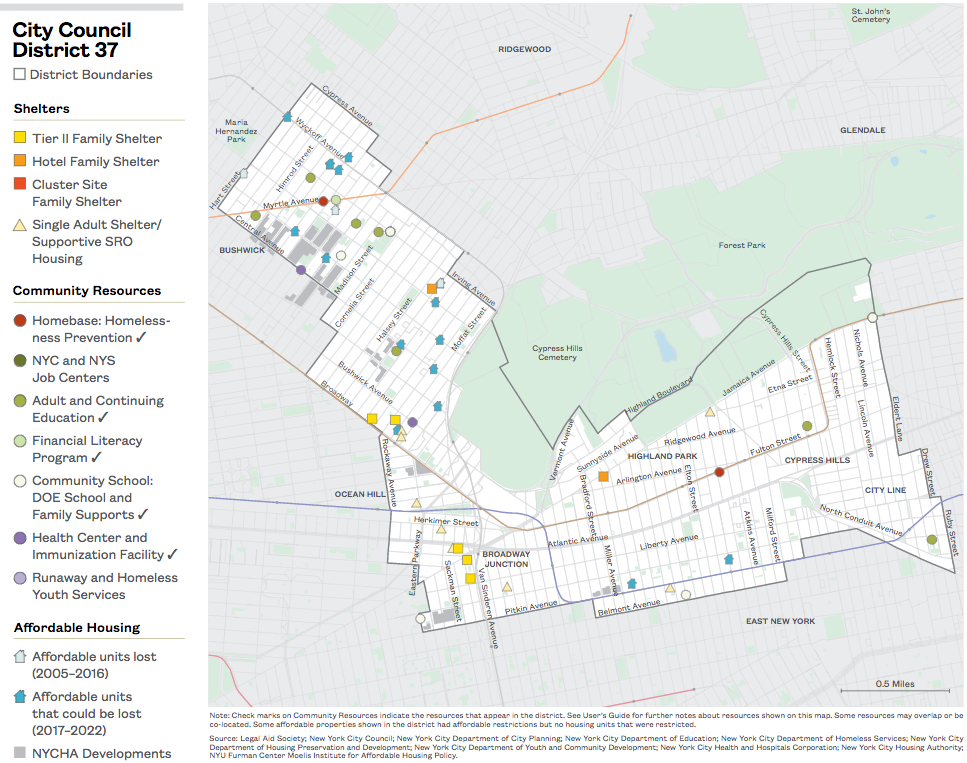
Download City Council District 37
City Council District 38

Download City Council District 38
City Council District 39
Download City Council District 39
City Council District 40
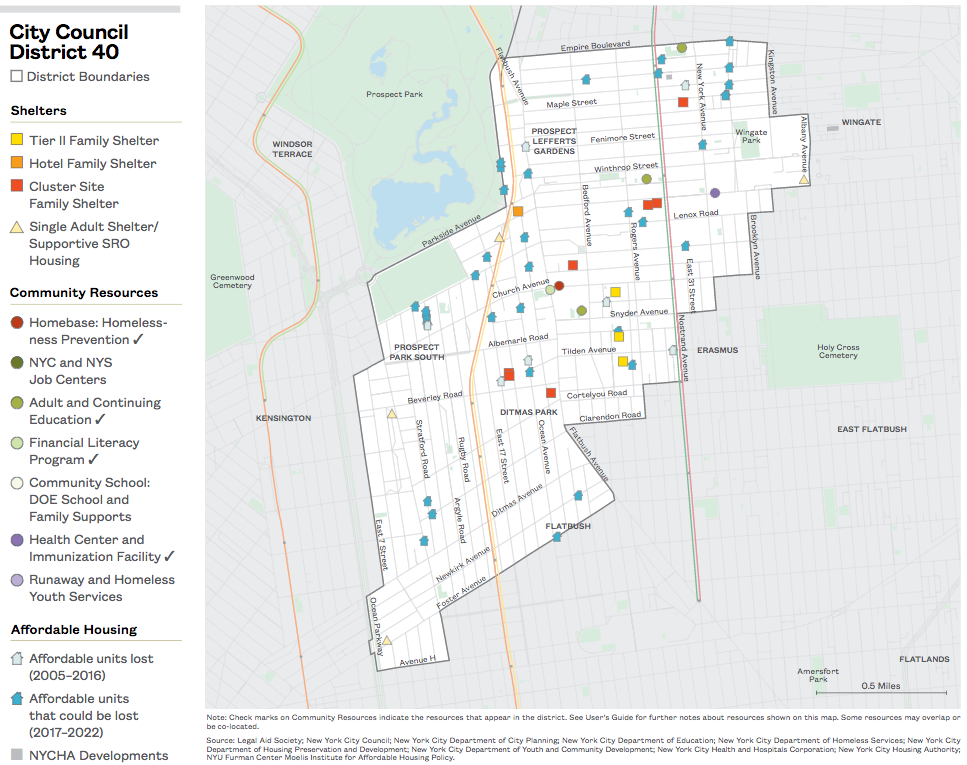
Download City Council District 40
City Council District 41

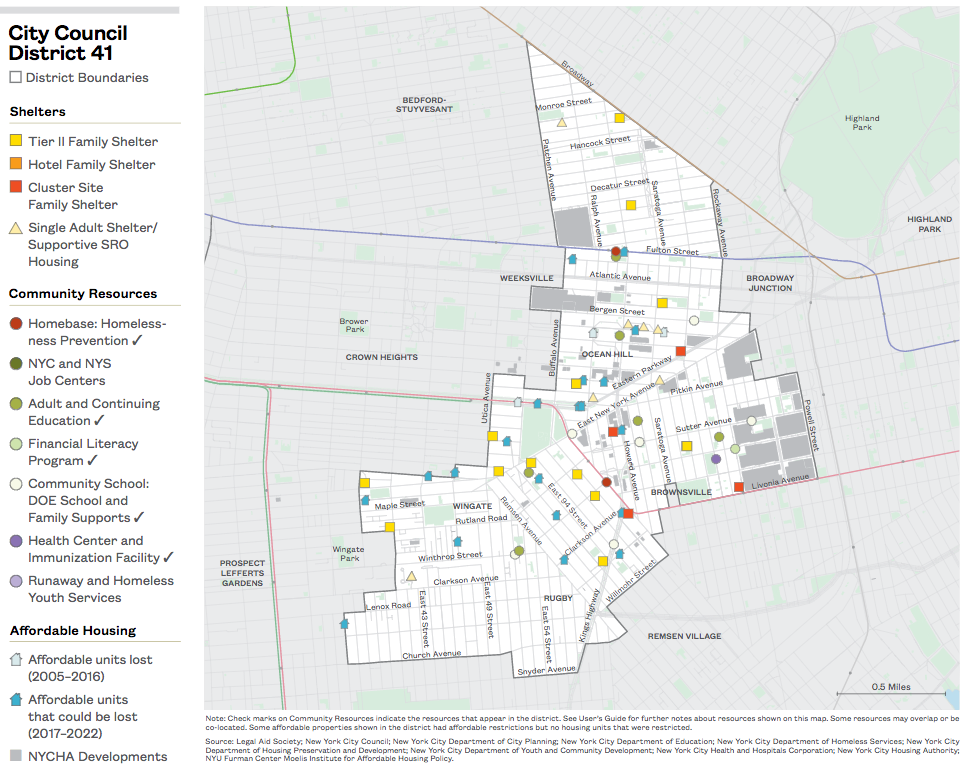
Download City Council District 41
City Council District 42
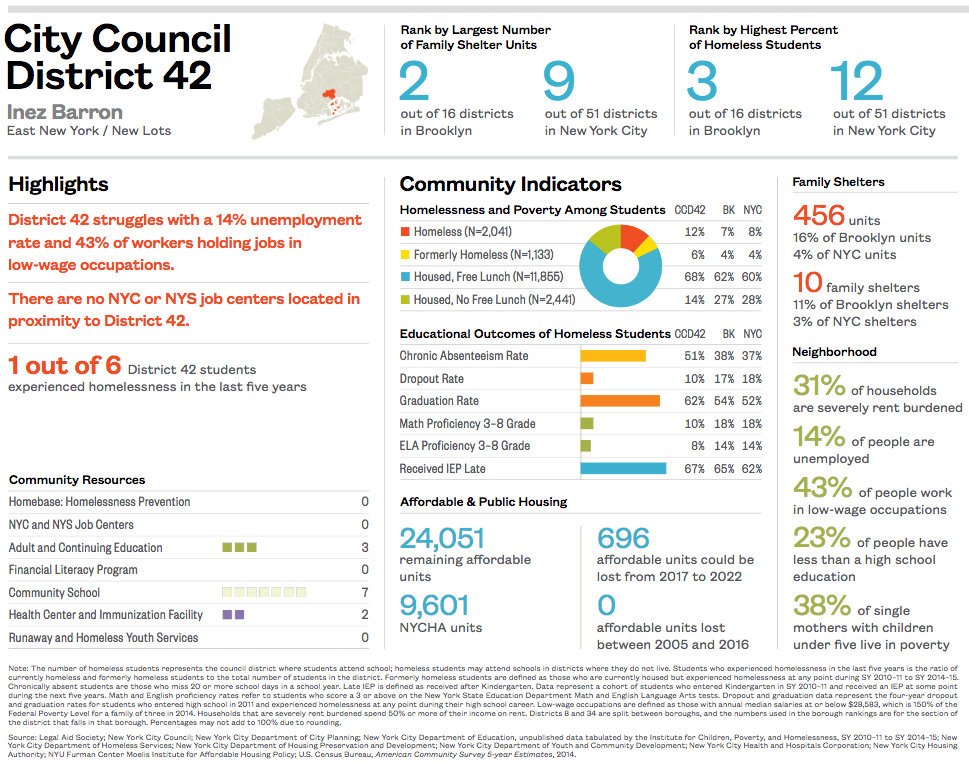
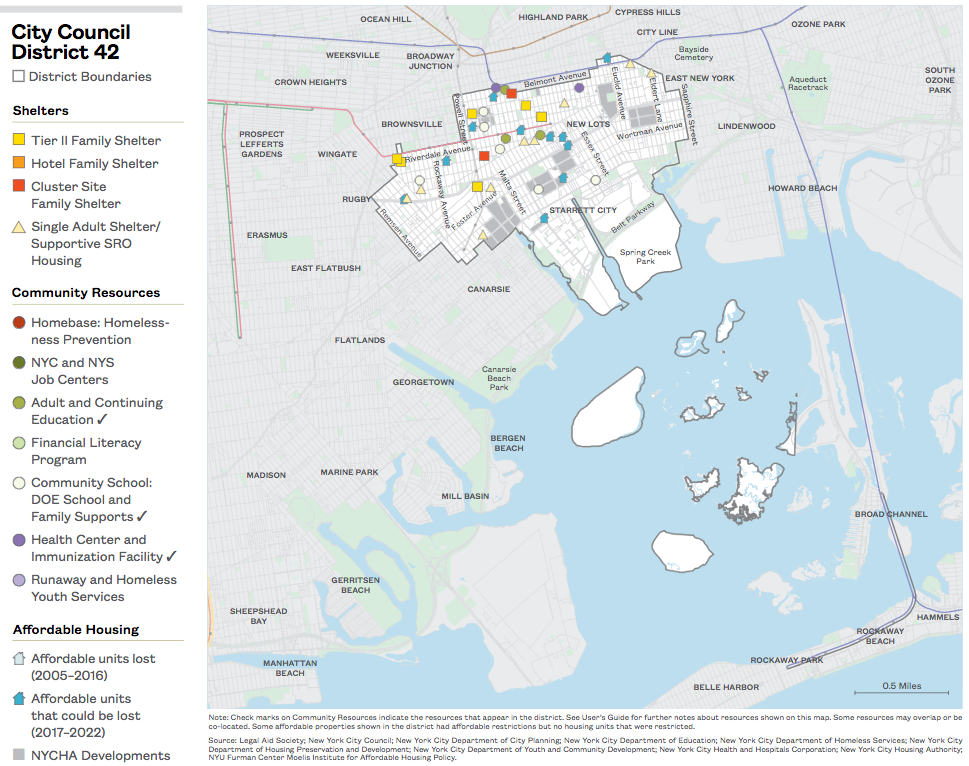
Download City Council District 42
City Council District 43
Download City Council District 43
City Council District 44
Download City Council District 44
City Council District 45
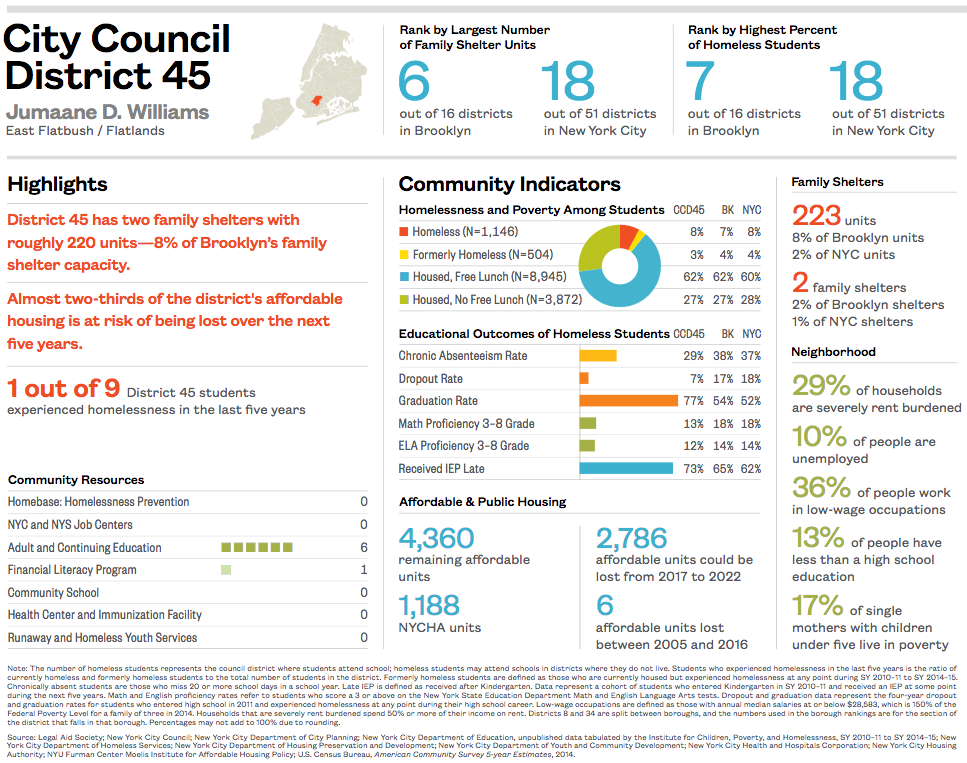
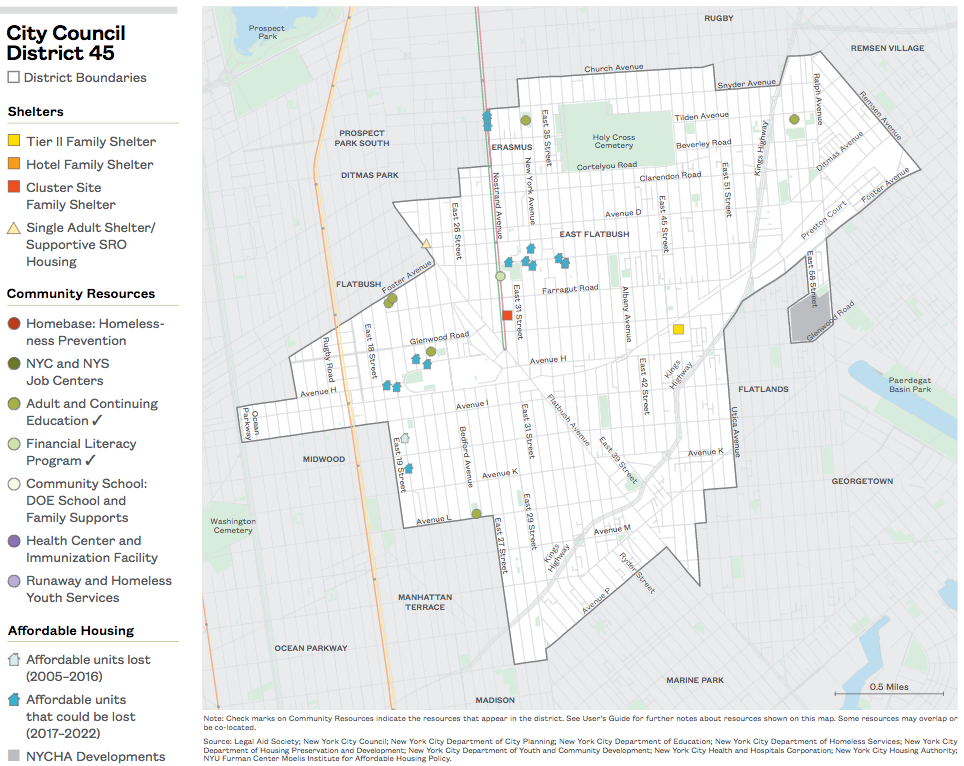
Download City Council District 45
City Council District 46
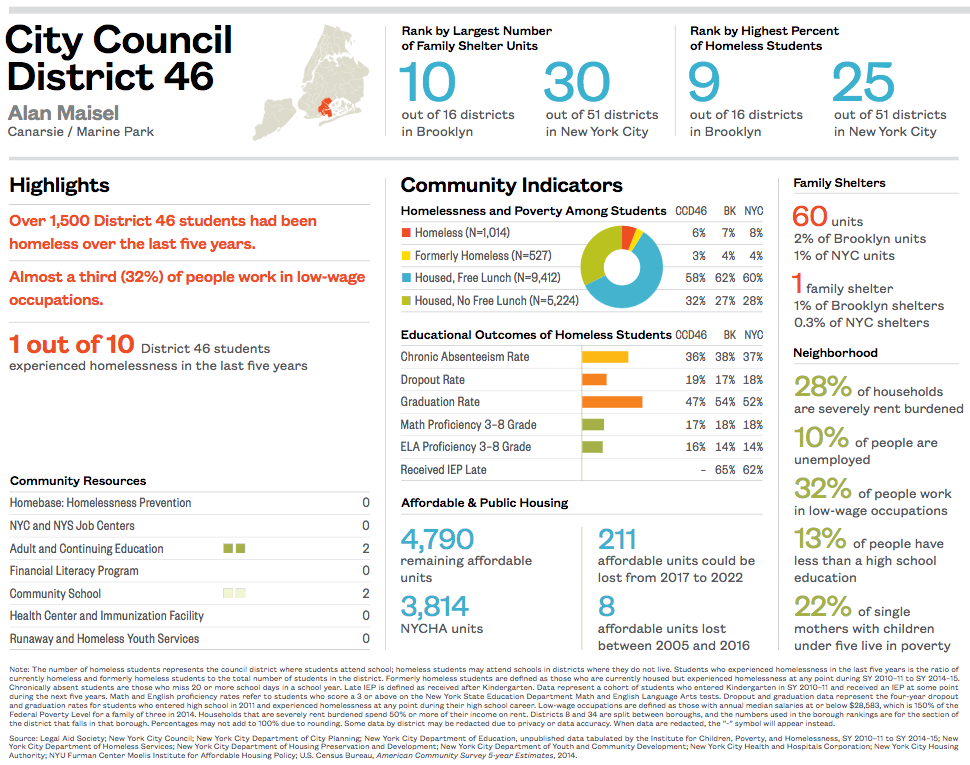
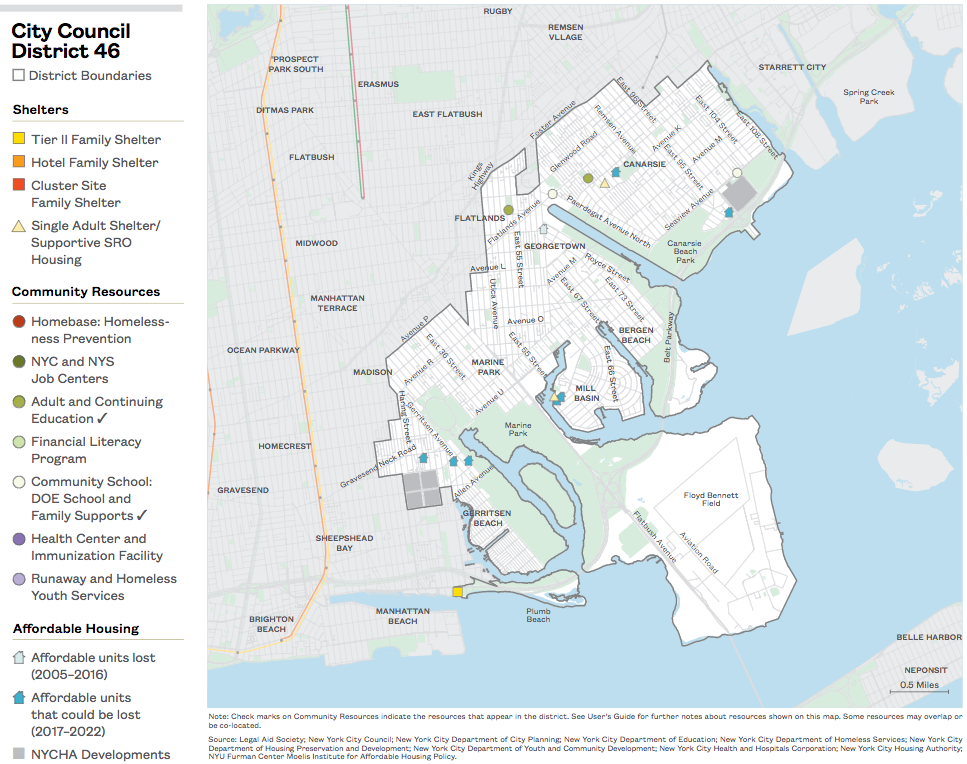
Download City Council District 46
City Council District 47
Download City Council District 47
City Council District 48
Download City Council District 48
City Council District 49
Download City Council District 49
City Council District 50
Download City Council District 50
City Council District 51
Download City Council District 51
User’s Guide
On the Map is designed to provide a better understanding of family homelessness from a citywide and neighborhood perspective.
What information does On the Map provide? On the Map is divided into five sections:
Section 1 provides an overview of family homelessness and the City’s shelter system. It examines the growth of family homelessness over time, the types of shelters where families stay, the location of shelters overall and by shelter type, student homelessness by City Council district, and patterns of family shelter use.
Section 2 focuses on understanding the revolving door of New York City’s family shelter system by exploring the number of families in shelter who entered during a previous year, the rate at which families are returning to shelter, neighborhoods where families live before they enter shelter, communities where the number of families entering shelter is growing, reasons for shelter entry by community district, and the most common reason families exit shelter.
Section 3 uses U.S. Census, housing, and community resource data to highlight geographic patterns in factors driving housing instability across New York City, as well as patterns in existing resources that present opportunities to increase community stability. Maps are shown at the City Council district level along with figures highlighting either overarching data or where each City Council district ranks in comparison to other districts.
Section 4 provides an in-depth look at family homelessness, risk factors, and resources in each City Council district—information critical to local program planning and priority setting.
The Appendix provides a glossary defining the important terms used in On the Map, provides an overview of the publication’s methodology, citations by section and page number, and overarching tables for City Council and community district data.
What are the limitations of the information provided here? Some of the challenges of exploring family homelessness in New York City are the many different ways in which data are collected. Information might be collected at the level of the city as a whole, the community district, or City Council district. The other barriers to a better understanding of the issue are the timeliness and availability of the data. Government officials and community leaders often make decisions affecting today’s homeless families based on dated information, though more current administrative data are available and could be made public.
Why is this information needed? This information is assembled to help the user accomplish a variety of goals including:
- To identify ways to improve family shelter services through providing a more detailed picture of the parents and children living in shelter.
- To learn more about why families from different communities enter shelter.
- To examine the educational, economic, housing, and resource characteristics in each City Council district that influence family homeless.
- To use as a tool for planning and advocacy.
- To raise questions and determine what additional data are required to make effective public policy.
Appendix
“I have been in temporary housing from age 10 when we were evicted from my apartment in Queensbridge. My mother was already in the shelter previously, when she was pregnant and I was born in the shelter. We moved to Queensbridge and got evicted. Then we went to a shelter in Jamaica, Queens for a year, moved to an apartment in Bushwick on public assistance that she got for a year. When she moved to another program with public assistance, they cut public assistance by $300 and she was making $45 a month for that stretch, back into PATH and from PATH we went to a shelter in East New York (Brooklyn).”
—20-year old college student,
repeatedly homeless since 2006
Citations
Introduction
Page 3
New York State Technical and Education Assistance Center for Homeless Students, “Data and Statistics on Homelessness in New York State,” http://www.nysteachs.org/info-topic/statistics.html, accessed March 7, 2017.
The Institute for Children, Poverty, and Homelessness, On the Map: The Atlas of Student Homelessness, August 2016.
The Institute for Children Poverty, and Homelessness, More Than a Place to Sleep: Understanding the Health and Well-Being of Homeless High School Students, March 2017.
Section 1: Family Homelessness in New York City
Page 13
New York State Technical and Education Assistance Center for Homeless Students, “Data and Statistics on Homelessness in New York State,” http://www.nysteachs.org/info-topic/statistics.html, accessed March 7, 2017.
Section 2: The Revolving Shelter Door
Page 30
New York City Department of Homeless Services, unpublished data tabulated by the Institute for Children, Poverty, and Homelessness, FY 2014–FY 2015.
Section 3: Neighborhood Dynamics and Housing Instability
Page 54
Ralph da Costa Nunez, “How a GED Is a Real Advantage in Reducing Family Homelessness in NYC,” Huffington Post, May 25, 2011.
Page 58
New York City Department of Homeless Services, DHS Data Dashboard Charts, FY 2016.
New York City Department of Education, “The New York City Community Schools Initiative,” http://www1.nyc.gov/site/communityschools/index.page, accessed February 16, 2017.
New York City Community District Data Table
New York City Community District Data Table
New York City Council District Data Table
New York City Council District Data Table
New York City Council District Data Table
New York City Council District Data Table
New York City Council District Data Table
Glossary
Adult and Continuing Education
Tuition-free classes including Adult Basic Education, General Educational Development (GED) Test Preparation, English for Speakers of Other Languages, and Career and Technical Education provided by the New York City Department of Education.1
Affordable Housing Units
Privately owned rental properties in New York City that receive long-term local, State, or federal subsidies in exchange for renting below market rate.
Affordable Units Lost Between 2005 and 2016
The number of designated-affordable units whose subsidies expired during the time period.
Affordable Units that Could Be Lost Between 2017 and 2022
The number of designated-affordable units who could opt out of affordability restrictions or whose subsidies expire during the time period.
Remaining Affordable Units
The number of designated-affordable units whose subsidies expire after 2022.
Chronic Absenteeism Rate
The percentage of students who missed 20 or more days in a particular school year. Absences do not include days missed due to suspension or school-wide releases.
City Council District
Area of the city represented by one of 51 elected City Council members, who vote on legislation affecting the entire city, approve the City’s budget, and provide oversight to City agencies.
Community District
Area of the city represented by a Community Board. The city includes 59 community districts. The boards are responsible for hearing input from residents on zoning and urban planning issues; advising during the City’s budgeting process; organizing specific community needs, such as neighborhood and tenant organizations; and hearing complaints of residents.
Community School
A New York City public school that collaborates with a community-based organization partner to provide programs and services like health care, mentoring, expanded learning programs, and adult education. Community schools provide services to not only students and their families, but also others in the community.2
Contracted Shelter
A family shelter run by a service provider that has a contract with the New York City Department of Homeless Services. The City has more oversight authority over contracted shelters, including on health and safety codes, than non-contracted shelters. Contracted shelters also tend to have more service provision for residents.3
Dropout Rate
The percentage of students who entered ninth grade in SY 2011–12 and left high school without graduating within four years.
Educational Attainment
The highest level of education that a person has received. Educational attainment in this publication is limited to people aged 25 or older and those who have achieved less than a high school education.
Elementary School
Kindergarten through 5th grades.
English Language Arts (ELA) Proficiency
Every year, the New York State Education Department administers a standardized test to students in 3rd through 8th grades to assess the proficiency of students across New York State in reading, writing, and comprehension. A score of 3 or 4 on the 4-point scale indicates grade-level proficiency.
Family Educational Rights and Privacy Act (FERPA)
A federal law that protects the privacy of student education records for schools that receive applicable program funds from the U.S. Department of Education.4
Family Homeless Shelter
There are three different categories of family shelters serving New York City Department of Homeless Services (DHS) clients with children: Tier II shelters, cluster site apartments, and hotels. The level and availability of social services, including childcare and case management, at each shelter location varies greatly.5
Cluster Site Apartments
DHS utilizes space in privately owned residential buildings that house both rent-paying tenants and DHS clients. Cluster site apartments were found to be the worst maintained and most poorly monitored of all three types of family shelters, in addition to offering the least adequate social services to families. Many cluster site apartments do not have contracts with the City.6
Hotels
DHS utilizes private hotel capacity to shelter homeless families. These hotels are for-profit institutions that do not operate under City contracts. Hotel operators provide private rooms with kitchenettes and generally limited services.7
Tier II Shelters
Typically the best maintained of all types of family shelters with the most social services available to occupants. Most Tier II shelters are run by nonprofit organizations in privately owned buildings and operate under contracts with the City. Shelter operators provide private rooms for homeless families, along with food service or kitchen facilities.8
Family Shelter Application
The process of applying for shelter for homeless families includes visiting the Department of Homeless Services’ (DHS) Prevention Assistance and Temporary Shelter (PATH) center in the Bronx. All family members must be present at PATH to apply for shelter, and the application process can take more than a day. Temporary shelter is provided for up to ten days while a family’s application is being processed.9
Family Shelter Entry Rate
The number of families with children entering New York City DHS shelters per 1,000 families. The rate was calculated by the Institute for Children, Poverty, and Homelessness using unpublished data from DHS.
Family Shelter Unit
A self-contained, furnished room in a family shelter. Family shelter capacity is counted in units, which usually serve two to four people, rather than being counted as beds, as is done in the single individual homeless population.
Financial Literacy Program
One-on-one financial counseling provided by the New York City Department of Consumer Affairs. Services include advice on debt, credit, banking, and savings.10
Formerly Homeless
A student who was housed during SY 2014–15 but was homeless at any point during SY 2010–11, SY 2011–12, SY 2012–13, and/or SY 2013–14.
Geocoding
The process of using software to change an address of a physical location, such as a building or park, into a location recognizable to mapping software. Geocoding for this report was competed using software from the New York City Department of City Planning NYCgbat Desktop Edition.11
Graduation Rate
The percentage of students who entered ninth grade in 2011 and graduated within four years with a Local, Regents, or Advanced Regents diploma.
Health Center and Immunization Facility
Clinics and hospitals run by the New York City Health and Hospitals system that provide health care services to both insured and uninsured patients regardless of immigration status or ability to pay. Services are provided on a sliding scale fee and are available at low or no cost to low-income patients.
High School
9th through 12th grades.
Homebase
A program introduced citywide in 2004 by the New York City Department of Homeless Services to offer homelessness prevention and aftercare services in individual communities. Offices are operated by contracted social services providers and staffed with caseworkers offering services such as landlord mediation, emergency rental assistance, and benefits enrollment.12
Homeless
The U.S. Department of Housing and Urban Development (HUD) definition of homeless is a person who lacks a fixed, regular, and adequate nighttime residence, meaning those living in a space not designed for or ordinarily used for habitation or in a homeless shelter.13
Homeless Family
Homeless families are defined by two separate categories: “families with children” are one- or two-parent households with children under 21, while “adult families” consist of couples or related family members without children under 21. Families with children and adult families have separate shelter systems and must be screened for eligibility upon applying for shelter, although the law requires that they be temporarily housed during this process. Prior to 2008, data that separate families with children and adult families are not available.14
Homeless Student
The U.S. Department of Education (DOE) uses an expanded definition to include those sharing housing with other people or families, or “doubling up,” due to loss of housing or economic hardship. Where student data from the New York City Department of Education are used, “homeless” refers to the U.S. DOE definition. In all other cases, the U.S. HUD definition applies.15
Housed, Free Lunch
Students not identified as homeless from SY 2010–11 through SY 2014–15 whose family income met the threshold for receiving free or reduced-price lunch in SY 2014–15. This is a proxy for students who are poor but not homeless.
Housed, No Free Lunch
Students not identified as homeless from SY 2010–11 through SY 2014–15 who did not receive free or reduced-price lunch in SY 2014–15. This is a proxy for students who are neither homeless nor poor.
Low-Wage Occupations
Occupations with annual median salaries at or below $28,583 in 2014, 150% of the Federal Poverty Level for a family of three.
Math Proficiency
Every year, the New York State Education Department administers a standardized test to students in 3rd through 8th grades to assess the proficiency of students across New York State in math. A score of 3 or 4 on the 4-point scale indicates grade-level proficiency.
Middle School
6th through 8th grades.
NYCHA
Public housing developments administered by the New York City Housing Authority where residents pay 30% of their income in rent.
New York State and New York City Job Centers
New York State and New York City Human Resources Administration locations provide employment services such as resume writing assistance, job training, job search support, and literacy classes.16
Poverty (Federal Poverty Level)
The Federal Poverty Level was first calculated to represent the minimum income an average family needed to afford food and other basic expenses. The Federal Poverty Level for a family of three was $19,055 in 2014.17
Pre-K
All children who turn four before January 1st of a given school year are eligible to apply for New York City’s Pre-Kindergarten Program. Programs are operated by both the New York City Department of Education and community-based organizations.
Reason for Shelter Eligibility/Entry
The primary reason that a family is found eligible to enter a New York City Department of Homeless Services (DHS) shelter, based on the DHS investigation. A family’s reason for shelter entry does not necessarily match their initial reason for applying to shelter.
Domestic Violence
Physical harm inflicted between intimate partners. In New York City, almost half (47%) of all homeless heads of households had experienced domestic violence during their adult lives.18
Eviction
Forcing a tenant out by legal process.
Immediate Return
Families who left a shelter, usually due to eligibility reasons like breaking curfew, and reapplied within a very short time.
Overcrowding
Housing is considered overcrowded when there is an average of more than one person per room in the unit, not including bathrooms.19
Other Reasons for Shelter Eligibility
Additional reasons families were found eligible for shelter included ACS-Related, Crime Situation, Discharged from Rehab Center, Discord, Fair Hearing, Financial Strain, Living on Street, Lockout, Other, Out of Town Client, Referred by Outreach Team, Released from Prison, and Unlivable Conditions.
Reason for Shelter Exit
The primary reason that a family left a New York City shelter according to the Department of Homeless Services (DHS).
48-Hour Curfew Violation
Families who did not check into their shelter for a 48-hour period and were deemed by shelter staff to have exited the shelter system. In shelters without adequate staff, this can include any reason for the extended absence, including family or medical needs.
Family Reunification
Families who exited shelter after reuniting with a relative or other person.
Independent Living
Includes families who can maintain their own living situation outside of the shelter system.
Long-Term Subsidy
Families exiting shelter with City, State, and federal permanent or indefinite housing subsidies including the categories of CityFEPS, FEPS, HPD, HRA Housing, HUD/VASH, NYCHA, NYNY Supportive Housing, and Section 8 program vouchers.
Term Subsidy
Includes families exiting shelter with time-limited subsidies such as Come Home NYC, Enhanced One-Shot, and LINC program vouchers.
Other Reasons for Shelter Exit
Additional reasons families left shelter included Client Arrested; Deceased; Exit Unknown; Hospitalized-Medical; Jail, Prison or Juvenile Detention Facility; Referred to DV Shelter; No Longer Adult Family; No Longer Family with Children; Nursing Home; and Out of City-Travel Assistance.
Received IEP Late
Includes all special education students who received an IEP after Kindergarten. For the purposes of this report, late IEP calculations are limited to a cohort of students who entered Kindergarten in SY 2010–11 and received an IEP at some point during the next five years.
Individual Education Plan/Program (IEP)
An Individual Education Plan is created when a student is deemed eligible for special education services through the Department of Education. This details the programs and services that the student will need in order to be successful in school.20
Rent Burden
Rent burden is when renters pay such a high percentage of their monthly income for housing that paying for other basic living expenses becomes difficult. When renters pay 30% or more of their income to rent, they are considered “rent burdened,” and at 50% or more, they are “severely rent burdened.”
Runaway and Homeless Youth Services
Facilities that provide shelter and/or services to runaway youth or homeless youth. Runaway youth are those under age 18 who do not live at their legal residence and lack parental or guardian consent. Homeless youth are those under age 21 (see “Homeless Student”).
Single Adult Homeless Shelter/Supportive SRO Housing
Like family shelters, most single adult homeless shelters contract with the City but are privately owned. There is a wider variety in the types of facilities available to singles, including shelters that specialize in adults within specific age groups, adults dealing with substance abuse or mental illness, or veterans. Supportive Single Room Occupancy (SRO) facilities provide long-term or permanent housing where residents can access the support services they require to live successfully in the community. They can be located in a building containing solely SRO units, or integrated into a building that serves other population groups.21
Single Mothers with Young Children Living in Poverty
A measure of community vulnerability to homelessness, as mothers in poverty with children under five years old are among those most likely to enter shelter.
Unemployment
Civilians 16 years or older who were not working, despite actively searching for work and being able to start a job.22
1 New York City Department of Education, “Office of Adult and Continuing Education,” http://schools.nyc.gov/NR/rdonlyres/4684D651-ECAE-4BB8-880A-713D9E3AD8C1/0/OACN.pdf, accessed January 2017. 2 New York City Department of Education, “About: What Is a Community School?” http://www1.nyc.gov/site/communityschools/about/about.page, accessed January 2017. 3 New York City Department of Investigation, DOI Investigation of 25 City-Run Homeless Shelters for Families Finds Serious Deficiencies, March 12, 2105. 4 U.S. Department of Education, “Laws & Guidance: Family Educational Rights and Privacy Act (FERPA),” http://www2.ed.gov/policy/gen/guid/fpco/ferpa/index.html, accessed January 2017. 5 New York City Department of Investigation, DOI Investigation of 25 City-Run Homeless Shelters for Families Finds Serious Deficiencies, March 12, 2105. 6 Ibid. 7 Ibid. 8 Ibid. 9 New York City Department of Homeless Services, “Families with Children: Applying for Temporary Housing Assistance,” https://www1.nyc.gov/site/dhs/shelter/families/families-with-children-applying.page, accessed January 2017. 10 New York City Department of Consumer A airs, “Get Free Financial Counseling,” http:// www1.nyc.gov/site/dca/consumers/get-free-financial-counseling.page, accessed January 2017. 11 New York City Department of City Planning, “Geosupport Desktop Edition,” https://www1.nyc.gov/site/planning/data-maps/open-data/dwn-gde-home.page, accessed March 17, 2017. 12 New York City Department of Homeless Services, “Homebase,” http://www1.nyc.gov/site/dhs/prevention/homebase.page, accessed January 2017. 13 Homeless Emergency Assistance and Rapid Transition to Housing (HEARTH) Act, Public Law 112–151, U.S. Code 42 (2009), § 11302. 14 New York City Department of Homeless Services, Data Dashboard Category Definitions, FY 2012. 15 McKinney-Vento Homeless Assistance Act, Public Law 100–77, U.S. Code 42 (1987), § 11302. 16 New York City Human Resources Administration, “Employment Services,” http://www1.nyc. gov/site/hra/help/employment-services.page, accessed January 2017. 17 U.S. Department of Health and Human Services, Annual Update of the HHS Poverty Guidelines, January 2016. 18 The Institute for Children, Poverty, and Homelessness, The Hidden Migration: Why New York City Shelters Are Overflowing with Families, April 2002. 19 U.S. Census Bureau, American Community Survey and Puerto Rico Community Survey 2014 Subject Definitions. 20 New York City Department of Education, Local Law 27 of 2015 Annual Report on Special Education, February 29, 2016. 21 New York State Office of Mental Health, “Adult Housing,” http://bi.omh.ny.gov/adult_housing/index?p=res-programs, accessed January 2017. 22 U.S. Census Bureau, American Community Survey and Puerto Rico Community Survey 2014 Subject Definitions.
Methodology
Family shelter locations and capacity were identified using multiple sources to corroborate addresses.1 Based on the number of family shelters listed in the December 2015 Shelter Repair Squad Scorecard—Shelter Building Listing, 91% of total Tier II shelter units, 74% of total cluster site shelter units, and 83% of total hotel shelter units in New York City are included in the 2017 On the Map: The Dynamics of Family Homelessness in New York City. The remaining shelters are not included due to missing or incomplete address information (1,887 units out of 12,839 total family shelter units citywide). The location for single adult shelters is based on data from Bytes of the Big Apple’s “Selected Facilities and Program Sites” dataset.2 Affordable housing data include data from the NYU Furman Center’s CoreData.nyc dataset. The location of community resources reflects data downloaded from NYC Open Data, including the “DYCD After-School Programs: Runaway and Homeless Youth,” “Health and Hospitals Corporation (HHC) Facilities,” “Homebase Locations,” “OACE (Office of Adult and Continuing Education) Sites” and “Financial Empowerment Centers” datasets.3 Community resource data downloaded from the NYC Open Data portal are publicly uploaded datasets and should be treated with caution for data accuracy. NYC/NYS job centers include data from NYC Open Data’s “Directory of Job Centers” dataset, as well as the U.S. Department of Labor’s “Comprehensive and Affiliate Job Centers” dataset.4 The location of community schools is based on data downloaded from the NYC Community School’s website.5 NYCHA developments include data from the NYC Housing Authority’s “NYCHA Development Interactive Map” and NYC Open Data’s “Map of NYCHA Developments” dataset.6 Approximate unit counts for NYCHA developments that fall within more than one district were calculated based on the area of the building that falls within each district, accounting for 5,774 total units and affecting Districts 7, 8, 9, 10, 11, 14, 16, 17, 31, 32, 34, 36, 37, 40, and 41. The maps display all NYCHA developments, including FHA repossessed houses and developments that border more than one district. U.S. Census data for City Council maps and tables were created using U.S. Census block group data, which are only available in five-year estimates. Proportional allocation of population within U.S. Census block groups was computed for 348 out of 6,360 block groups (5.5%) that were divided by City Council district boundaries. Potential statistical bias due to the modifiable areal unit problem cannot be resolved using available aggregate public data. Because of the large degree of variation in City Council district size, individual district maps are shown in eight different scales, with the distance per inch at the bottom of the map. Data on student homelessness come from New York City Department of Education school year (SY) 2014–15.7 These data, recorded at the end of each school year, were linked to annual student housing status information through a unique scrambled student identifier. All students were geocoded based on their last school of enrollment. Where student data by borough is shown, the school’s administrative borough is used. In order to protect student privacy and adhere to the Federal Education Rights and Privacy Act (FERPA), all numbers and percentages that could potentially reveal fewer than 10 students have been redacted. On citywide heat maps, natural breaks were used, which is a method of grouping data with similar values while maximizing the difference between groups, unless otherwise noted. Some data by district may be redacted due to privacy or data accuracy. When data are redacted, the symbol “–” will appear instead. All data analysis for the 2017 On the Map: The Dynamics of Family Homelessness in New York City was conducted in STATA and Excel and geographic maps were created in ArcGIS.