Preface
Millions of children and their families across the United States experience the challenges of homelessness every year. Unfortunately, that number continues to grow. Some turn to family and friends, some are served in shelters and by other social services, and some are left to fend for themselves in cars, on the streets, and in tent cities. What started out over three decades ago as local initiatives in response to homelessness have grown and evolved into national priorities, state policies, and municipal bureaucracies. What began as calls for more shelter and more affordable housing have expanded to approaches in communities that include the education, health, childcare, and employment services that are so often needed as part of a family’s journey out of homelessness.
But there is still so much more that needs to be done.
The American Almanac of Family Homelessness is a publication that describes the situations and characteristics of those millions of children and their parents, as well as the efforts made in all 50 states and the District of Columbia to better identify and serve those families. The Almanac is both a tool for and challenge to advocates, service providers, policymakers, funders, and families. It represents the factors that influence and impact family homelessness, as well as the steps that are being implemented and disseminated across the country.
From its establishment in 1990, the Institute for Children, Poverty, and Homelessness has been a voice for children, families, and providers to challenge the status quo. We analyze what data is available and identify where more is needed. We question entrenched beliefs and present different points of view, thereby providing a more complete picture of the experience of family homelessness. The Almanac, with its state rankings, data dashboards, ideas for action, and issues exploration, is the embodiment of ICPH’s 25 years of experience and analysis and a resource to connect policy, practice, and research and move each forward.
Leonard N. Stern, Chair
Ralph da Costa Nunez, PhD, President and CEO
Introduction
Family homelessness has challenged the United States for more than three decades. What we know about the impact of homelessness on children and their families has grown tremendously during that time, yet policies and funding priorities still too often overlook the unique needs of homeless families.
The Institute for Children, Poverty, and Homelessness (ICPH) created the American Almanac of Family Homelessness in 2013 to contribute to the limited body of literature that informs policies directly affecting homeless families. The updated 2015 edition of the Almanac not only compiles the data on family homelessness that is available but also provides the context and analysis necessary to understand the issue. It provides policymakers, government administrators, service providers, advocacy groups, researchers, and concerned citizens with a comprehensive resource that highlights what existing data reveal about homeless families and the programs that serve them—and where gaps exist in knowledge and data collection.
The Almanac begins by introducing ICPH’s inaugural State Family Homelessness Rankings, a resource that evaluates and ranks state performance within two domains: efforts to identify and serve homeless children and youth and the adoption of policies that can prevent homelessness and allow families to regain housing stability. Each domain employs five unique indicators; the results are reported by indicator and as composite education and policy scores, allowing readers to easily compare states and identify areas for improvement.
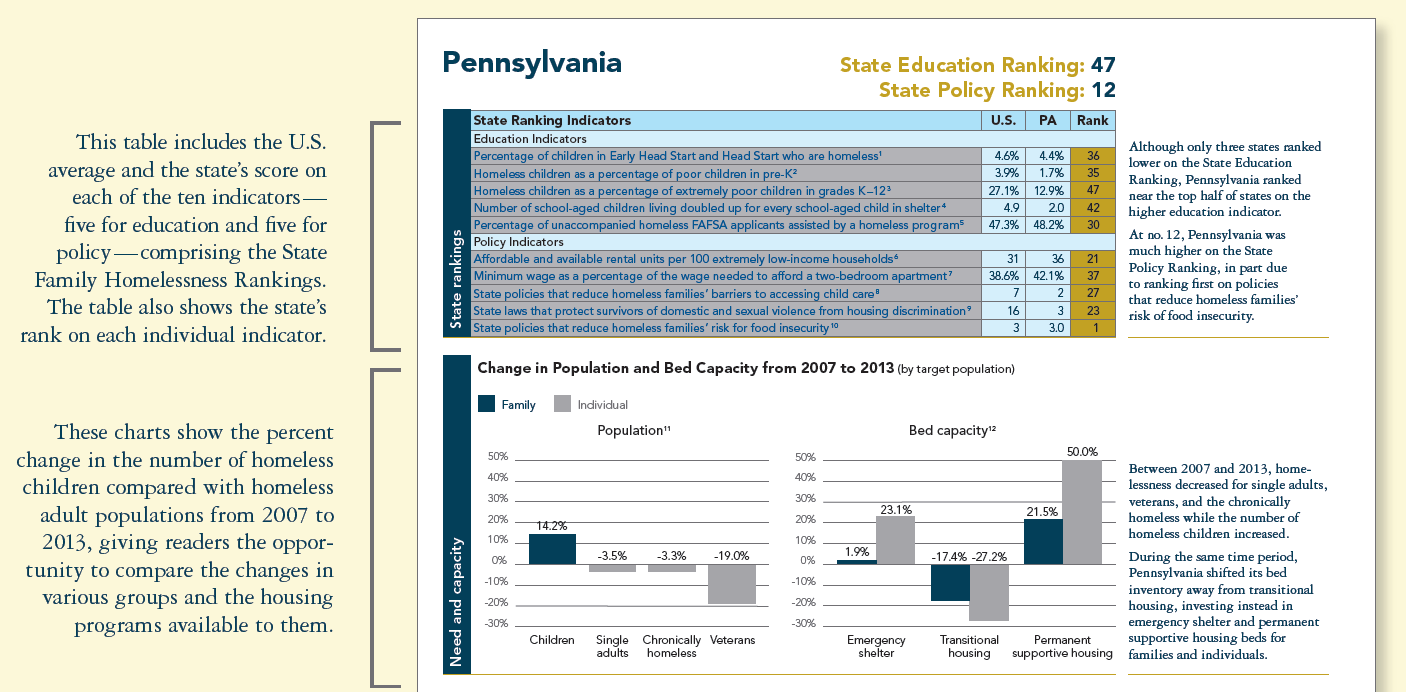
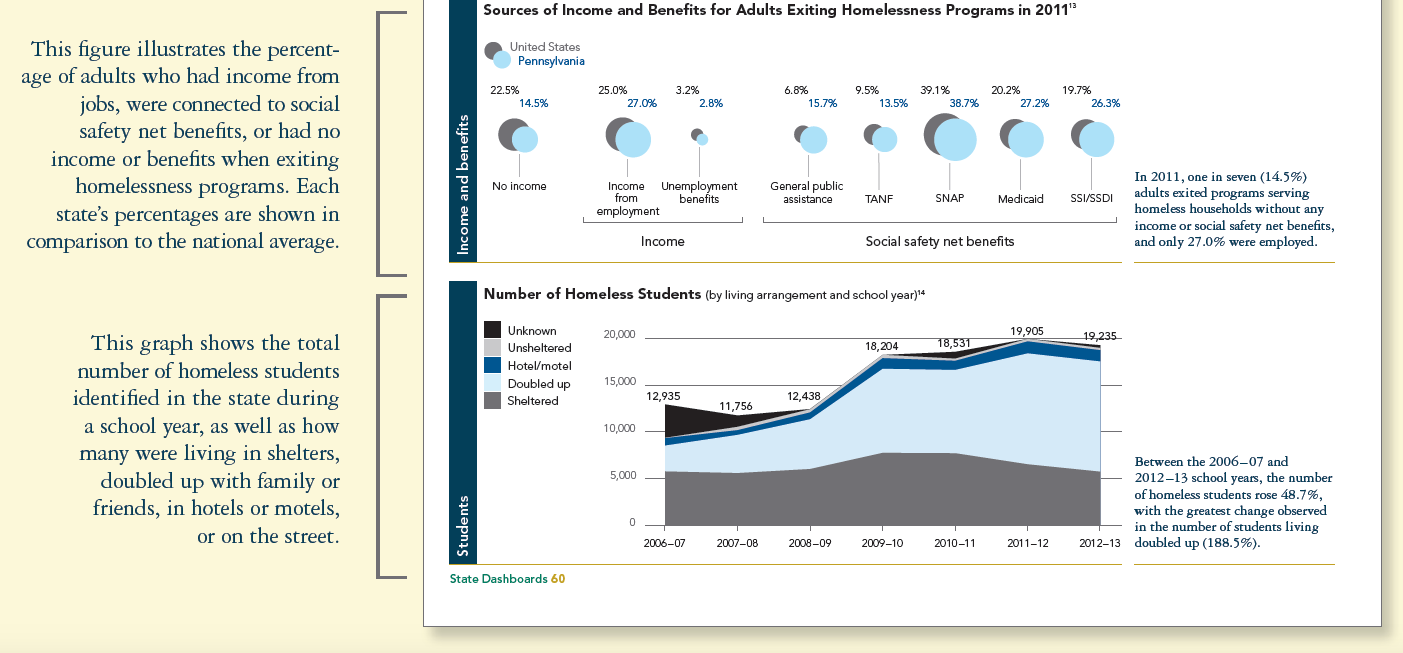
The state rankings are followed by State Dashboards, one for each state and the District of Columbia. These one-page reports—replacing the state-by-state briefs in the 2013 edition—provide a summary table of each state’s placement on the state rankings and highlight easy-to-compare statistics on family homelessness. By showcasing trends and statistics through straightforward graphics, the dashboards supply readers with the data they need to assess the status of family homelessness and related policies in each state.
New to the 2015 edition of the Almanac is a section detailing ICPH’s Ideas for Action. These policy priorities and recommendations are focused on three key areas of family homelessness: education for homeless children, policies supporting homeless families, and research and targeted assistance. They contain cost-effective and practical steps that each state can implement even without federal action. These policy changes would help to mitigate the effects of homelessness by increasing educational opportunities for homeless children, protecting domestic violence survivors, bolstering parents’ ability to support their families, and ensuring that research and funding is targeted to effective programs and the most vulnerable populations.
Issue by Issue, the final part of the Almanac, contains six thematic sections that explore the challenges that homeless families face and options for interventions. These articles provide in-depth discussions of key topics relevant to the study of family homelessness. Starting with demographics and trends in child and family homelessness, the remaining sections cover the macroeconomic causes of family homelessness; the effects of homelessness on families and children; education for homeless children; federal homelessness policy and types of homelessness housing models; and the role of social safety net benefits in preventing and resolving homelessness.
The Almanac demonstrates that the needs of homeless children and families are too varied and complex to ever be effectively addressed with a one-size-fits-all approach. As shown within these pages, strong efforts are being made in many communities but more are needed at the local, state, and federal levels to effectively target, tailor, and fund the services that children and families need to move onto a path of independence.
State Rankings
Examining Practices and Policies to Prevent and Reduce Family Homelessness
Our understanding of family homelessness today has been informed by the experiences of millions of families in all 50 states and thousands of communities over the last three decades. State governments, and the county and municipal agencies that implement policies and programs locally, have an important role to play in addressing the housing, social, financial, and educational instability that families experiencing homelessness face in the country’s diverse rural, suburban, and urban communities.
Plans for ending family homelessness must be as multifaceted as families’ needs in order to be successful. While effective national policy is important, state leaders and policymakers are in a unique position to create a statewide framework that supports many of the necessary solutions. Communities need a variety of tools in their solutions tool-box in order to not only meet the basic and immediate needs of children and families, but to also confront the underlying causes of homelessness that can impact multiple generations within families.
With the need for a multi-pronged approach in mind, ICPH developed the State Family Homelessness Rankings, which comprise two distinct ranking systems. The first measures and compares the efforts that states are making to educate homeless children in their communities, and the second looks at the state and local policies in place to assist homeless families, covering issues related to housing, child care, domestic violence, and food insecurity. Each indicator was chosen not just because of its impact on homeless families, but also because it is a factor that states have the power to change. For example, state and local agencies can independently improve efforts to identify students living doubled up, pass laws protecting survivors of domestic violence from housing discrimination, and implement policies to increase access to child care subsidies.
This first part of the Almanac, the State Family Homelessness Rankings, presents in detail how the rankings were constructed, as well as ICPH’s findings and analysis of each indicator. The top-ranked states on each indicator are also highlighted to provide additional context and offer examples for other states seeking to improve their own programs and policies. While each state’s rankings are listed here, specific data for each state is also included in the second part of the Almanac, State Dashboards.
State Family Homelessness Rankings
Examining Practices and Policies to Prevent and Reduce Family Homelessness
The first national plan for ending homelessness was released in 2010 and set the goals of ending chronic and veteran homelessness by 2015 and ending homelessness among families, children, and youth by 2020. Since the plan’s release, the national spotlight has focused more on the former goal than the latter.1 Subsequently, homelessness decreased among veterans and chronically homeless single adults. However, between 2009 and 2014, the number of family members who access shelter— over 190,000 on a single night—did not.2
Although federal funding and leadership is required, state and local investments are also essential to alleviate family homelessness. Crucial federal legislation safeguards the educational rights of homeless students, but it is ultimately up to state and local educators to identify and serve homeless children. Federal funding for low-income housing has plummeted since the 1980s, so state and local governments must contend with creating and preserving affordable housing. Within the scope of federal guidelines, states shape how safety net programs are administered and can reduce access barriers for homeless families seeking assistance. These are only a few examples of the critical roles states play in ending family homelessness.
To assess and raise awareness of the services and policies necessary to address family homelessness, the Institute for Children, Poverty, and Homelessness (ICPH) has developed the State Family Homelessness Rankings, based on a unique set of indicators to compare states’ efforts and to reveal how well states are doing in meeting homeless families’ and children’s needs.
ICPH created the State Family Homelessness Rankings by first examining existing cross-state and -country indices of family and child well-being, including the Annie E. Casey Foundation’s KIDS COUNT Data Book, the Foundation for Child Development’s Child Well-being Index, the National Center on Family Homelessness’ America’s Youngest Outcasts, and, at the international level, indices developed by the United Nations Development Programme.3 Common to many of these indices are measures of poverty. While poverty is a multifaceted cause of homelessness and homelessness exacerbates its effects, poverty measures alone are too broad in scope to address the immediate goal of ending family homelessness. In examining poverty, it is also easy to blame macroeconomic forces or place the responsibility to act on individual families themselves. With this in mind, ICPH aimed to develop indicators that are connected to the larger issue of poverty but directly relate to an action that can be taken at the state level to prevent or reduce family homelessness. A state’s ranking can therefore be improved upon with effective policies and collaboration.
State Education Ranking
Children are the invisible victims of homelessness. Children experiencing housing instability are at greater risk for poor academic outcomes than stably housed children, but they often are not identified and are left disconnected from the services necessary for them to thrive. For these vulnerable children, access to high-quality educational resources and support is perhaps the surest way to prevent intergenerational poverty and homelessness. The five education indicators provide a measure of how well homeless children of all ages are being identified and connected to services, from early education for the youngest homeless children to financial assistance for youth attending college.
State Policy Ranking
State and local policies must support homeless families’ paths to self-sufficiency rather than impede them. The first two policy indicators reflect the need for affordable housing, including the lack of available rental units for families with extremely low incomes and the low purchasing power of the minimum wage. The remaining indicators reflect policies each state has in place to improve the lives of homeless families and to prevent episodes of homelessness. They target three key issues related to family homelessness: lack of accessible child care, discrimination against survivors of domestic violence, and food insecurity.
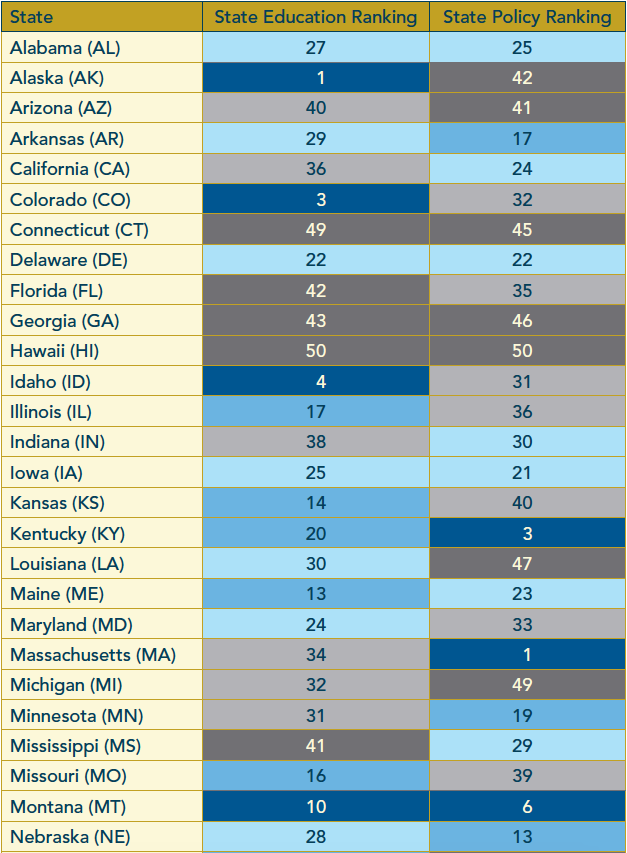
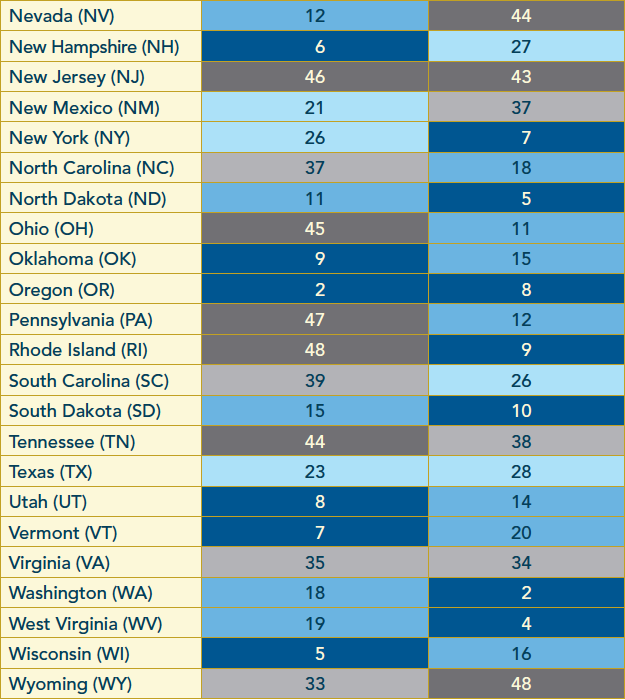
The State Family Homelessness Rankings compare each state across ten indicators, which are analyzed and grouped thematically, creating two separate rankings: the State Education Ranking and the State Policy Ranking.4
States are graded from 1 to 50 (top to bottom) on the two rankings, with 1 representing the highest-scoring state on a given measure and 50 representing the lowest. By ranking states, ICPH hopes to not simply differentiate between those with robust and weak policies but also to encourage state and local leaders to discover what other states are doing well—and how they are doing it. While what is working in one state may not work in another, states atop the rankings provide examples of promising practices (Table 1).
State Education Ranking
Meeting the Educational Needs of Homeless Children
While homelessness can impact many aspects of a child’s life, including health and socio-emotional development, the experience can also be detrimental to their education. Students experiencing homelessness may have difficulty attending school regularly, and bring with them to the classroom a variety of worries and distractions that can make learning difficult. Therefore, it is vital not only that homeless students are identified, but also that the services and resources that they need are available to help mitigate the negative impacts that housing instability can have on their educational experiences.
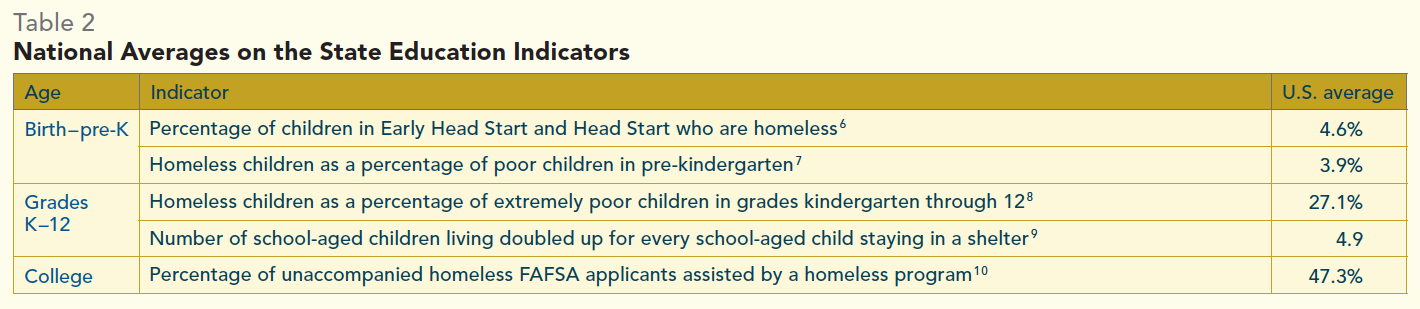
The ICPH State Education Ranking examines how effective states are in identifying and assisting students experiencing homelessness, from birth through college. Conventional wisdom would suggest that the state with the lowest number or percentage of homeless students should be ranked highest. However, that number tells only part of the story. A low number may reflect that a state truly has few homeless families, or it might indicate that not enough effort has been made to identify homeless students. Given this, the State Education Ranking uses indicators that provide more context and better approximate the efforts that are being made in each state to address homeless children’s educational needs. In addition, the number of states that are above or below the national average for each of the indicators is provided as a basis for comparison.
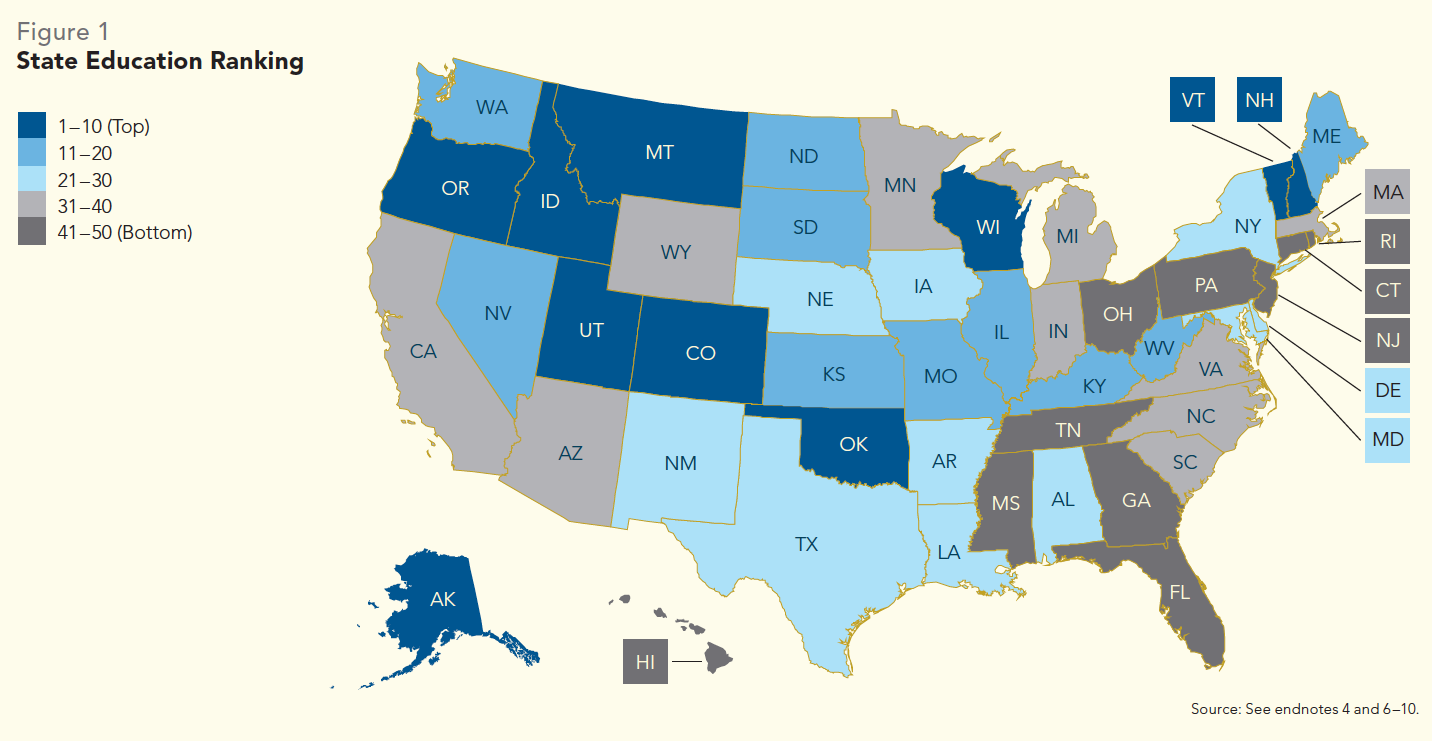
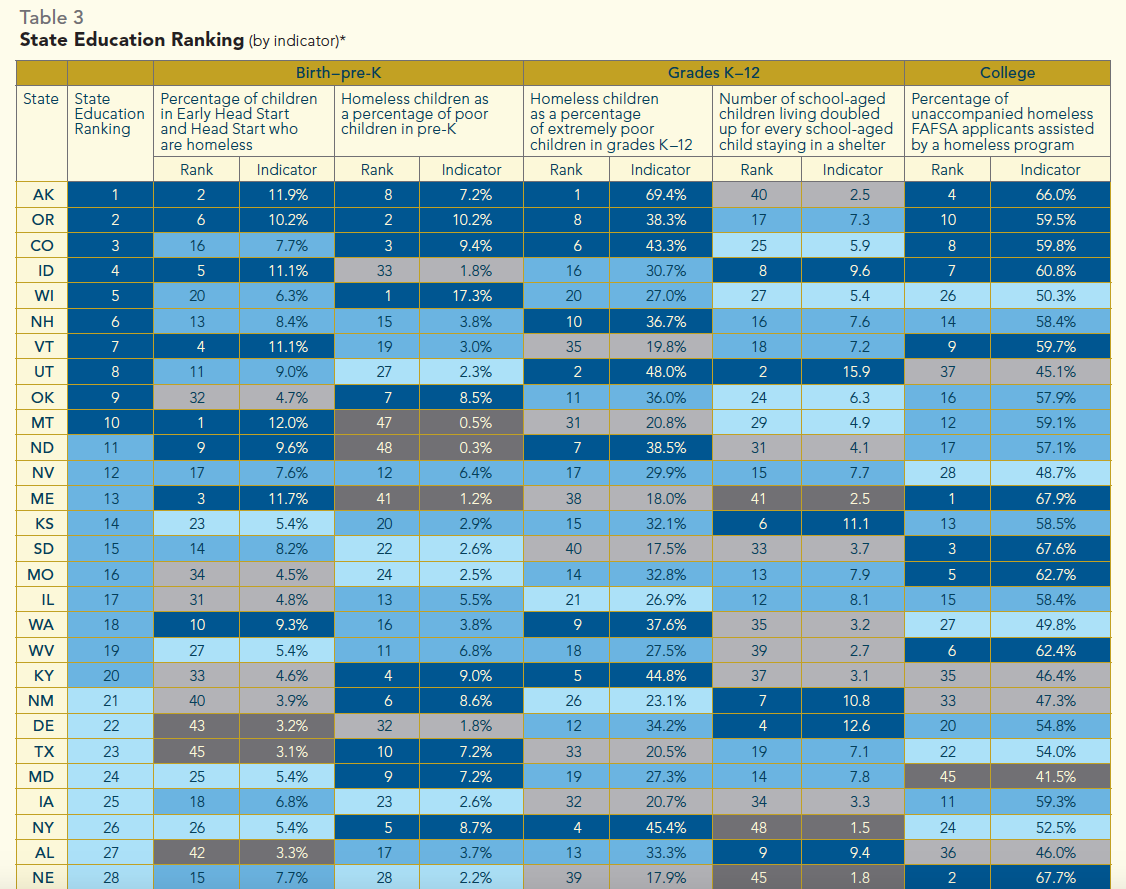
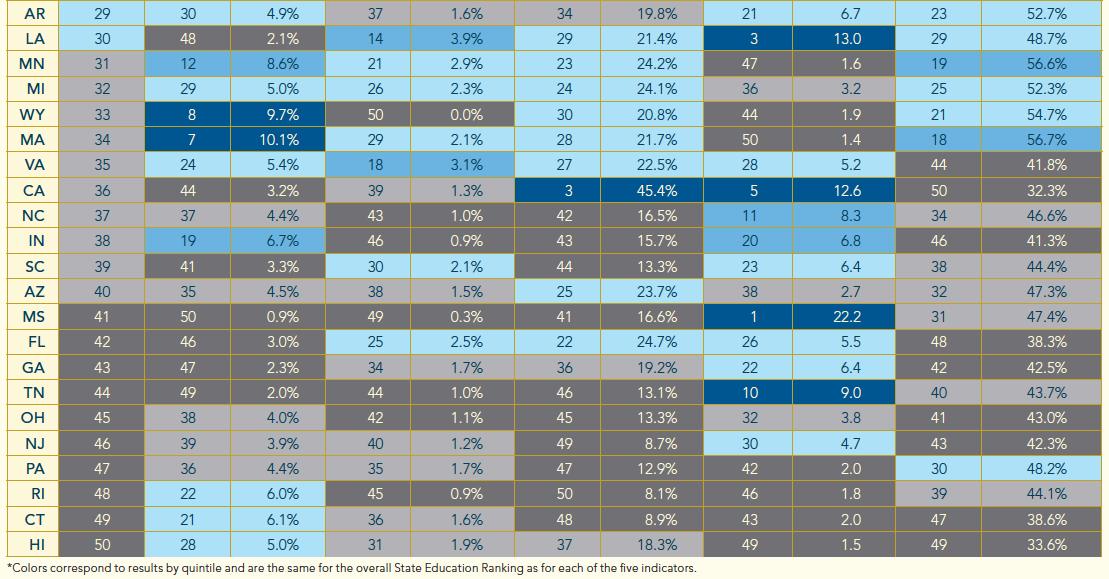
The State Education Ranking measures, shown in Table 3, indicate that the majority of states have difficulty identifying homeless children of all ages. As a result, many children are not accessing the educational services that can prevent the intergenerational cycle of homelessness. Aside from last-ranked Hawaii, the states ranked lowest on the combined five education indicators are located in the southeastern, mid-Atlantic, and northeastern regions of the country, with New Jersey, Pennsylvania, Rhode Island, and Connecticut ranked 46th through 49th (Figure 1). The states most successful at identifying and enrolling homeless children tend to be in the westernmost sections of the country—Alaska, Oregon, and Colorado are the three highest ranking states—with the exception of Vermont and New Hampshire, both ranked in the top ten.5
Educating Homeless Children from Birth to Preschool
According to statistics from the U.S. Census Bureau, there were 24 million children under the age of six in the United States in 2013. While one quarter (25%) lived below the Federal Poverty Level (FPL), or $19,530 for a family of three, it is not known how many of these young children experienced housing instability by living doubled up with another household, in a hotel or motel, in a shelter, or on the streets.11 Economically disadvantaged children, including those experiencing homelessness, benefit from high-quality early childhood education; the percent of homeless children who access these programs, however, is also unknown. Given these limitations, the State Education Ranking uses two indicators as surrogates for the number of young homeless children in a state: the percent who access Head Start and the percent enrolled in pre-K.
Low-income children who participate in high-quality early childhood education programs are less likely to repeat a grade or be placed in special education, graduate from high school at higher rates, and are more likely to be employed and have higher earnings later in life.12 High-quality early education programs are particularly critical for young children experiencing homelessness, who are more at risk than their housed peers for developmental delays and behavioral, emotional, and mental health issues.
Although the total number of homeless children under the age of six is unclear, 4.6% or 50,992 out of 1.1 million children who participated in Early Head Start (EHS), for children zero to three years old, and Head Start (HS), for children ages three to five, were homeless during the 2012–13 program year. Low-income families participating in these federally funded early childhood development programs also have access to supportive social services to address education, health care, nutrition, parenting, and, for families experiencing homelessness, housing needs. With the passage of the Improving Head Start for School Readiness Act of 2007, all homeless children were made automatically eligible for EHS and HS programs, and states were directed to identify and prioritize homeless children for enrollment.13
In addition to Head Start, pre-K programs offer another early education setting in which homeless children can get the tools they need to be ready for school.
However, only 2.9% or 37,598 out of 1.3 million children ages three to five who attended a pre-K program were homeless during the 2012–13 school year, a rate less than that of children in kindergarten and first grade (3.1% and 3.1%, respectively). Given that the incidence of homelessness is greatest among children under six and that the risk and rate of homelessness decrease as children grow older, the low percent of homeless children among pre-K students compared with other grades suggests that many homeless children are not enrolled in public pre-K.14
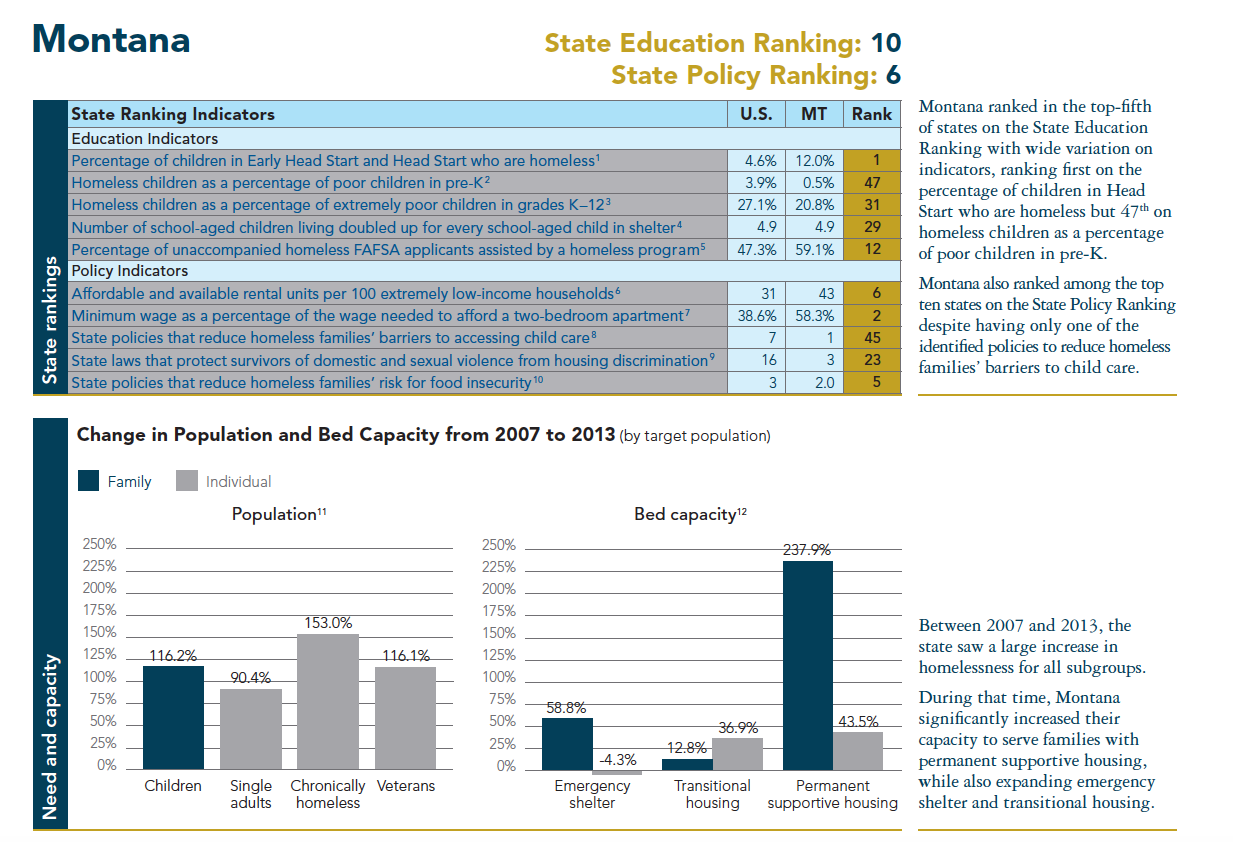
Comparing states on the first education indicator, the State Education Ranking demonstrates that the percent of all children enrolled in either EHS or HS who were homeless varied significantly in 2012–13, ranging from a low of 0.9% in Mississippi to a high of 12.0% in Montana (Example 1). In 33 states, homeless children’s enrollment exceeded the national rate of 4.6%. Northwestern states, including Alaska (11.9%), Idaho (11.1%) and Oregon (10.2%), as well as those in northern New England, such as Maine (11.7%), Vermont (11.1%), and Massachusetts (10.1%), generally enrolled higher rates of homeless children in EHS or HS. The lowest rates were observed across the southeast in Mississippi (0.9%), Tennessee (2.0%), Louisiana (2.1%), Georgia (2.3%), and Florida (3.0%).16 For a detailed discussion of EHS and HS, including barriers to enrolling homeless children, see Issue 6: Mainstream Social Safety Net Programs.
Example 1 Montana’s Head Start
In Montana, 12.0% (or 657) of the 5,472 children enrolled in Head Start during the 2012–13 program year were homeless, the highest rate of any state that year. Although 38 states served more total children in Head Start than Montana, only 25 states enrolled more homeless children in the program.
During the 2012–13 program year, Montana had 29 Head Start programs: nine Early Head Start, 20 Head Start, and no migrant and seasonal Head Start program. These programs served 564 homeless families, 190 of which (or 33.7%) acquired housing during the year, about the same as the national rate of 33.5%. As in most states, the number of homeless families enrolled in Head Start has increased in Montana since the passage of the Improving Head Start for School Readiness Act of 2007. Since the 2007–08 program year, the number of homeless families served by Head Start in Montana has risen 38.2%. While that percent increase is less than half the national average (80.2%), Montana has been improving on an already strong foundation, having had, at 8.2%, the fourth highest percentage of homeless Head Start students of any state during the 2007–08 program year.15
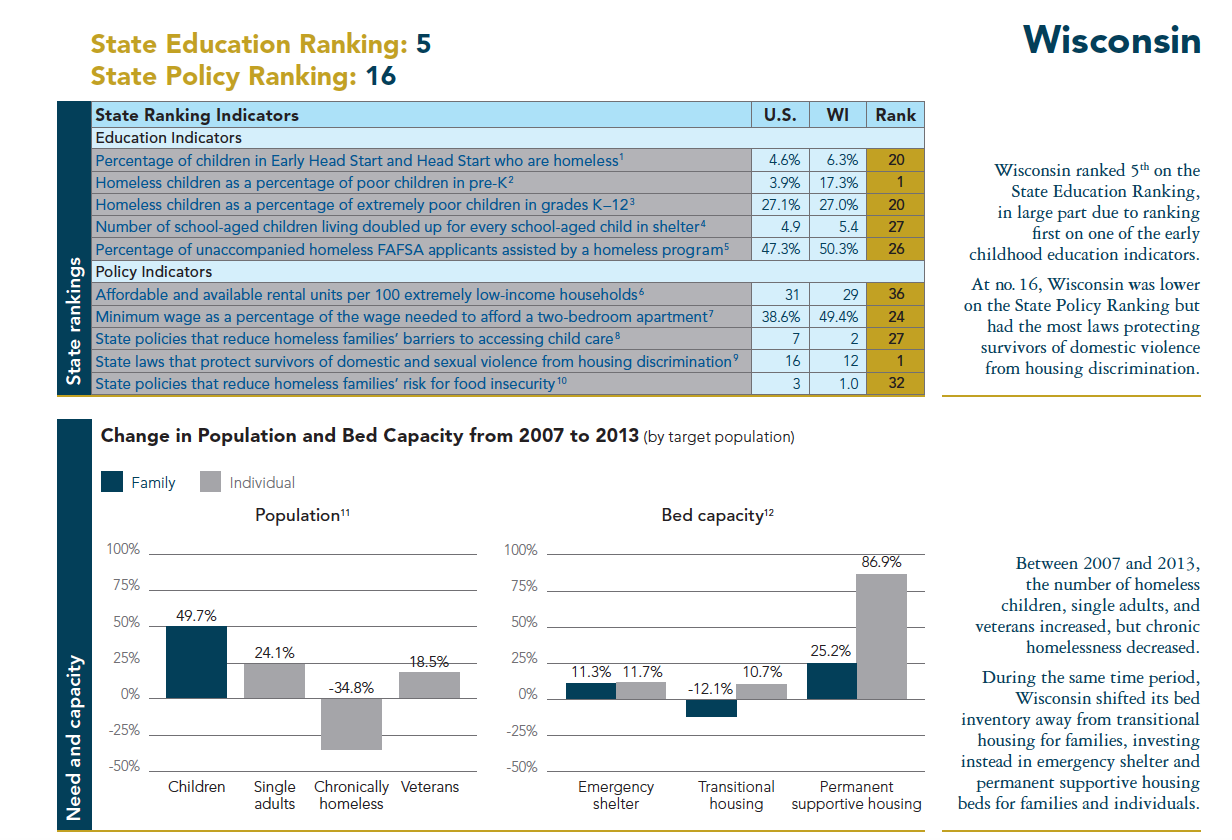
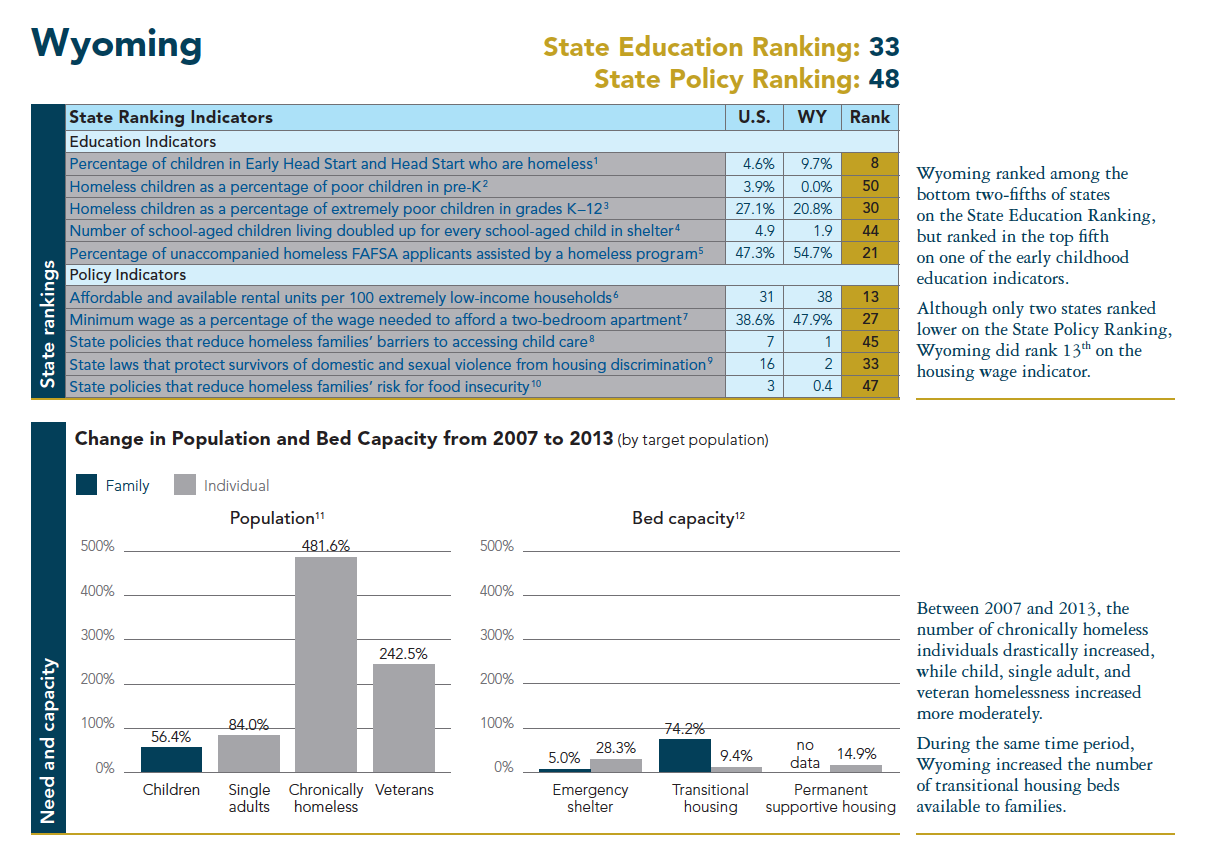
To assess how states are faring on the second education indicator—facilitating access to pre-K—the State Education Ranking compares the number of homeless children with the number of poor children attending pre-K. The numbers of homeless children and poor children are compared with each other, rather than with all children, in order to control for the effects of poverty in a particular state; greater proportions of poor children could be the reason why higher percentages of homeless children are enrolled in pre-K. Nationwide, 3.9% of all poor children enrolled in pre-K also experienced homelessness during the 2012–13 school year. Only 14 states had rates that surpassed the national average, with the percentage ranging from a high of 17.3% in Wisconsin to a low of 0.0% in Wyoming (Example 2).
Example 2 Wisconsin’s Pre-K
During the 2012–13 school year, 1,887 homeless children between the ages of three and five were enrolled in a state pre-K program in Wisconsin. As a percentage of all poor children enrolled, homeless children made up 17.3%, the highest rate of any state. Although a greater number of poor children were enrolled in pre-K in 27 other states, only three states served more homeless children than Wisconsin. The state’s commitment to improving early childhood education has been recognized on the national level when the state was awarded a Race to the Top Early Learning Challenge (RTT-ELC) grant from the U.S. Department of Education and U.S. Department of Health and Human Services in 2012. RTT-ELC is a competitive federal grant program to support states in developing high-quality early education systems, and Wisconsin is using the funding to increase consumer outreach, among other priorities.17
The existence of well-funded state-financed preschool programs did not necessarily guarantee greater access for young homeless children. This was the case with Vermont, Florida, and Oklahoma. These states enrolled children in state pre-K programs at the highest rates nationwide during the 2012–13 school year (46%, 40%, and 37%, respectively). While Oklahoma ranked seventh among states on the State Education Ranking’s second education indicator—homeless children as a percentage of poor children in pre-K—these results did not translate to Vermont and Florida, ranked 19th and 25th, respectively, and both states’ rates fell below the national average. States ranked 46th through 50th—Indiana, Montana, North Dakota, Mississippi, and Wyoming—all lacked state public pre-K programs. Homeless children could only enroll in local public or private pre-K in these states.18
Identifying and Serving Homeless Children in Grades Kindergarten through 12
In 2013, the U.S. Census Bureau counted 49 million children between the ages of six and 17. One-fifth (21%) of these school-aged children were poor.19 According to the U.S. Department of Education, 1.3 million students experienced homelessness during the 2012–13 school year.
The McKinney-Vento Homeless Education Assistance Improvements Act (McKinney-Vento) guarantees homeless students the right to the same quality of education that their housed peers receive. McKinney-Vento requires that every local education agency (LEA) appoint a liaison to identify and serve homeless students, including those who are living in shelters and those in doubled-up living situations. This is an inadequately funded mandate however, as fewer than one in four of the more than 16,000 LEAs receive subgrants from the federal Education for Homeless Children and Youth program, the primary source of funding to support homeless school liaisons’ work. The few LEAs that are funded enroll roughly two-thirds of all students identified as homeless each year.
Despite limited resources, dedicated liaisons across the country have heightened outreach efforts to homeless students and have been particularly successful at identifying those in doubled-up situations, who are more difficult to account for and who often do not view themselves as homeless. The majority of the 85.1% increase in the number of homeless students between the 2006–07 and 2012–13 school years was due to a 122.4% rise in the number living doubled up.20 Identifying doubled-up students is critical given that shelter capacity is limited; 17 of 24 cities surveyed for the U.S. Conference of Mayors’ 2013 Hunger and Homelessness Survey reported turning away homeless families due to a lack of available shelter beds.21 Families sharing the housing of others due to loss of housing, economic hardship, or a similar reason may have insufficient access to basic necessities and supportive services to help them secure their own housing. Children living doubled up often move frequently as their parents exhaust their network of family, friends, and other non-relatives for places to stay. Homeless mothers may endure relationship violence to maintain these temporary living situations.22 For a detailed discussion of trends in the number of homeless students, see Issue 1: Definitions, Demographics, and Trends in Student and Family Homelessness.
The State Education Ranking uses two complementary measures to assess how well states are identifying and serving homeless students from kindergarten through grade 12: homeless children as a percentage of extremely poor children and the number of children living doubled up for every child staying in a shelter.
As with the percent of poor children in pre-K who are homeless (the second education indicator), the State Education Ranking compares the number of school-aged homeless children with those who are extremely poor (living at or below 50% of the FPL, which amounted to $9,765 for a family of three in 2013), in order to control for the effects of poverty across states. While not all families experiencing homelessness are extremely poor, the overwhelming majority of homeless families are.24 Therefore, states with higher rates of school-aged homeless children in comparison with those of extremely poor children are likely more effective at identifying and enrolling homeless students.
The national rate of homeless children as a percentage of extremely poor children was one-quarter (27.1%) during the 2012–13 school year. In other words, one out of every four school-aged children who lived in extreme poverty experienced homelessness. Led by Alaska (69.4%), Utah (48.0%), California (45.4%), and New York (45.4%), 19 states surpassed the national average on this third education indicator (Example 3). Rhode Island (8.1%), New Jersey (8.7%), and Connecticut (8.9%) had the lowest ratios of school-aged homeless to extremely poor children, indicating that these states are less successful in conducting outreach to and identifying homeless students.25
Example 3 Alaska’s Homeless Students
At 69.4%, Alaska had the highest ratio of school-aged homeless to extremely poor children of any state during the 2012–13 school year. More than two out of three school-aged children who lived in extreme poverty were identified as homeless.
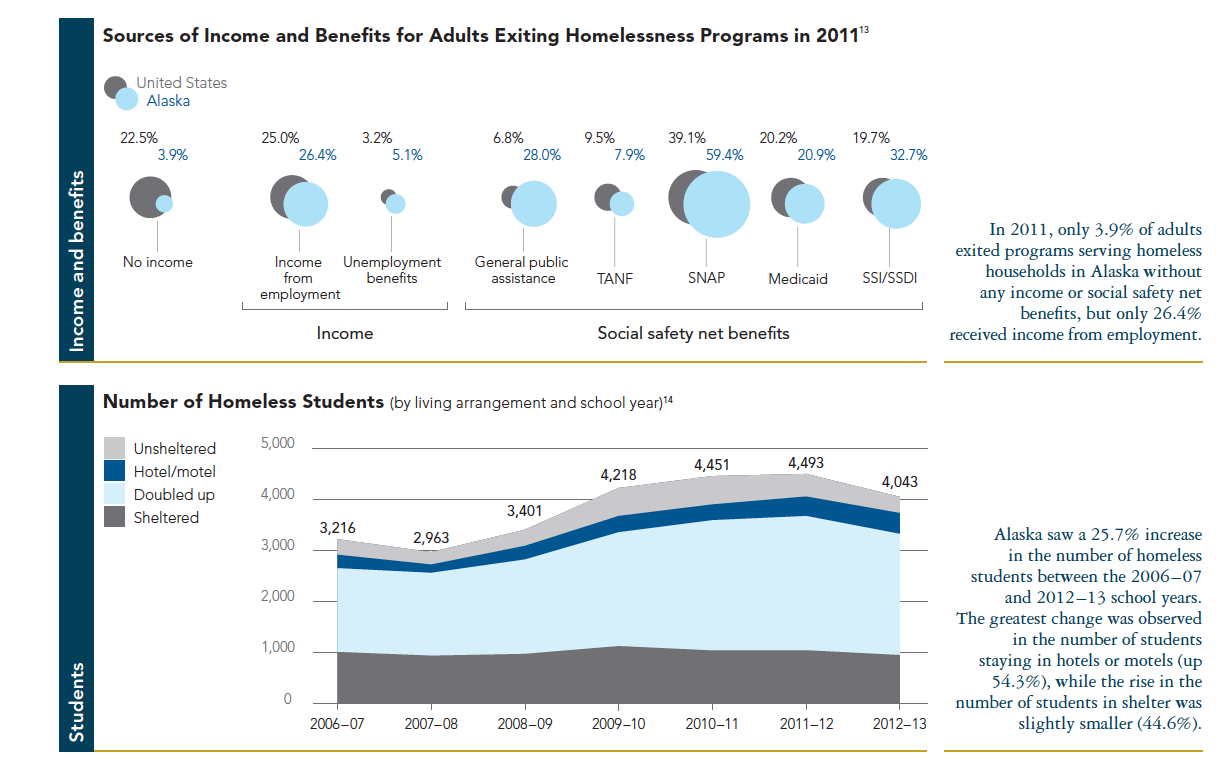
In the 2012–13 school year, 59% of homeless students were identified as living doubled up, 23% in shelter, 8% in hotels or motels, and 10% unsheltered. Since the rate of doubled-up students is near the national average, Alaska has been successful in identifying students living in doubled-up situations, despite only five of the 54 LEAs in Alaska receiving funding through McKinney-Vento subgrants. For LEAs with and without subgrants, the difference in identified homeless students is stark: 3,882 versus 161, respectively. This may be a reflection of the population concentration in Alaska, where the vast majority of people reside in a few areas of the state.23
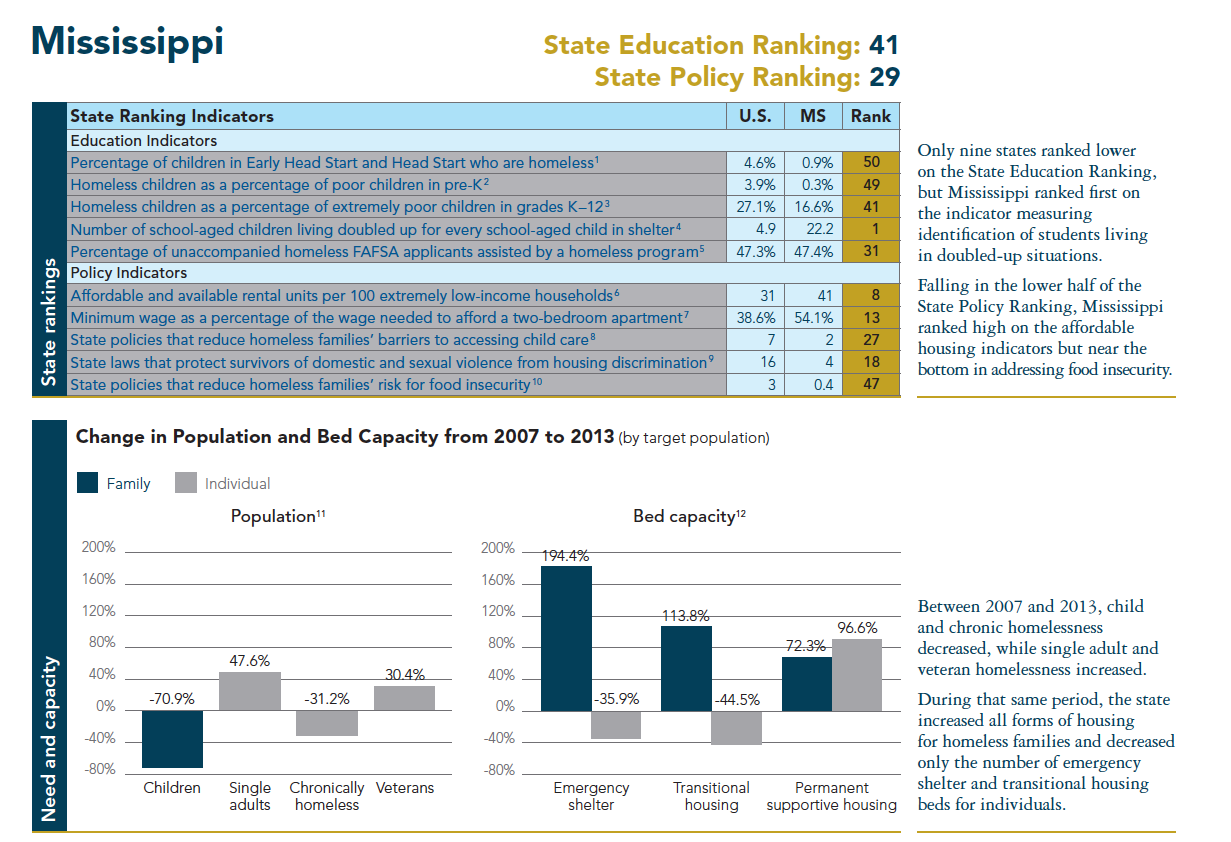
Since the percentage of students living doubled up (75.5%) is about five times higher than that of those living in shelter (15.5%) nationwide, states with high numbers of sheltered students compared with doubled-up students are likely not as effective at identifying homeless students in doubled-up situations. The national number of school-aged children living doubled up for every school-aged child staying in a shelter— the fourth education indicator—was 4.9 in school year 2012–13. In other words, for every school-aged child living in a shelter, there were nearly five (4.9) school-aged children staying doubled up with another household due to loss of housing, economic hardship, or a similar reason. Twenty-eight states were above the national average, led by Mississippi (22.2), Utah (15.9), and Louisiana (13.0) (Example 4). Massachusetts (1.4), Hawaii (1.5), and New York (1.5) identified the fewest students living doubled up compared with those in shelter.28
Example 4 Mississippi’s Doubled-up Students
Mississippi identified the most children living doubled up (11,655) compared to children staying in shelter (524) of any state during the 2012–13 school year. For every school-aged child living in shelter, Mississippi identified 22 school-aged children living doubled up.
One explanation for Mississippi’s high sheltered-to-doubled-up ratio could be that homeless school liaisons are working diligently to identify vulnerable students despite receiving limited federal assistance to carry out this mission. Only 18 of Mississippi’s 151 LEAs received McKinney-Vento subgrants in School Year 2012–13.26 Another possible explanation is that the limited availability of family shelters in the state forces many homeless families to stay with friends and family members.27
Encouraging Unaccompanied Homeless Youth to Attend College
According to the U.S. Census Bureau, there were 21 million students enrolled in college, graduate, and professional schools in 2013, and almost one-quarter (24%) of these students were living in poverty. Completing higher education benefits students’ future employment and earnings. In 2013, college graduates were three times less likely to be poor and two times less likely to be unemployed than adults with only high school diplomas. Over the course of 40 years, adults with bachelor’s degrees earn nearly twice as much as workers with high school diplomas.29 What is not known, however, is the number of college students who are homeless. The State Education Ranking uses the number of homeless students unaccompanied by a parent or guardian who file the Free Application for Federal Student Aid (FAFSA), which is the only available data on college students experiencing homelessness.
The college admissions process can be overwhelming for any young adult. For youth experiencing homelessness, the fees associated with applying to college—Advanced Placement exams, entrance exams such as the SAT, and college applications—can be barriers to applying. An additional challenge for homeless students is filing the FAFSA, typically completed in late winter or early spring of the year in which students plan to enter college. In order to be evaluated for federal student aid, students or their parents must complete the FAFSA, which requires parents’ financial information. Students experiencing homelessness, and unaccompanied homeless youth in particular, may not be able to provide this information and may be denied aid for submitting an incomplete application. Unaccompanied homeless youth can have this requirement waived and apply for aid as an independent student if a school liaison, shelter staff, or a runaway and homeless youth program administrator can verify that they are homeless.
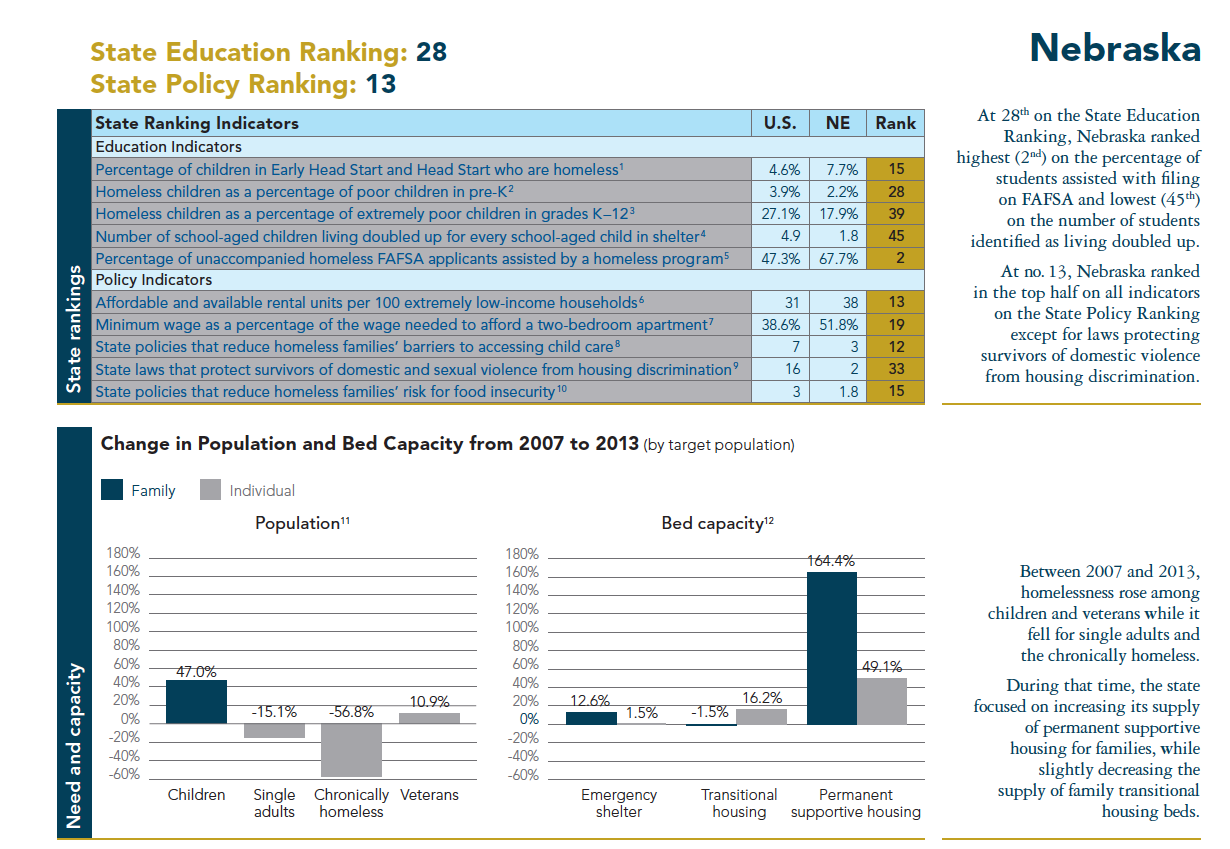
Not all unaccompanied homeless students applying for financial aid are assisted by a school, shelter, or youth program. Less than half (47.3%) of college-bound unaccompanied homeless students nationwide received help filing the FAFSA during the 2012–13 application cycle. On this last education indicator, 33 states had rates higher than the national average, with school, shelter, and youth program representatives in Maine (67.9%), Nebraska (67.7%), South Dakota (67.6%), and Alaska (66.0%) aiding the highest percentage of applicants (Example 5). The lowest rates were found in California (32.3%), Hawaii (33.6%), and Florida (38.3%).31
Example 5 Maine’s Help on Filing the FAFSA
Of the 299 unaccompanied homeless students in Maine who completed the FAFSA during the 2012–13 application cycle, 203, or 67.9%—the highest percentage in the nation—were assisted by a school liaison, shelter staff, or runaway and homeless youth program administrator. The number of FAFSA filings in Maine is low overall; only 17 states had fewer applications from homeless students and 13 states had fewer total students completing the FAFSA. Predominantly rural states with fewer students completing the FAFSA generally had the highest rates of unaccompanied homeless FAFSA applicants assisted by a school, shelter, or youth program—after Maine, the highest rates were found in Nebraska, South Dakota, and Alaska.30
State Policy Ranking
Enacting Policies to Support Homeless Families and Prevent Homelessness
While families often become homeless for a variety of reasons, lack of available affordable housing is an important factor, particularly in areas with relatively low wages. Survivors of domestic violence can become homeless due to a lack of policies to protect tenants’ housing rights. Once housing is lost, it can be challenging for parents to meet their family’s basic needs, which further hinders attempts to gain stability. Parents experiencing homelessness have an especially urgent need for child care as they struggle to find housing, employment, and other services. Parents also face the added stress of trying to adequately feed their family. Many policy decisions made at the state level determine what resources and services families can access and what protections they have.
Taking all of these factors into account, the ICPH State Policy Ranking looks at specific policies that states should enact to better serve homeless children and their parents. The ranking examines not only the availability and affordability of housing, but also states’ efforts to improve homeless families’ access to child care, protect survivors of domestic violence from housing discrimination, and reduce homeless families’ risk for food insecurity. For the latter three indicators, states ranked higher when they had more of the laws or policies described. Each of these components is not only under the control or influence of the state, but each can also have a significant impact on the lives and experiences of homeless families. Changes in the areas assessed are actionable, feasible, and vital to reduce the negative impacts of homelessness on children and families.
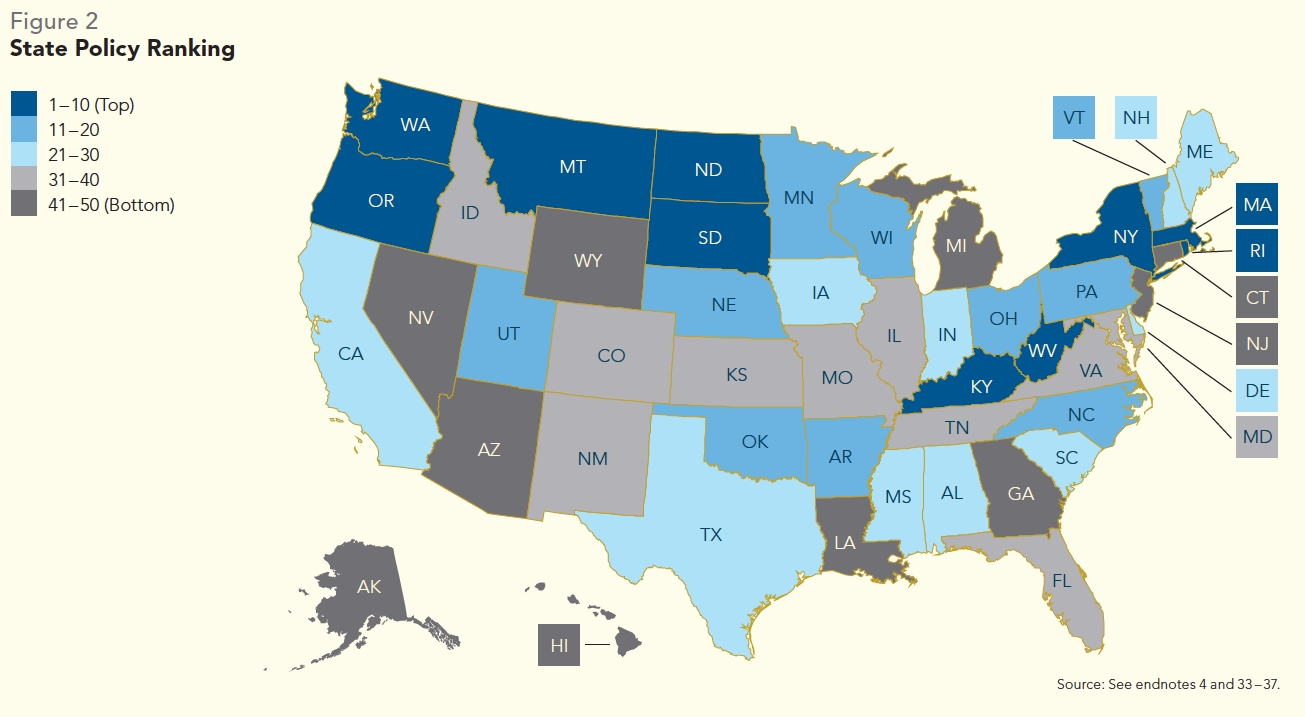
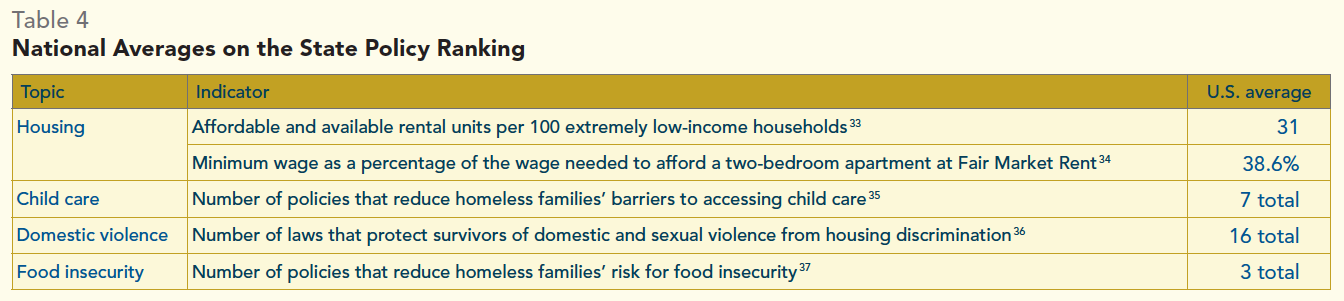
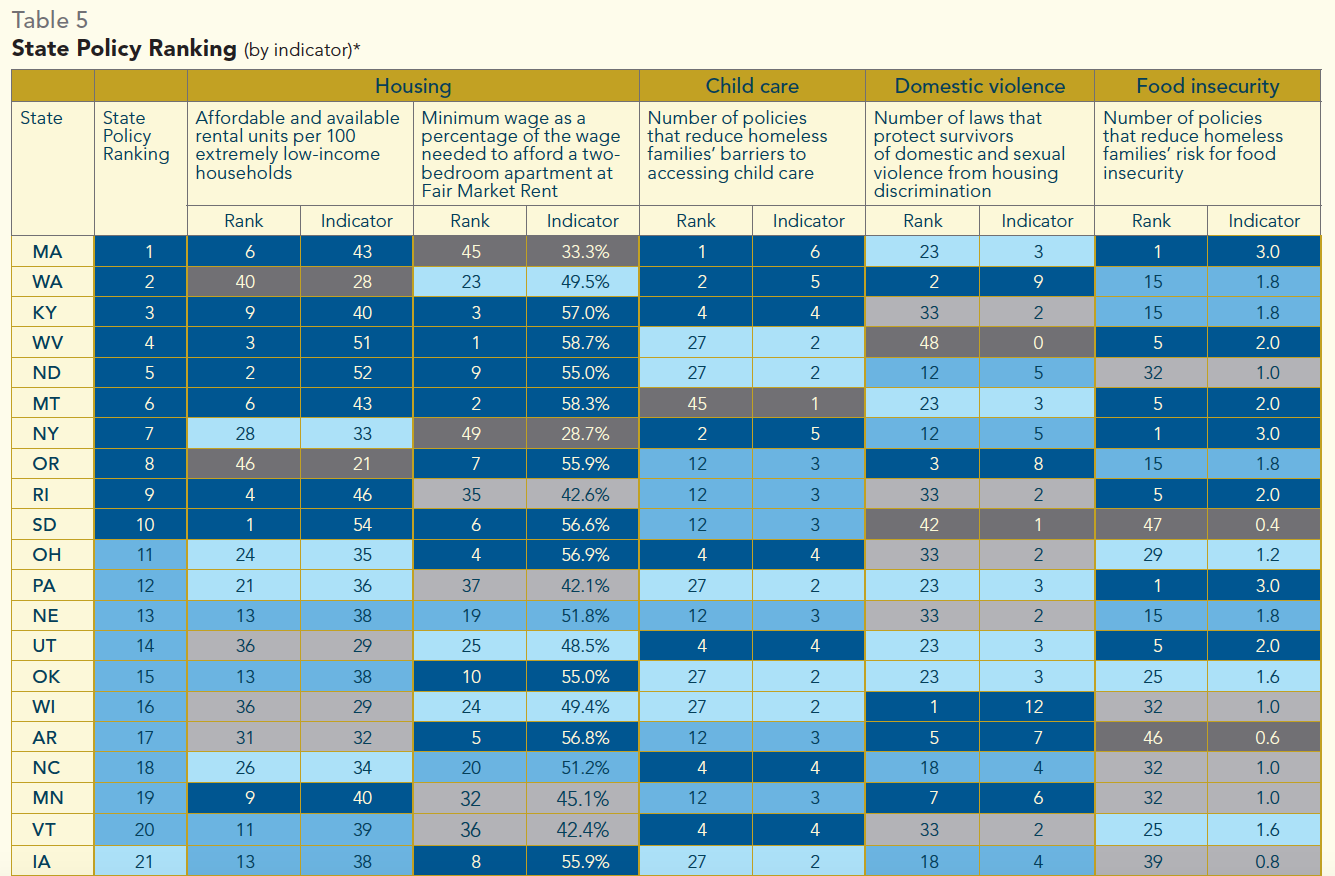
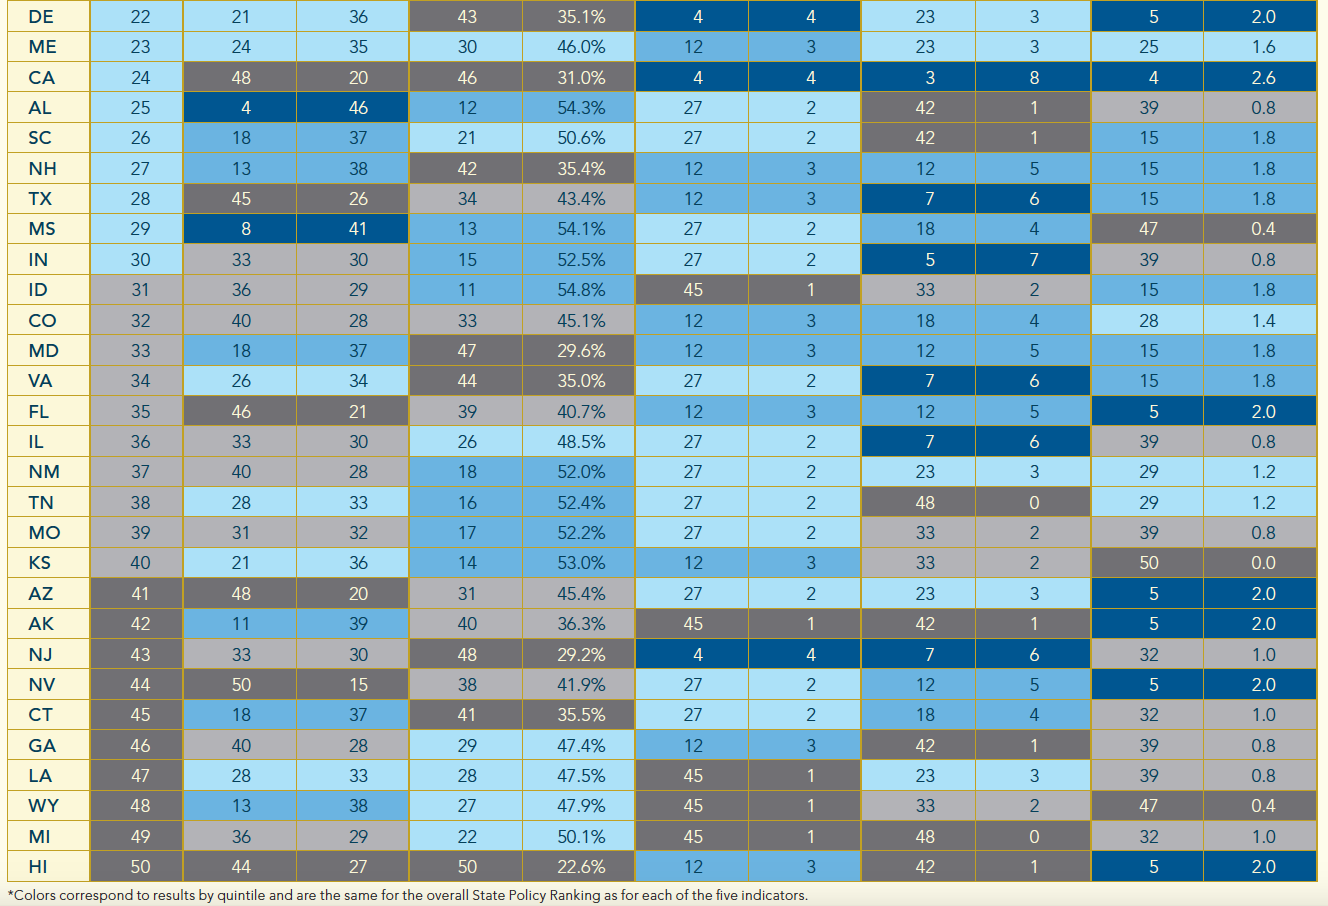
The State Policy Ranking measures are shown in Table 4. The states with the most proactive policy context for supporting homeless families are in the western and mid-Atlantic regions, with the notable exception of top-ranked Massachusetts in New England (Figure 2), with Wyoming, Michigan, and Hawaii sitting at the bottom of the ranking (Table 5).32
Housing Affordability for Extremely Low-income Families
Lack of affordable housing is one of the main drivers of family homelessness. For housing to be considered affordable, a family must spend no more than 30% of its income on housing costs. More than half (51.5%) of all households in the United States were rent burdened in 2013 and more than one-quarter (26.5%) were severely rent burdened, spending over 50% of their income on rent. Three-quarters (75%) of extremely low-income (ELI) renter families—those earning 30% or less of their local area’s median income—were severely rent burdened. These families are only a small financial crisis away from losing their housing.40
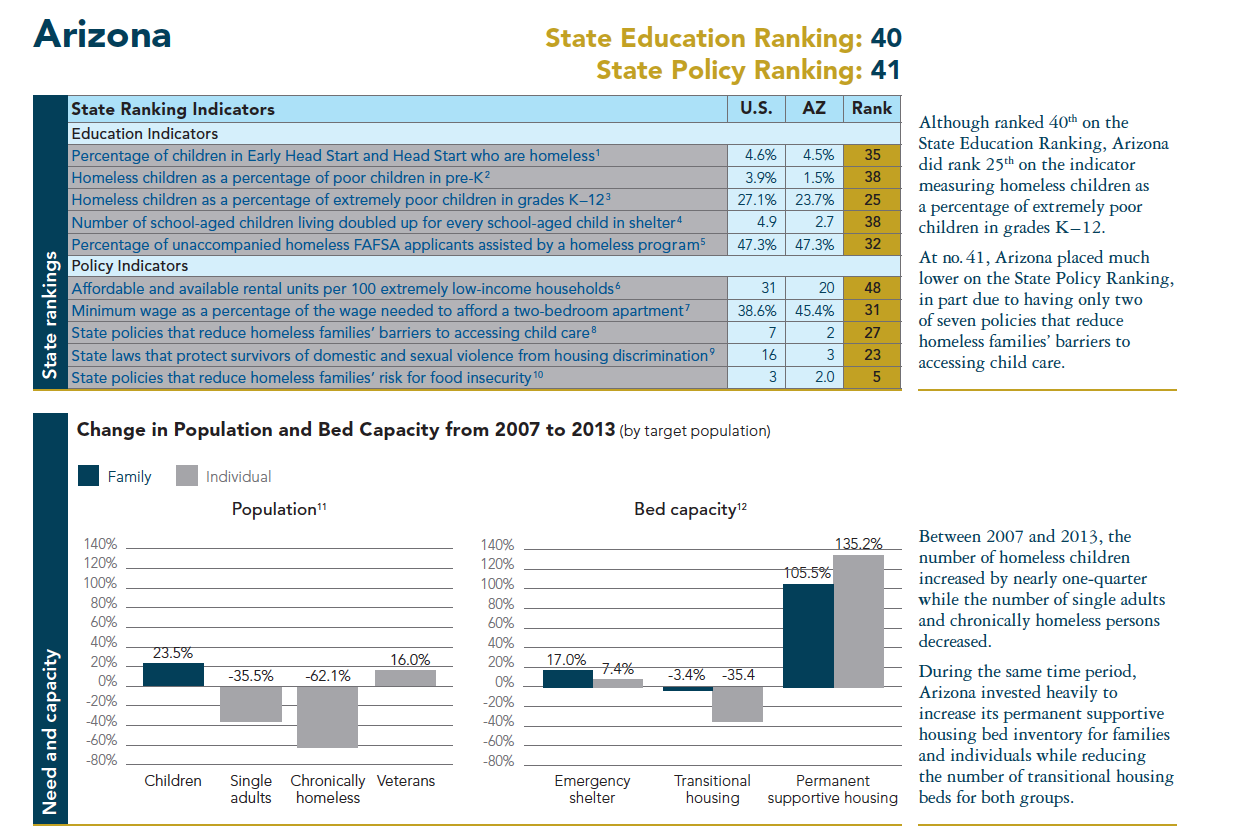
In 2012, the demand for affordable housing among ELI families far exceeded the supply in every state. The average number of affordable and available units per 100 ELI households was 31 in 2012. In other words, only 31% of ELI households could access affordable housing.41 Led by South Dakota (54 [Example 6]) and North Dakota (52), 32 states surpassed the national average on this first policy indicator. ELI households in Nevada (15), Arizona (20), and California (20) had the most difficulty finding affordable housing. For a detailed discussion on the shortage of affordable housing, see Issue 2: Macroeconomic Causes of Family Homelessness.
Example 6 South Dakota’s Affordable Housing
Fifty-four out of every 100 ELI renters in South Dakota could theoretically find an affordable and available rental unit. While this places the state at the very top on the affordable housing indicator, many of its low-income residents still struggle to find affordable rental housing. The state’s more favorable rental market is mostly explained by its low housing costs. Large variations exist within the state, with the most severe deficits in affordable housing availability (less than 25 units per 100) seen in the more populous counties in the southeast and southwest.38 The same clusters of counties also experience the highest rates of homelessness.
South Dakota enjoys a low unemployment rate (3.8% in 2013 compared with 7.4% nationwide), masking the fact that despite working full-time, the average renter cannot afford a FMR apartment. At $9.70 per hour, the average wage for a South Dakota renter falls short of the housing wage ($12.82). At $7.25, the minimum wage is even more insufficient, however, South Dakota did vote in 2014 to increase the minimum wage from $7.25 to $8.50 beginning in 2015. Of the state’s 22% ELI renters in 2014, 78% are cost burdened and 57% are severely cost burdened.39
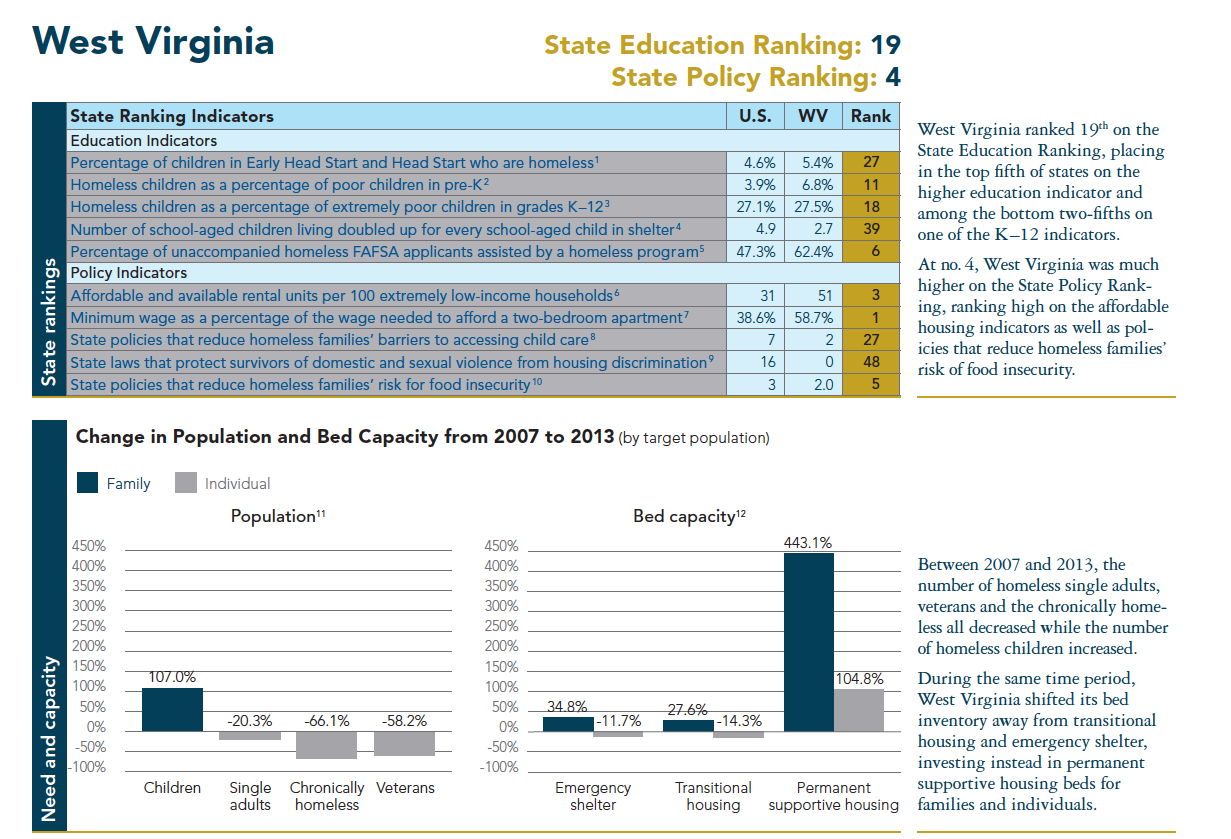
With low levels of education and limited work experience, the majority of homeless families only qualify for minimum-wage jobs. Due to a severe lack of affordable housing, even those who work full-time and earn the minimum wage struggle to find and maintain housing. Measuring the minimum wage against the “housing wage”—the wage needed to afford a two-bedroom apartment at Fair Market Rent (FMR)—reflects how likely families are to be able to afford housing in a specific state, thereby lowering the risk of homelessness. On this second policy indicator, the average minimum wage amounted only to two-fifths (38.6%) of the housing wage needed to afford a two-bedroom apartment in 2013. In no state could a family with a single wage-earner working full-time at the minimum wage afford a two-bedroom FMR apartment. The minimum wage covered the greatest proportion of the housing wage in West Virginia, at 58.7% (Example 7), and the lowest, 22.6%, in Hawaii. Heads of households in every state, then, could be working full-time and find themselves homeless. The gap between the minimum wage and the housing wage underscores both the dearth of affordable housing and the limited purchasing power of the minimum wage. Even if the minimum wage was raised to $10.10 per hour in every state, the amount specified in the Minimum Wage Fairness Act of 2014, families earning the minimum wage for full-time work would still not be able to afford a two-bedroom apartment in any state.43
Example 7 West Virginia’s Minimum/Housing Wage
The minimum wage goes the furthest in covering the housing wage in West Virginia. The FMR for a two-bedroom apartment in West Virginia is $642 per month. For this rent to be considered affordable, a household would have to earn $2,141 per month or $25,693 per year. To calculate the housing wage, that annual income is broken down into an hourly rate. Based on a 40-hour work week with 52 weeks in a year, the housing wage is $12.35. The federal hourly minimum wage of $7.25, the same as the West Virginia state minimum, accounts for 58.7% of the state’s housing wage. While this is the highest percentage of any state, it still falls far short of the income needed to afford a two-bedroom apartment at FMR. A full-time minimum wage earner would have to earn $5.10 more per hour or $10,613 more per year to afford that apartment.
In 2013, 31 states in addition to West Virginia had a minimum wage of $7.25. West Virginia ranks highest on this policy indicator, then, because the cost of a two-bedroom apartment at FMR in West Virginia is the lowest of all those states. In 2014, West Virginia moved to increase the minimum wage to $8.00 in 2015 and $8.75 in 2016, which will likely help more families avoid the consequences of rent burden.42
Policies Reducing Homeless Families’ Barriers to Child Care
Child care is critical for homeless families, especially those headed by a single parent, to find and maintain employment. However, homeless families face several barriers to accessing child care. In addition to the high cost of child care— in 2012, the average annual cost of center-based child care for a four-year-old was $7,817, nearly half the income for a family of three living in poverty—finding a child care provider who can accommodate homeless families’ often irregular and unpredictable schedules can be challenging. Although child care subsidies are intended to provide low-income families with affordable and flexible child care options, some homeless families are deterred by restrictive documentation and eligibility requirements.46
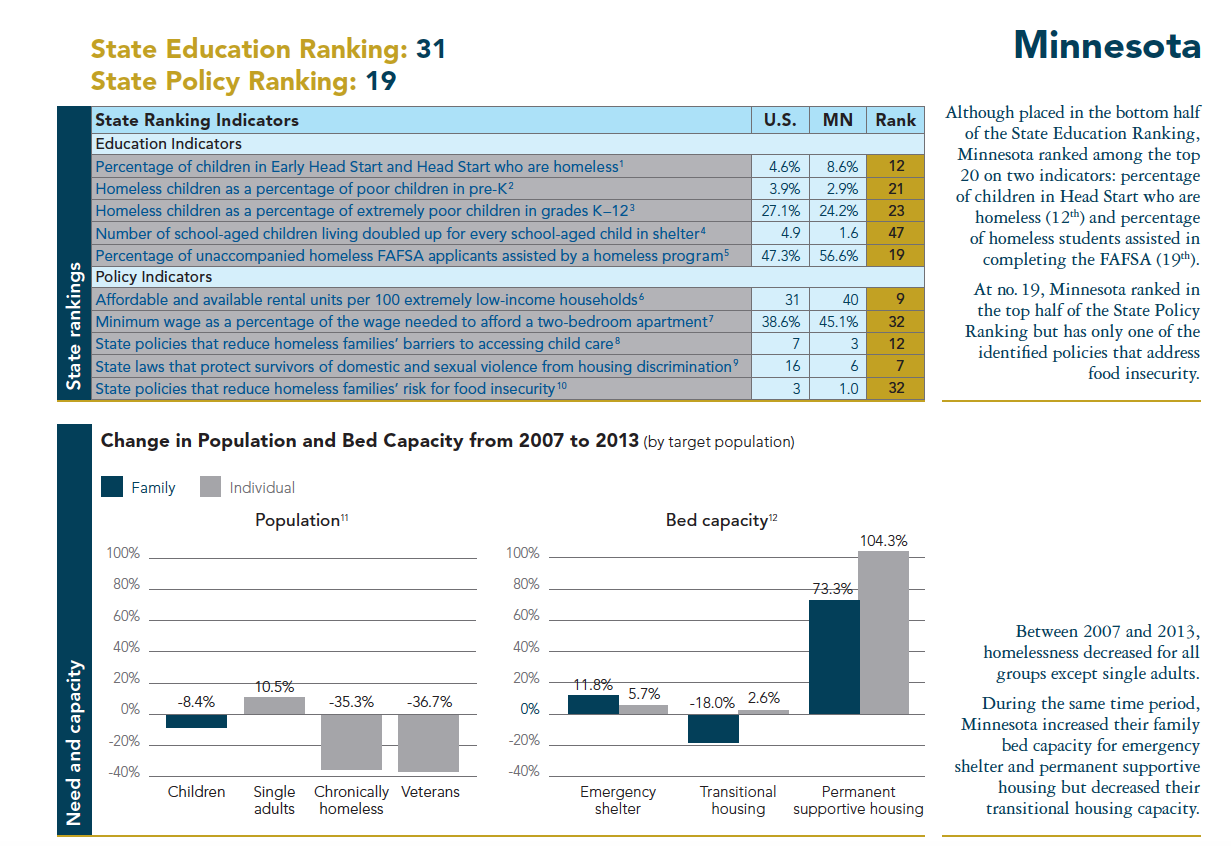
In administering the Child Care and Development Fund (CCDF), the primary federal source of child care assistance for low-income families, states have the flexibility to develop many of their own eligibility rules. States can improve homeless children’s access to subsidized child care by: including homelessness as a reason for needing care (making it its own eligibility category), including homeless children as a priority population to serve, providing care while parents look for a job or housing, waiving co-payments, establishing higher reimbursement rates for providers offering care during nontraditional hours, extending initial child care eligibility to 12 months, and extending eligibility while children participate in Head Start. According to states’ CCDF plans for federal Fiscal Years 2014–15, no state has instituted all seven of these policies, but every state has at least one. Massachusetts (Example 8) performed the best on this third policy indicator with six in place, while five states are tied for having the fewest, with only one of the seven policies: Alaska, Idaho, Louisiana, Michigan, and Montana.47 For a detailed discussion on child care, see Issue 2: Macroeconomic Causes of Family Homelessness.
Example 8 Massachusetts’ Child Care Policies
With six of the seven child care subsidy policies analyzed, Massachusetts ranks highest among all states. In Massachusetts, subsidies may be used during time spent searching for a job or housing, and parents are initially deemed eligible for care for a period of 12 months. In addition, homeless children may be eligible for subsidized care due to a need for protective services, which would enable them to receive care without the family meeting the traditional work and training requirements. The copayment and income eligibility requirements may be waived in these protective services cases. Massachusetts also prioritizes homeless families among low-income families and will waive copayments for those with incomes at or below the FPL. Lastly, child care providers serving priority populations receive additional funding for services such as case management and transportation.
Massachusetts has dedicated substantial fiscal and personnel resources to child care quality and access, becoming, in 2005, the first state with a separate agency overseeing the provision and oversight of early childhood education and care services. The Massachusetts Department of Early Education and Care (EEC) manages the state’s child care program and collaborates with other government agencies in the state, including the Department of Housing and Community Development, in setting and implementing their CCDF policies. In addition to the policies described above and compared to other state agencies, EEC has made a special effort to address the care needs of homeless families and collaborate with homelessness service providers. EEC allows up to six months for certain priority populations, including homeless families, to provide medical records necessary for enrollment.44 With a portion of the quality improvement funding the state is awarded for administering CCDF, EEC supports outreach to hard-to-reach populations and walk-in services for homeless families. Massachusetts is one of only 13 states that serves at least some subsidy recipients through contracts or subgrants—in FY12, Massachusetts served 40% through this method—and sets aside grants for “homeless child care.” EEC contracts with programs that provide child care to homeless children; one of the aims is to ensure that the parents of these children have access to other supportive services they may need to secure housing and work.45
Laws Protecting Survivors of Domestic Violence from Housing Discrimination
One out of every four homeless women is homeless as a direct result of domestic violence, and over 90% of homeless mothers experience severe physical and/or sexual abuse during their lifetimes.48 Individuals who escape their abusers often have limited financial resources and face discrimination in the housing market, leaving them with few safe housing options. Although the 2013 reauthorization of the Violence Against Women Act extended federal housing protections to survivors of domestic violence in all federally subsidized housing programs, those living in other housing situations may still be at risk of eviction or losing their housing.
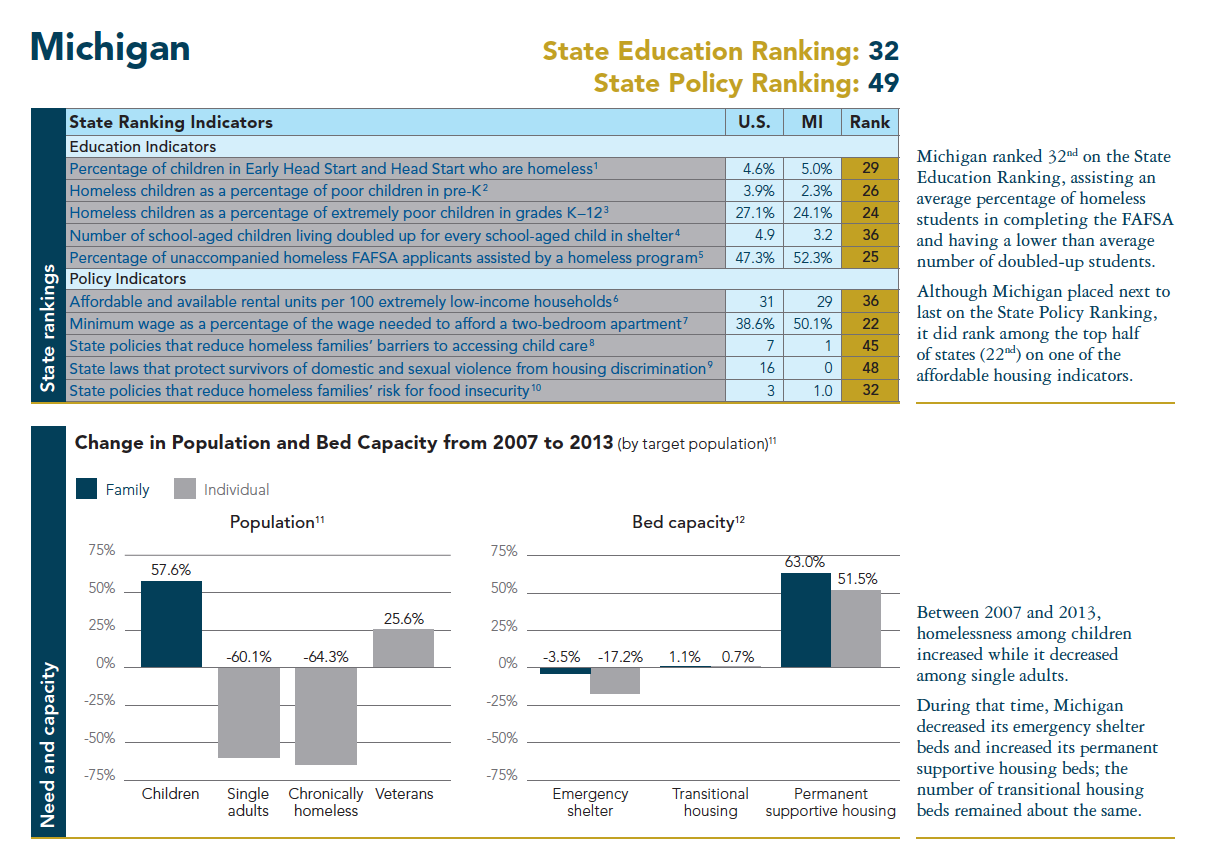
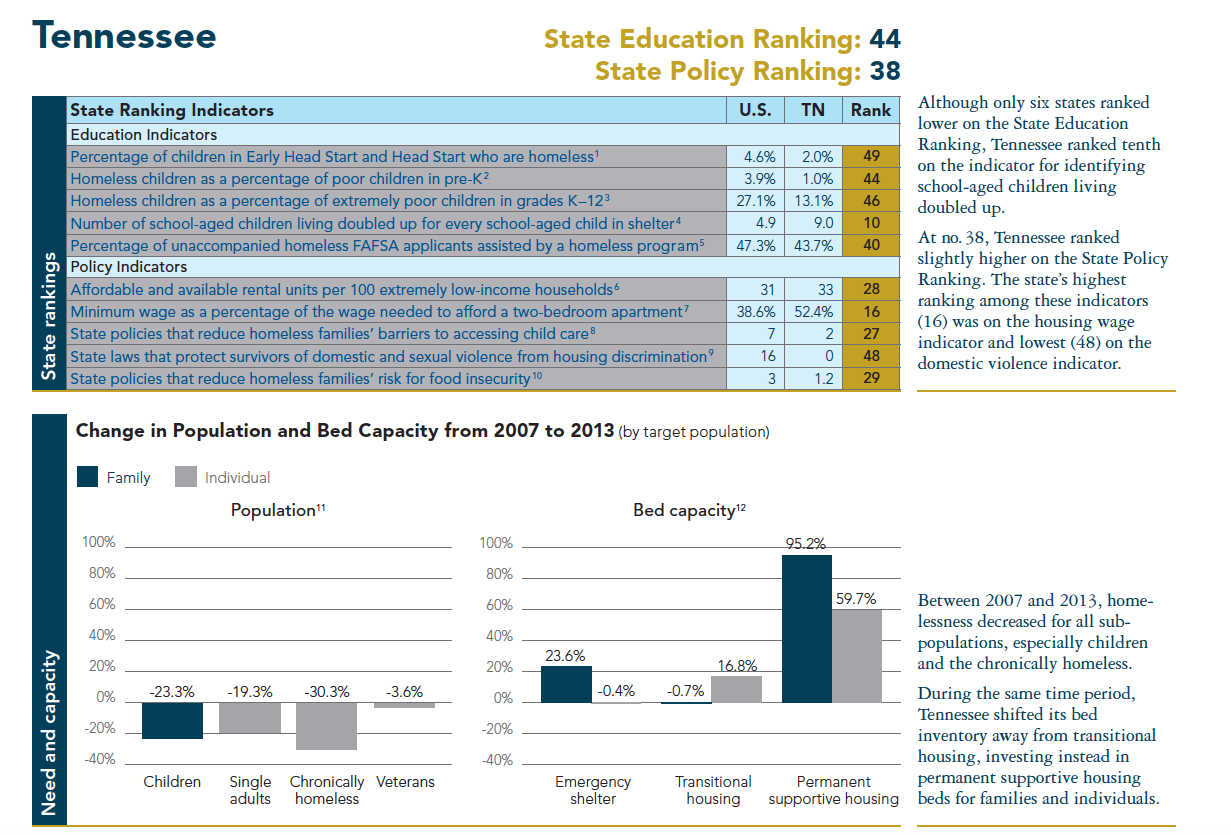
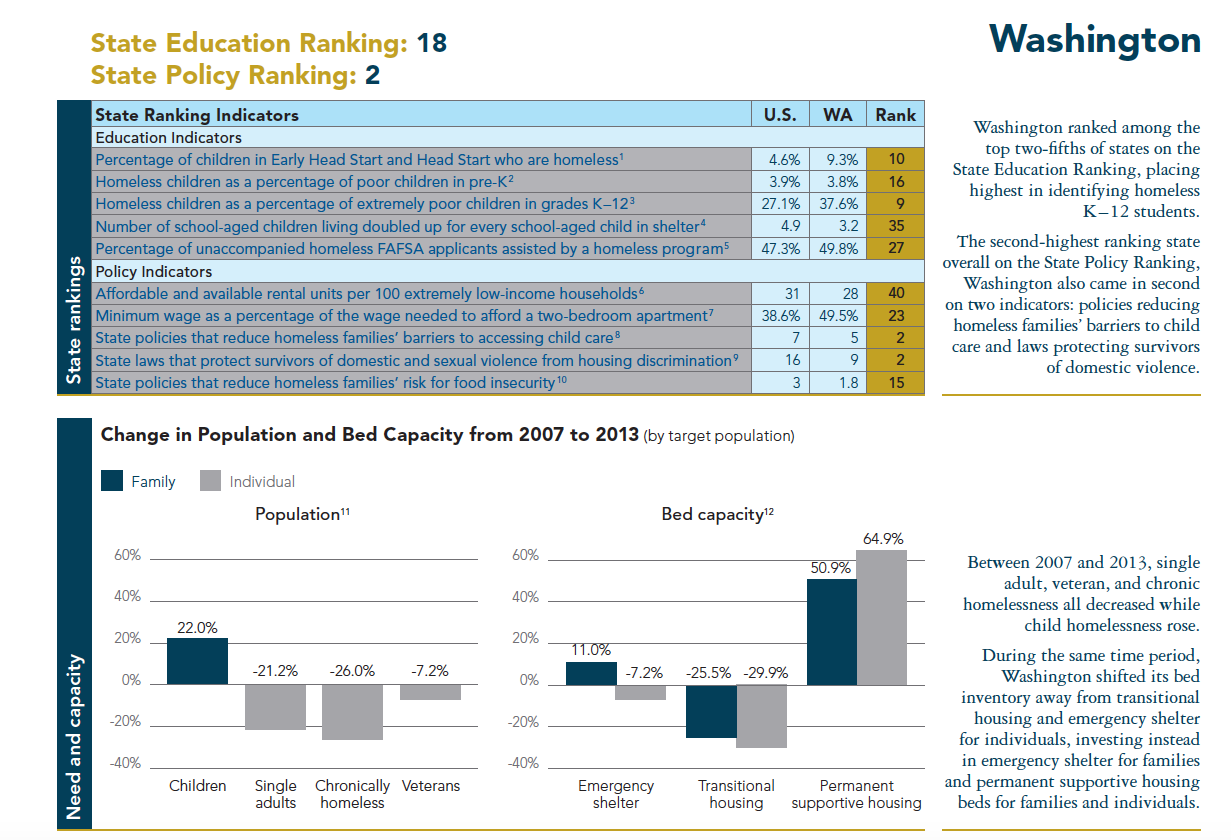
A number of states have adopted legislation providing additional protections and rights to survivors of domestic violence, such as prohibiting tenants from waiving their right to call police, enabling survivors to terminate leases early without penalty, and providing relocation or housing assistance. For this fourth policy indicator, 16 state laws were used that had been reviewed in the National Law Center on Homelessness and Poverty’s report, There’s No Place Like Home: State Laws that Protect Housing Rights for Survivors of Domestic and Sexual Violence. Wisconsin had the most laws, with 12 (Example 9). Washington, the state with the second-highest number of laws, had nine. Three states, Michigan, Tennessee, and West Virginia, did not have any of the laws in place.50 For a detailed discussion of the relationship between domestic violence and housing instability, see Issue 3: Effects of Homelessness on Families and Children.
Policies Reducing Homeless Families’ Risk for Food Insecurity
Families in poverty experience high levels of food insecurity, which the U.S. Department of Agriculture defines as limited or unstable availability of adequate amounts of nutritious food. Given their limited financial resources and housing instability, homeless families are at an even greater risk of becoming food insecure. The two primary federal mainstream programs that address food insecurity among homeless families are the Supplemental Nutrition Assistance Program (SNAP, formerly known as the Food Stamp Program) and the Special Supplemental Nutrition Program for Women, Infants, and Children (WIC).51 By freeing up resources to pay for other necessities, including housing, these programs reduce the likelihood that a poor family will become homeless and support homeless families in gaining economic and housing stability. For this fifth and last policy indicator, the State Policy Ranking examines two federal SNAP policies and one federal WIC policy that states can implement to reduce homeless families’ risk for food insecurity.
The amount a family receives in SNAP benefits is based on their income. The first SNAP policy allows families without permanent residences who are applying for SNAP to reduce their reported net monthly income by using one of two deductions that account for shelter costs. Qualifying shelter expenditures range from formal fees at emergency shelters to informal payments to double up at a friend, family member, or other non-relative’s residence. All states offer the option of deducting excess shelter costs that exceed 50% of a family’s income, but for some homeless families it is more beneficial to use the standard $143 deduction because documentation is not required, a policy that is offered by only 27 states.52
The second SNAP policy, the “Heat and Eat” provision, is an additional deduction that can increase SNAP benefits. Households that receive energy cost assistance through the federal Low Income Home Energy Assistance Program (LIHEAP) are automatically eligible for a higher level of SNAP benefits in states that utilize “Heat and Eat” because they can deduct a Standard Utility Allowance from their reported income when applying for benefits. The Agricultural Act of 2014 raised the minimum amount of energy assistance each household must receive to participate in the program and, as of June 2014, just ten states have committed to increasing LIHEAP aid in order to maintain previous SNAP benefit levels.53
For low-income pregnant mothers and families with young children, the WIC policy examined by the State Policy Ranking gives states discretion to provide food packages specifically tailored to meet the unique needs of homeless families who do not have access to sanitary water, cooking facilities, refrigeration, or sufficient storage. Most states provide tailored packages for at least one of these conditions and were awarded partial credit, but only 19 states received full credit for accounting for all four needs.56
For this fifth policy indicator, three states—Massachusetts, New York, and Pennsylvania—enacted all three policies that reduce homeless families’ risk for food insecurity (Example 10). Conversely, Kansas instituted none of the policies; Colorado, Mississippi, South Dakota, and Wyoming have instituted the WIC food packing provision to accommodate only one of the four special needs of homeless families.57 For a detailed discussion on the effects of food insecurity on homeless families, see Issue 3: Effects of Homelessness on Families and Children.
Example 10 Massachusetts, New York, and Pennsylvania’s Food Security Policies
Massachusetts, New York, and Pennsylvania tie for first place on the State Policy Ranking food insecurity indicator. All three states provide special packaging of WIC foods that account for the four identified needs of homeless families. To increase SNAP benefits, all three also offer homeless families the option to use a standard deduction to account for housing expenses or the Standard Utility Allowance through the “Heat and Eat” provision.54 Two weeks after the passage of the Agricultural Act of 2014, New York became one of the first states to commit to continuing the “Heat and Eat” provision. Projections showed that by allocating an estimated $6 million to households through the LIHEAP provision, New York could preserve $457 million in SNAP funding for 300,000 people. Massachusetts and Pennsylvania pledged their commitments in March of 2014, ensuring the continuation of increased benefit levels for 163,000 and 400,000 residents, respectively.55 These three vital policies are beneficial for low-income families, but additional policy initiatives are needed in order to further reduce food insecurity.
Conclusion
ICPH created the State Family Homelessness Rankings to serve as a guide for states in preventing and reducing family homelessness. ICPH encourages a wide range of stakeholders to review their state’s performance on each of the detailed education and policy tables (Tables 3 and 5). Placing at the top of the rankings should not be interpreted as a sign that additional effort is not needed. In the State Policy Ranking, for example, top-ranked Massachusetts places first on two indicators and in the top ten on another, but the state falls in the middle and bottom fifth on the two other indicators (Table 5). Likewise, stakeholders in those states ranking near the bottom do not necessarily need to make extensive changes to better serve homeless families. Hawaii, ranked last on the State Policy Ranking, is in the bottom ten on three indicators but in the top two-fifths on the other two indicators.
Additionally, states may have other promising policies or positive outcomes beyond those examined in the State Family Homelessness Rankings. For example, the effectiveness of state leadership in coordinating services for homeless students is critical but challenging to measure or compare across states (Example 11). While it is also not practical to include every state policy that could affect homeless children and their parents, it is important to acknowledge that a state near the bottom of the ranking may have a positive policy in place that a top-ranked state does not (Example 12).
Example 11 Beyond the State Education Ranking—Florida and Vermont
Leadership at the state level—a factor in addressing family homelessness that is not directly assessed in the State Education Ranking—is paramount to ensure that local homeless liaisons are empowered with the appropriate knowledge and resources to properly identify homeless students. Despite ranking low (42nd) on the State Education Ranking, Florida has three full-time staff dedicated to coordinating the state homeless education program, which is more than the majority of states. In addition to ensuring statewide compliance with McKinney-Vento, the program staff provide guidance and technical assistance to local homeless liaisons, hosting bimonthly conference calls. Additionally, homeless students are also exempt from paying tuition at state universities in Florida, which removes a significant barrier to higher education. In contrast, while Vermont ranked high (7th) on the State Education Ranking, the U.S. Department of Education (ED) found that in 2013, the state was not monitoring local educational agencies for their compliance with McKinney-Vento. ED also discovered that Vermont had not distributed federal Education for Homeless Children and Youth program funds prior to the start of the 2013–14 school year as required. Vermont was obligated to correct both policies within 30 days. These examples demonstrate that the State Education Ranking indicators capture only some of the necessary policies and additional positive programs in place to support homeless students.58
Example 12 Beyond the State Policy Ranking—Michigan and North Dakota
In addition to the homeless-specific policies and practices reflected in the State Policy Ranking indicators, there are many other policies that impact homeless families. School breakfast and lunch programs, for example, can help prevent food insecurity among homeless children. Despite ranking low (49th) on the State Policy Ranking, Michigan state law requires that all K–12 public schools participate in the National School Lunch Program. Schools where more than 20% of students receive free or reduced price lunch must participate in the School Breakfast Program as well. During the 2011–12 school year, Michigan was one of the first three states to implement the Community Eligibility Provision, a federal option to provide free breakfast and lunch to all students in high-poverty schools and districts. To support the programs, Michigan is one of the 26 states that provide additional state funding to supplement federal aid. North Dakota, in contrast, ranks high (5th) on the State Policy Ranking but does not have laws that mandate school breakfast or lunch participation, nor does it provide supplementary state funding. The Food Research and Action Council ranked states based on the percent of students participating in the school lunch and breakfast programs in School Years 2011–12 and 2012–13; North Dakota ranked 32nd and 35th, respectively. These examples illustrate that state policy environments are shaped by a variety of laws and policy choices beyond those included in the State Policy Ranking.59
Supporting the self-sufficiency of homeless families today—and preventing families from becoming homeless tomorrow— requires the time, attention, and resourcefulness of a variety of stakeholders, from service providers and educators to advocates and government officials. ICPH carefully selected the education and policy indicators included in the State Family Homelessness Rankings in order to provide specific avenues to improve the delivery and accessibility of services to homeless families, children, and youth. Ultimately, the rankings highlight states’ noteworthy social services and policies as well as areas where states should improve.
Endnotes
State Family Homelessness Rankings
1 Should federal appropriations requests be met, the Obama administration intends to end veteran homelessness by the end of 2015 and chronic homelessness in 2017; U.S. Interagency Council on Homelessness, Opening Doors: Federal Strategic Plan to Prevent and End Homelessness, 2010; U.S. Office of Management and Budget, Budget of the United States Government, Fiscal Year 2016, February 2015.
2 Although the total number of family members was reduced by 9.2% between 2009 and 2014, this decrease was due to half (52.0%) as many unsheltered family members counted in 2014 than in 2009. The number of homeless parents and children in shelter increased 2.5% during this time period; U.S. Department of Housing and Urban Development, The 2014 Annual Homeless Assessment Report to Congress.
3 One indicator—minimum wage as a percentage of the wage needed to afford a two-bedroom apartment at Fair Market Rent—is also used in the National Center on Family Homelessness’ America’s Youngest Outcasts rankings; Annie E. Casey Foundation, 2013 KIDS COUNT Data Book; Foundation for Child Development, 2013 Child Well-being Index; National Center on Family Homelessness, America’s Youngest Outcasts 2014; United Nations Development Programme, Human Development Report 2013: Technical Notes; UNICEF Office of Research, Innocenti Report Card 11: Child Well-being in Rich Countries, A Comparative Overview, 2013; Federal Interagency Forum on Child and Family Statistics, America’s Children: Key National Indicators of Well-being, 2013; Gallup-Healthways Well-Being Index, 2012 State of American Well-being; Opportunity Nation, 2013 Opportunity Index; Institute for Child, Youth and Family Policy, Heller School for Social Policy and Management at Brandeis University and the Kirwan Institute for the Study of Race and Ethnicity at Ohio State University, Child Opportunity Index Mapping, 2014; Half in Ten, Resetting the Poverty Debate, State of the States 2013; Measure of America, American Human Development Report, the Measure of America 2013–14; National Institute for Early Education Research, The State of Preschool 2013.
4 To calculate the State Family Homelessness Rankings, each indicator was first normalized to a scale of zero to one and then averaged to create the two separate rankings. The fourth education indicator—the number of school-aged children living doubled up for every school-aged child staying in a shelter—was expressed as a percentage rather than a ratio.
5 See endnotes 4 and 6–10.
6 U.S. Department of Health and Human Services, 2012–13 Head Start Program Information Report, Survey Summary Report—State Level.
7 U.S. Department of Education, “ED Data Express,” http://eddataexpress.ed.gov; U.S. Census Bureau, 2013 American Community Survey 1-year Estimates.
8 Ibid.
9 U.S. Department of Education, “ED Data Express,” http://eddataexpress.ed.gov.
10 U.S. Department of Education, Office of Federal Student Aid, “Applicants with Homelessness Indicated on the FAFSA by State: 2012–13 Application Cycle” (unpublished data).
11 U.S. Census Bureau, 2013 American Community Survey 1-year Estimates; U.S. Department of Health and Human Services, 2013 Poverty Guidelines.
12 National Institute for Early Education Research and Rutgers, The State University of New Jersey, Abbott Preschool Program Longitudinal Effects Study: Fifth Grade Follow-Up, March 2013; Steven Barnett, “Long-term Effects of Early Childhood Programs on Cognitive and School Outcomes,” The Future of Children Vol. 5, no. 3 (1995): 25–50; Lawrence J. Schweinhart, et al., Lifetime Effects: The High/Scope Perry Preschool Study Through Age 40 (Ypsilanti: High/Scope Press, 2005).
13 U.S. Department of Health and Human Services, “Head Start,” http://eclkc.ohs.acf.hhs.gov/hslc; Barbara Duffield, “Serving Homeless Children Through Head Start” (conference presentation, National Association for the Education of Homeless Children and Youth, 21st Annual Conference, Denver, CO, November 14, 2009); Family Housing Fund, Homelessness and Its Effects on Children, 1999; Head Start Act, U.S. Code 9801 (2007).
14 U.S. Department of Education, Consolidated State Performance Reports, School Year 2012–13; U.S. Department of Education, Digest of Education Statistics 2013; U.S. Department of Health and Human Services, Characteristics and Dynamics of Homeless Families with Children, 2007.
15 U.S. Department of Health and Human Services, 2012–13 Head Start Program Information Report, Survey Summary Report—State Level; U.S. Department of Health and Human Services, 2007–08 Head Start Program Information Report, Survey Summary Report—State Level.
16 U.S. Department of Health and Human Services, 2012–13 Head Start Program Information Report, Survey Summary Report—State Level.
17 U.S. Department of Education, “ED Data Express,” http://eddataexpress.ed.gov; U.S. Census Bureau, 2013 American Community Survey 1-year Estimates; U.S. Department of Health and Human Services, “Race to the Top—Early Learning Challenge,” http://www.acf.hhs.gov/programs/ecd/early-learning/race-to-the-top.
18 U.S. Department of Education, “ED Data Express,” http://eddataexpress.ed.gov; U.S. Census Bureau, 2013 American Community Survey 1-year Estimates; National Institute for Early Education Research, The State of Preschool 2013.
19 U.S. Census Bureau, 2013 American Community Survey 1-year Estimates.
20 National Center for Homeless Education, Education for Homeless Children and Youth Program Data Collection Summary, 2010–14; U.S. Government Accountability Office, Education of Homeless Students, July 2014.
21 U.S. Conference of Mayors, Hunger and Homelessness Survey, December 2013.
22 Ralph da Costa Nunez and Matthew Adams, “Primary Stakeholders’ Perspectives on Services for Families without Homes,” in Supporting Families Experiencing Homelessness, ed. Mary E. Haskett, Staci Perlman, and Beryl Ann Cowan (New York, NY: Springer, 2014).
23 U.S. Census Bureau, 2013 American Community Survey 1-year Estimates; University of Alaska Anchorage, The Homeless: Who and How Many?, 2014; U.S. Department of Education, Consolidated State Performance Reports, School Year 2012–13.
24 U.S. Department of Health and Human Services, 2013 Poverty Guidelines; U.S. Department of Health and Human Services, Characteristics and Dynamics of Homeless Families with Children, 2007.
25 State data on the number of extremely poor children in pre-kindergarten are not available; U.S. Department of Education, “ED Data Express,” http://eddataexpress.ed.gov; U.S. Census Bureau, 2013 American Community Survey 1-year Estimates.
26 U.S. Department of Education, Consolidated State Performance Reports, School Year 2012–13.
27 U.S. Department of Housing and Urban Development, HUD’s Continuum of Care Homeless Assistance Programs—Housing Inventory Chart Report, 2005–14.
28 U.S. Department of Education, “ED Data Express,” http://eddataexpress.ed.gov.
29 U.S. Census Bureau, 2013 American Community Survey 1-year Estimates; U.S. Bureau of Labor Statistics, Table A–4: Employment Status of the Civilian Population 25 Years and Over by Educational Attainment, 2013; Civic Enterprises, The Silent Epidemic: Perspectives of High School Dropouts, March 2006.
30 U.S. Department of Education, Office of Federal Student Aid, “Applicants with Homelessness Indicated on the FAFSA by State: 2012–13 Application Cycle” (unpublished data).
31 U.S. Department of Education, Office of Federal Student Aid, “Applicants with Homelessness Indicated on the FAFSA by State: 2012–13 Application Cycle” (unpublished data); National Association for the Education of Homeless Children and Youth, College Access and Success for Students Experiencing Homelessness, A Toolkit for Educators and Service Providers, June 2013.
32 See endnotes 4 and 33–37.
33 National Low Income Housing Coalition, Housing Spotlight—The Affordable Rental Housing Gap Persists, August 2014.
34 U.S. Department of Labor, Wage and Hour Division, “Changes in Basic Minimum Wages in Non-farm Employment under State Law: Selected Years 1968 to 2013,” http://www.dol.gov/whd/ state/stateMinWageHis.htm; National Low Income Housing Coalition, Out of Reach 2013; Fair Labor Standards Act, U.S. Code 29 (1938) § 201.
35 As a final version of Alaska’s Fiscal Years 2014–15 state plan could not be obtained, a draft version was used instead; ICPH analysis of Child Care and Development Fund state plans for Fiscal Years 2014–15; Urban Institute, The CCDF Policies Database Book of Tables: Key Cross-state Variations in CCDF Policies as of October 1, 2012, November 2013.
36 National Law Center on Homelessness and Poverty, There’s No Place Like Home: State Laws that Protect Housing Rights for Survivors of Domestic and Sexual Violence, 2013.
37 U.S. Department of Agriculture, Supplemental Nutrition Assistance Program State Options Report: Tenth Edition, 2012; Food Research and Action Center, Heat and Eat: State Responses to the Changed Federal Law, June 2014; U.S. Department of Agriculture, WIC Food Packages Policy Options Study, Final Report, June 2011.
38 National Low Income Housing Coalition, 2014 State Housing Profile; U.S. Census Bureau, South Dakota—2010 Census Results: Total Population by County.
39 National Low Income Housing Coalition, Out of Reach 2013; National Low Income Housing Coalition, 2014 State Housing Profile; Housing for the Homeless Consortium, 2014 Statewide Homeless Count Results; U.S. Bureau of Labor Statistics, “Unemployment Rates for States Annual Average Rankings, Year: 2013,” http://www.bls.gov/lau/ lastrk13.htm; South Dakota Secretary of State, “Election Night Results—November 4th, 2014,” http://electionresults.sd.gov.
40 U.S. Census Bureau, 2013 American Community Survey 1-year Estimates; U.S. Department of Housing and Urban Development, Worst Case Housing Needs 2011: Report to Congress, August 2013; National Low Income Housing Coalition, Out of Reach 2014.
41 National Low Income Housing Coalition, Housing Spotlight—The Affordable Rental Housing Gap Persists, August 2014.
42 U.S. Department of Labor, Wage and Hour Division, “Changes in Basic Minimum Wages in Non-farm Employment under State Law: Selected Years 1968 to 2013,” http://www.dol.gov/whd/ state/stateMinWageHis.htm; National Low Income Housing Coalition, Out of Reach 2013; Council of State Governments, Minimum Wage Watch 2015.
43 U.S. Department of Health and Human Services, Characteristics and Dynamics of Homeless Families with Children, 2007; U.S. Department of Labor, Wage and Hour Division, “Changes in Basic Minimum Wages in Non-farm Employment under State Law: Selected Years 1968 to 2013,” http://www.dol.gov/whd/state/stateMinWageHis.htm; National Low Income Housing Coalition, Out of Reach 2013.
44 Massachusetts Department of Early Education and Care, Policy Statement: Children’s Records Requirements for Priority Populations, September 2010.
45 U.S. Department of Health and Human Services, FY 2012 CCDF Data Tables (Preliminary Estimates, October 2013).
46 Institute for Children, Poverty, and Homelessness, Meeting the Child Care Needs of Homeless Families: How Do States Stack Up?, July 2014; Child Care Aware of America, Parents and the High Cost of Child Care: 2013; U.S. Department of Health and Human Services, 2013 Poverty Guidelines.
47 The Child Care and Development Block Grant Act of 2014, enacted in November of 2014, made it a requirement that states establish 12-month eligibility periods and provide child care assistance for at least three months while parents who have lost their jobs look for work. The other policies that were assessed remain at each state’s discretion. As a final version of Alaska’s Fiscal Years 2014–15 state plan could not be obtained, a draft version was used instead; ICPH analysis of Child Care and Development Fund state plans for Fiscal Years 2014–15; Urban Institute, The CCDF Policies Database Book of Tables: Key Cross-state Variations in CCDF Policies as of October 1, 2012, November 2013.
48 National Law Center on Homelessness and Poverty, Some Facts on Homelessness, Housing, and Violence Against Women, January 2009; Ellen Bassuk, et al., “The Characteristics and Needs of Sheltered Homeless and Low-income Housed Mothers,” Journal of the American Medical Association 276, no. 8 (1996): 640–46.
49 National Law Center on Homelessness and Poverty, There’s No Place Like Home: State Laws that Protect Housing Rights for Survivors of Domestic and Sexual Violence, 2013.
50 Ibid.
51 Barrett A. Lee and Meredith J. Greif, “Homelessness and Hunger,” Journal of Health and Social Behavior 49, no. 1 (2008): 3–19; Craig Gundersen, et al., “Homelessness and Food Insecurity,” Journal of Housing Economics 12 (2003): 250–72; U.S. Department of Agriculture, “Food Security in the United States: Measuring Household Food Security,” http://www.ers.usda.gov/topics/food-nutrition-assistance/food-security-in-the-us/measurement.aspx; U.S. Department of Agriculture, “Supplemental Nutrition Assistance
52 Center on Budget and Policy Priorities, SNAP’s Homeless Shelter Deduction Can Provide Much-needed Help for Homeless Individuals and Families, 2011; U.S. Department of Agriculture, Supplemental Nutrition Assistance Program State Options Report: Tenth Edition, 2012.
53 Food Research and Action Center, Heat and Eat: State Responses to the Changed Federal Law, June 2014.
54 U.S. Department of Agriculture, Supplemental Nutrition Assistance Program State Options Report: Tenth Edition, 2012; Food Research and Action Center, Heat and Eat: State Responses to the Changed Federal Law, June 2014; U.S. Department of Agriculture, WIC Food Packages Policy Options Study, Final Report, June 2011.
55 Congressional Research Service, The 2014 Farm Bill: Changing the Treatment of LIHEAP Receipt in the Calculation of SNAP Benefits, February 2014; National Center for Appropriate Technology, LIHEAP Clearinghouse, Issue Brief #5: A New Framework for “Heat and Eat,” LIHEAP and SNAP After the 2014 Farm Bill, August 2014.
56 U.S. Department of Agriculture, WIC Food Packages Policy Options Study, Final Report, June 2011.
57 Ibid.; U.S. Department of Agriculture, Supplemental Nutrition Assistance Program State Options Report: Tenth Edition, 2012; Food Research and Action Center, Heat and Eat: State Responses to the Changed Federal Law, June 2014.
58 Florida Department of Education, “Homeless Education Program,” http://www.fldoe.org/ schools/family-community/activities-programs/homeless-edu-program.stml; U.S. Government Accountability Office, Education of Homeless Students: Improved Oversight Needed, July 2014; U.S. Department of Education, Title I Program Monitoring: Vermont Agency of Education, September 10–12, 2013.
59 Food Research and Action Center, School Breakfast Scorecard: 2012–13 School Year, January 2014; U.S. Department of Agriculture, Community Eligibility Provision Evaluation (Summary), February 2014.
Guide to the State Dashboards
State Dashboards
Exploring Trends in Family Homelessness State by State
Endnotes
State Dashboards
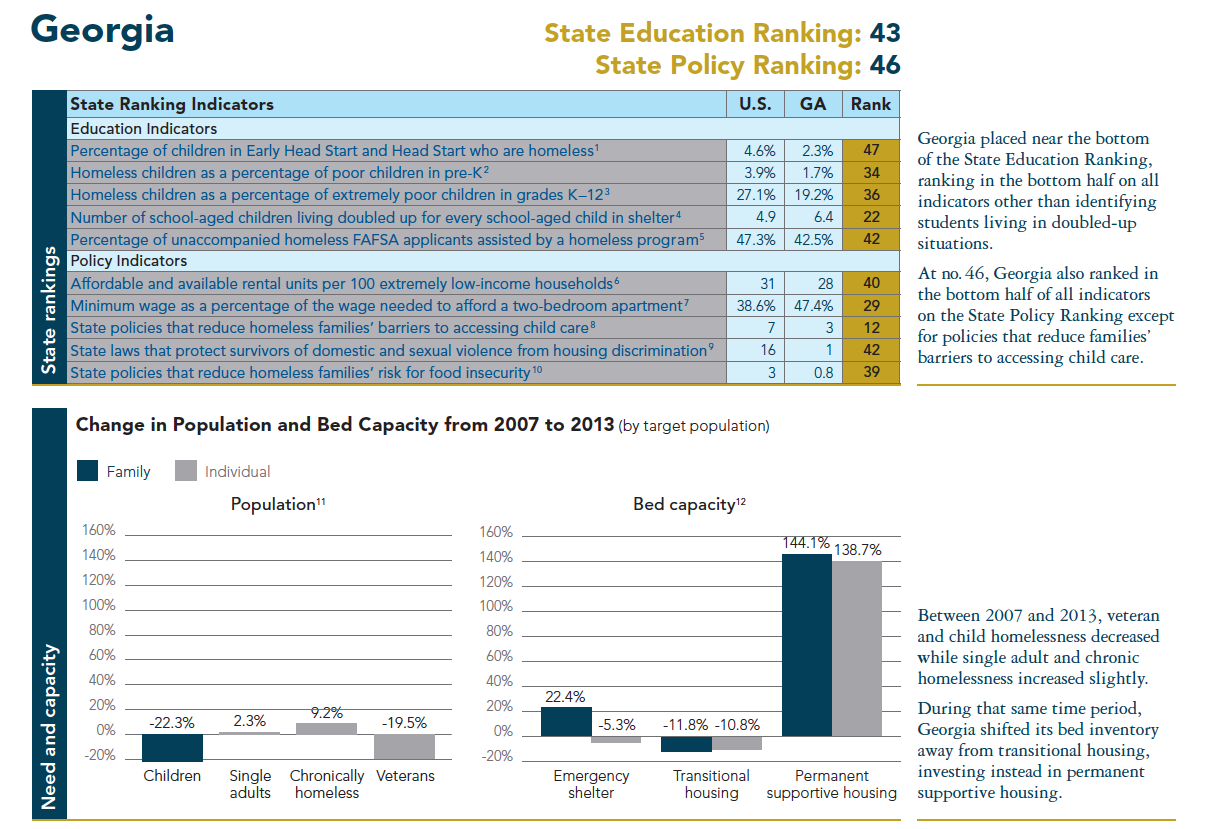
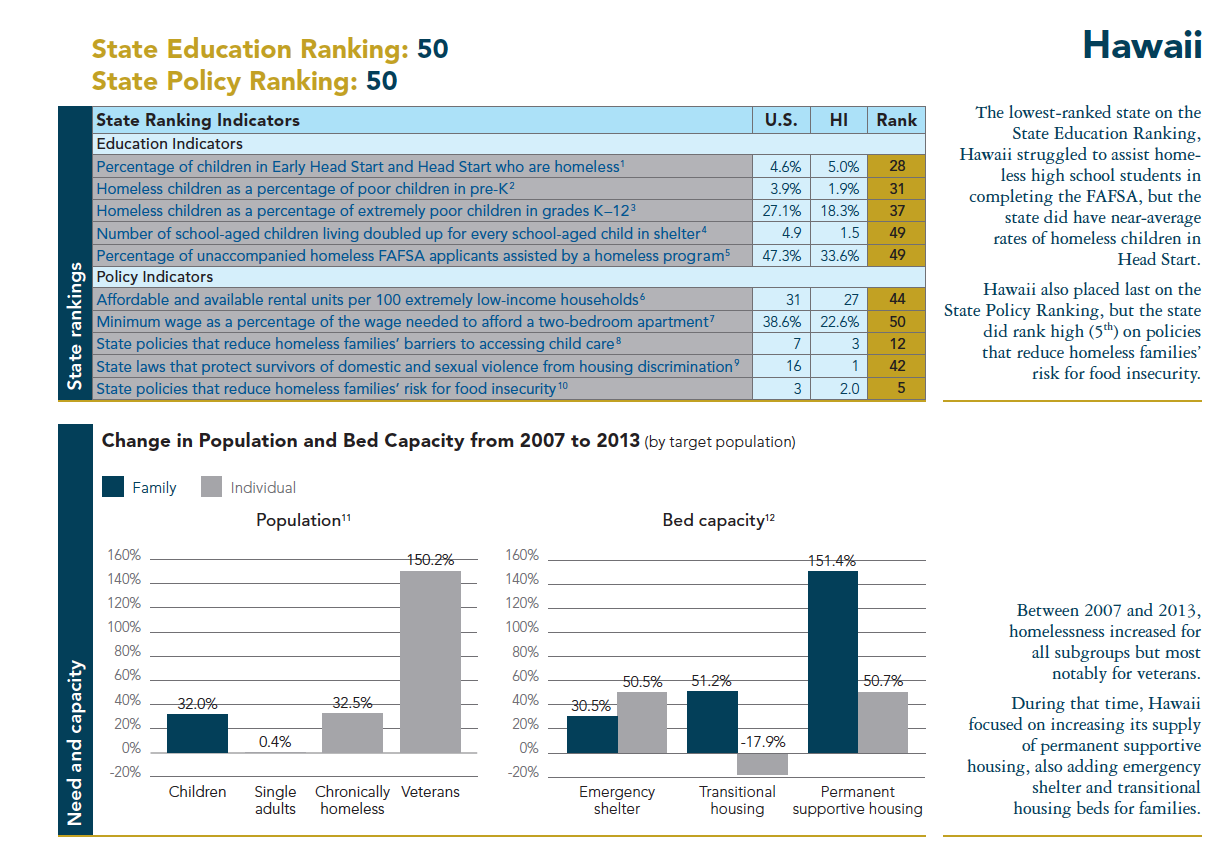
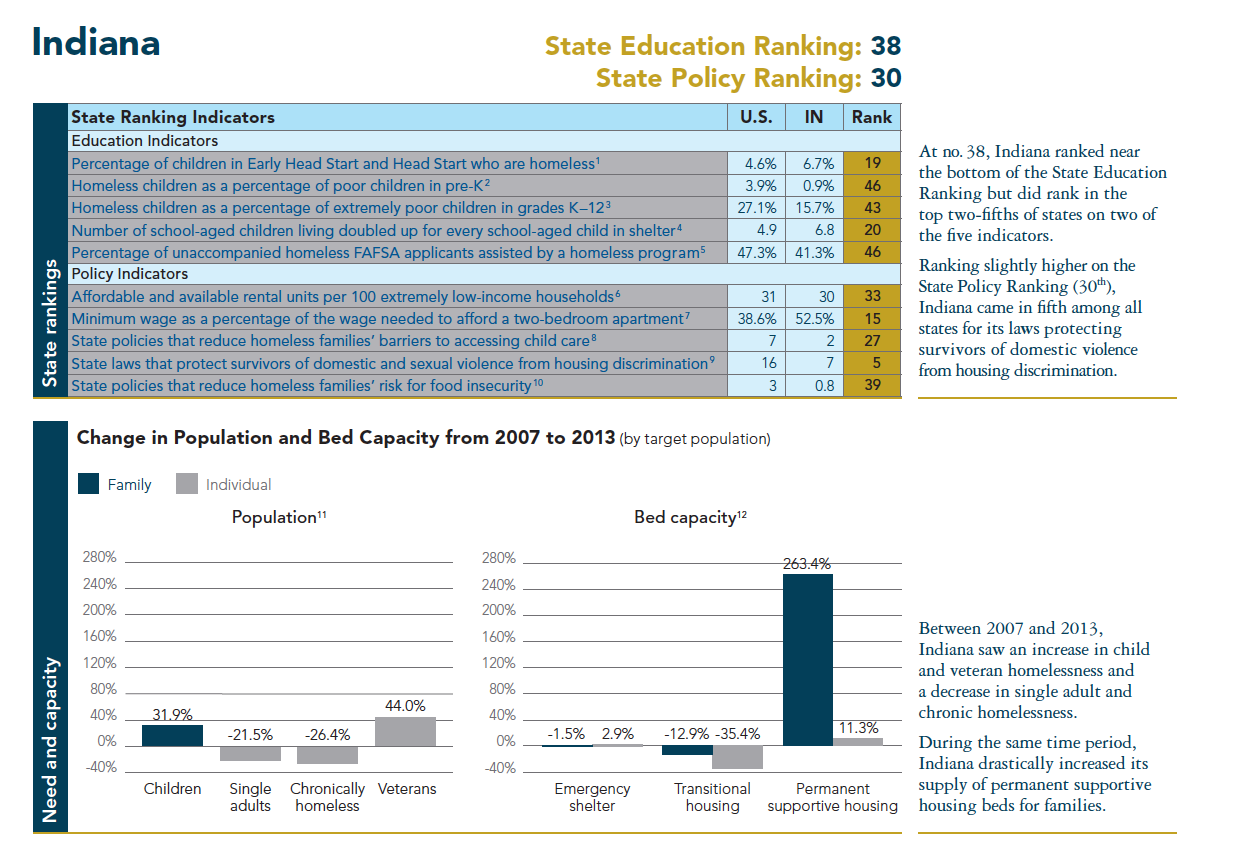
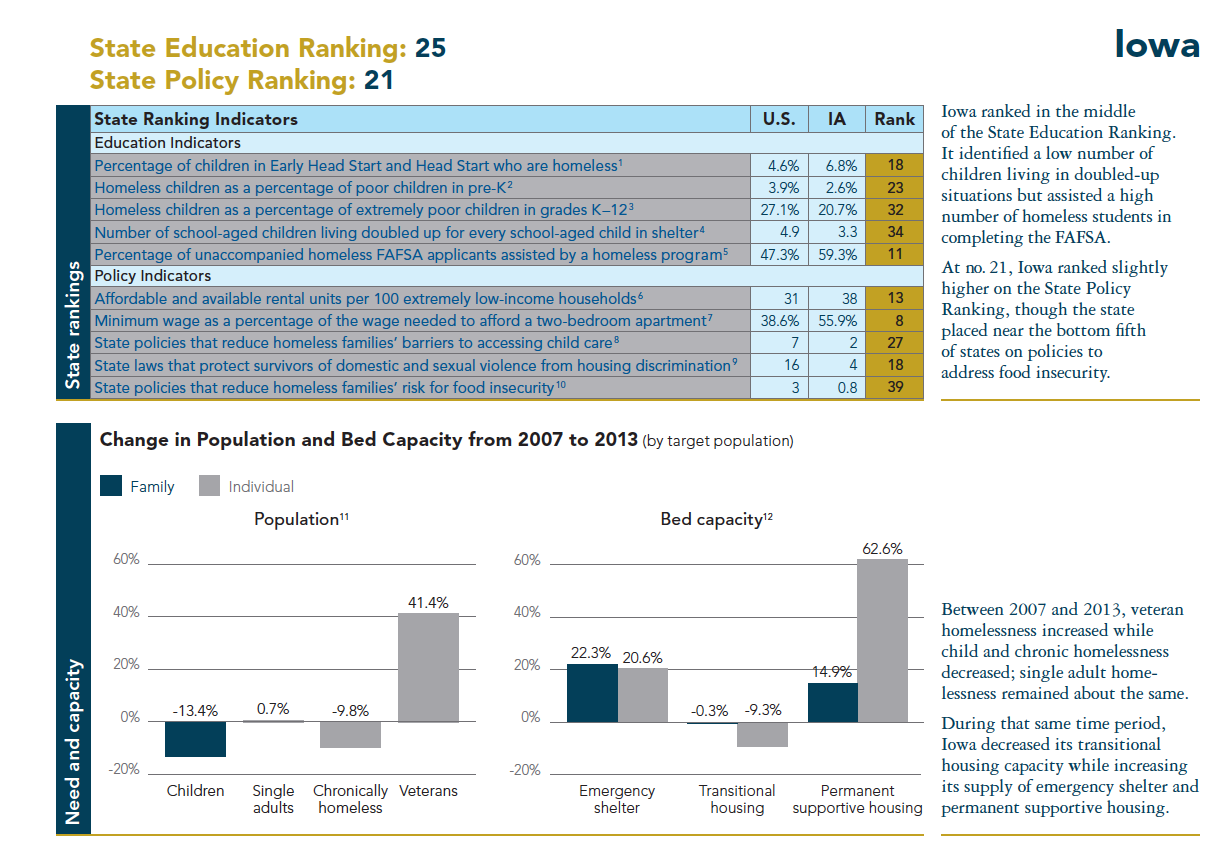
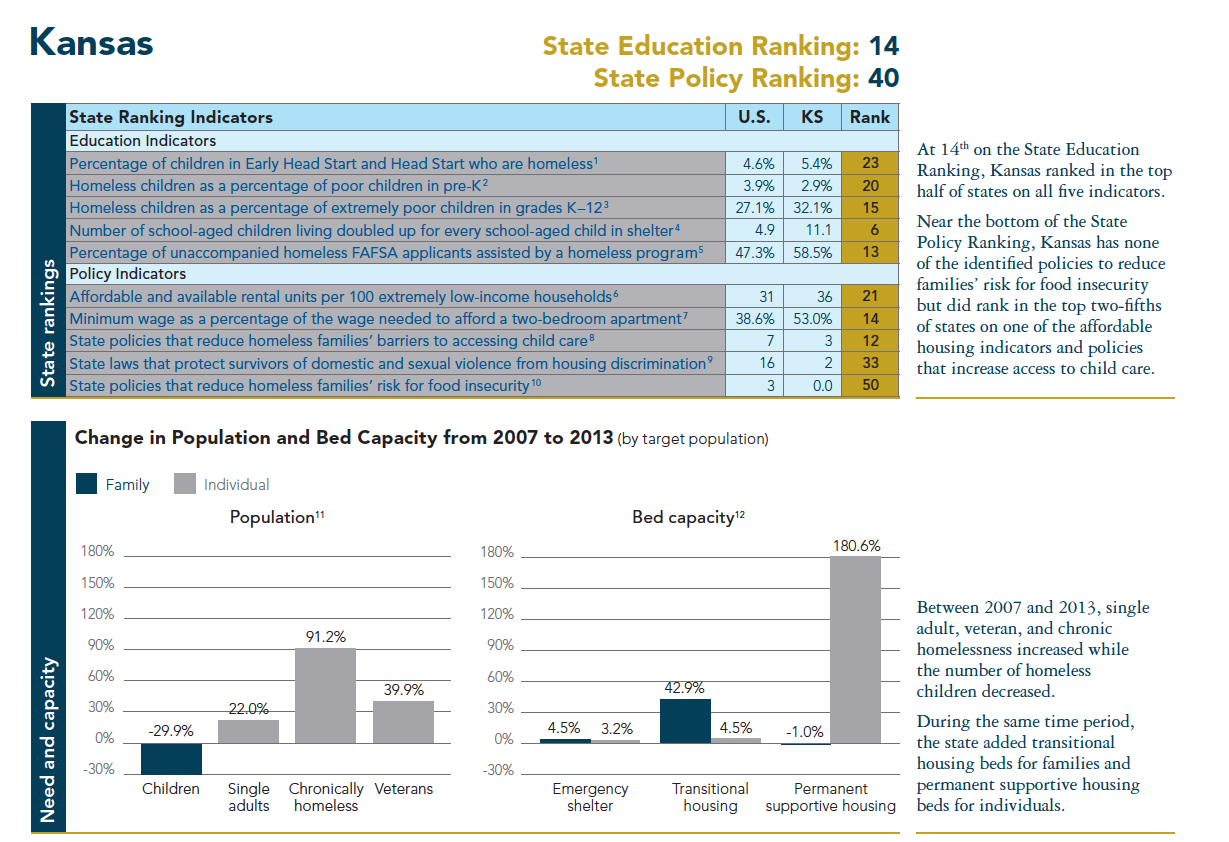
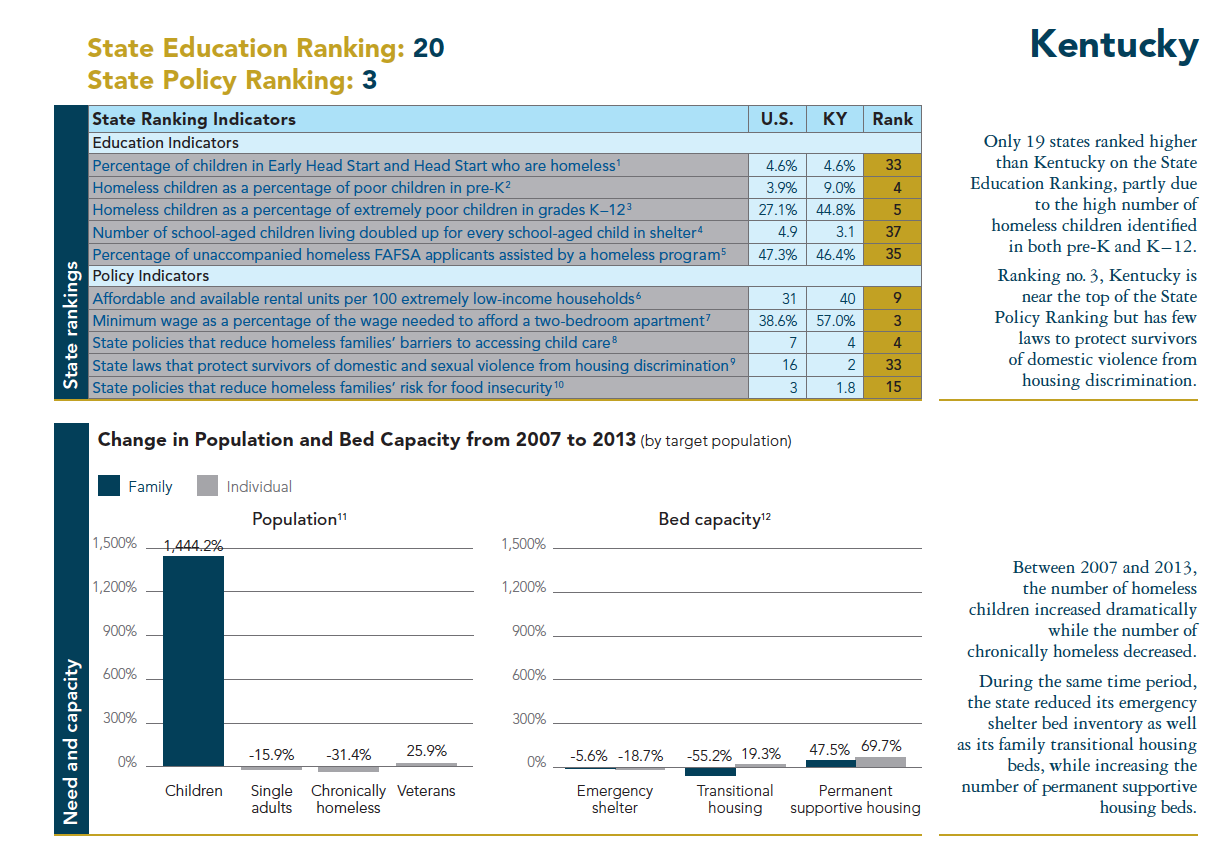
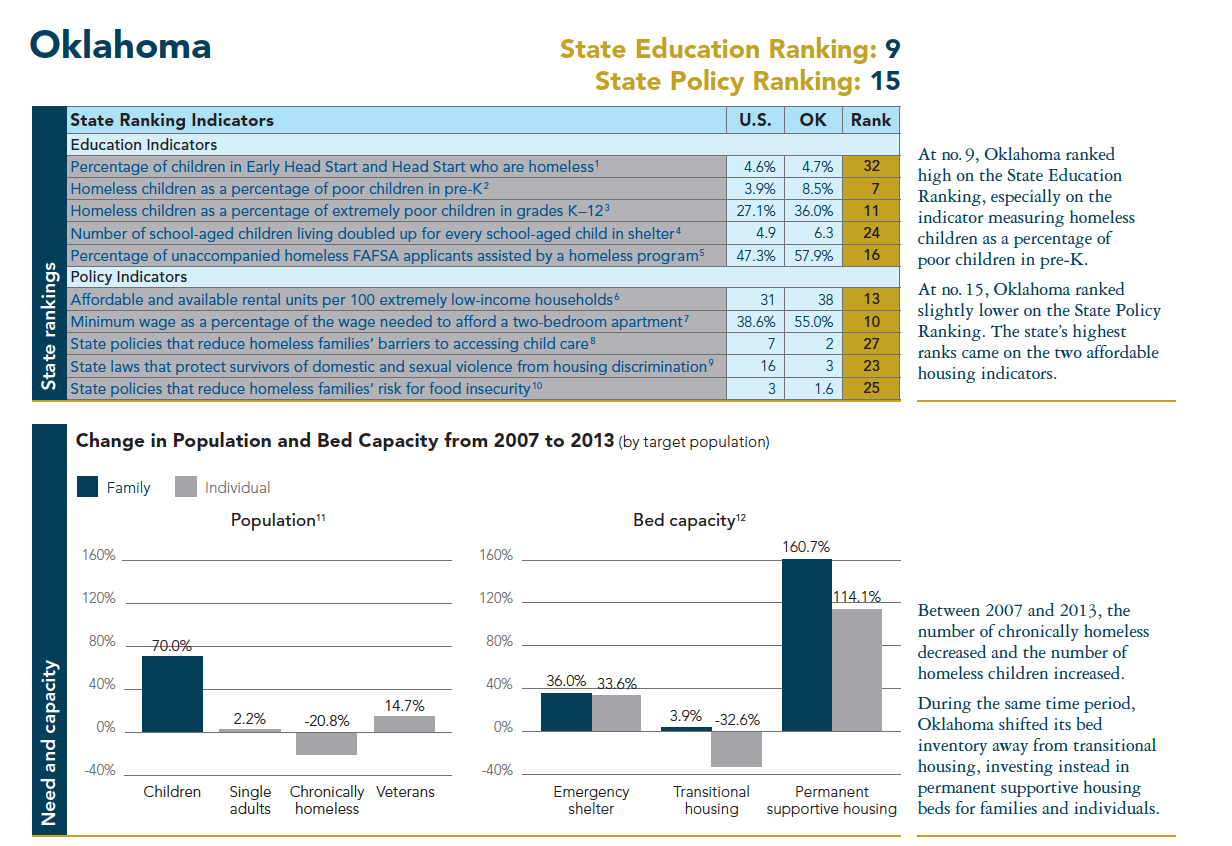
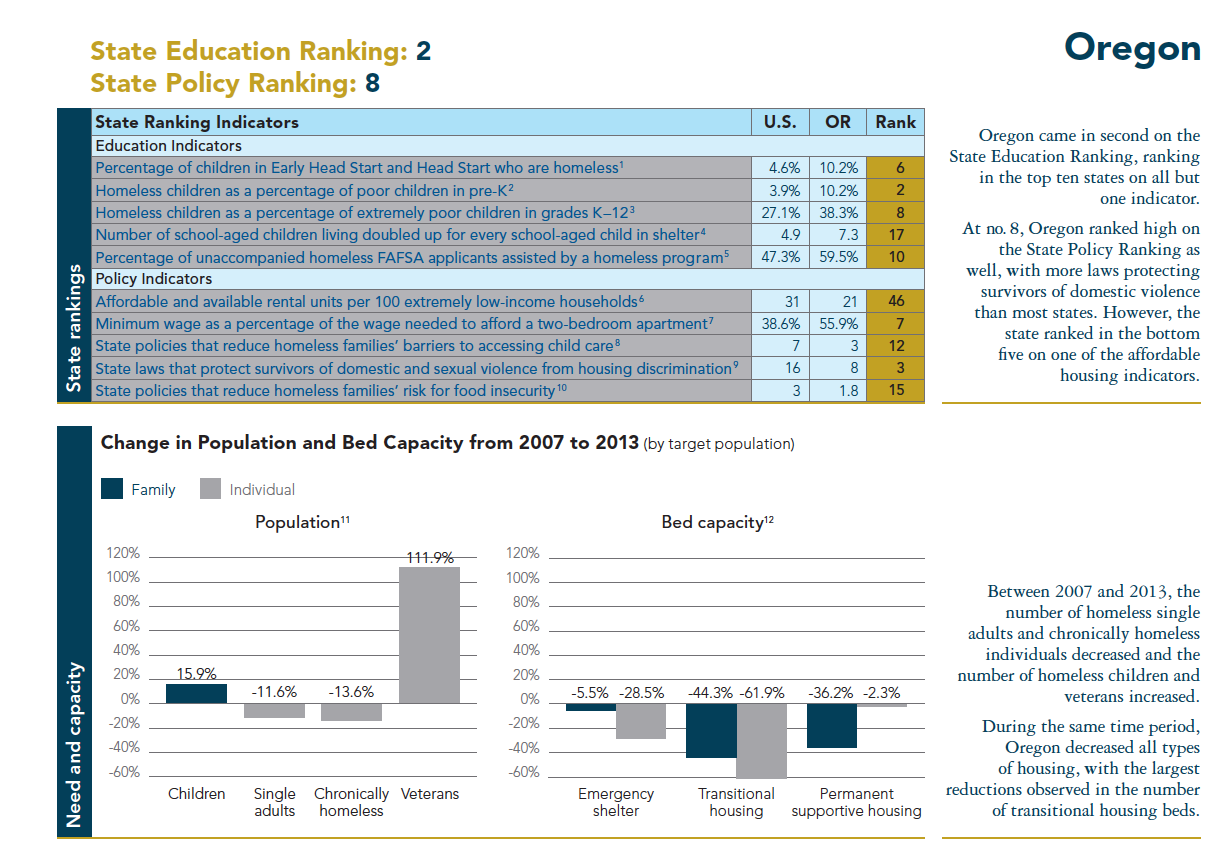
1 U.S. Department of Health and Human Services, 2012–13 Head Start Program Information Report, Survey Summary Report—State Level.
2 U.S. Department of Education, “ED Data Express,” http://eddataexpress.ed.gov; U.S. Census Bureau, 2013 American Community Survey 1-year Estimates.
3 Ibid.
4 U.S. Department of Education, “ED Data Express,” http://eddataexpress.ed.gov.
5 U.S. Department of Education, Office of Federal Student Aid, “Applicants with Homelessness Indicated on the FAFSA by State: 2012–13 Application Cycle” (unpublished data).
6 National Low Income Housing Coalition, Housing Spotlight—The Affordable Rental Housing Gap Persists, August 2014.
7 U.S. Department of Labor, Wage and Hour Division, “Changes in Basic Minimum Wages in Non-farm Employment under State Law: Selected Years 1968 to 2013,” http://www.dol. gov/whd/state/stateMinWageHis.htm; National Low Income Housing Coalition, Out of Reach 2013; Fair Labor Standards Act, U.S. Code 29 (1938) § 201.
8 As a final version of Alaska’s Fiscal Years 2014–15 state plan could not be obtained, a draft version was used instead; ICPH analysis of Child Care and Development Fund state plans for Fiscal Years 2014–15; Urban Institute, The CCDF Policies Database Book of Tables: Key Cross-state Variations in CCDF Policies as of October 1, 2012, November 2013.
9 National Law Center on Homelessness and Poverty, There’s No Place Like Home: State Laws that Protect Housing Rights for Survivors of Domestic and Sexual Violence, 2013.
10 U.S. Department of Agriculture, Supplemental Nutrition Assistance Program State Options Report: Tenth Edition, 2012; Food Research and Action Center, Heat and Eat: State Responses to the Changed Federal Law, June 2014; U.S. Department of Agriculture, WIC Food Packages Policy Options Study, Final Report, June 2011.
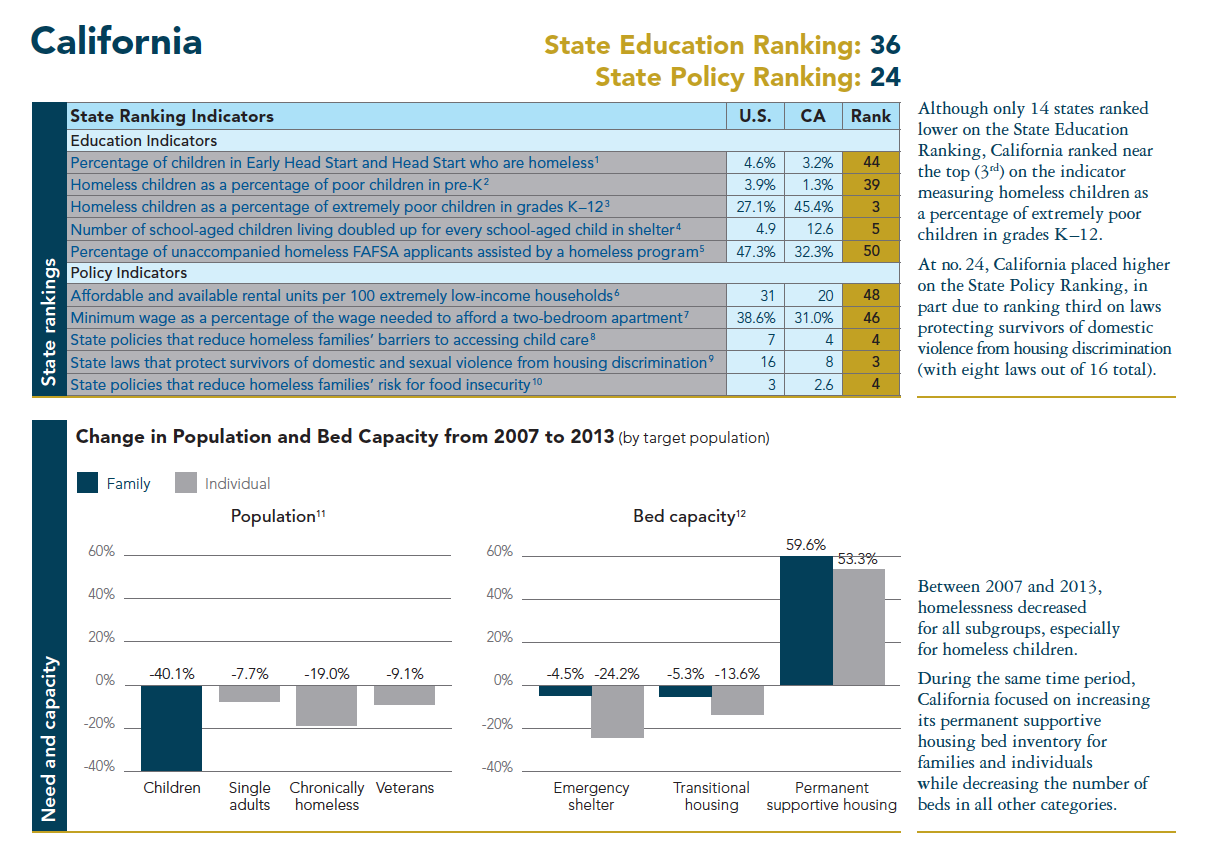
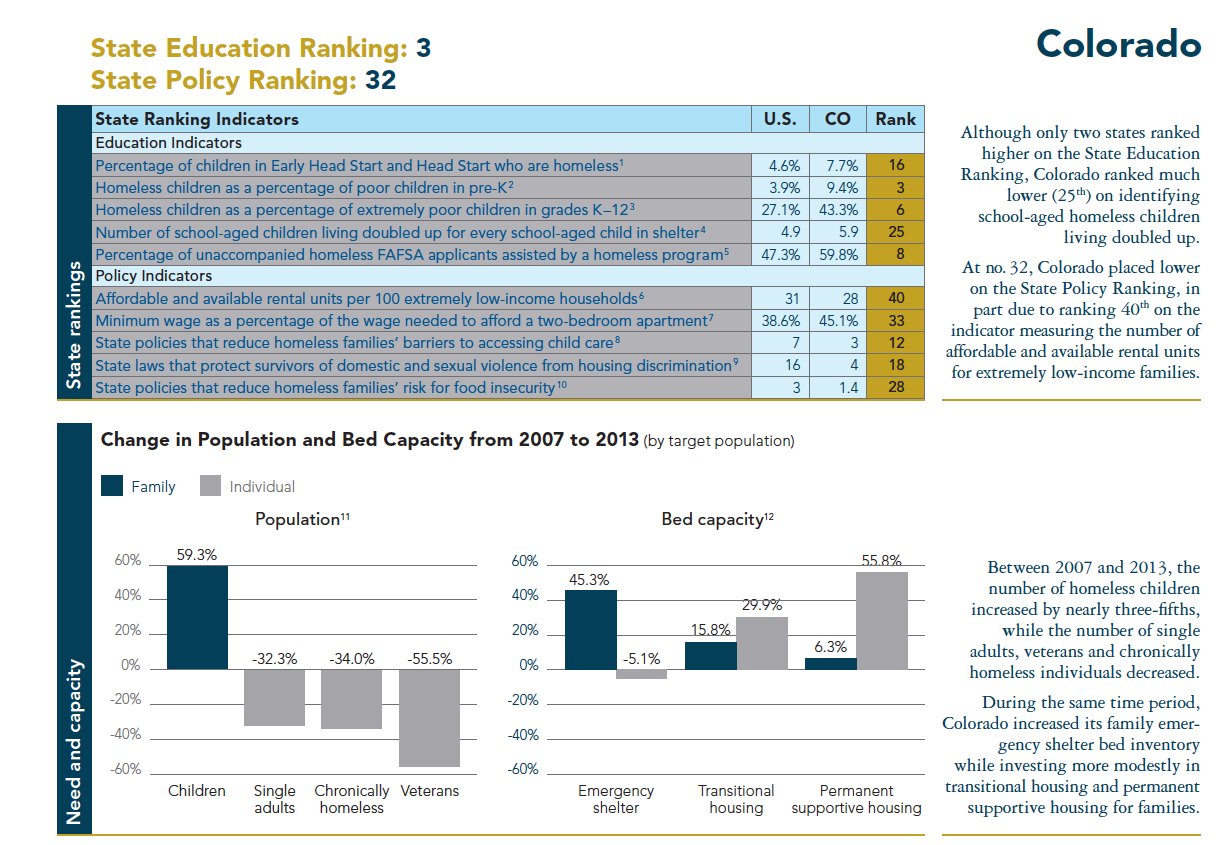
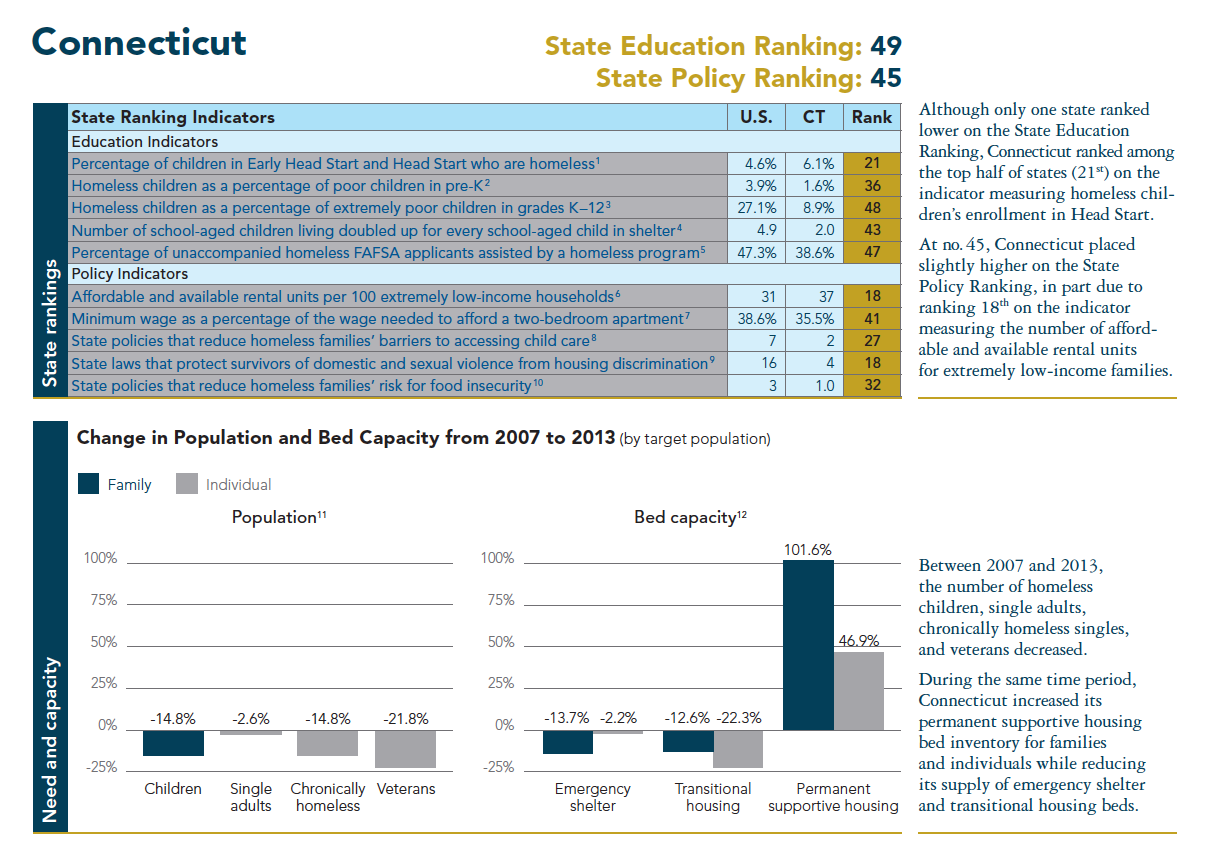
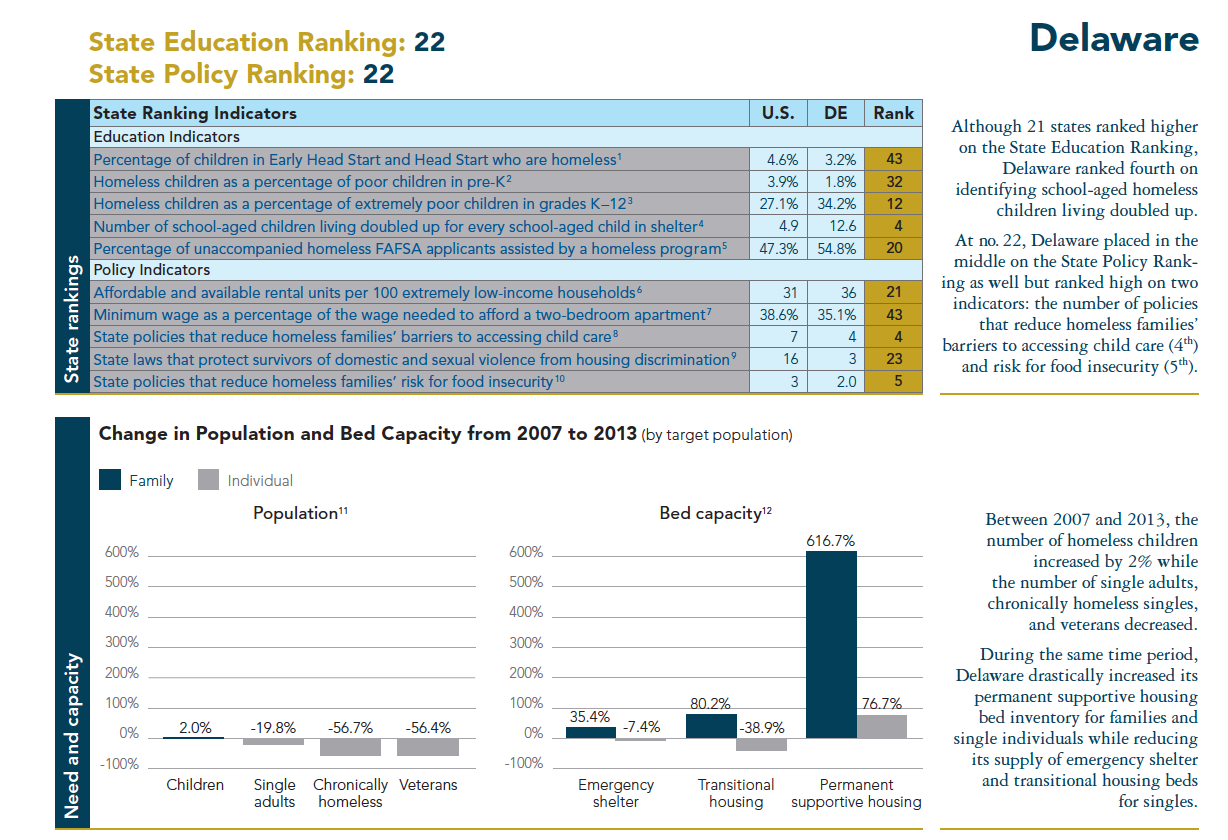
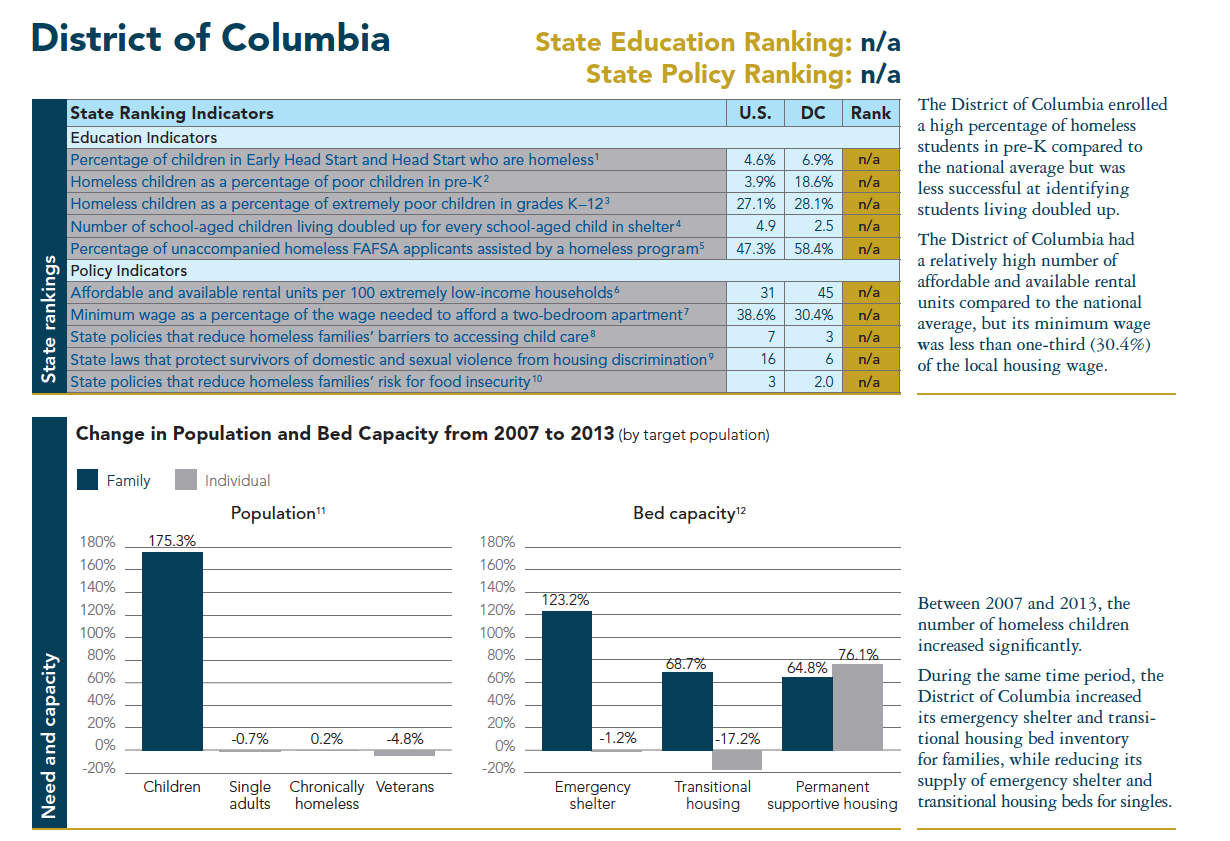
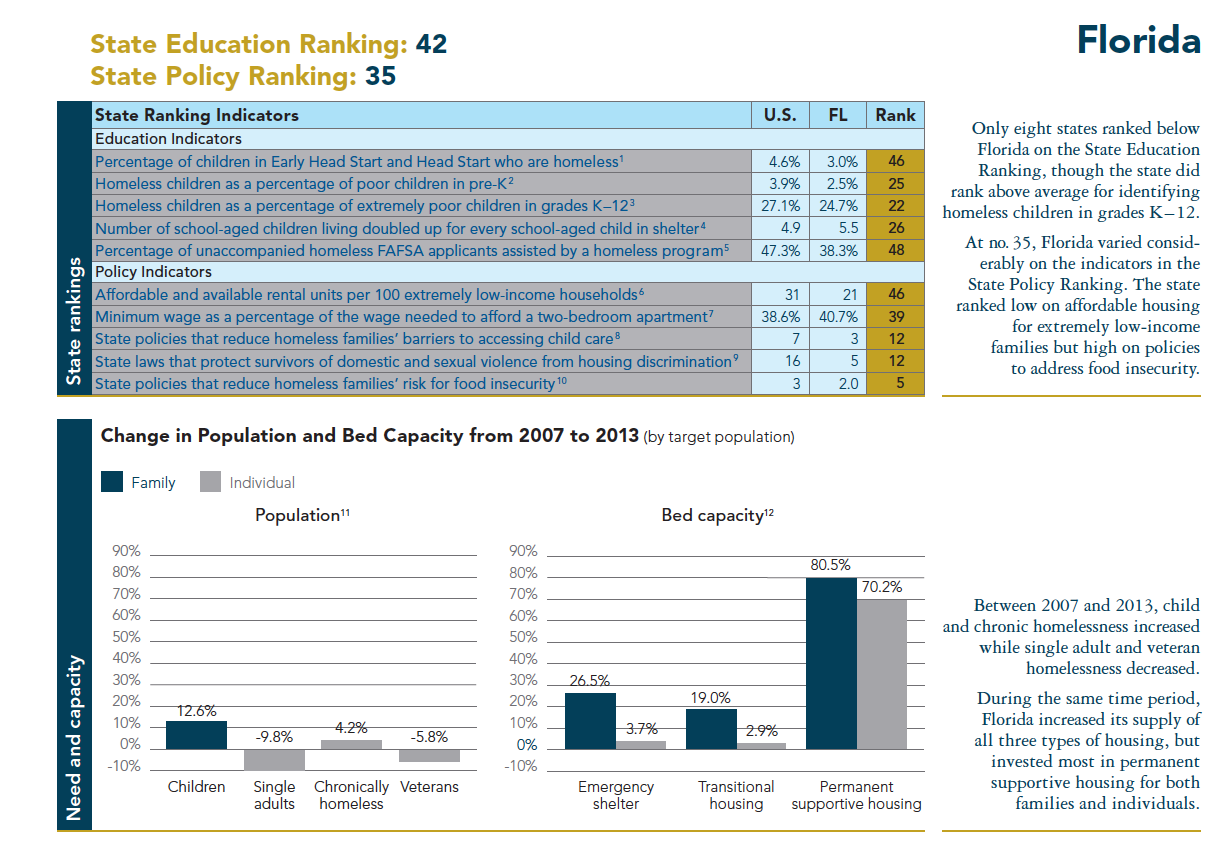
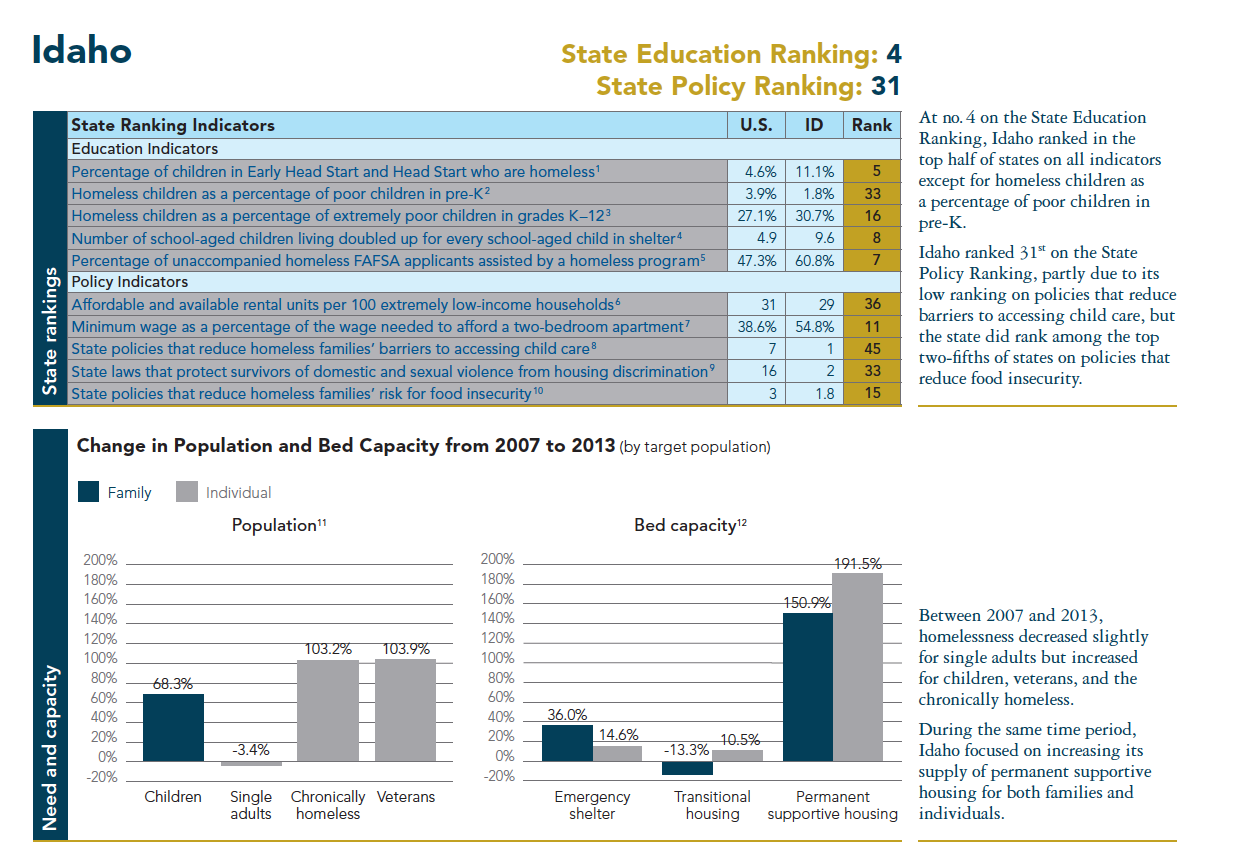
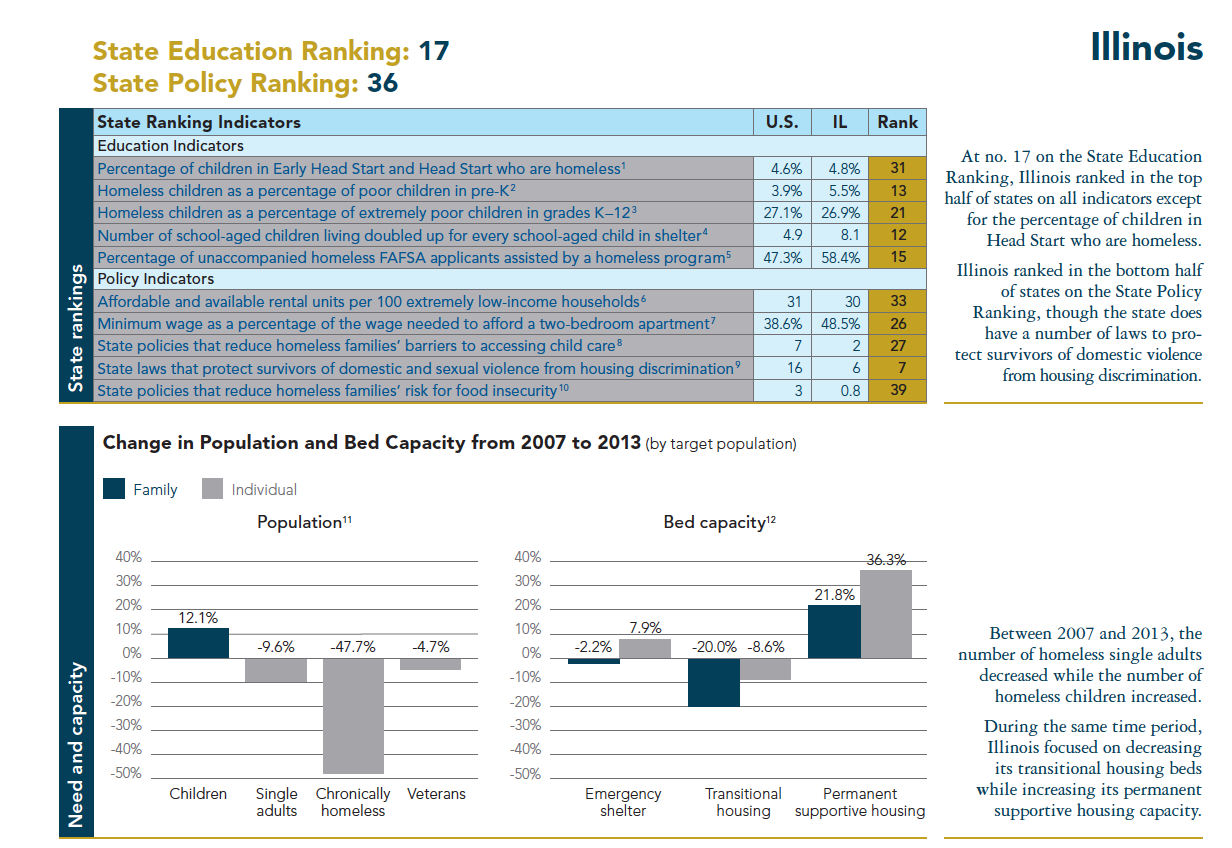
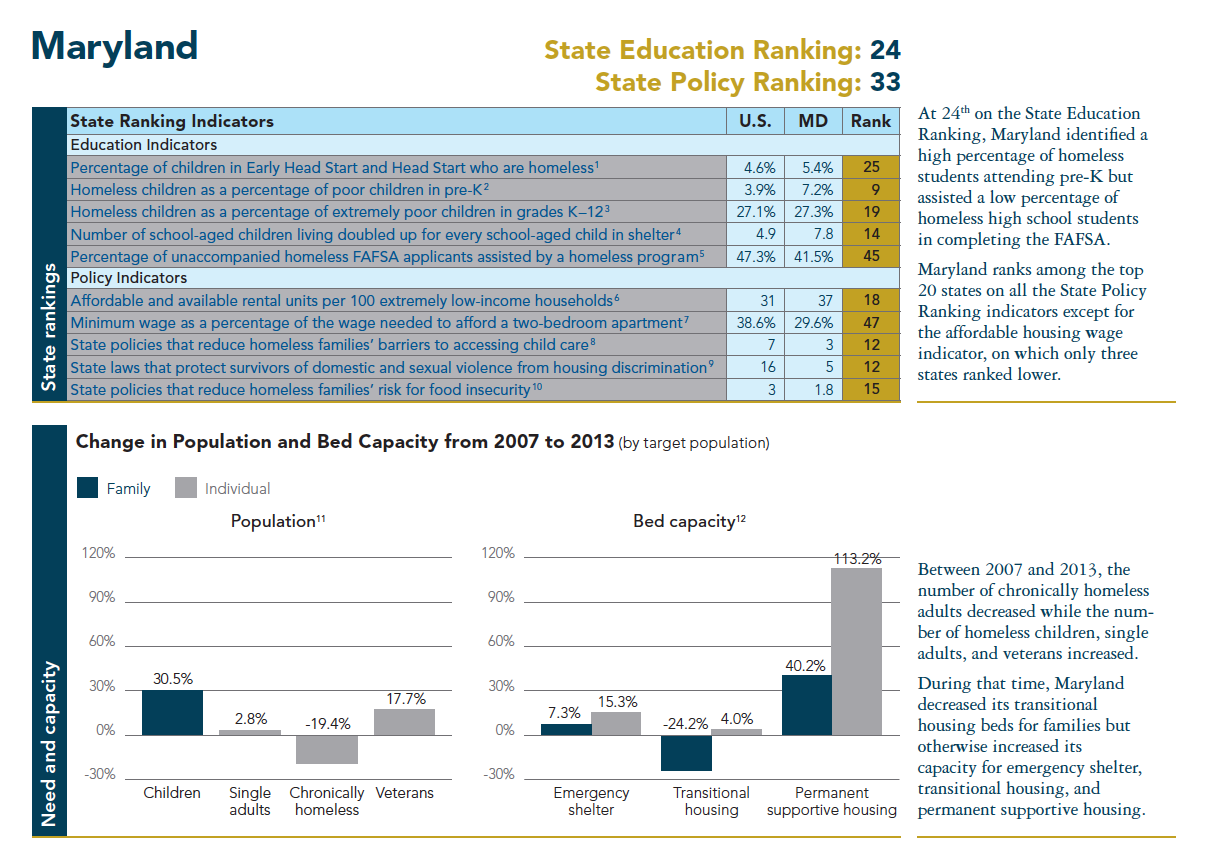
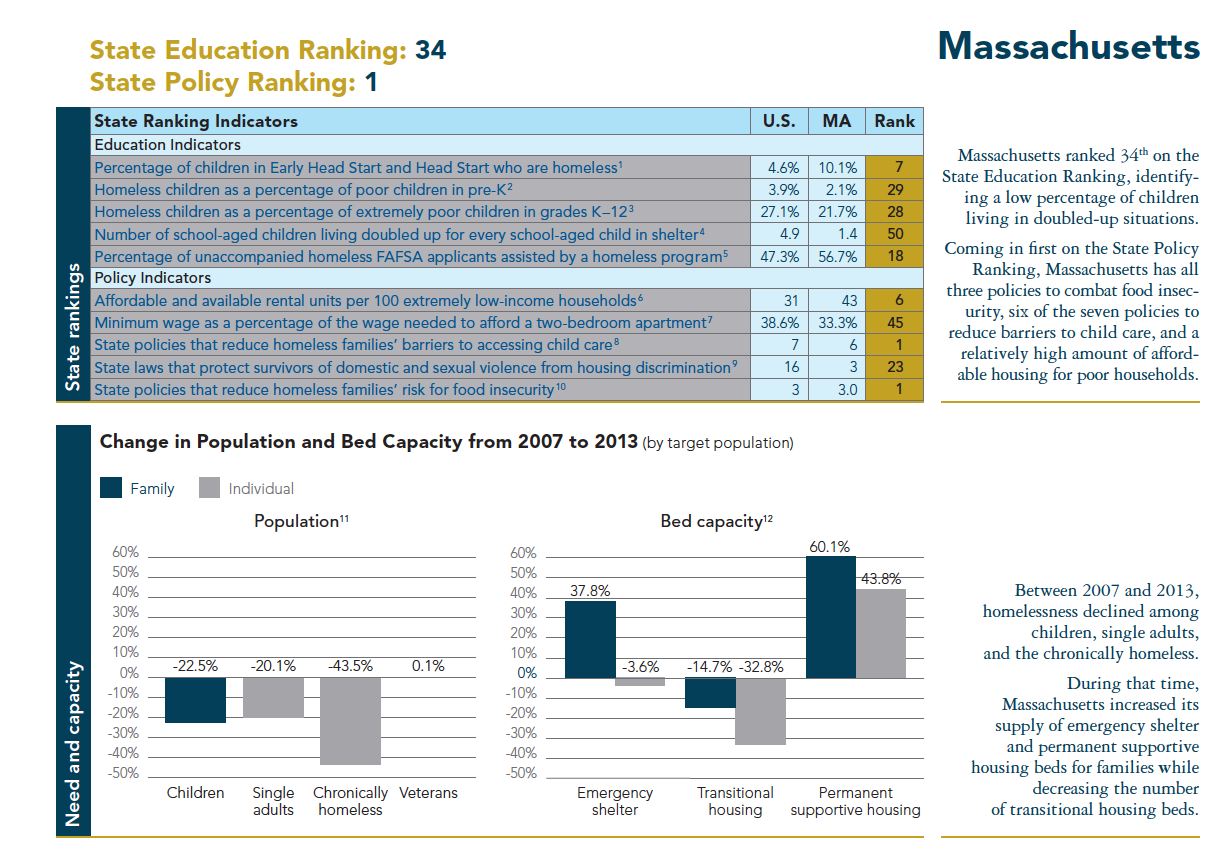
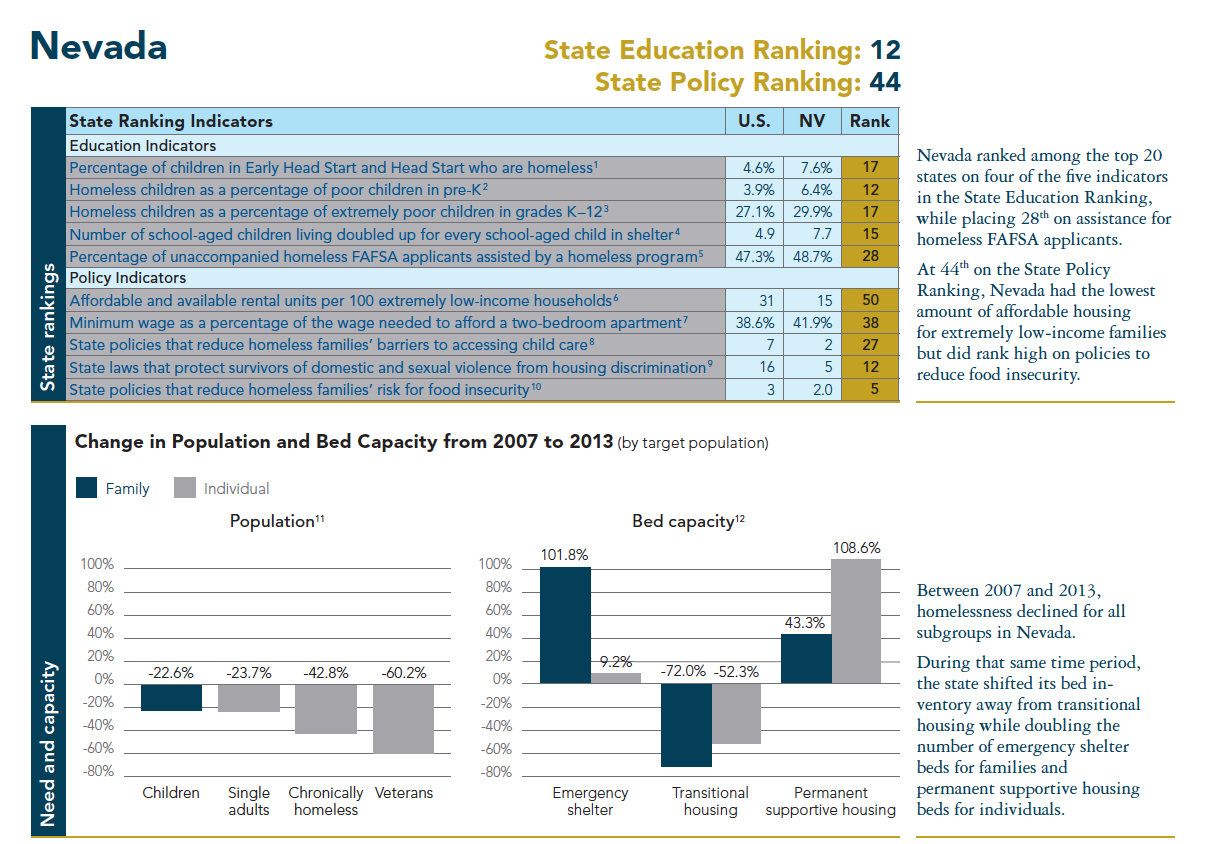
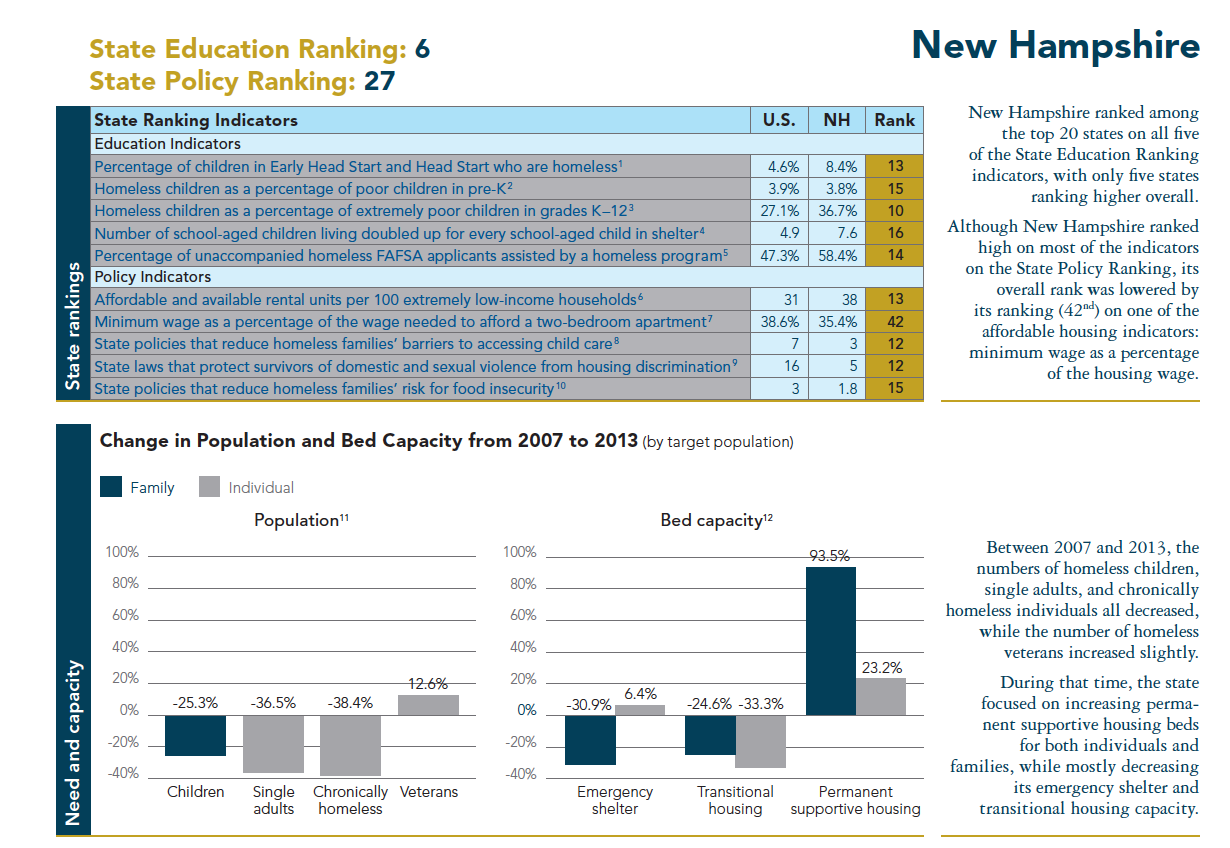
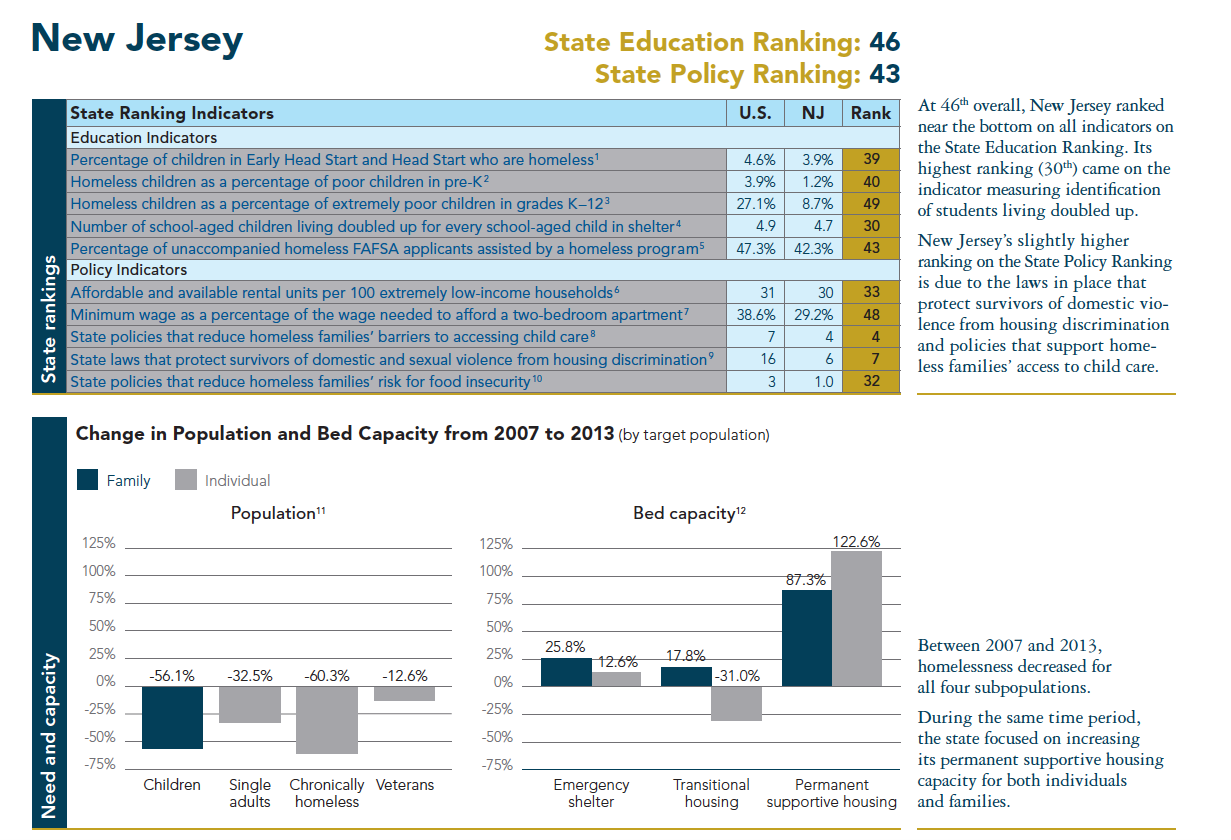
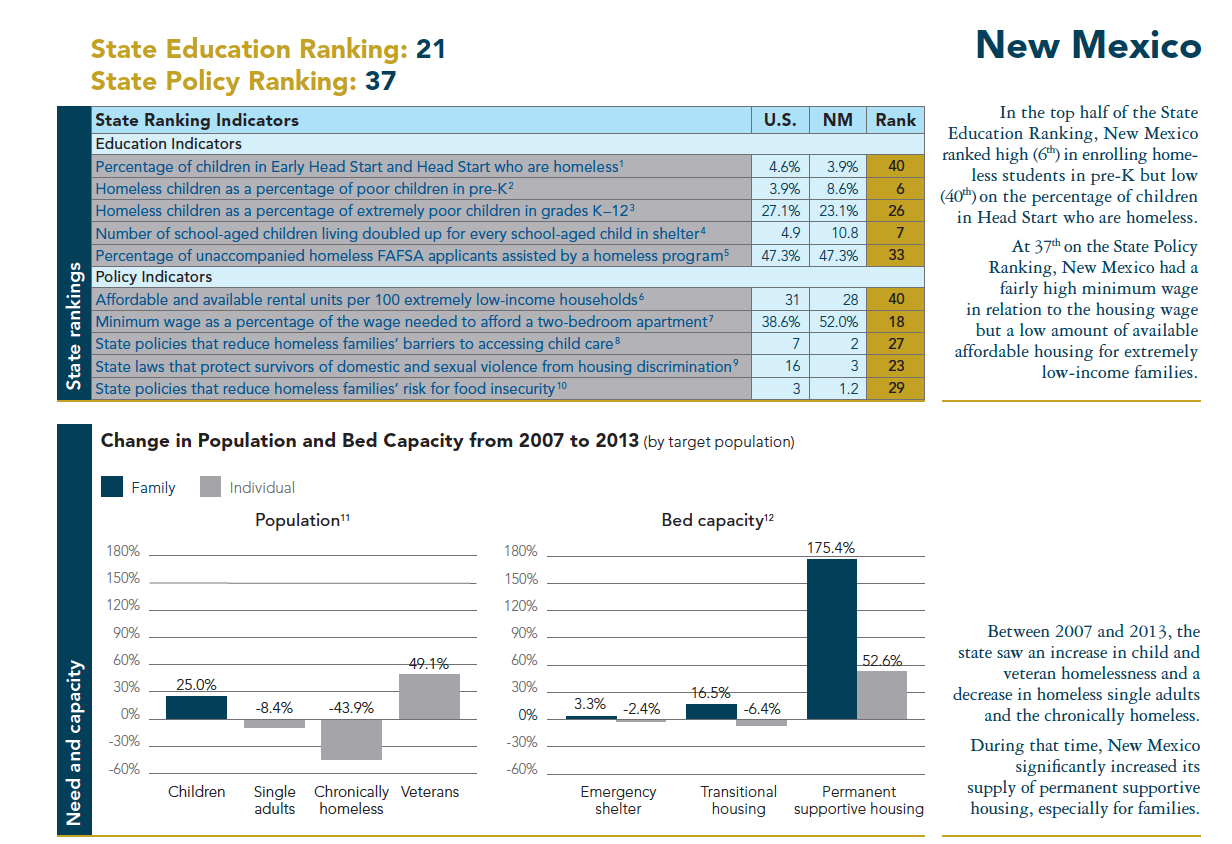
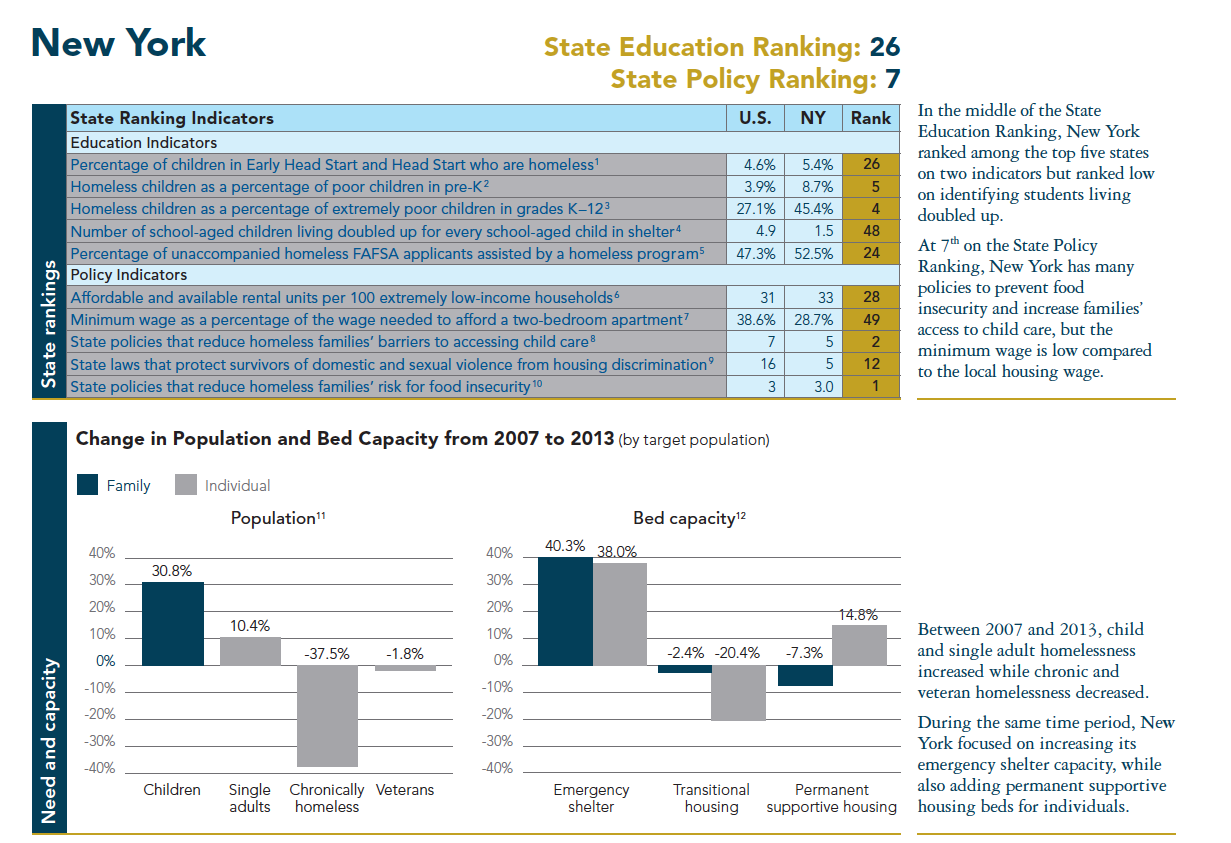
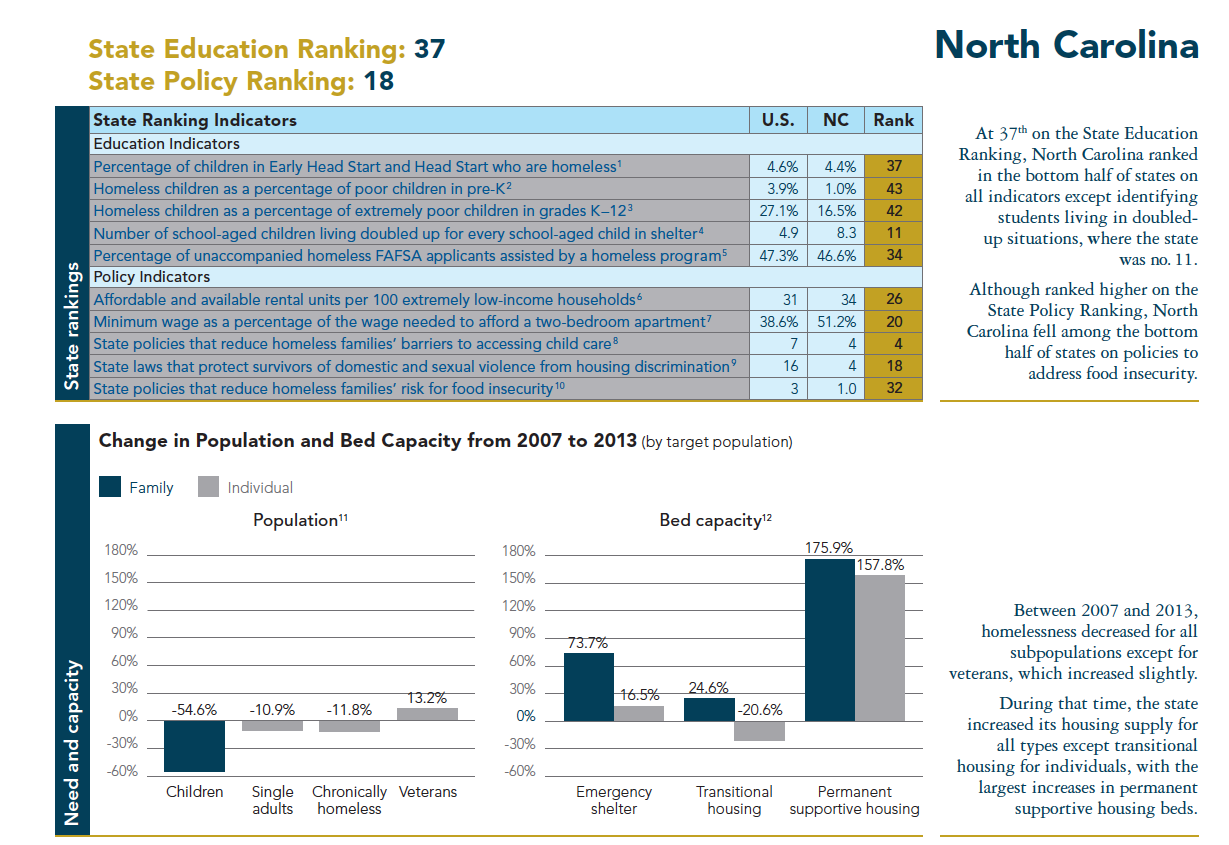
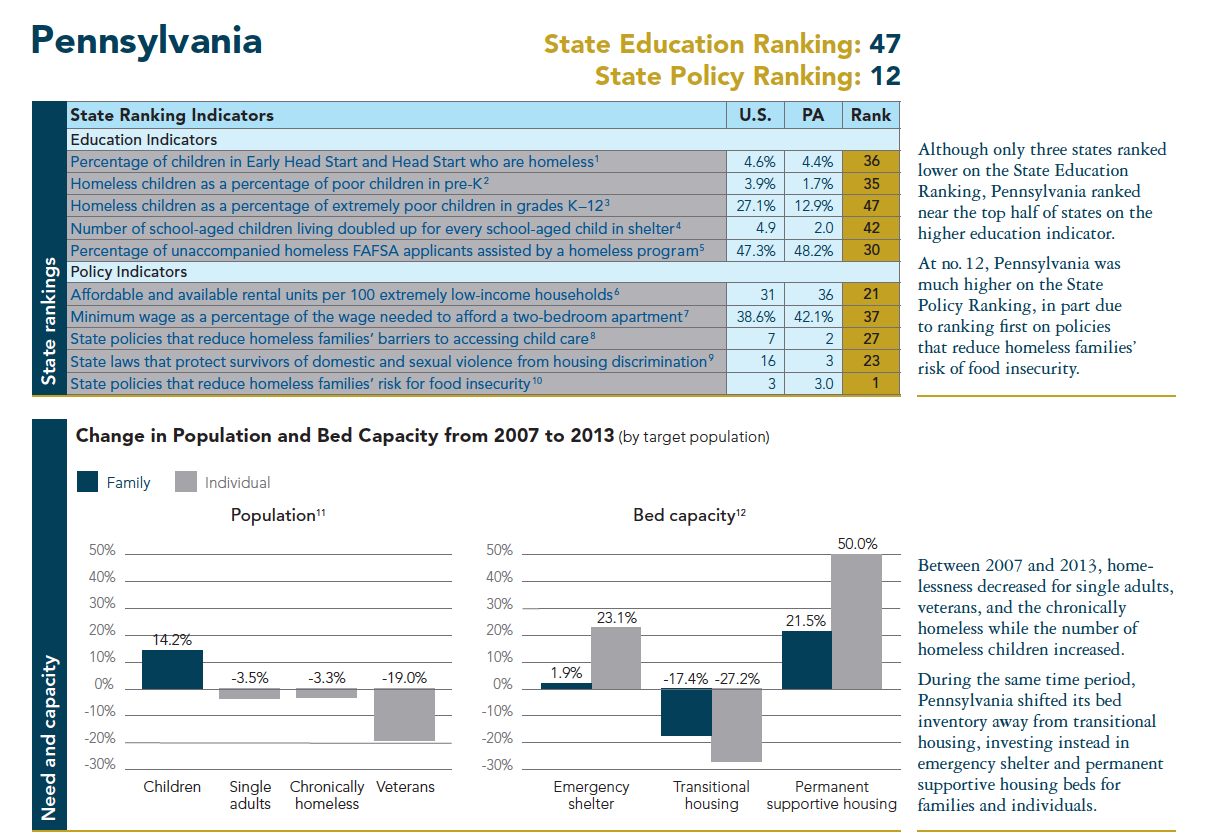
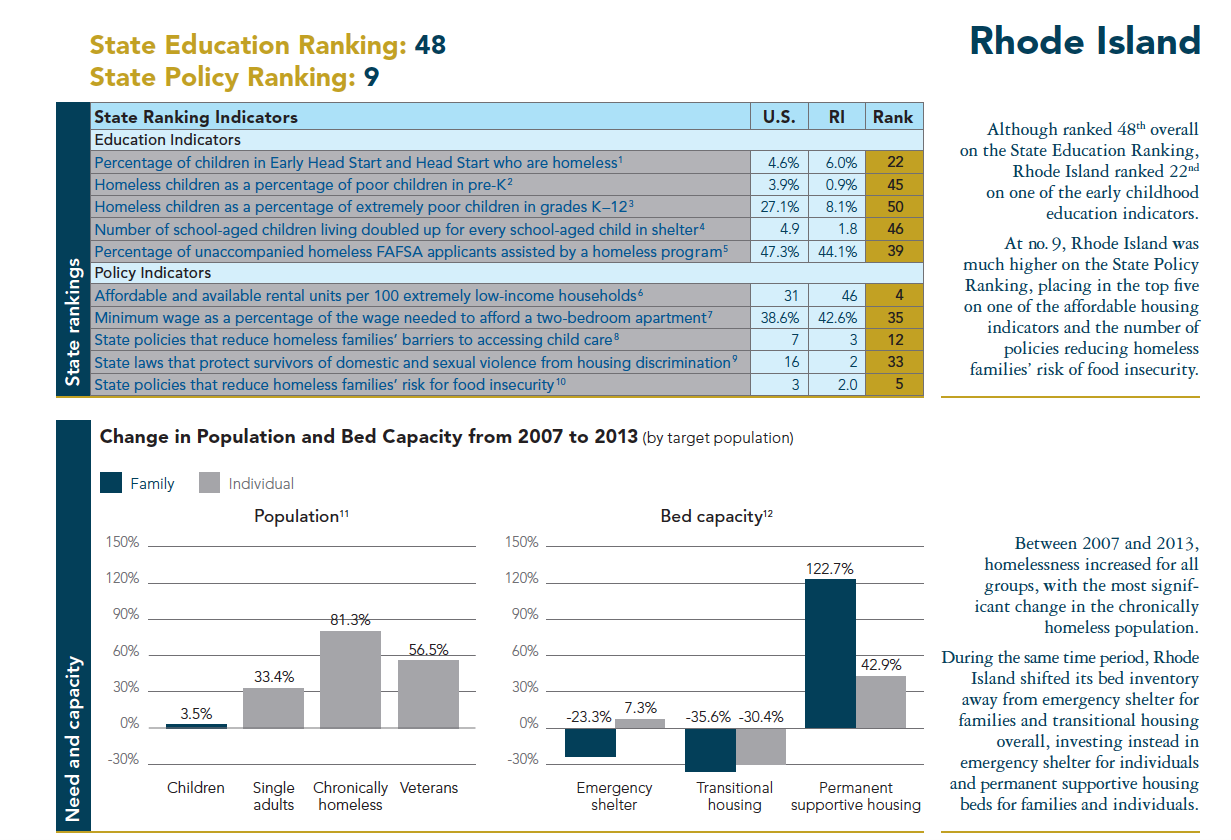
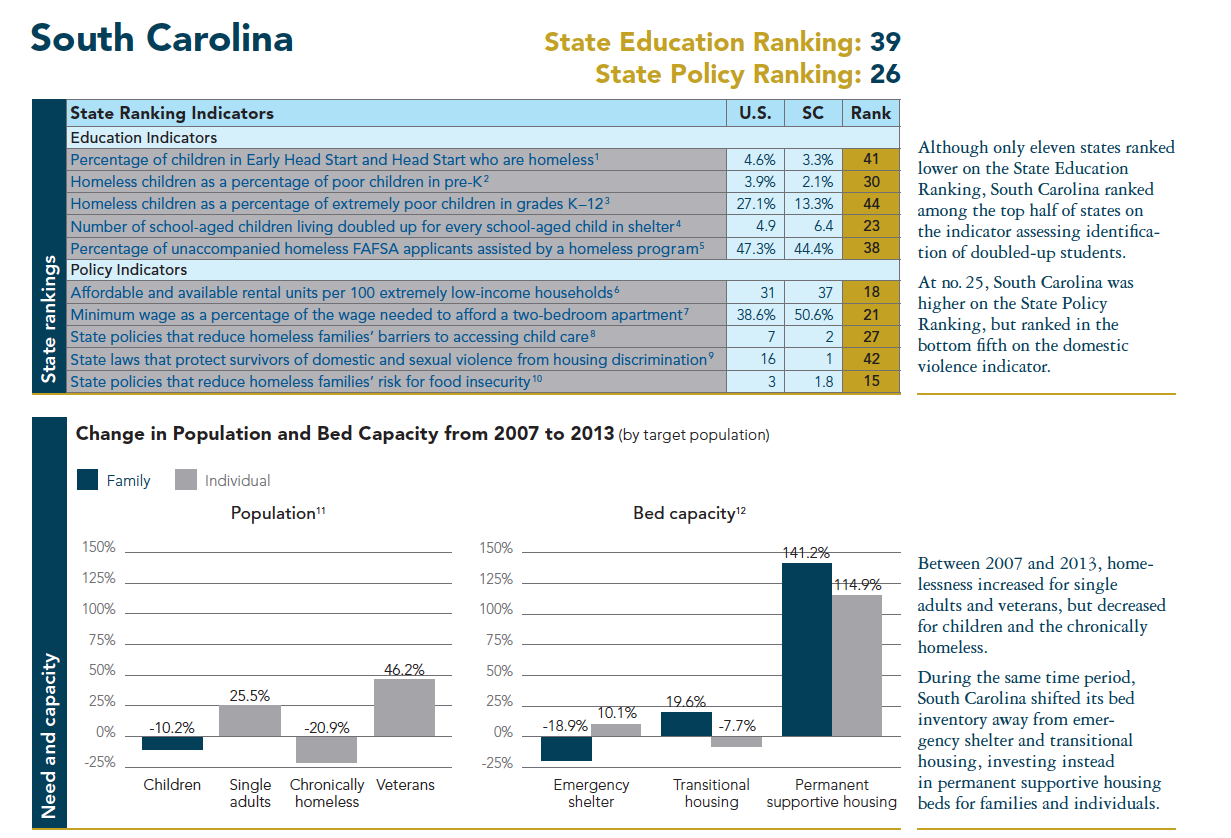
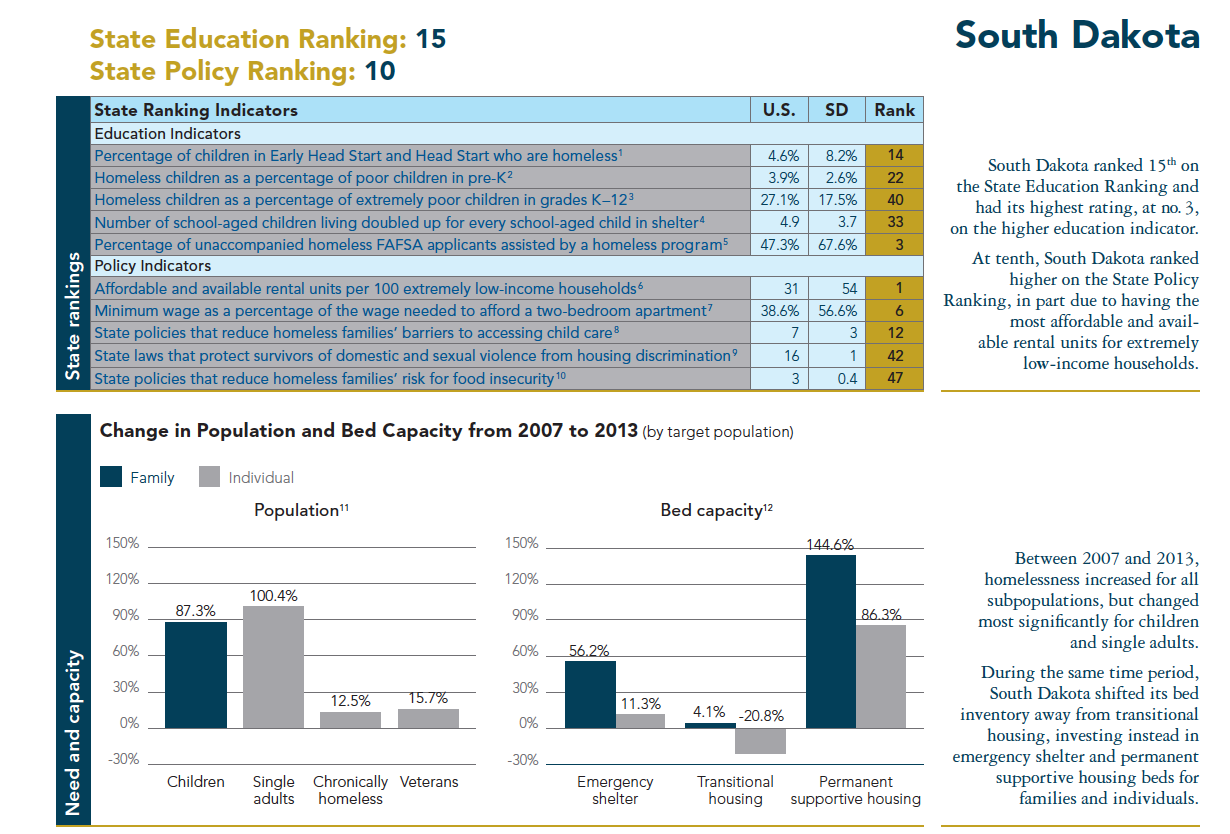
11 U.S. Department of Housing and Urban Development, HUD’s CoC Homeless Assistance Programs—Homeless Populations and Subpopulations, 2007–13; National Center for Homeless Education, Education for Homeless Children and Youth Program Data Collection Summary, 2010–13; U.S. Department of Education, “ED Data Express,” http://www.eddataexpress.ed.gov.
12 U.S. Department of Housing and Urban Development, HUD’s CoC Homeless Assistance Programs—Housing Inventory Chart Report, 2007–13.
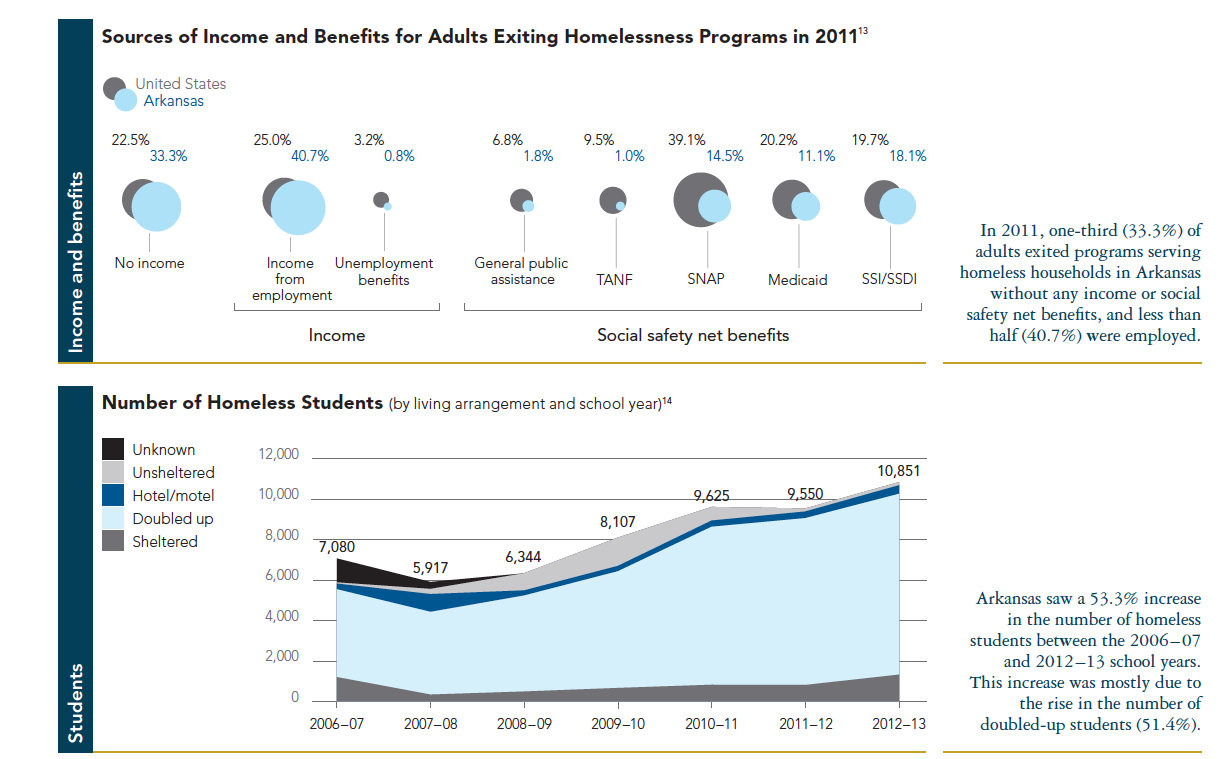
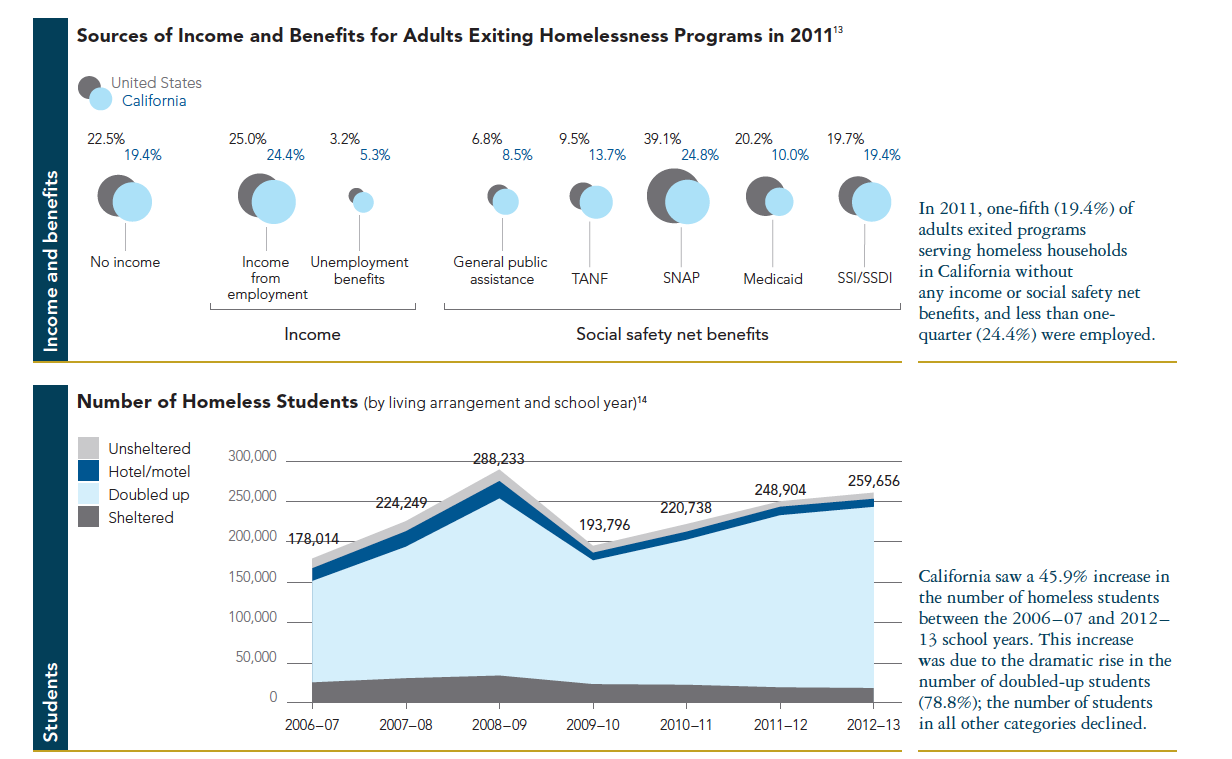
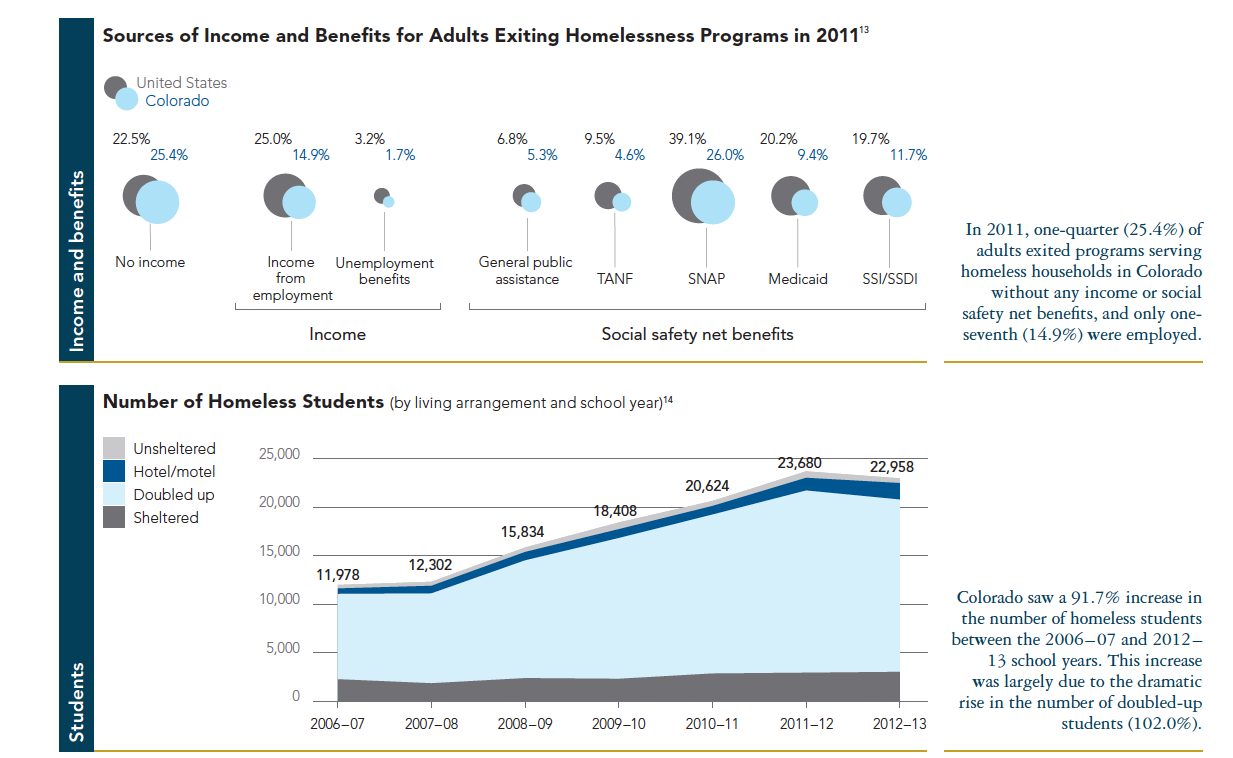
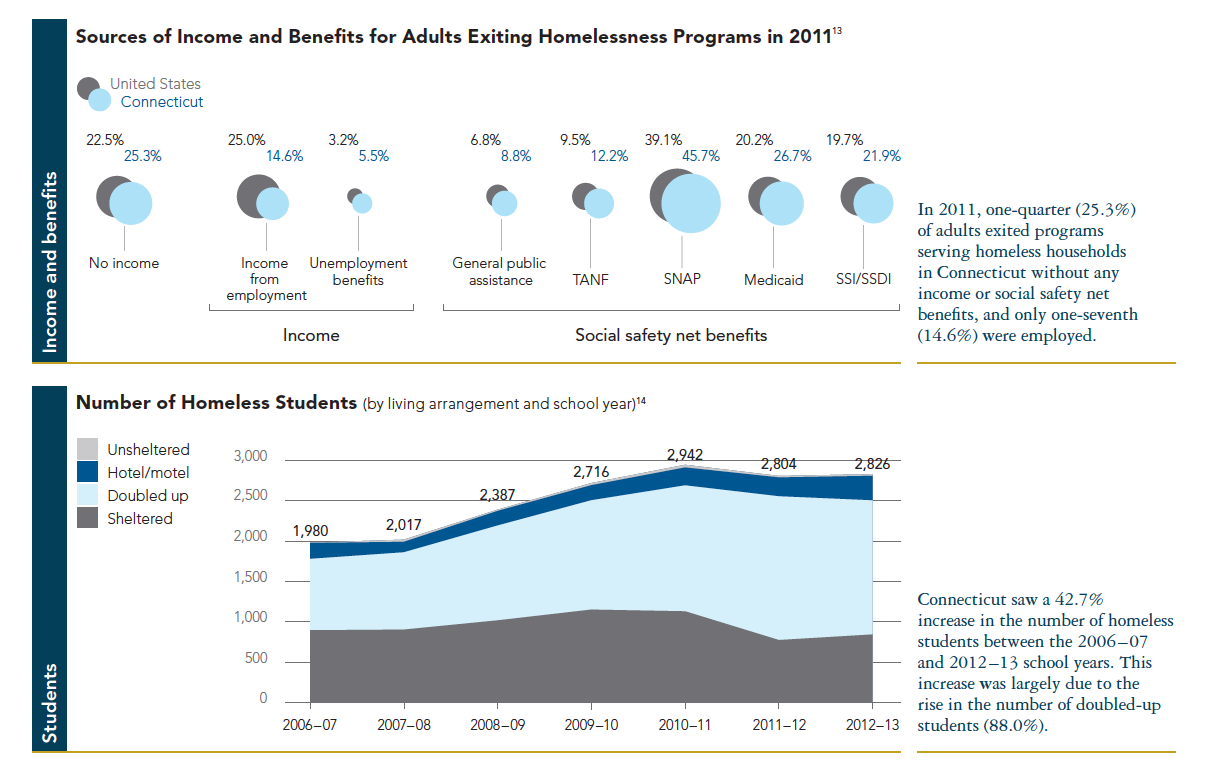
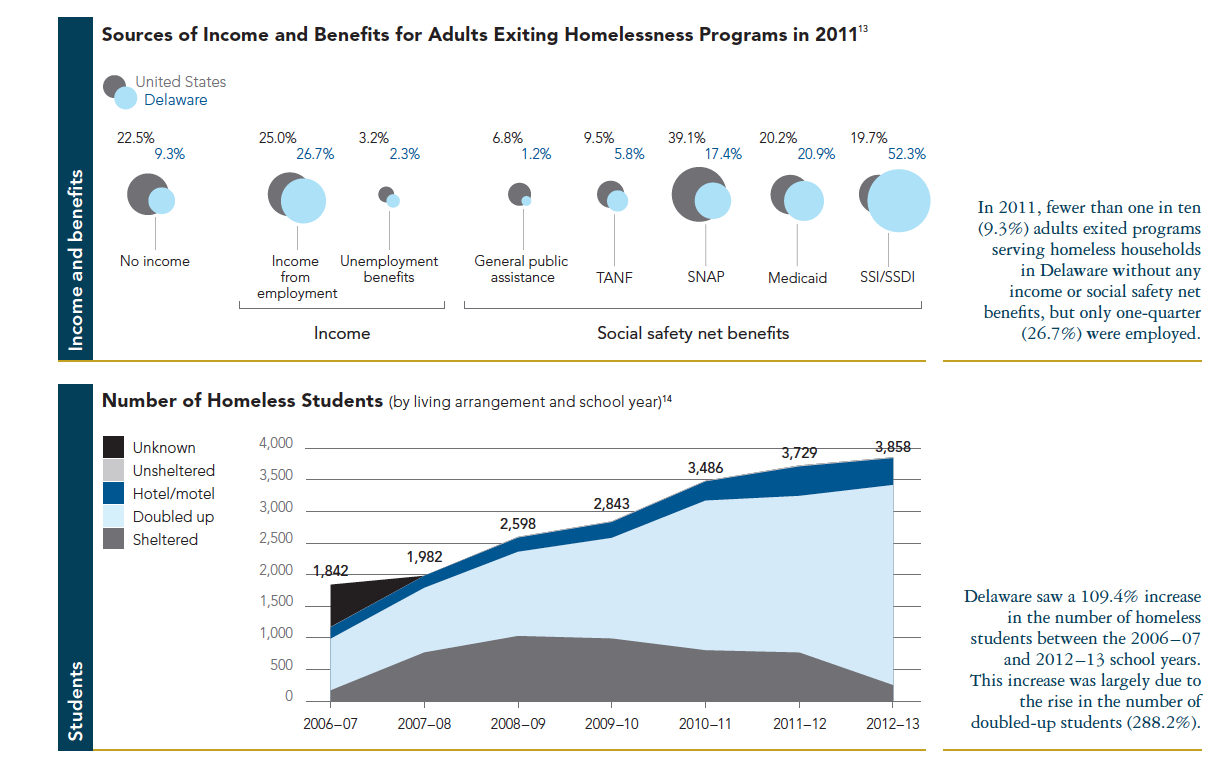
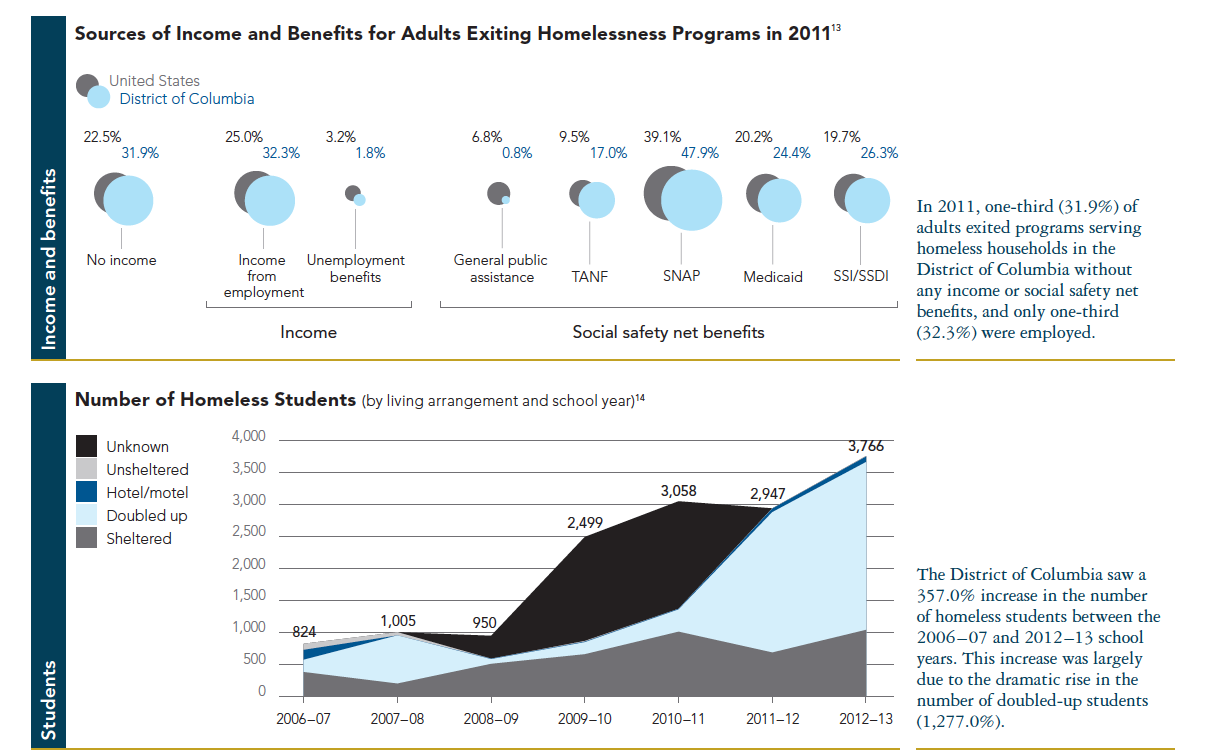
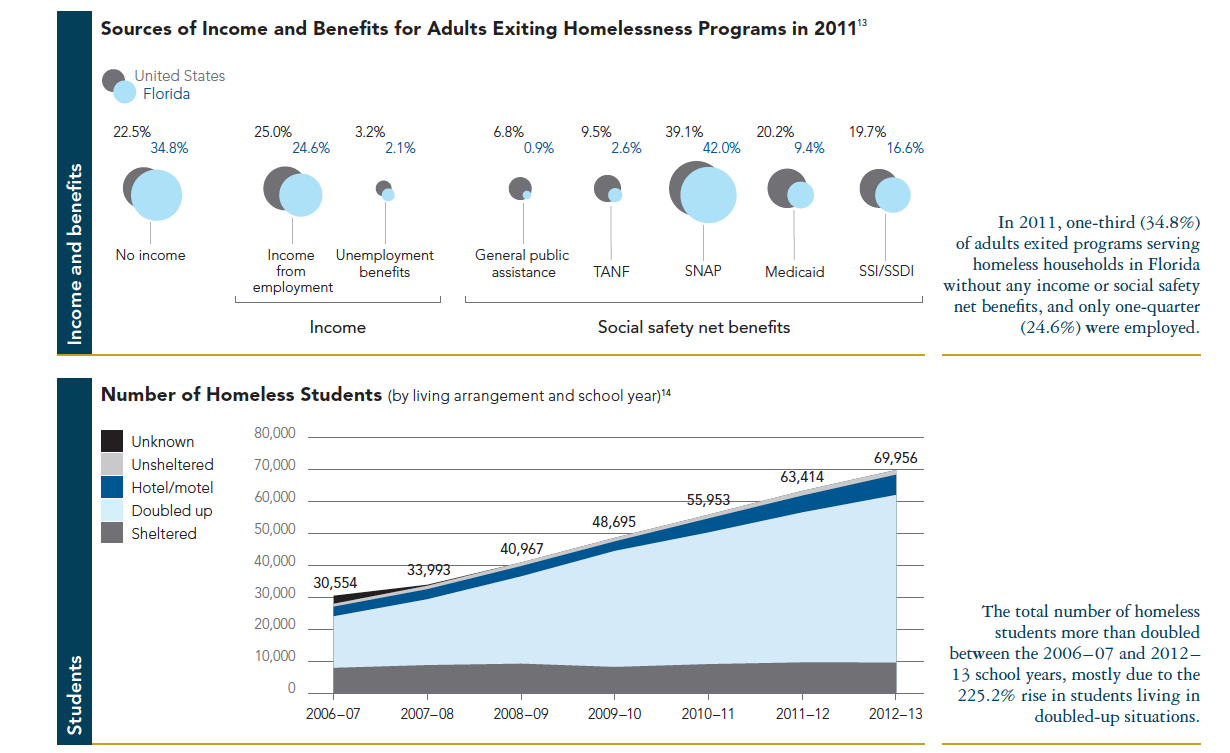
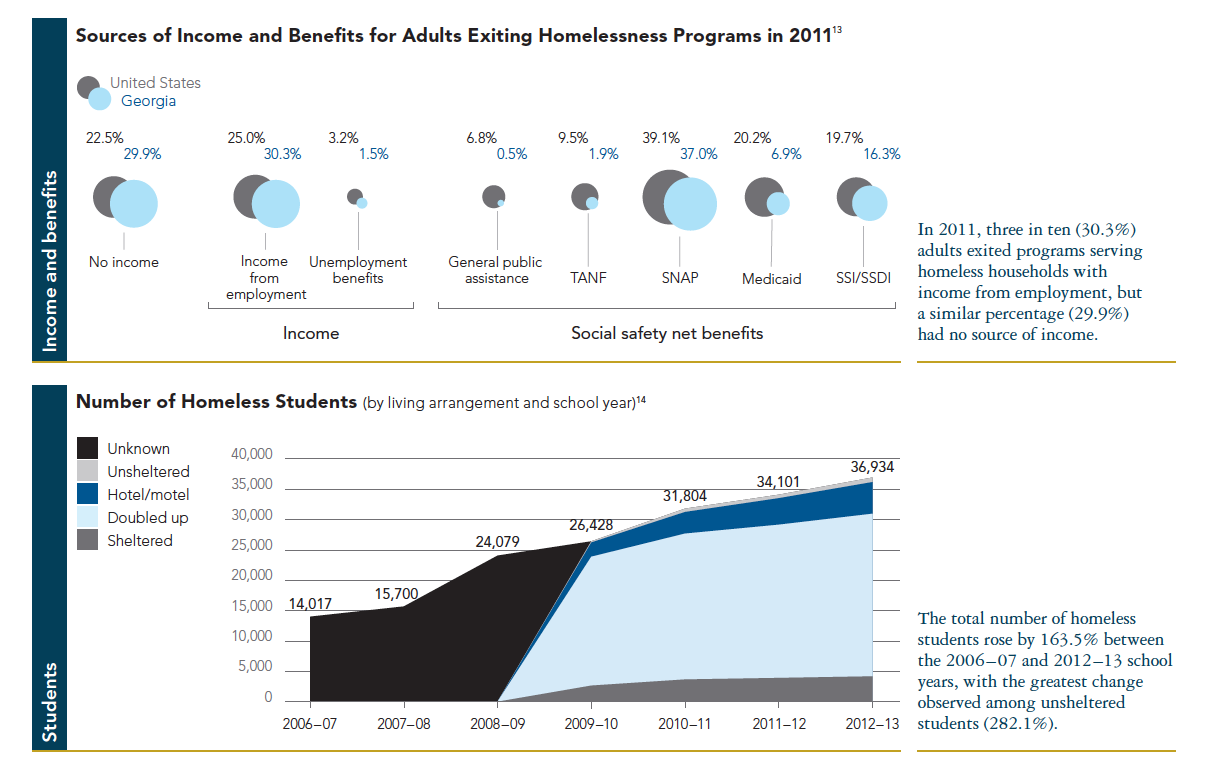
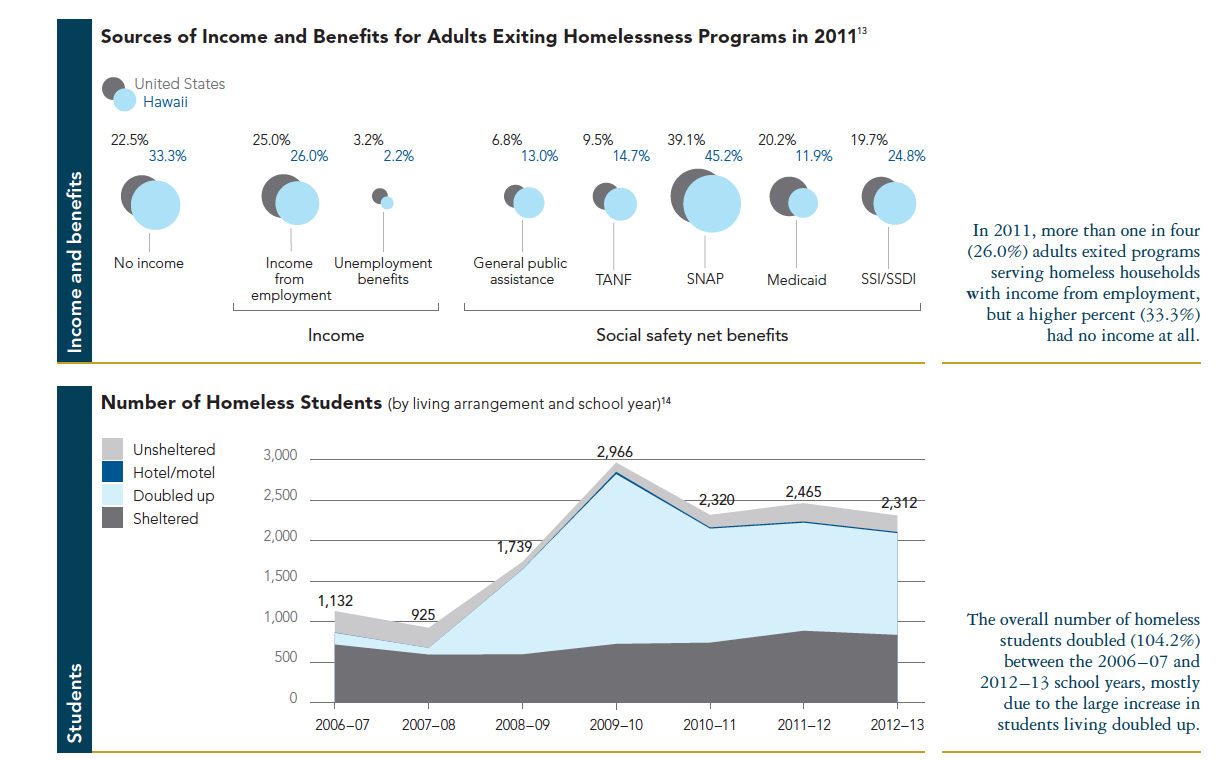
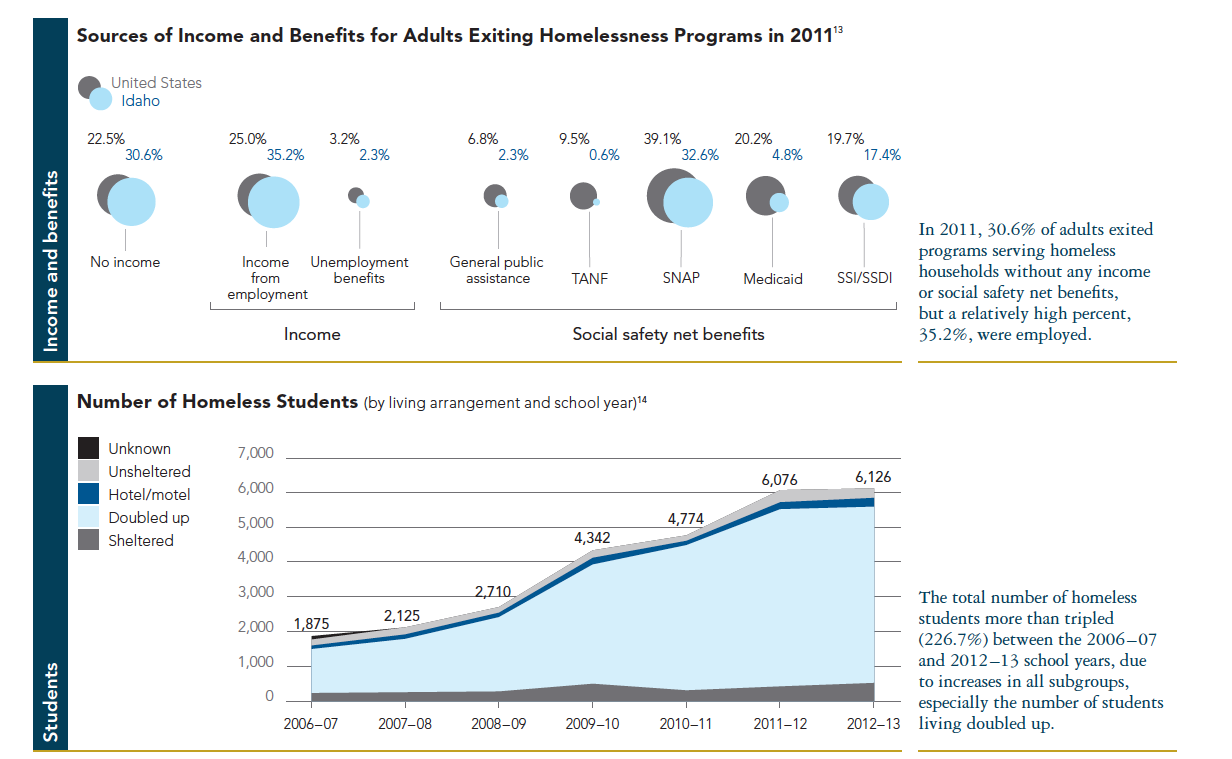
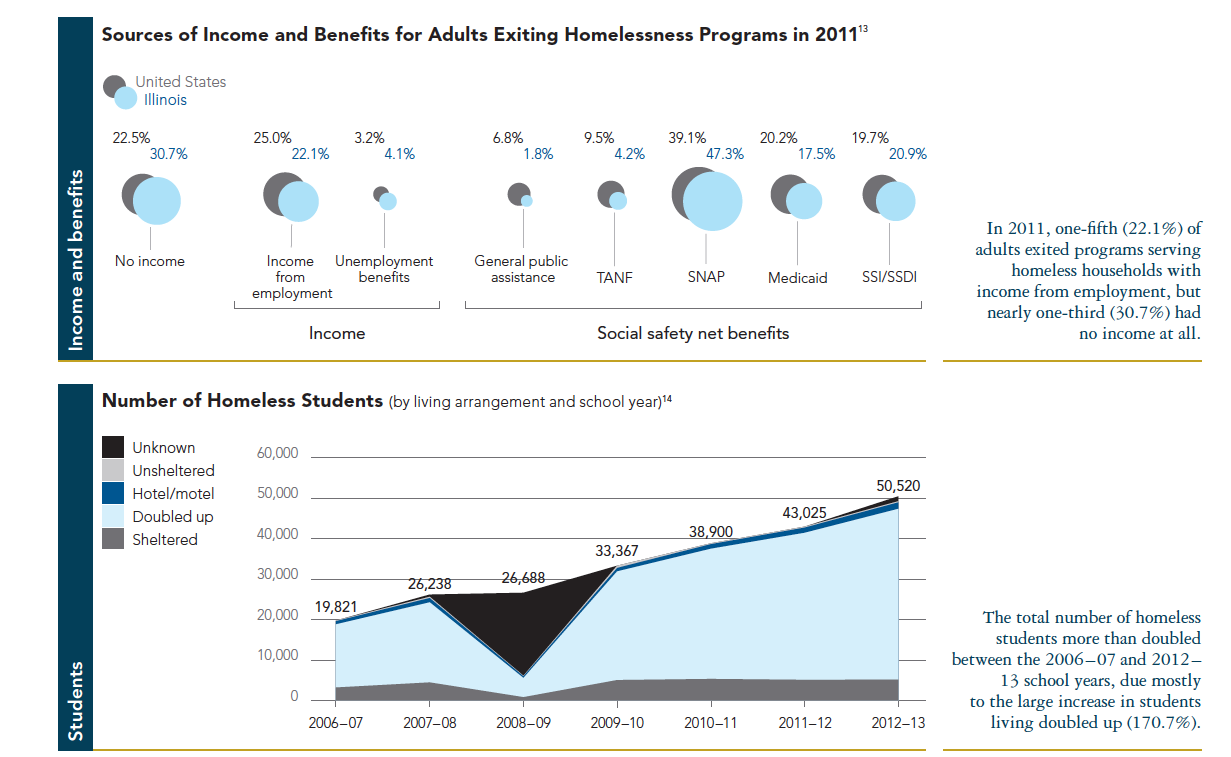
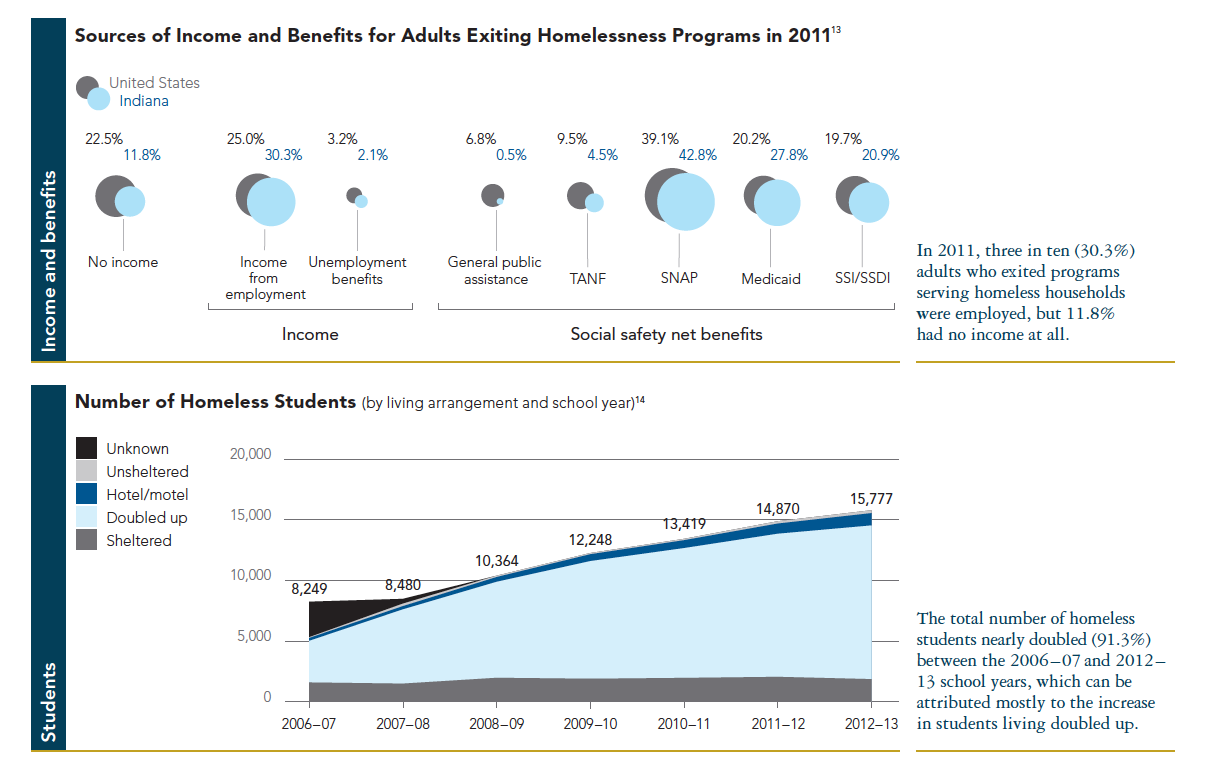
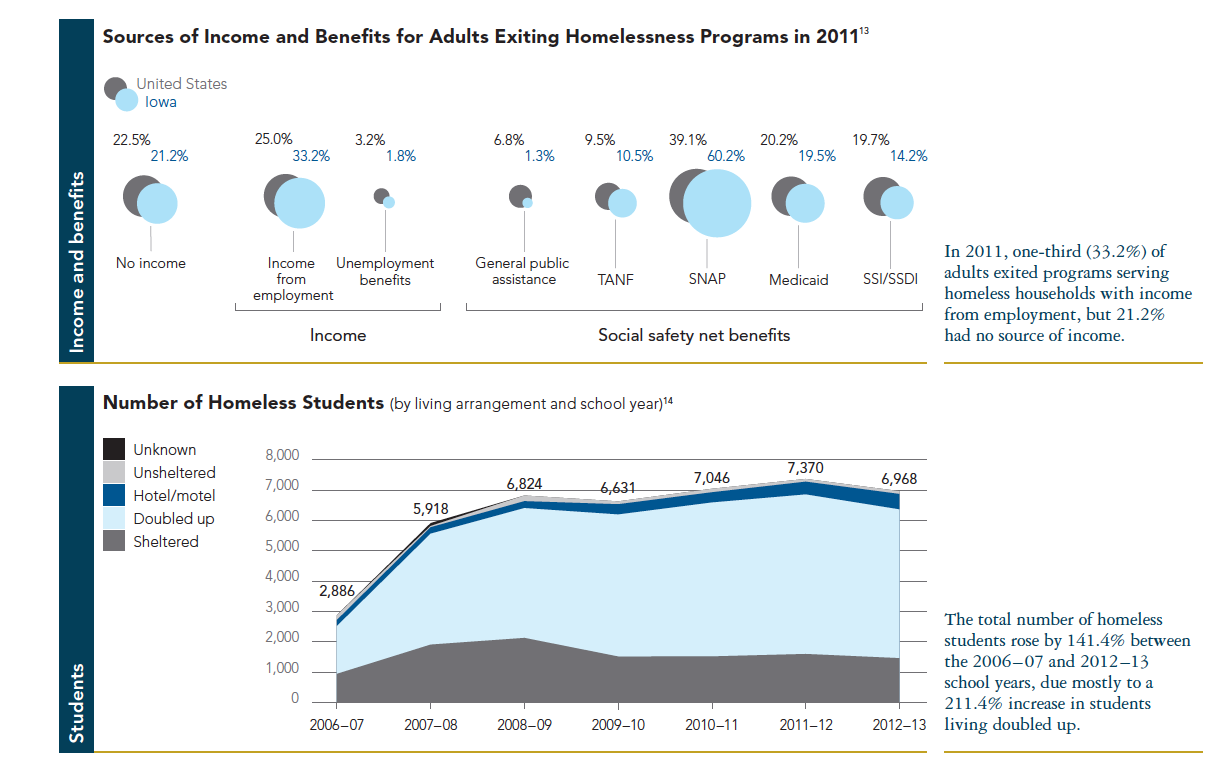
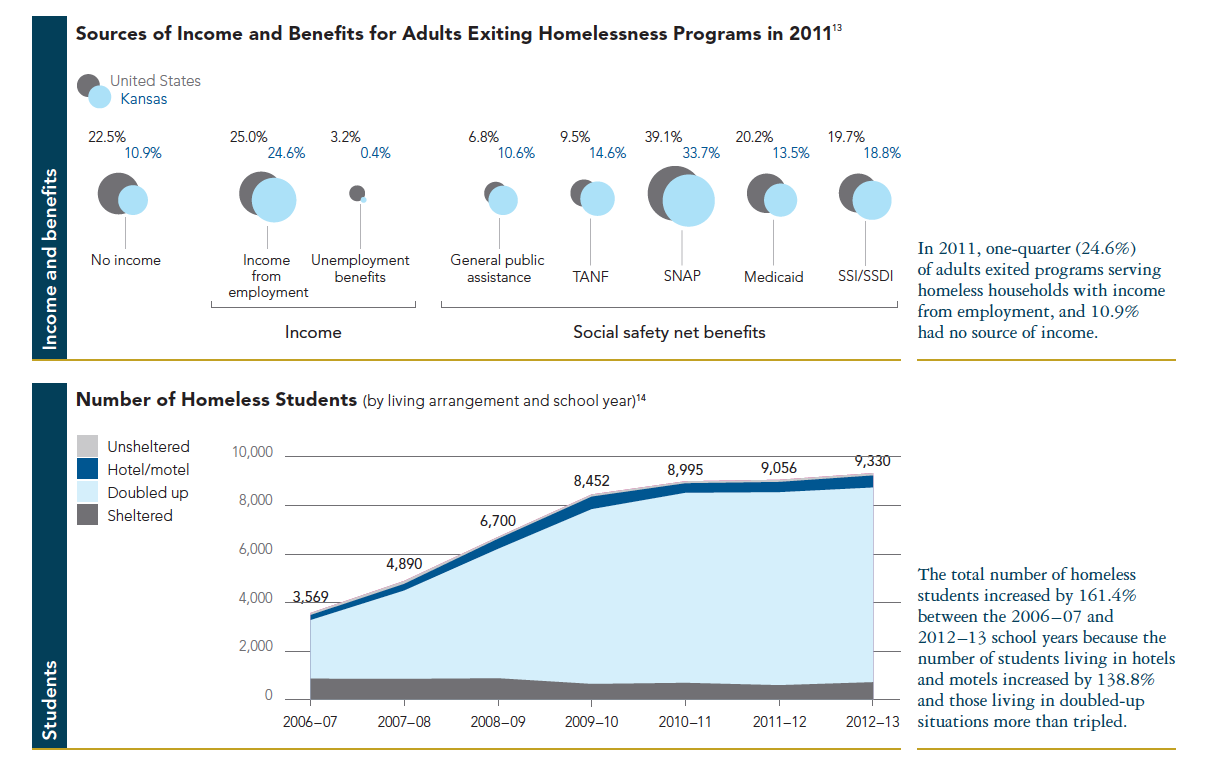
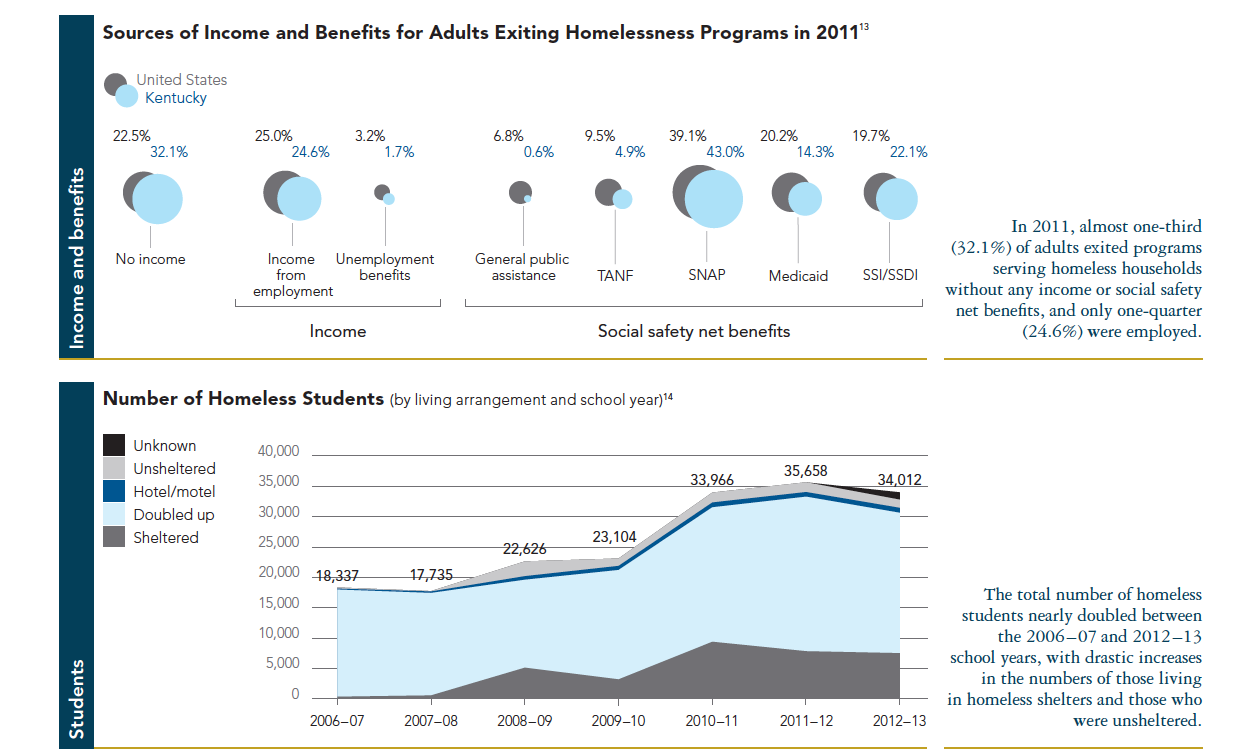
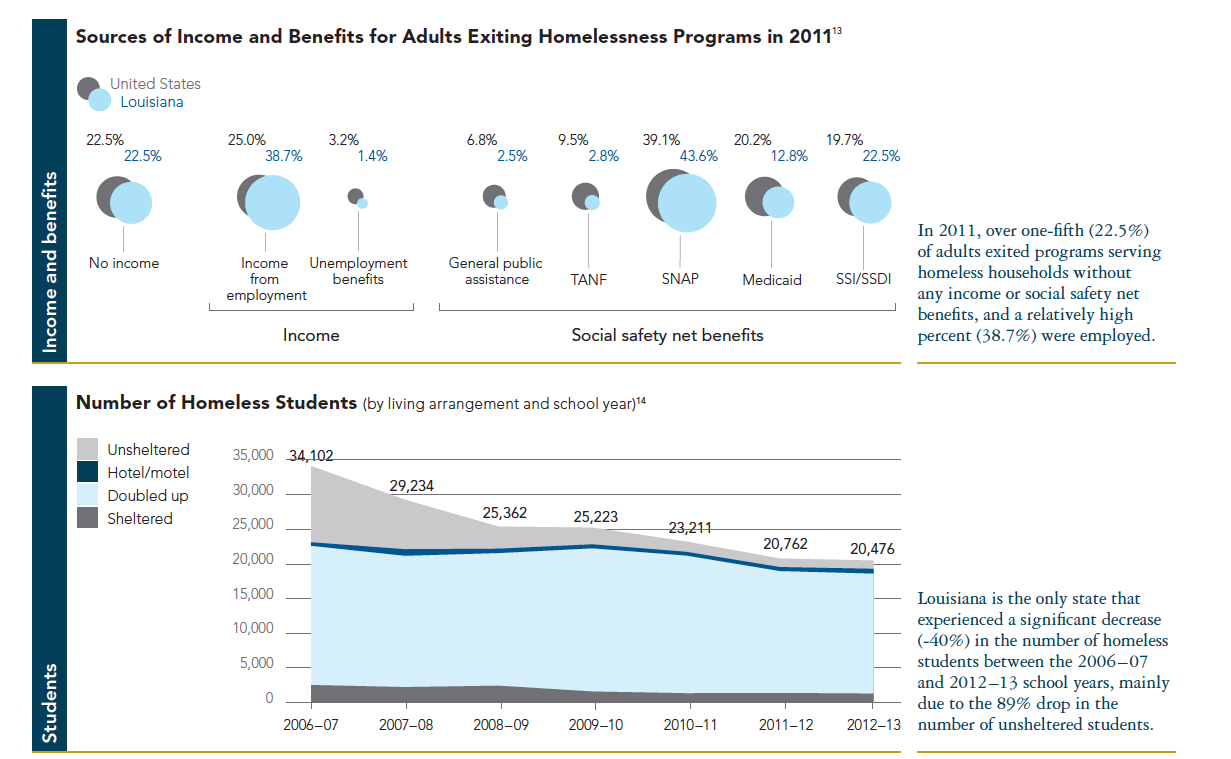
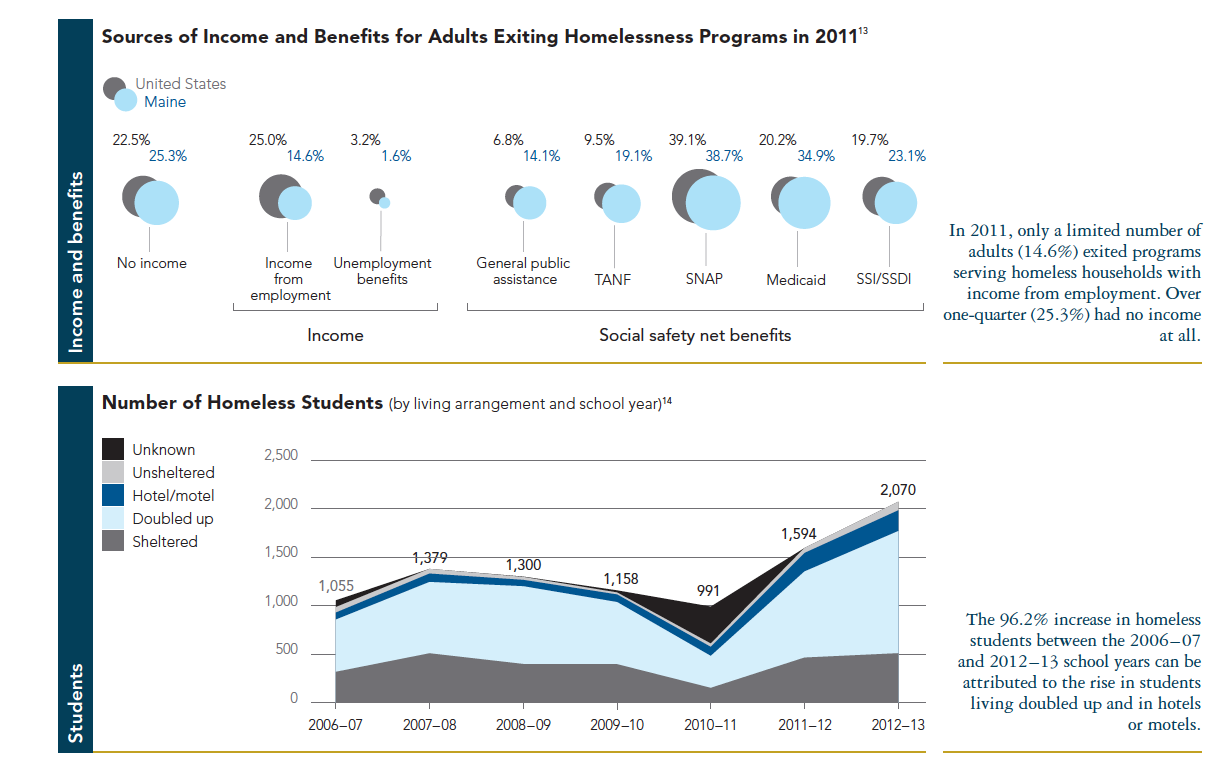
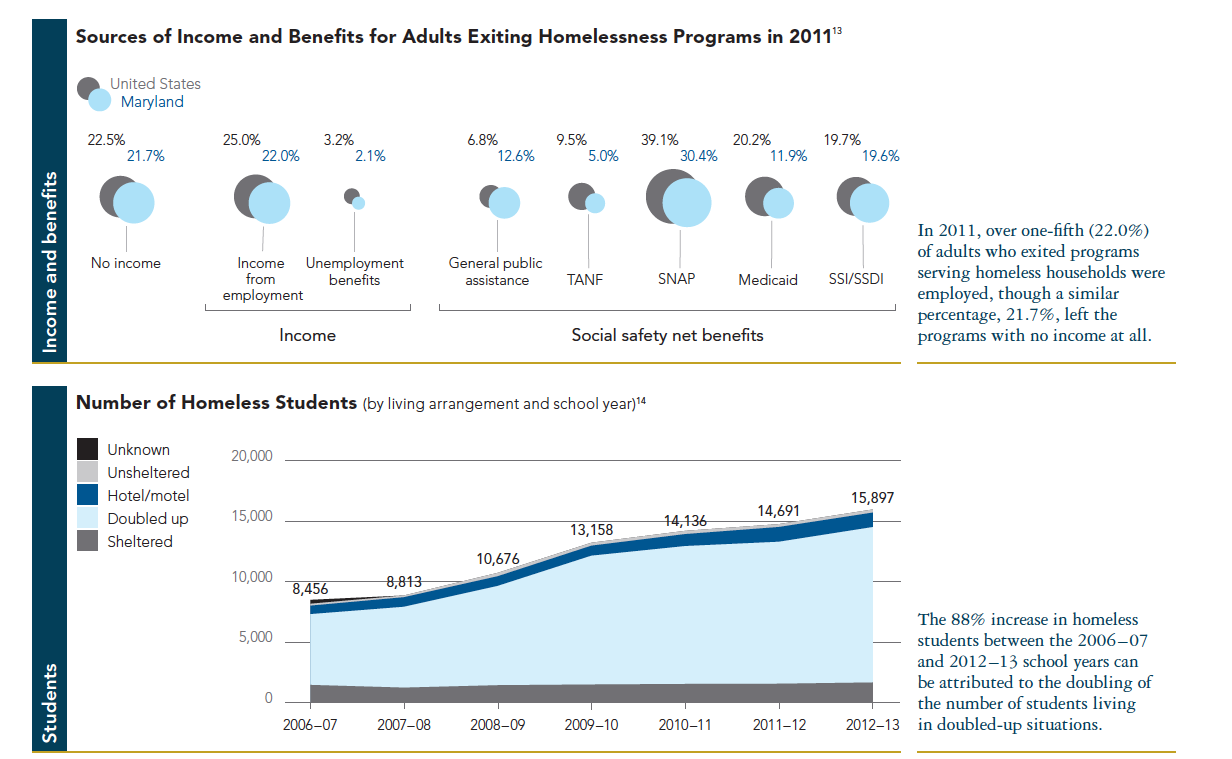
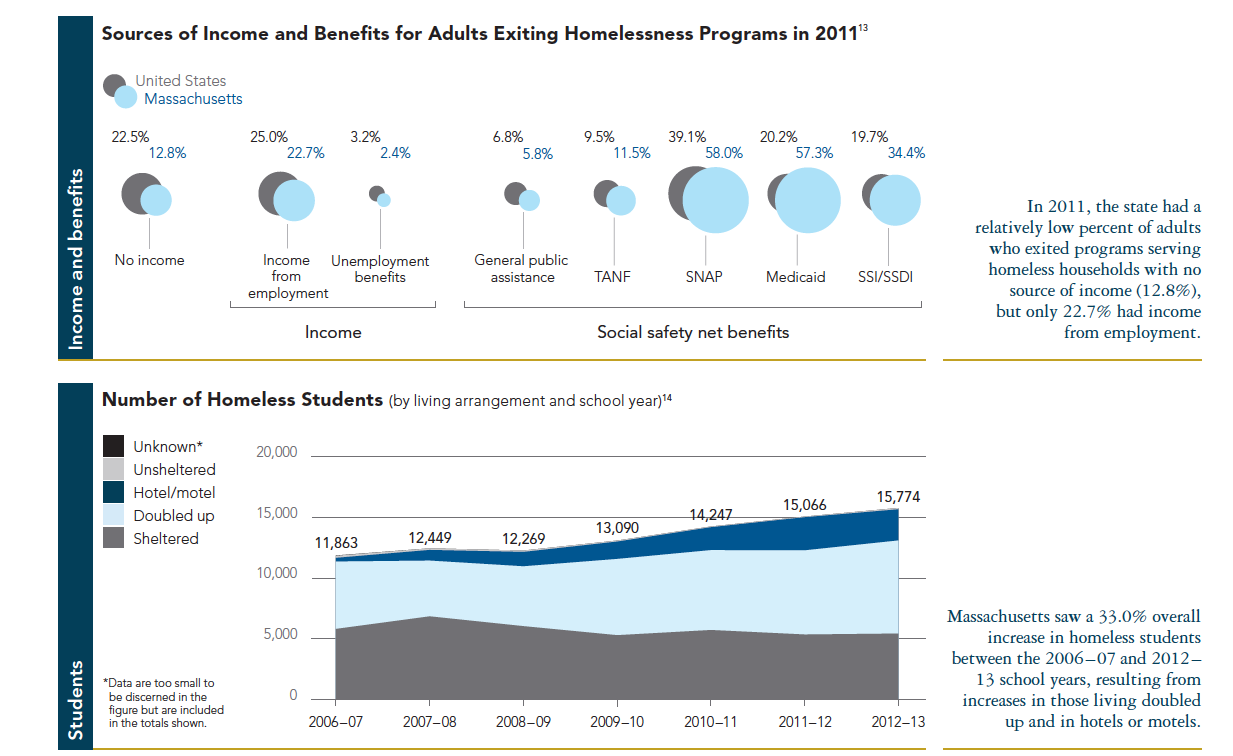
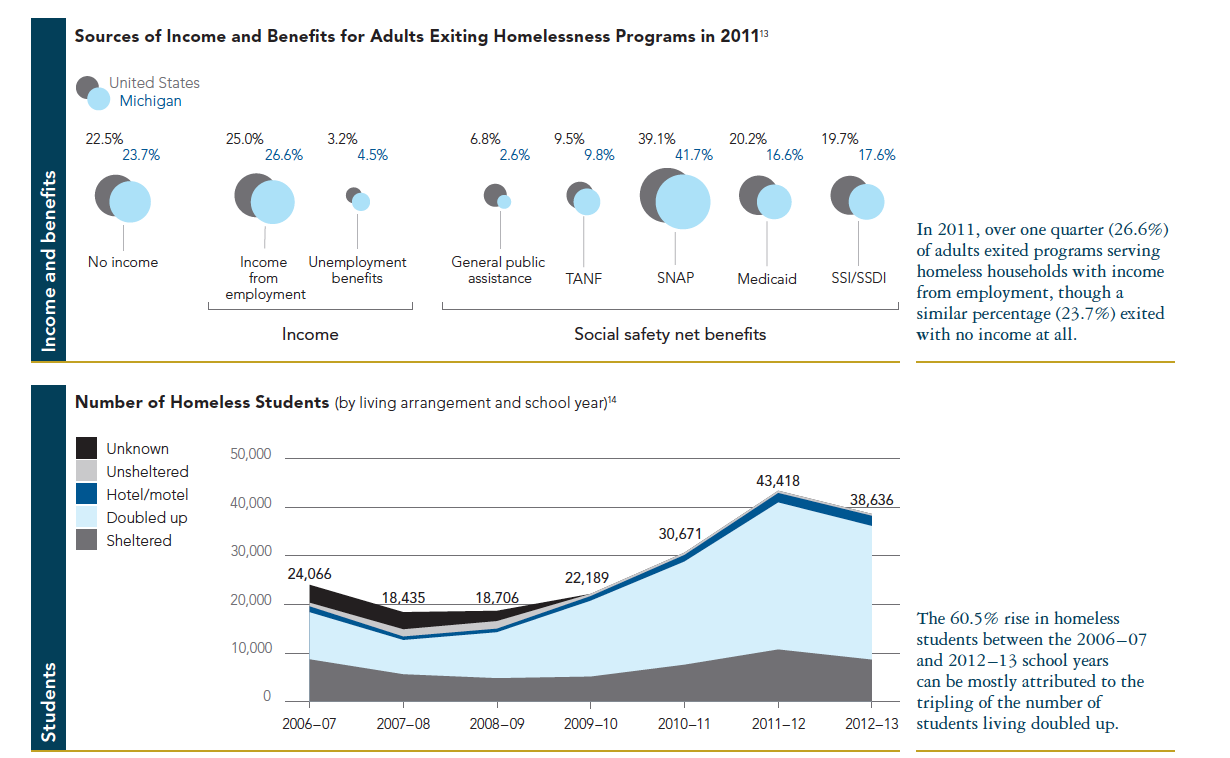
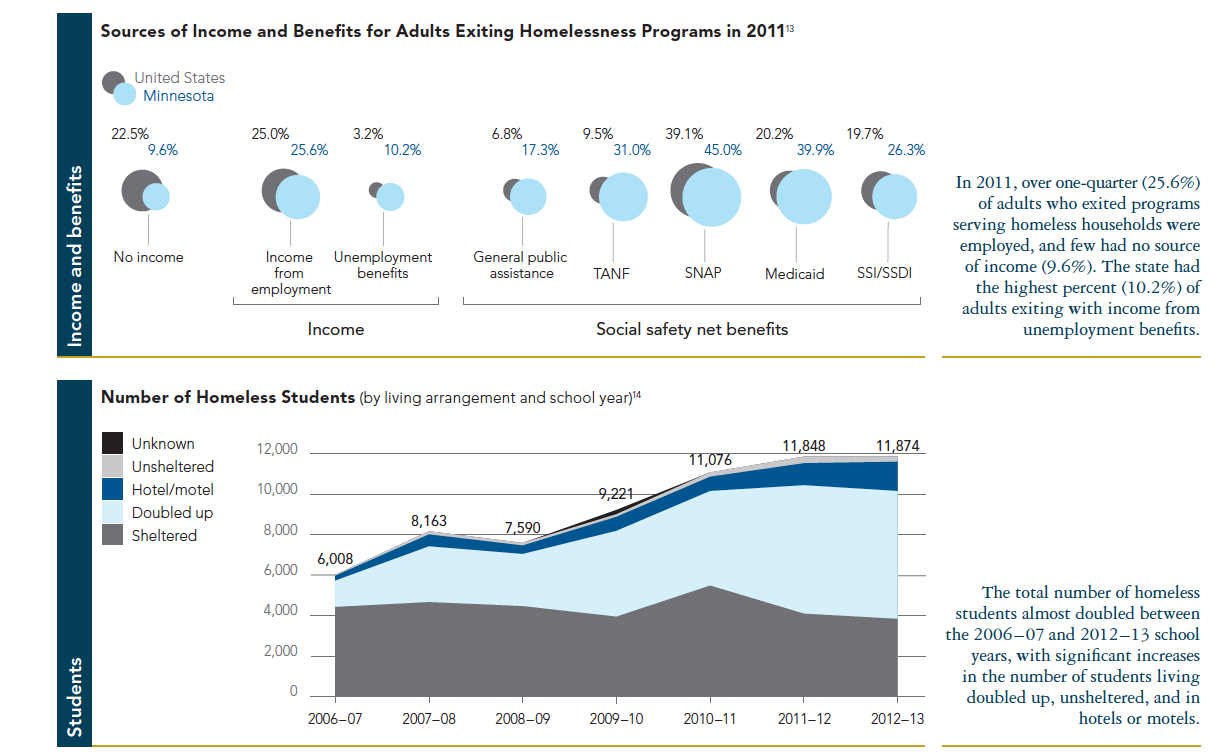
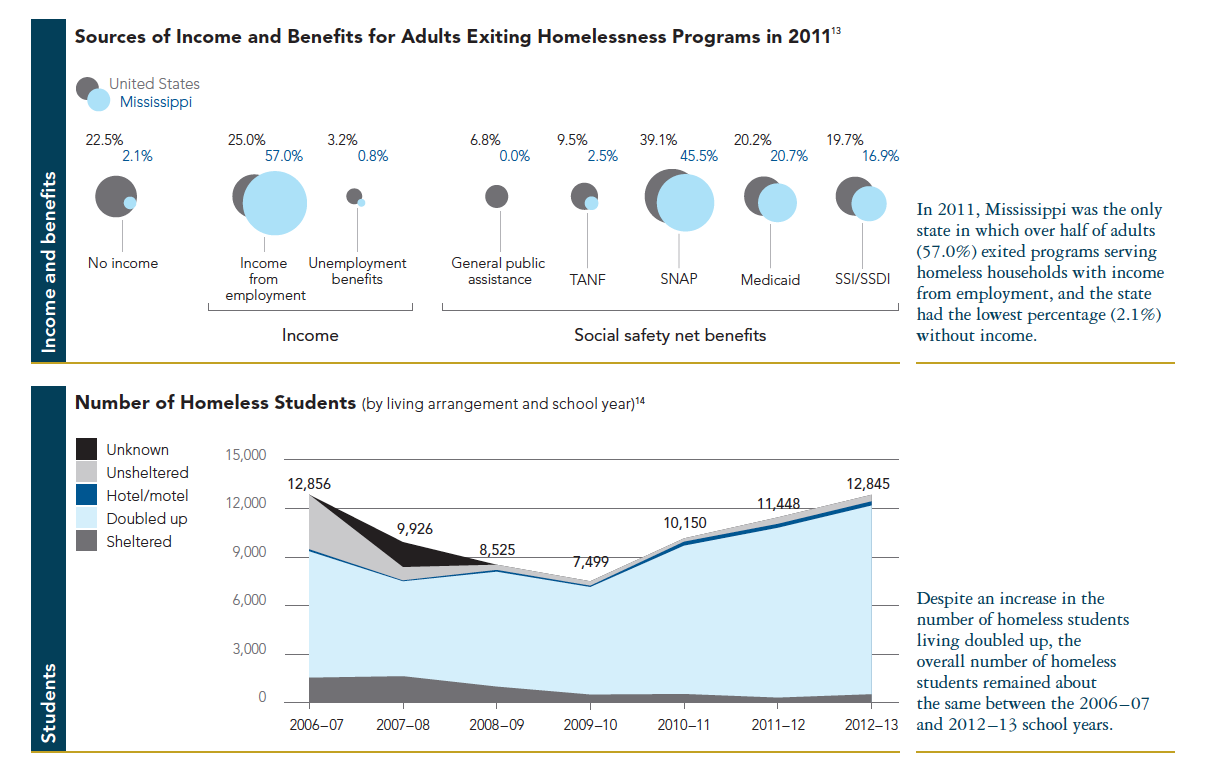
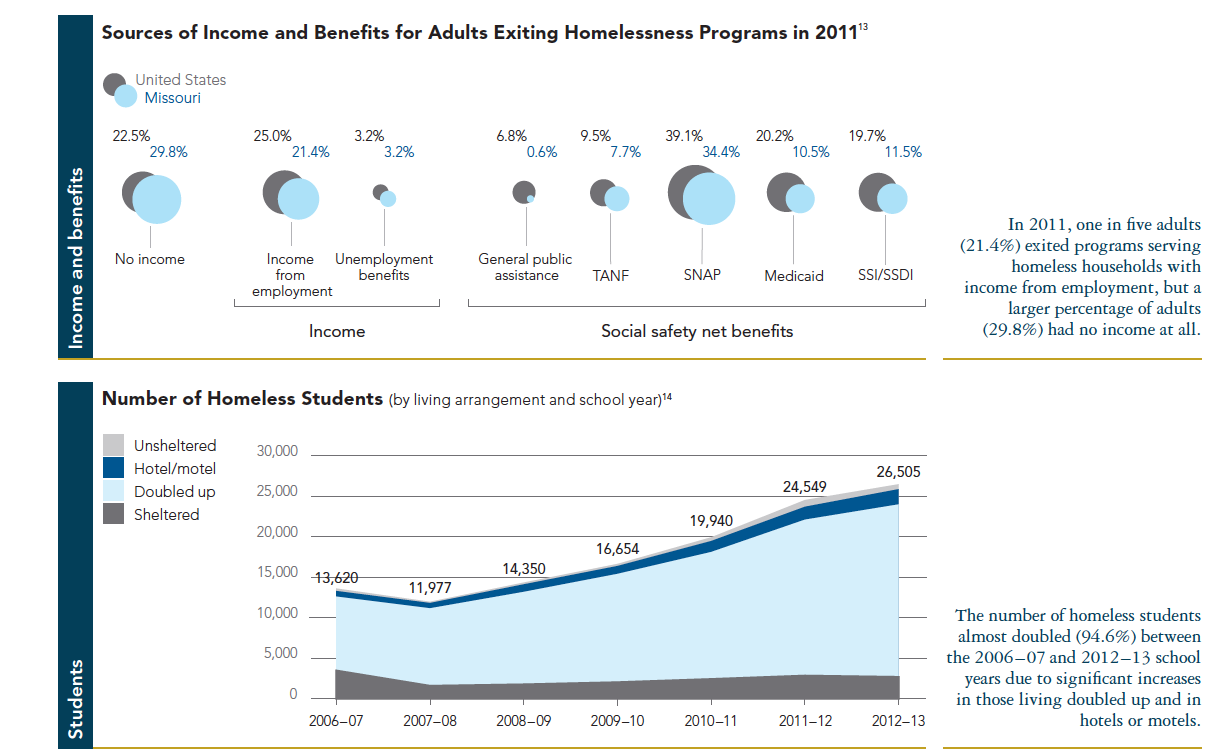
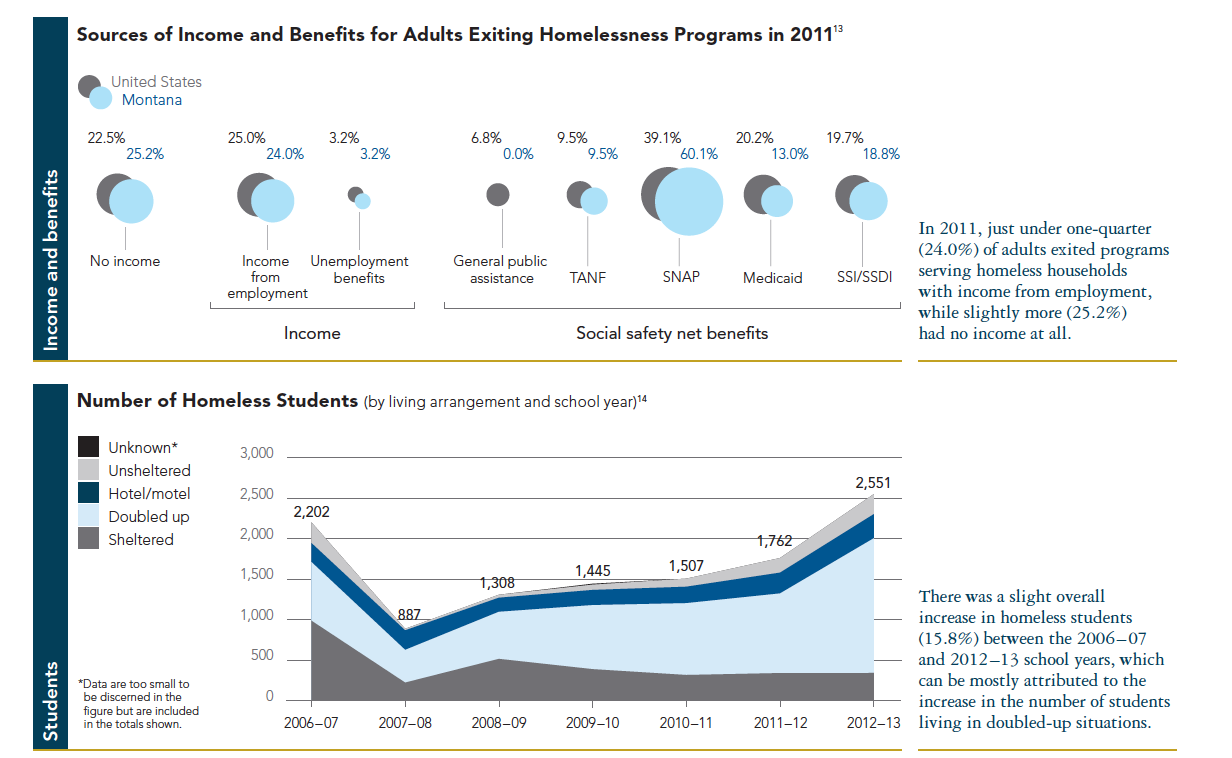
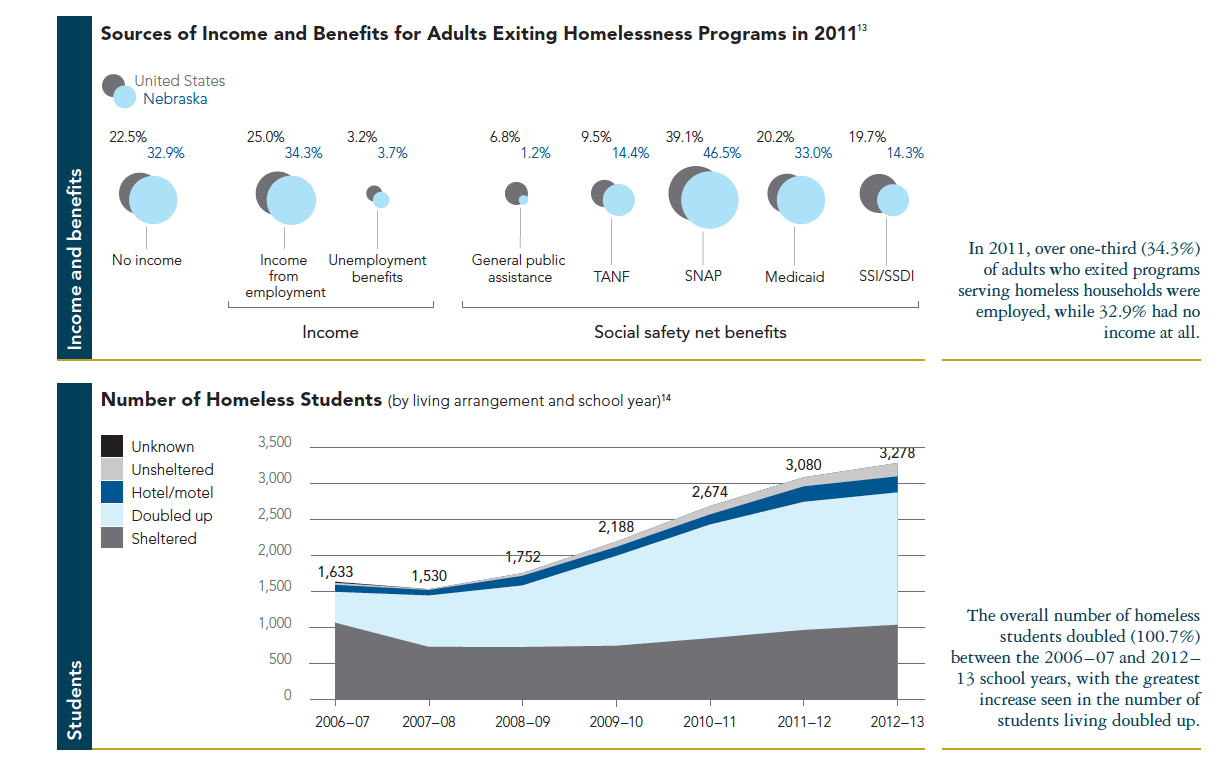
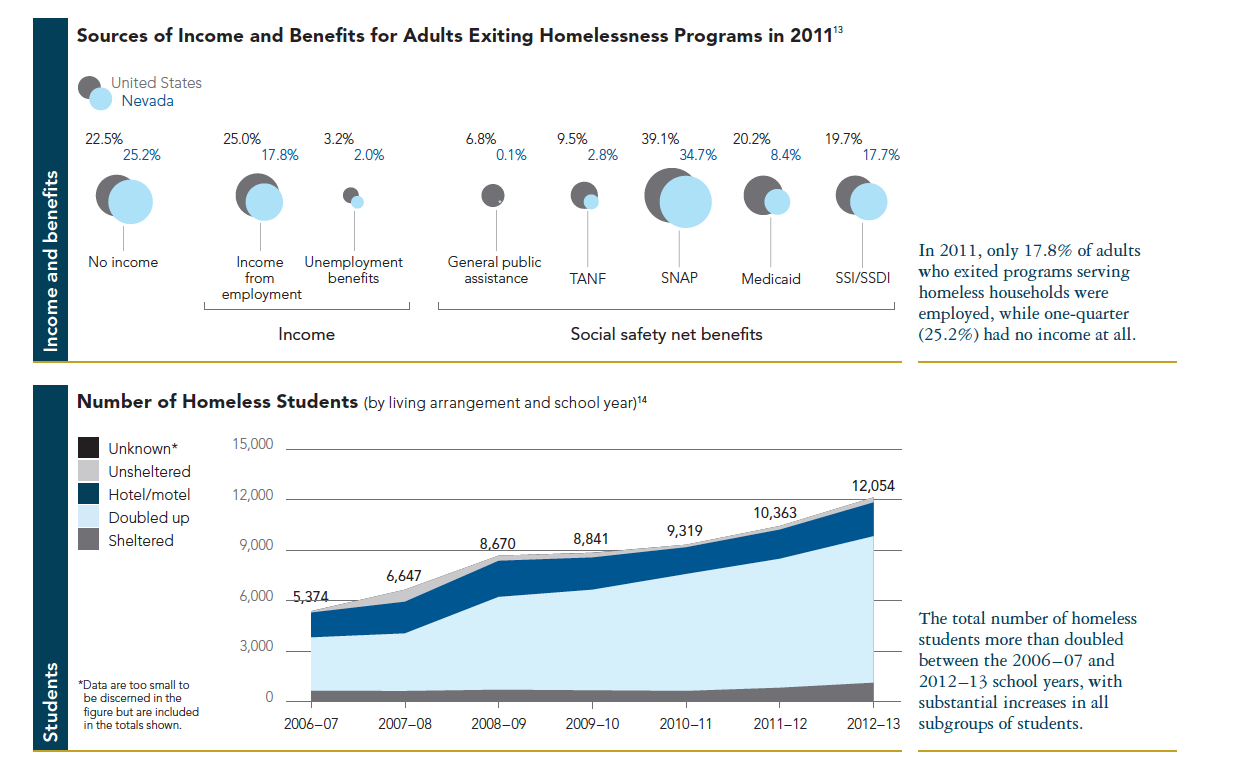
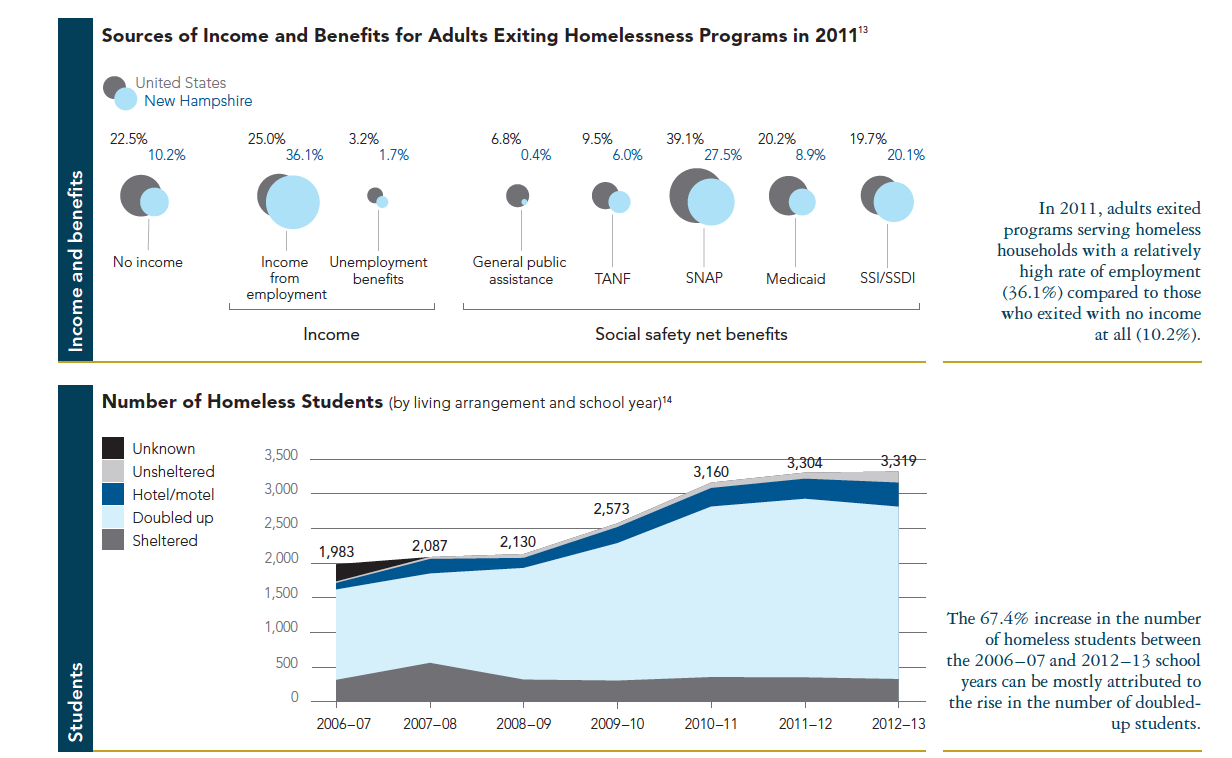
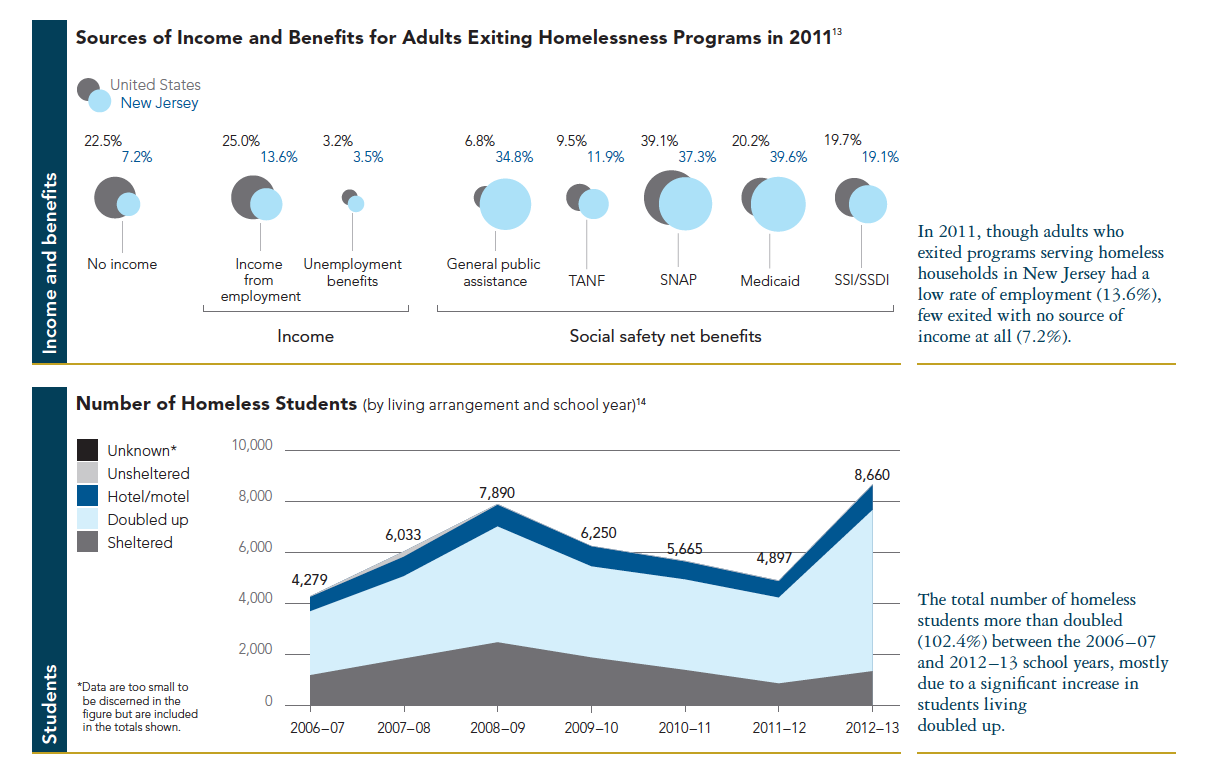
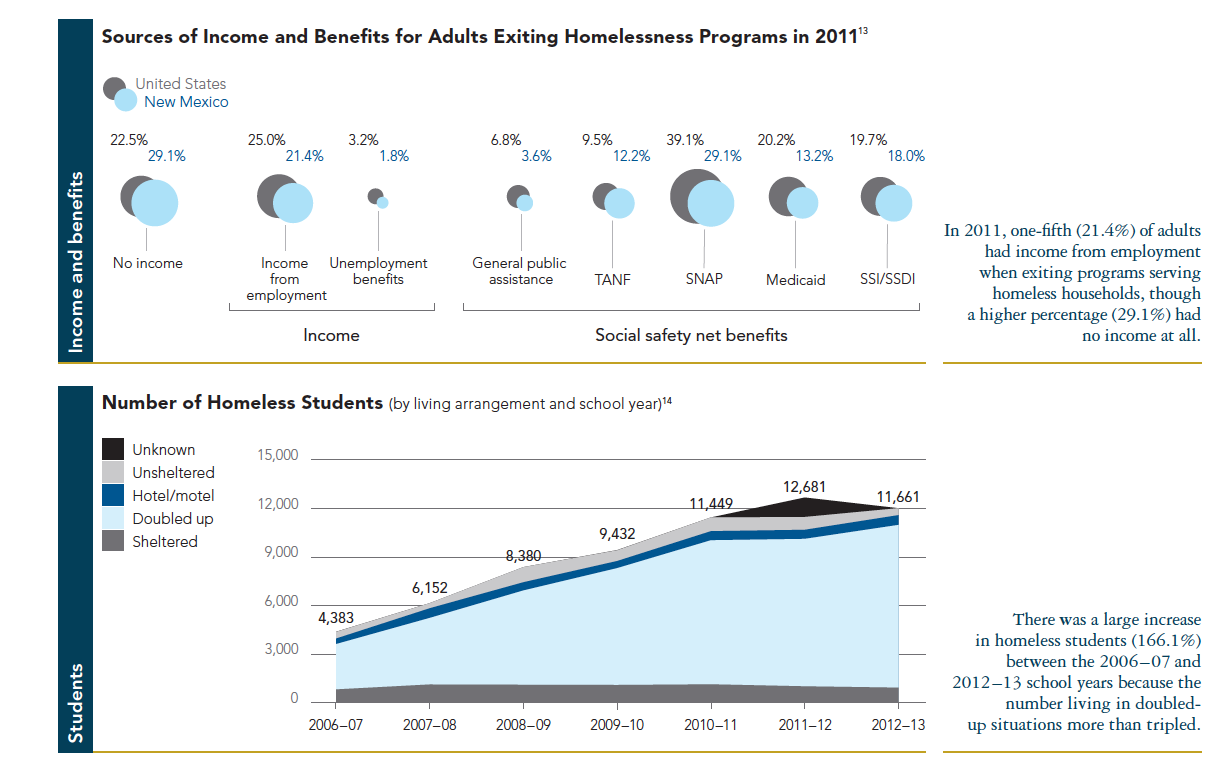
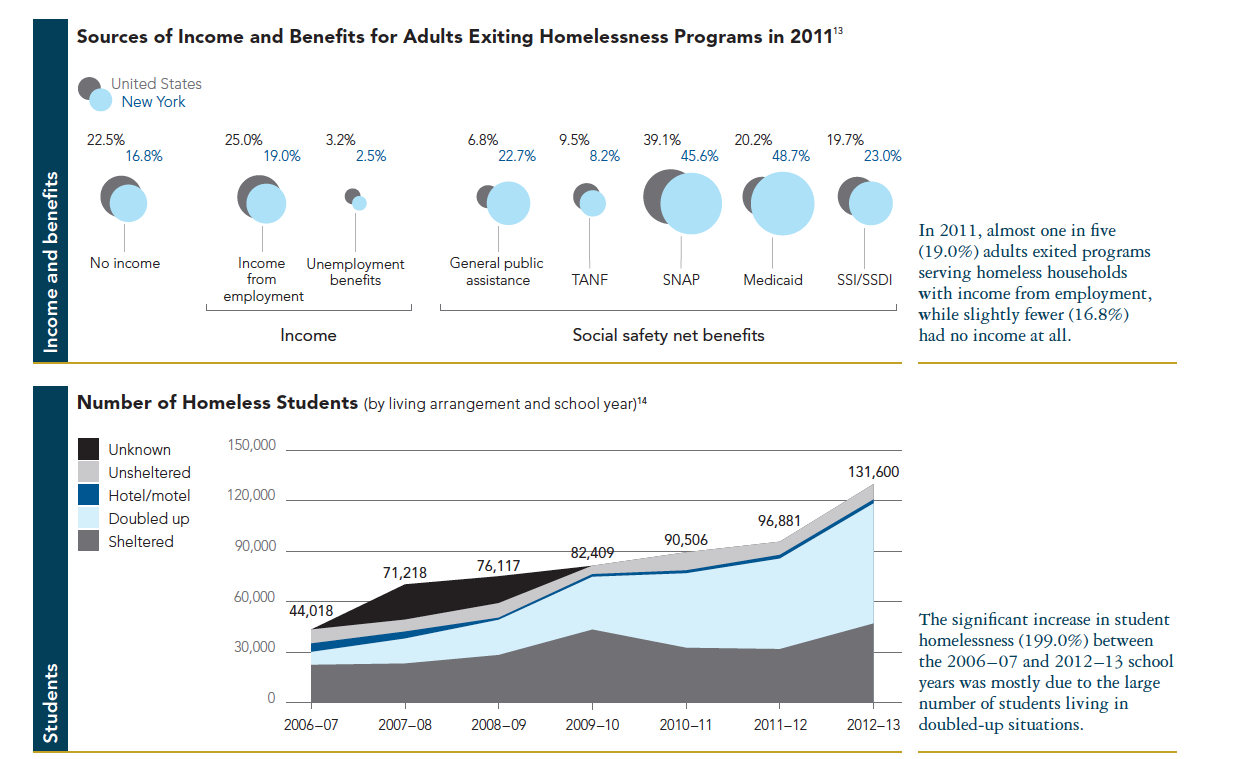
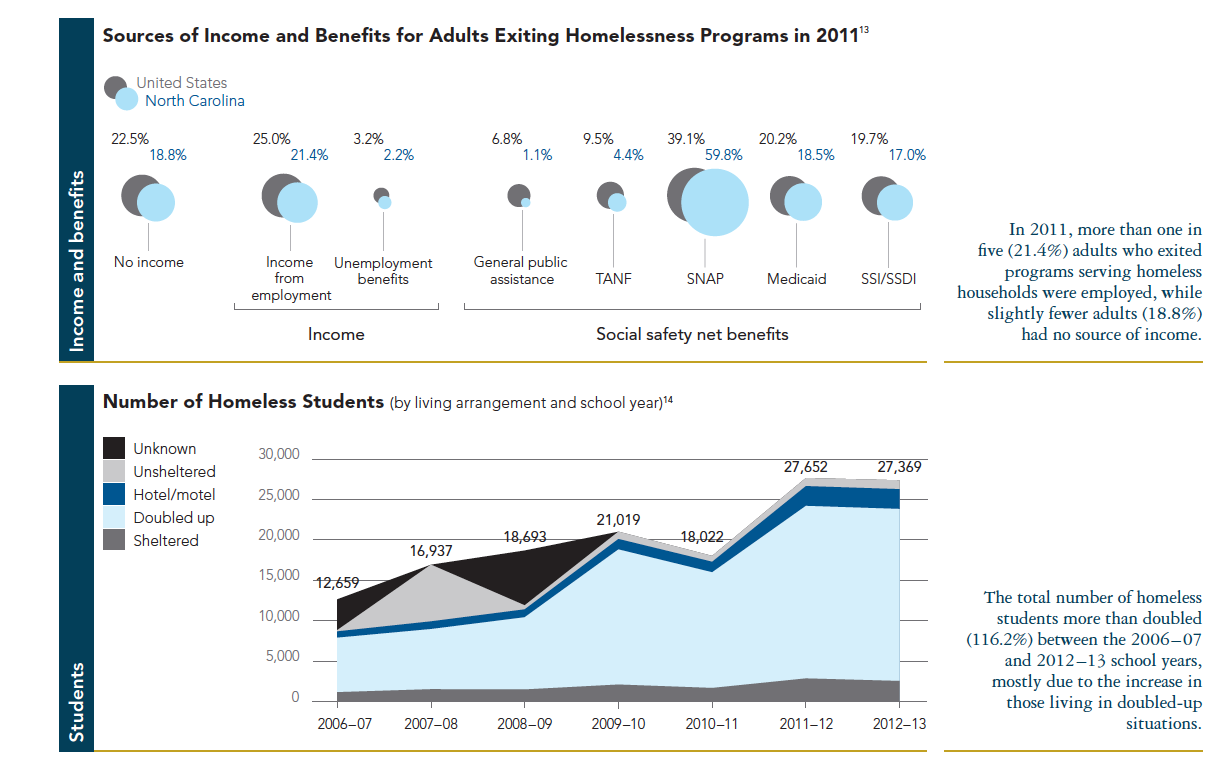
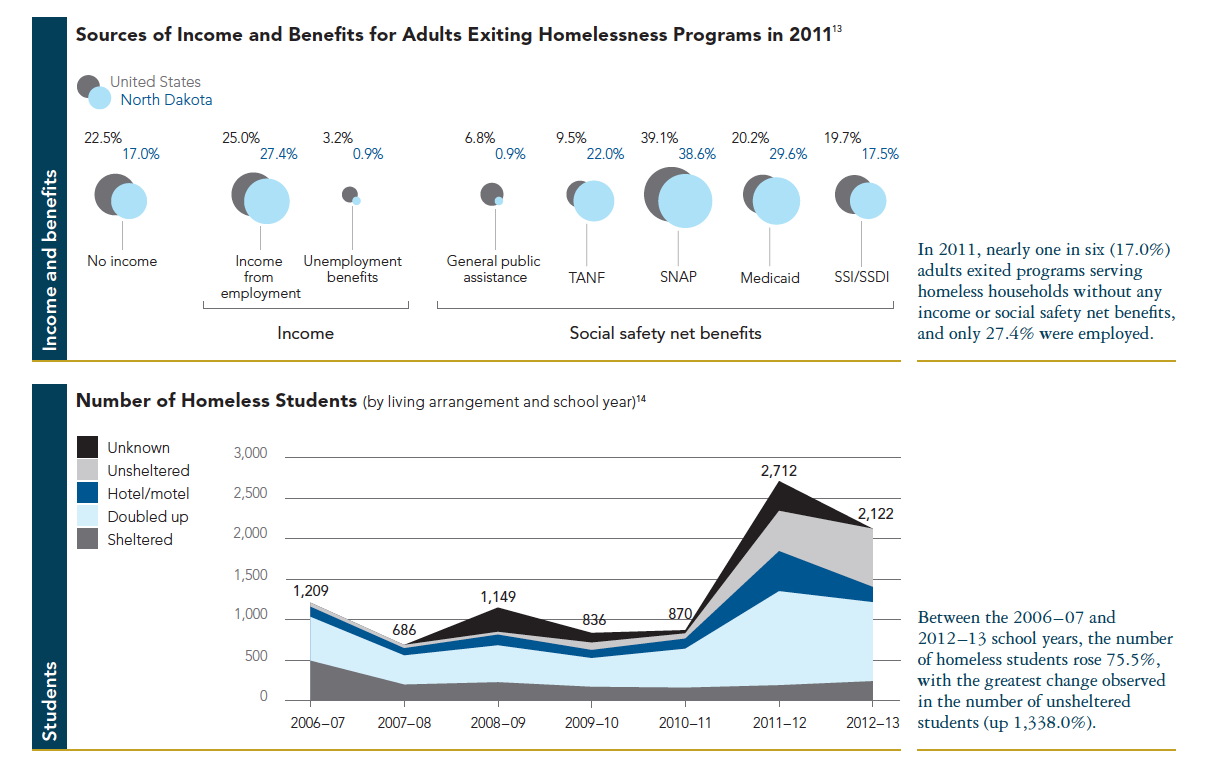
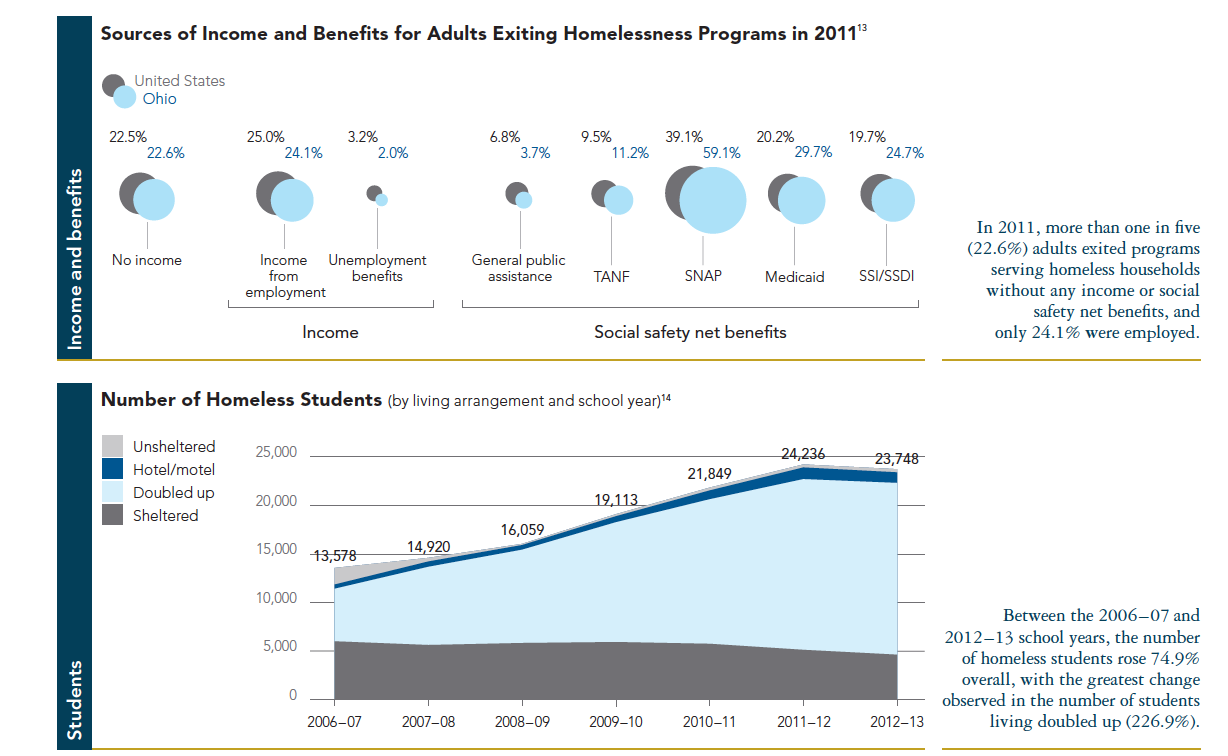
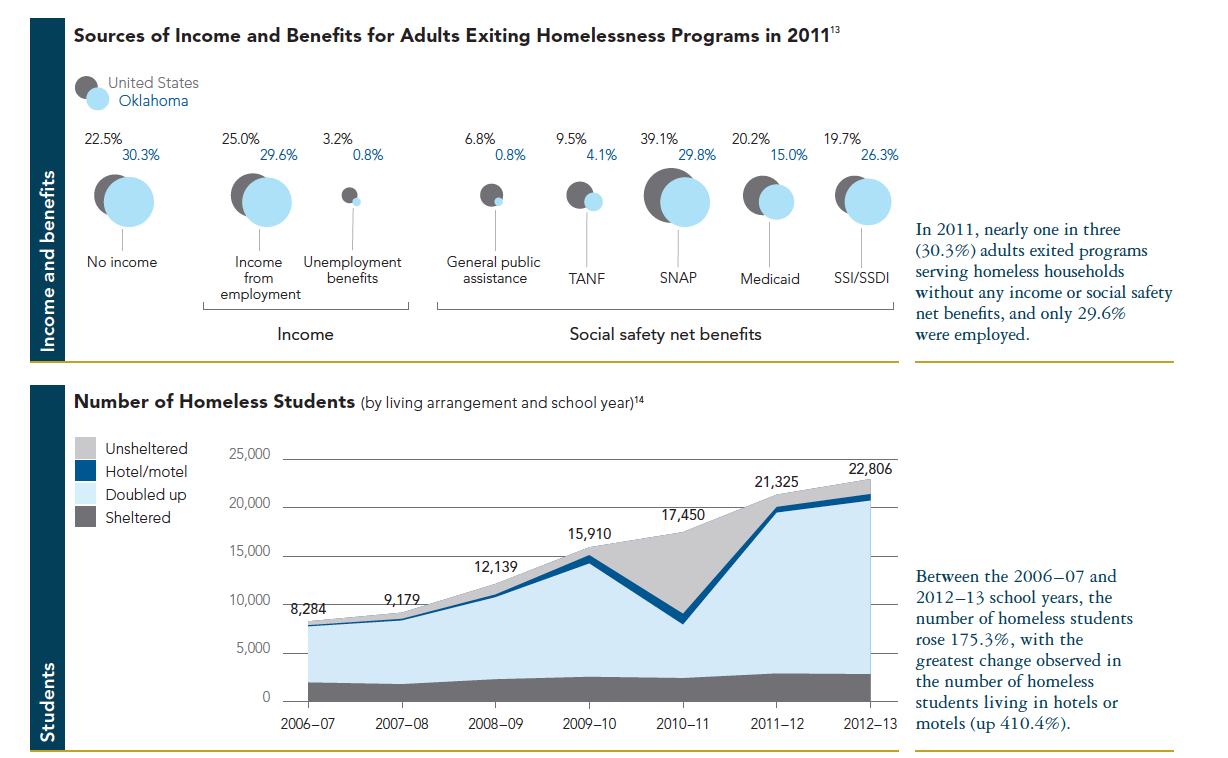
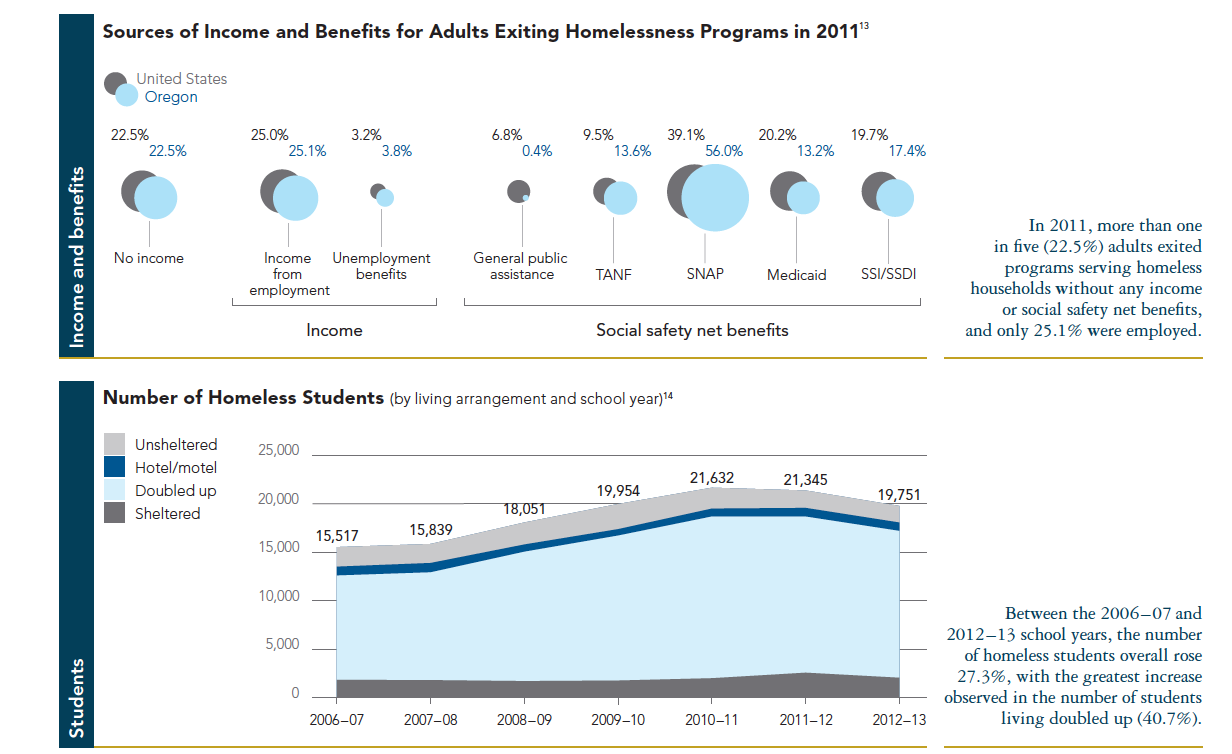
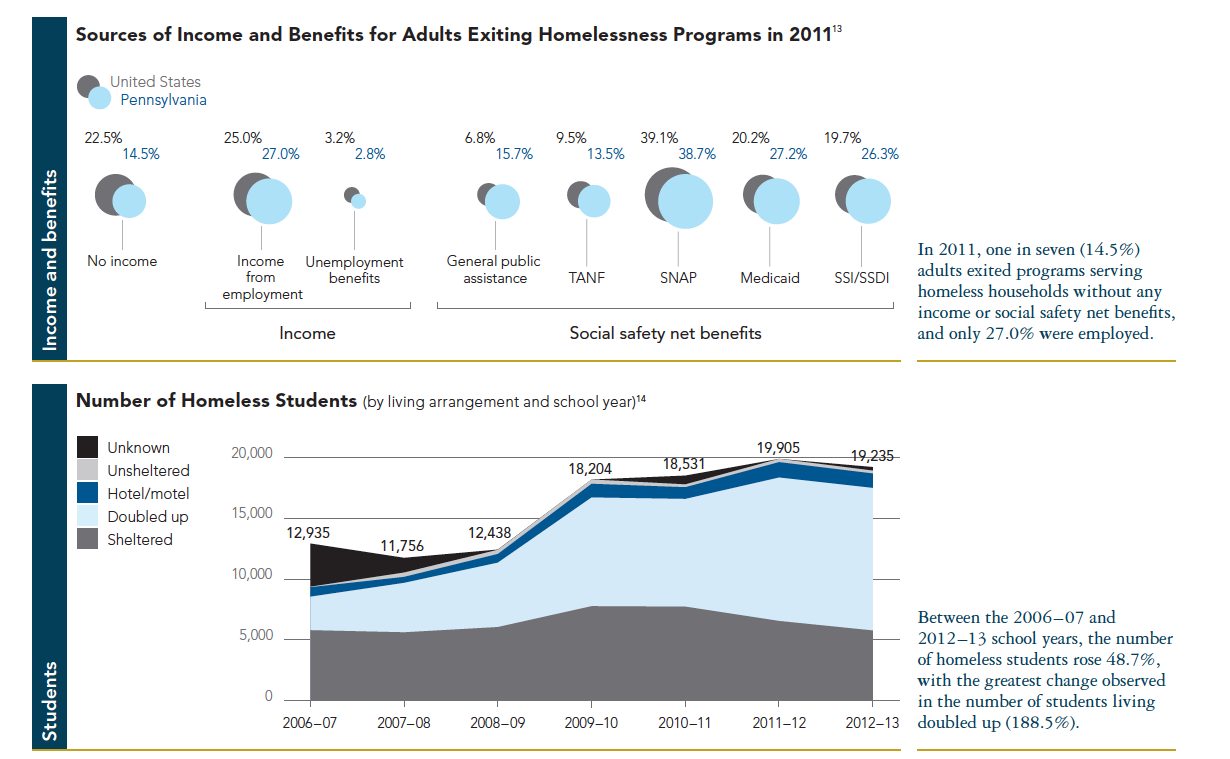
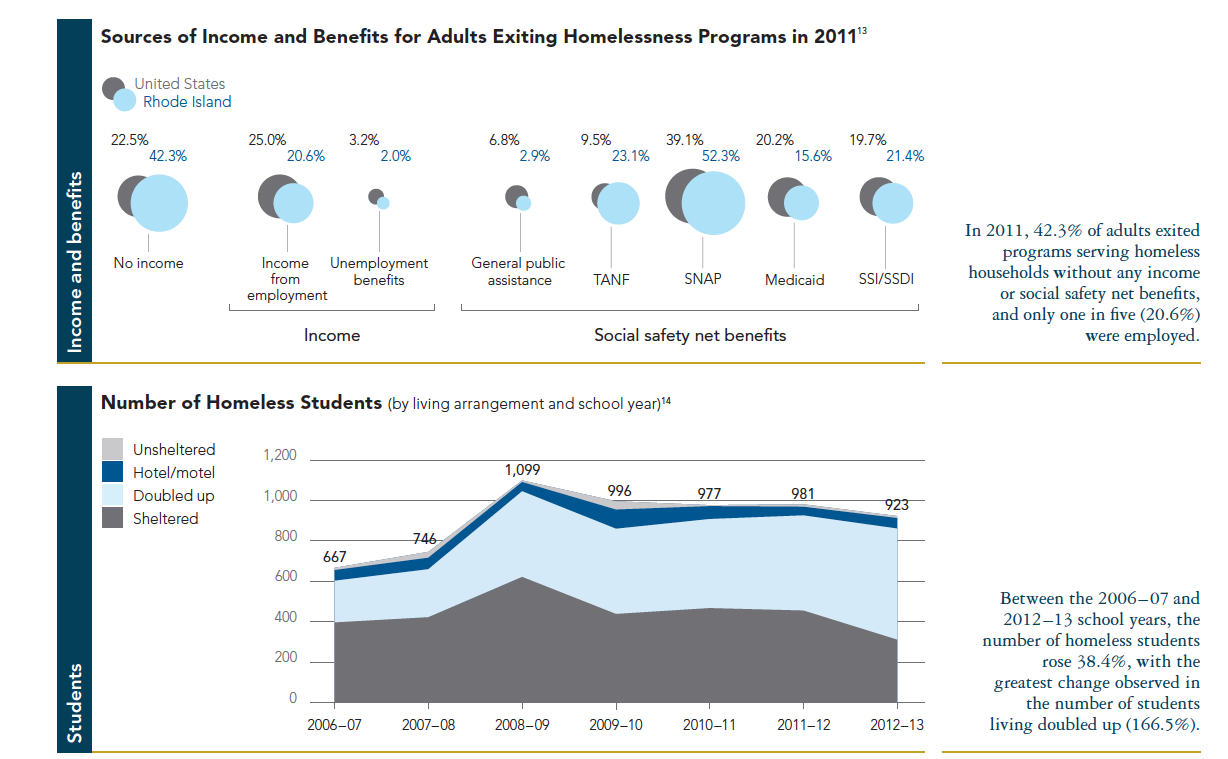
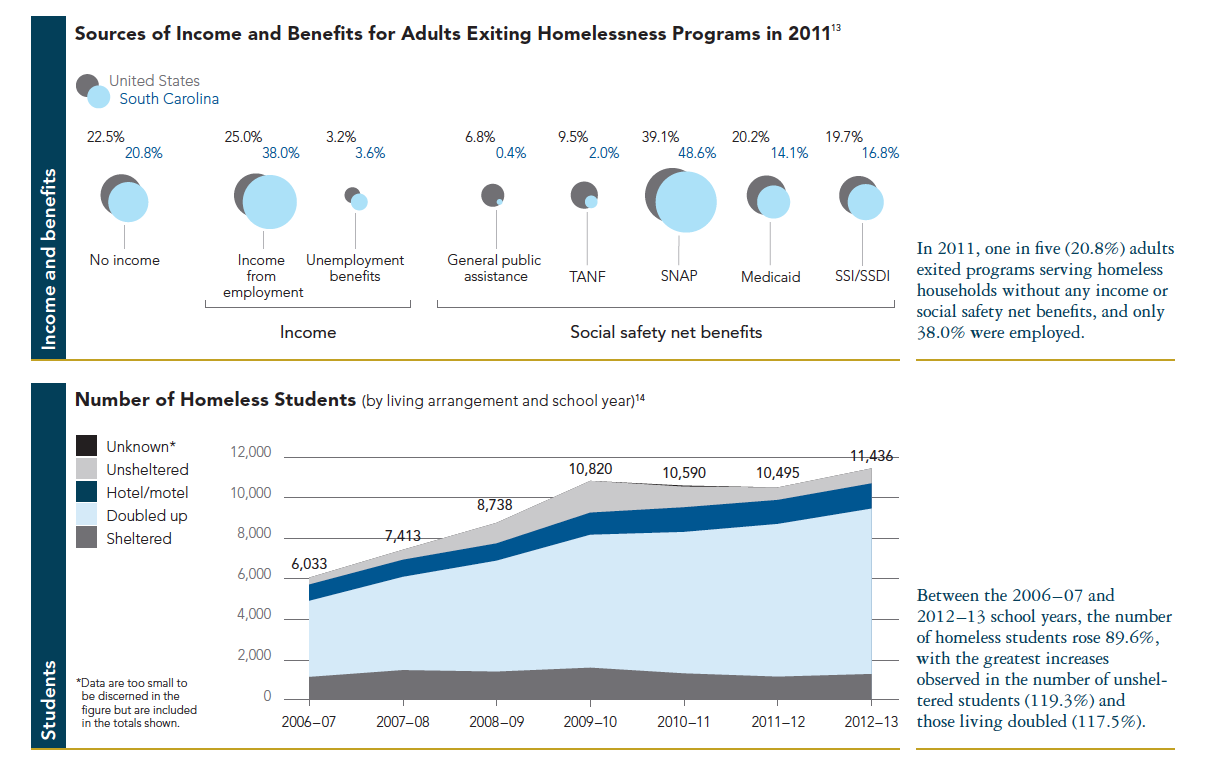
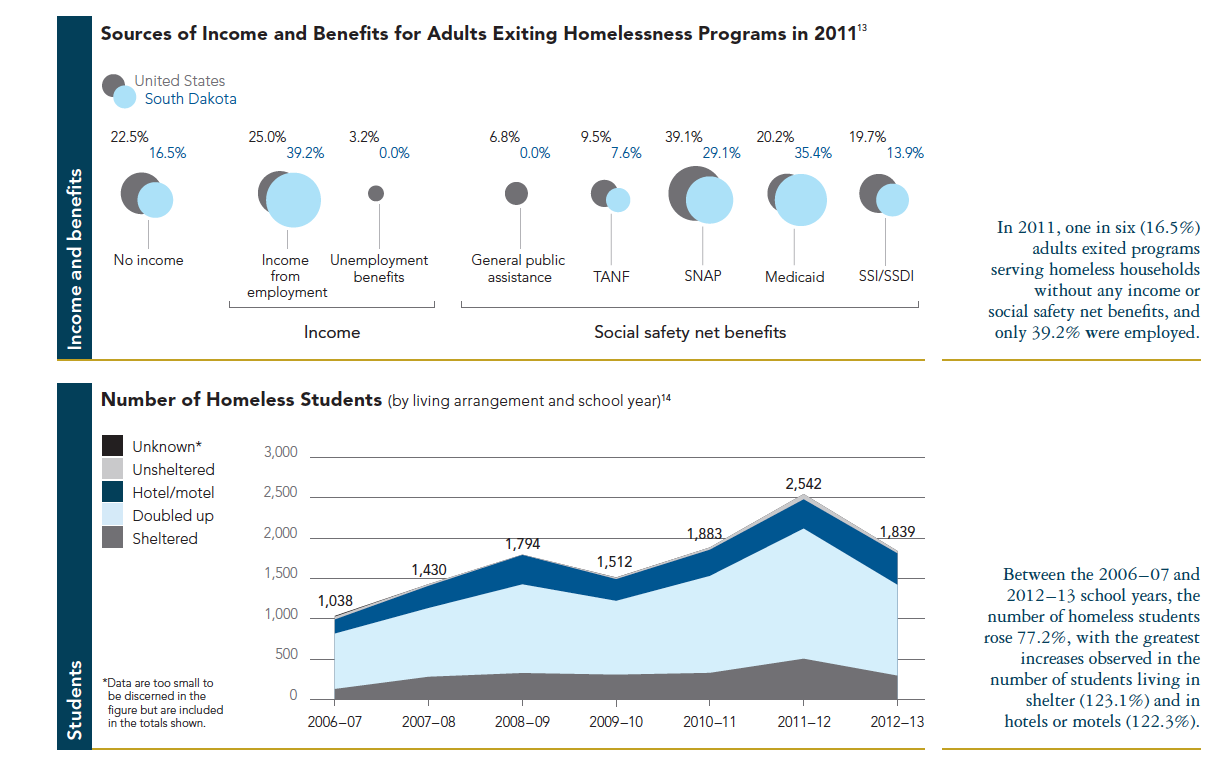
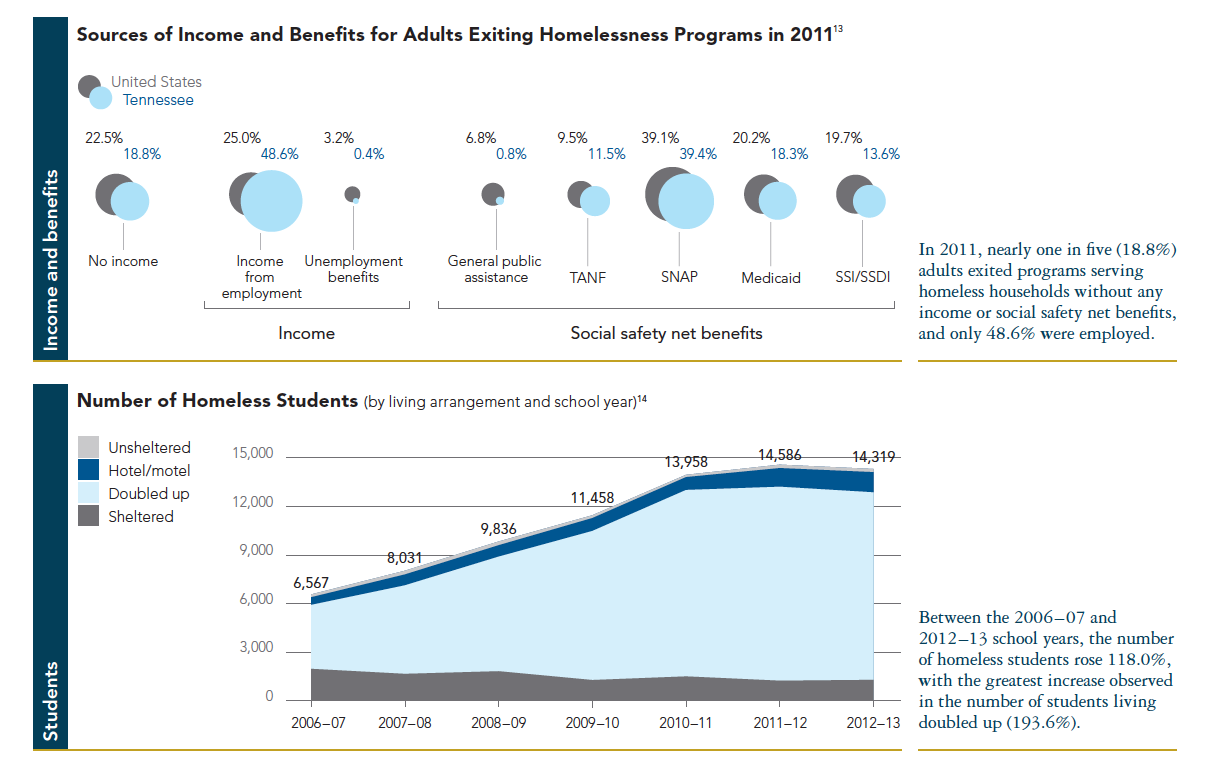
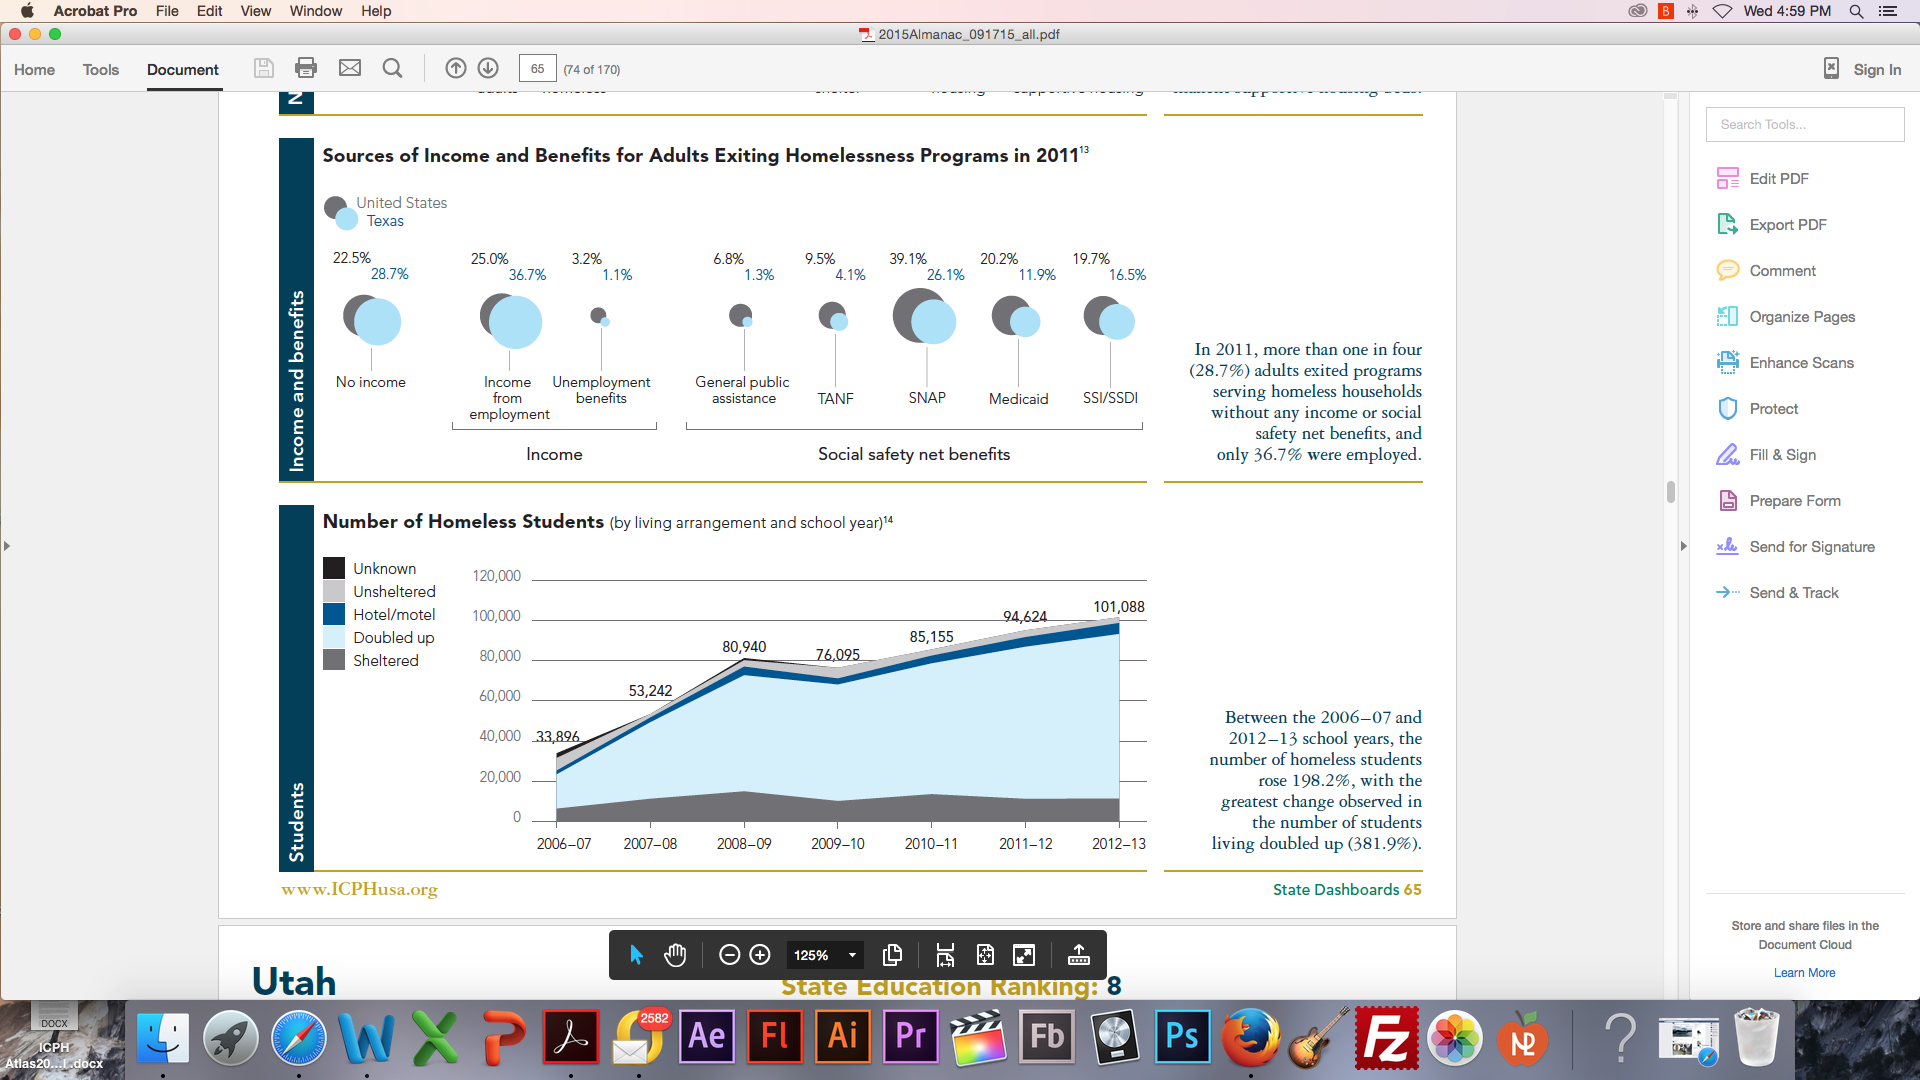
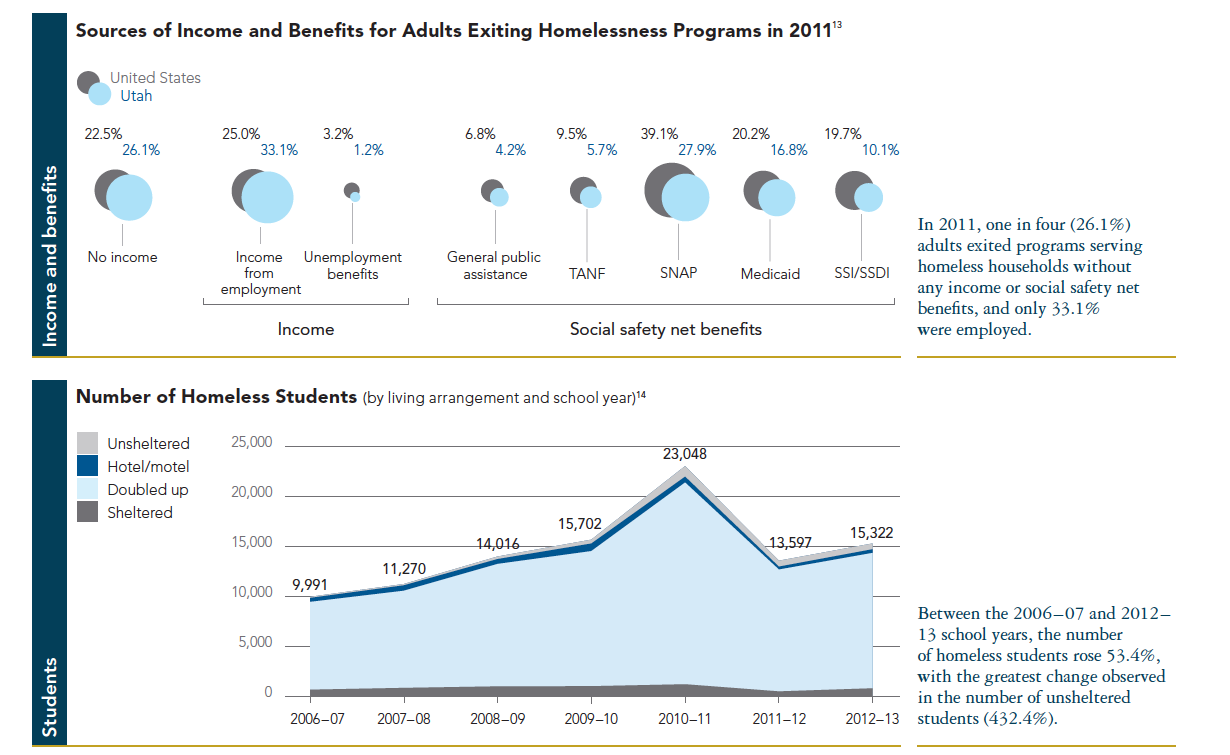
13 Data refers to all adults exiting the Supportive Housing Program (SHP) and Shelter Plus Care (S+C) in 2011. SHP funds transitional housing, permanent housing, safe havens, innovative supportive housing, supportive services only, and homeless management information systems. S+C includes tenant-, sponsor-, and project-based rental assistance and single room occupancy dwellings. Beginning in 2012, SHP, S+C, and the Section 8 Moderate Rehabilitation grants were consolidated into the Continuum of Care Program; U.S. Department of Housing and Urban Development, HUD’s 2011 Exhibit 1 Continuum of Care (CoC) Application.
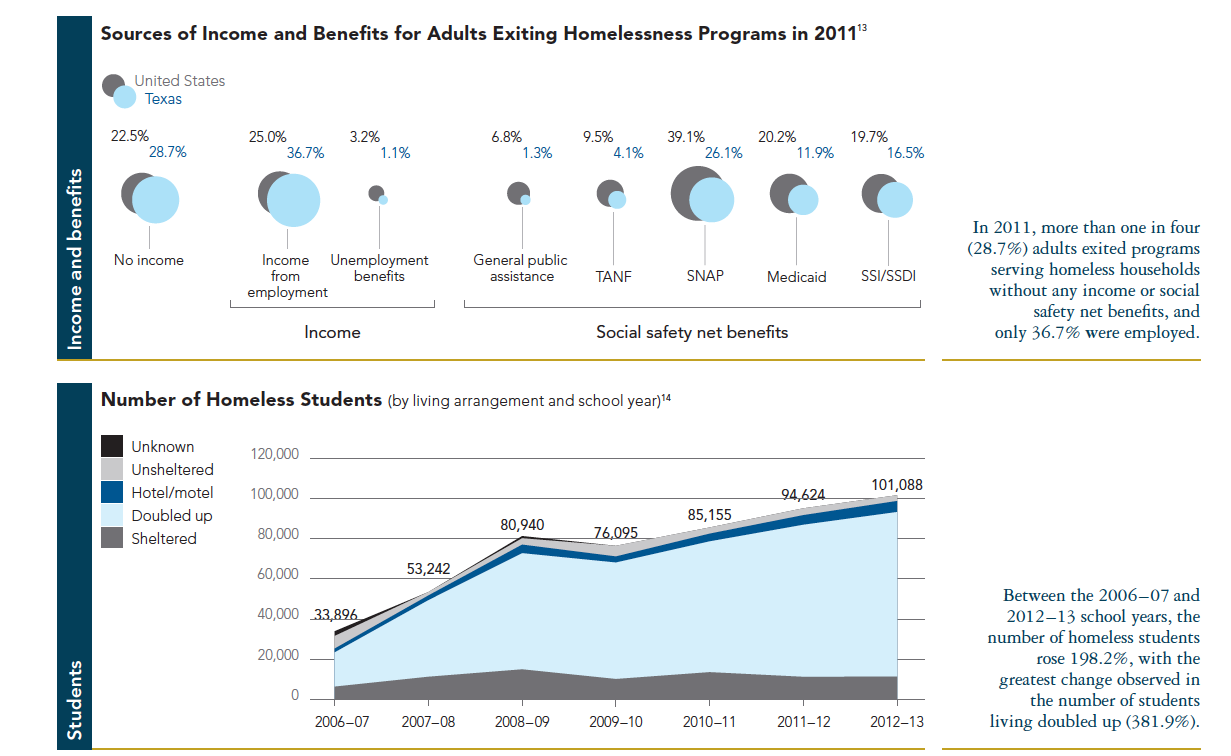
14 National Center for Homeless Education, Education for Homeless Children and Youth Program Data Collection Summary, 2010–13; U.S. Department of Education, “ED Data Express,” http://www.eddataexpress.ed.gov.
Ideas for Action at a Glance
Education for Homeless Children
- Prioritize access and increase outreach to expand the high-quality early learning opportunities available to young homeless children.
- Increase federal funding for the Education for Homeless Children and Youth program to better serve school-aged homeless children and strengthen policies that support homeless students through the Elementary and Secondary Education Act reauthorization.
- Pass legislation to reduce barriers to receiving financial aid and improve services for homeless students attending college.
For more information see Issues 4 and 6 and the State Family Homelessness Rankings.
Policies that Support Homeless Families
- Pass legislation to increase federal funding for the National Housing Trust Fund to expand the supply of affordable housing.
- Increase federal funding for child care assistance and implement homelessness-specific policies to facilitate families’ access across all states.
- Enact state laws to protect survivors of domestic and sexual violence from housing discrimination and increase federal funding for domestic violence shelters.
- Adopt state-level Supplemental Nutritional Assistance Program (SNAP) and Special Supplemental Nutrition Program for Women, Infants, and Children (WIC) policies that reduce homeless families’ risk for food insecurity.
For more information see Issues 2, 3, and 6 and the State Family Homelessness Rankings.
Research and Targeted Assistance - Collect and publicly release national data through the U.S. Department of Housing and Urban Development (HUD) that is necessary to prevent and reduce family homelessness.
- Expand HUD’s definition of homelessness to include families living doubled up to align with the definition used by other federal agencies.
- Dedicate federal funding exclusively for homeless children and their families, consistent with efforts for chronically homeless adults and veterans.
For more information see Issues 1, 2, 3, and 5 and the State Family Homelessness Rankings.
Ideas for Action
Federal- and State-level Policy Recommendations to Address Family Homelessness
The forces that drive families from their homes are multi-faceted and interdependent, ranging from factors like housing costs and low wages to domestic violence and poor health. Yet federal, state, and local policy choices matter to homeless families as well, often meaning the difference between families at risk of homelessness remaining in their homes or losing that stability. The Institute for Children, Poverty, and Homelessness’ (ICPH) policy recommendations outline a number of practical and cost-effective strategies to better meet the needs of homeless children and their parents.
ICPH’s policy priorities and recommendations cover three key areas of family homelessness: the education of children from birth to college; policies and supportive services related to housing, child care, domestic violence, and nutrition; and research and targeted assistance. The recommendations propose amendments to federal and state laws and regulations to account for the unique situations and challenges inherent in homelessness and in some cases identify cost-effective programs that should be funded at a higher level.
Education provides the best opportunity for homeless children to escape intergenerational poverty, but they also face unique educational challenges. Supportive services to assist families that are either homeless or at risk of homelessness are presently inconsistent, fragmented, and poorly resourced. Existing federal programs to assist low-income families, including the Child Care and Development Fund (CCDF) and the Supplemental Nutrition Assistance Program (SNAP), can play a role in lifting families out of homelessness, but lack of funding, restrictive eligibility requirements set at the state level, and other exclusionary policies prevent many homeless families from accessing them. Domestic and sexual violence is a major driver of family homelessness, and few resources have been devoted to assisting those who experience it. Data collected by federal and state agencies too often does not distinguish between homeless families and single adults, obstructing the development of targeted interventions.
The recommendations conclude with perhaps the most important policy change needed for homeless parents and their children: dedicated funding. Earmarking re-sources to serve veterans and chronically homeless adults has been associated with large reductions in these populations; homeless families deserve the same attention and fiscal support.
These recommendations address issues raised in the Almanac’s State Family Homelessness Rankings and provide fresh ideas for policymakers and stakeholders committed to preventing and ending family homelessness. The subsequent Issue by Issue section of the Almanac provides further detail on and context for each of the recommendations.
No set of policy recommendations can do justice to the complexity and urgency of family homelessness, but these recommendations, if implemented, can dramatically improve the lives of homeless children and their parents. Parents should not be forced to make impossible choices to meet their family’s basic needs, and children should not lose the potential for a bright future along with their street address. The collective focus and efforts of policymakers, service providers, and advocates can strengthen housing stability for the next generation of children and families.
Ideas for Action
Education for Homeless Children
Increase Homeless Children’s Access to High-quality Early Education
Children experiencing homelessness are at greater risk than housed children for developmental delays, which can have persistent, detrimental effects on their physical and mental health and chance for future success. High-quality early childhood education programs such as Early Head Start (EHS) and Head Start (HS) can help offset these risks; however, funding is insufficient to enroll all eligible children. In 2007, homeless students were made automatically eligible for EHS and HS programs and prioritized for enrollment.1 The proportion of children served by these programs who are homeless subsequently increased from 2.5% in program year 2006 – 07 to 4.5% in 2013–14 (Figure 1).2 This success can and should be replicated in pre-kindergarten (pre-K) programs.
- Prioritize homeless children’s enrollment in state and local early education programs.
- Train early education providers to identify and serve homeless families.
Until affordable pre-K is universally available, policymakers should incorporate homelessness into programs’ eligibility criteria. Among the state pre-K programs that weigh risk factors in determining children’s eligibility, for example, 22 of 29 include homelessness or unstable housing as a risk factor (Figure 2). To improve outreach and awareness, state pre-K programs should also support training for pre-K providers; 38% of surveyed school district pre-K providers indicated that they were either not familiar at all or only somewhat familiar with programs and laws that address the well-being of young children experiencing homelessness.
Congress has the power to require early education programs to address homeless children’s barriers to enrollment, conduct outreach to homeless families, and provide professional development on serving homeless children in order to receive funding and to require states to give preference in awarding subgrants to early childhood programs with a plan to increase access to homeless children. Federal legislation that would mandate these actions is currently pending, and they could be carried out at the state level as well.3
For more information on Head Start, see Issue 6: Mainstream Social Safety Net Programs. To learn more about child development in the context of homelessness, see Issue 4: Educating Homeless Children. The percent of children in EHS and HS who are homeless and homeless children as a percentage of poor children in pre-K are also included in the State Family Homelessness Rankings.
Increase Funding and Strengthen Provisions to Support Homeless Students in Grades K–12
Funding levels for the Education for Homeless Children and Youth (EHCY) program, the primary source of assistance for homeless students in elementary and secondary school, have not kept up with inflation or demand. Although the McKinney-Vento Homeless Education Assistance Improvements Act (McKinney-Vento) seeks to ensure that homeless students receive an education equal to that of their housed peers, flat funding levels for McKinney-Vento’s EHCY program have obstructed that goal.
- Increase federal EHCY funding so that more local educational agencies (LEAs) receive the resources needed to serve homeless students in grades K–12.
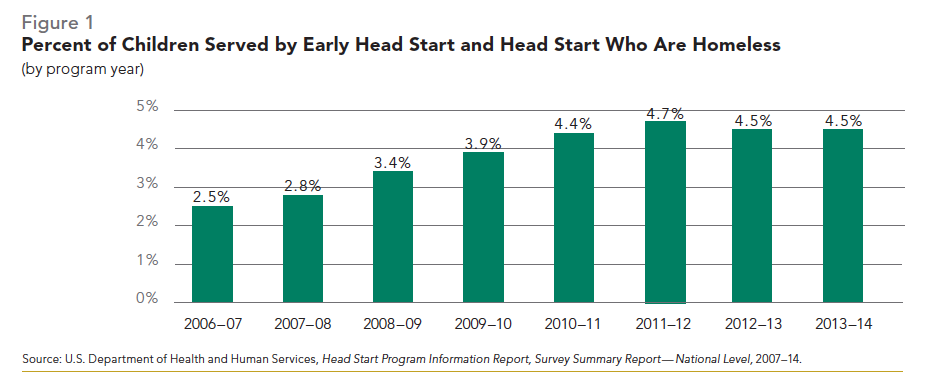
Congress should amend McKinney-Vento to make federal elementary and secondary education policy more effective for homeless students. Specifically, EHCY funding should be substantially increased. While EHCY funding has remained flat at approximately $65 million since Fiscal Year 2009 (FY09), the number of homeless students has increased, rising more than 85% from 2006 to more than 1.2 million during the 2012–13 school year. Per-pupil EHCY expenditures fell by half, to $51.82 over the same time period. In School Year 2012–13, more than one-third of all students nationwide (35.8%) were enrolled in school districts that did not receive federal EHCY assistance.4
- Enhance key provisions of McKinney-Vento during the reauthorization of the federal Elementary and Secondary Education Act (ESEA).
The reauthorization of ESEA provides a prime opportunity for Congress to raise EHCY’s authorized funding level. Legislation to reauthorize ESEA, as the Senate proposal does, requires state education agencies to monitor and offer technical assistance to all LEAs, equip homeless liaisons with the time and training to complete their duties, track the academic outcomes of homeless students, develop policies to remove homeless students’ barriers to enrollment, provide homeless students access to all academic and extracurricular programs available to housed students, and improve access to public pre-K programs.5
For more information on how McKinney-Vento helps homeless students, see Issue 4: Educating Homeless Children. Homeless children as a percentage of extremely poor children in grades K–12 is also included in the State Family Homelessness Rankings.
Help Homeless Youth Apply for Financial Aid and Attend College
Unlike ESEA, the Higher Education Act lacks even the most basic protections to assist college students who are homeless. It should be amended or new legislation should be passed to help homeless students unaccompanied by a parent or guardian apply for financial aid and create a more supportive environment for all students on campus experiencing homelessness.
- Enact federal legislation to reduce barriers for unaccompanied homeless youth to receive federal financial aid for college.
Fewer than half (47.3%) of students who identify as unaccompanied homeless youth on the Free Application for Federal Student Aid (FAFSA) receive the verification necessary to apply for federal aid independently, which enables them to omit their parents’ financial information. The Higher Education Access and Success for Homeless and Foster Youth Act, introduced in November 2013, would improve outreach to applicants and reduce barriers for unaccompanied homeless youth to receive financial aid by simplifying the homeless determination process.6
- Establish a single point of contact (SPOC) on each college campus to coordinate services for all students experiencing homelessness.
Congress and states can assist homeless youth by enacting legislation requiring colleges and universities to designate a SPOC to help all homeless students attend and complete college, serving a role at the college level similar to that of McKinney-Vento homeless liaisons for grades K–12. Among other duties, SPOCs would coordinate access to housing during semester breaks and between academic terms.7
For more information on the share of homeless FAFSA applicants assisted by an educational liaison, shelter, or runaway and homeless youth program, see the State Family Homelessness Rankings.
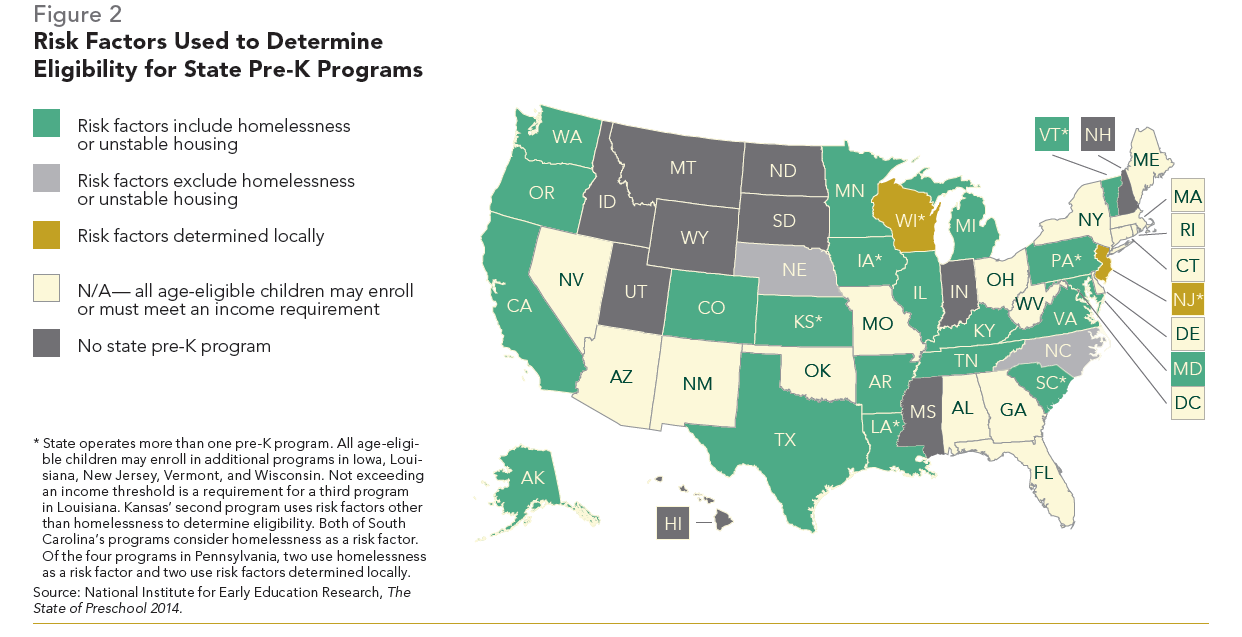
Ideas for Action
Policies that Support Homeless Families
Increase Funding for Low-income Housing
Three-quarters of all extremely low-income families— households earning 30% or less of their local area’s median income—spend more than half of their income on housing, leaving few resources for other basic needs such as food and transportation and putting them at risk of becoming homeless. For every 100 extremely low-income households, only 31 affordable rental units are available nationwide. The National Housing Trust Fund (NHTF), created in 2008 to distribute funding to states to build and preserve the supply of affordable housing units, will finally provide its first funding allocation in 2016, but the funding may amount to as little as $120 million that year. A more substantial and permanent funding source is needed to overcome the affordable housing gap for extremely low-income renters of 7.1 million units.8 A key priority should be to make low-income housing affordable to the extremely low-income families at risk of homelessness.
- Pass federal legislation to provide an adequate source of funding for the NHTF, which would help prevent families from becoming homeless due to a lack of affordable housing.
Currently pending legislation supported by two bipartisan deficit-reduction commissions would convert the federal mortgage interest deduction into a tax credit, generating $232 billion in revenue over the subsequent decade— 60% of which would go to the NHTF. Of that funding, 75% would be dedicated to the housing needs of extremely low-income households. Some of the bill’s savings would be directed to Section 8 rental assistance programs, which also target these households.9
Prioritize Homeless Families for Child Care Subsidies
The Child Care and Development Fund (CCDF) provides subsidies to low-income families to pay for child care, which is critical if homeless parents are to be able to look for housing, work, and the services they need to regain stability. However, funding is not sufficient to meet demand and many legislative and regulatory barriers prevent homeless parents from utilizing CCDF. Most states do not yet have policies to promote homeless families’ access to child care.
- Prioritize homeless families’ access to subsidized child care.
- Waive child care copayments for homeless families.
- Offer higher reimbursement rates to providers who serve homeless children.
- Include housing search as an allowable activity for receiving care.
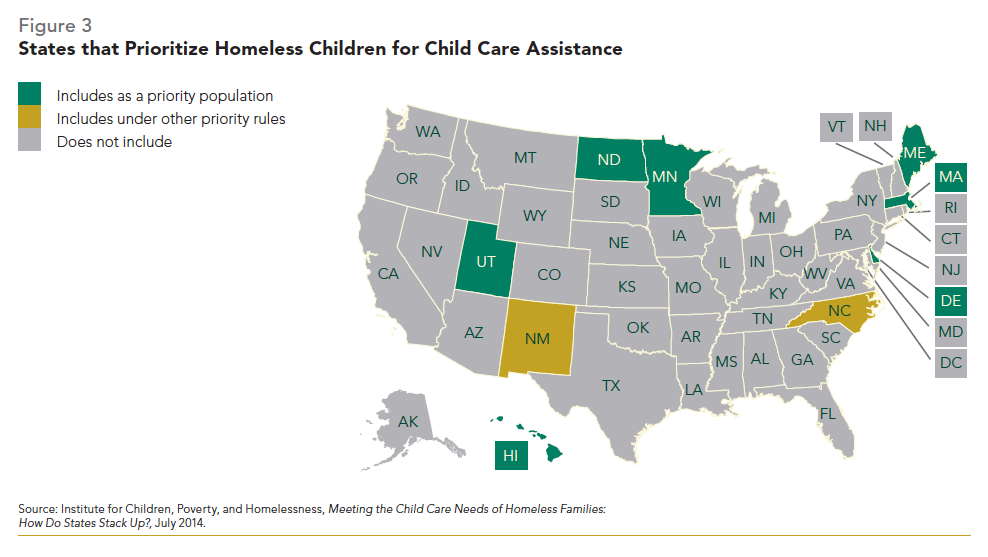
Including homeless children as a priority population for subsidized child care is a major opportunity at the state level, since only nine states currently do so (Figure 3). States can also increase the likelihood that homeless families will be able to get and maintain subsidized care by waiving co-payments and offering higher reimbursement rates to child care providers who serve homeless children; only 30 and 11 states, respectively, have instituted these policies. Since parents must be engaged in a work-related activity to receive child care subsidies, states should act by joining the seven states that already include housing search as an eligible activity. The Child Care and Development Block Grant (CCDBG) Act of 2014, which reauthorized CCDF, addressed some specific barriers, including restrictive immunization and documentation requirements. Yet states can do much more to ensure homeless parents have access to high-quality, affordable child care.10
- Increase federal funding for CCDF to provide more eligible homeless families the care they need to help them work toward self-sufficiency.
Only one in six children eligible for child care subsidies receives one, making the limited funding for subsidies a significant barrier to accessing child care.11 The CCDBG Act authorized only a 16.5% increase in CCDF funding for the program between FY15 and FY20.
For more information about the impact of child care on family stability and the unique barriers homeless parents face in accessing child care, see Issue 2: Macroeconomic Causes of Family Homelessness. State CCDF policies are also included as part of the State Family Homelessness Rankings.
Strengthen Housing Protections for Survivors of Domestic Violence
Domestic violence is one of the leading causes of family homelessness, disproportionately affecting women between the ages of 18–34. Women are less likely to report their abuse when they fear eviction.12 The Violence Against Women Act (VAWA) provides legal protection against the eviction and discrimination of survivors who live in certain federal housing programs, including those funded under McKinney-Vento.13 VAWA does not, however, extend to residents in private housing, and state laws vary considerably in providing protection to victims in these living situations. In addition, domestic violence shelters help survivors escape their abusers and begin to rebuild their lives, but they need more resources to meet the growing need.
- Enact state laws to protect survivors of domestic violence from housing discrimination and homelessness.
States can protect domestic violence survivors from housing discrimination without incurring new budget obligations. The National Law Center on Homelessness and Poverty has identified 16 state-level housing protections, such as allowing early lease termination, lock changes, and relocation assistance. Yet states have on average between three and four, providing ample opportunity for expansion in most states. Wisconsin has the most with 12 laws, while Michigan, Tennessee, and West Virginia have none (Figure 4). Gaps in protective measures put those who have experienced domestic violence at risk of additional abuse or homelessness.14
- Increase federal and local funding for domestic violence services to meet the unmet need for safe housing.
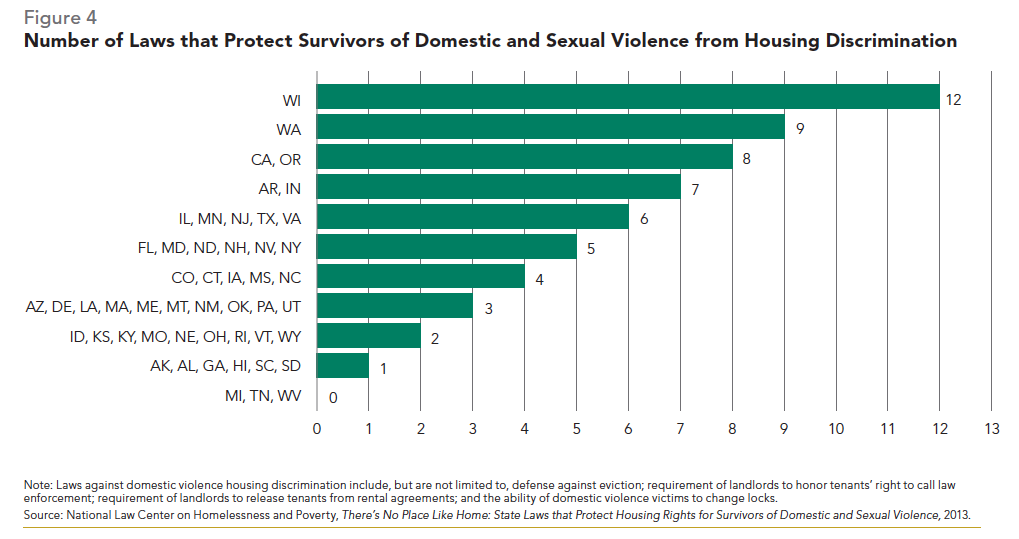
Domestic violence services assist survivors in transitioning to safe and affordable housing. Yet on a single day in 2013, 9,641 requests for domestic violence services nationwide went unmet, 60% of which were for housing. Without help, women live in unstable or dangerous living conditions; 60% of programs reported that those who are denied shelter return to their abusers, and one-quarter (27%) of programs indicated that their clients become homeless. Rhode Island had the highest share of clients who were turned away from shelter (64.8% [Figure 5]). Due to budget restrictions in 2013, 187 programs across the country reduced or eliminated their emergency shelter services while 1,696 staff positions were cut, the majority of whom were advocates for survivors.15
For more information on the implications of domestic violence for housing stability and child and family well-being, see Issue 3: Effects of Homelessness on Families and Children. State laws to protect survivors of domestic violence from housing discrimination are also incorporated in the State Family Homelessness Rankings.
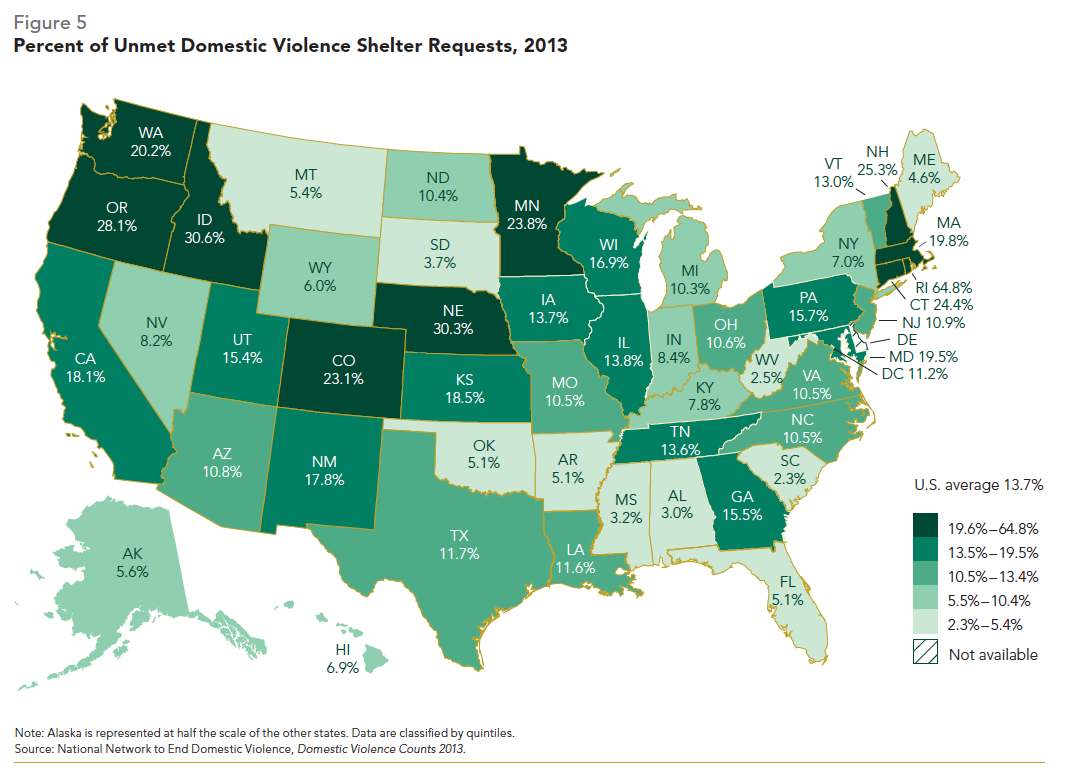
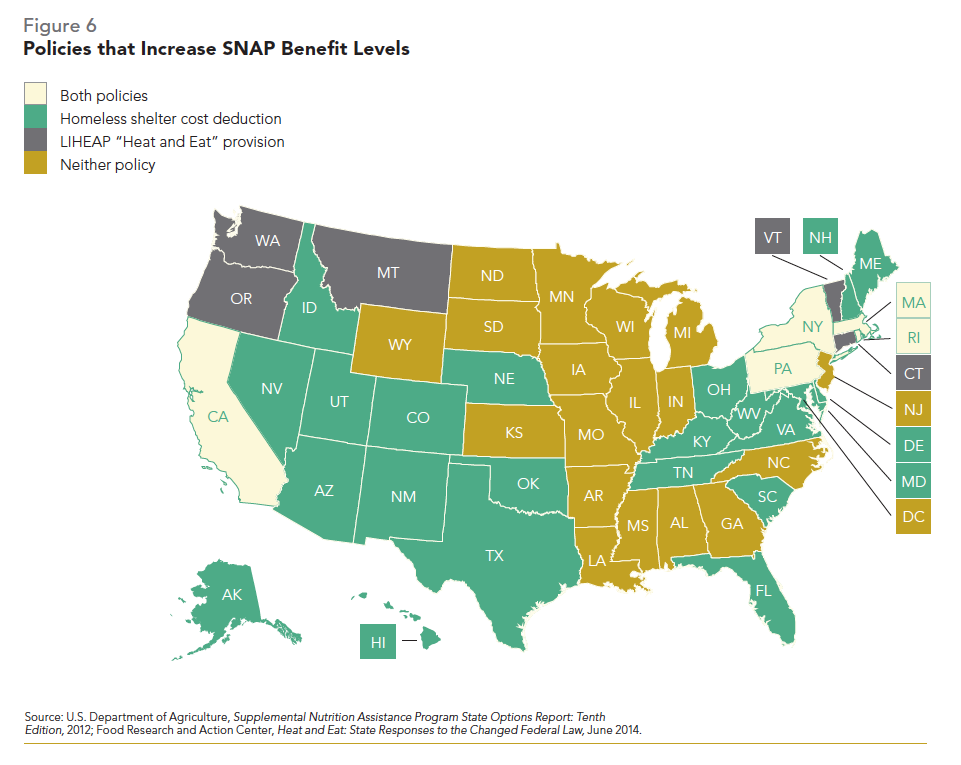
Reduce Food Insecurity Among Homeless Families
SNAP and the Special Supplemental Nutrition Program for Women, Infants, and Children (WIC) decrease both food insecurity and housing instability for pregnant mothers and families with children who are homeless or at risk of becoming homeless.16 Most states have considerable room to improve food insecurity policies to increase homeless families’ access to SNAP and WIC. States have flexibility in implementing these programs, including two policy options that increase SNAP benefit levels for those with the greatest need and a third option that provides special WIC food packaging for homeless families.
- States should allow for the homeless shelter deduction in the SNAP application.
Only 27 states currently offer the standard shelter cost deduction when applying for SNAP, and within those states it is often underutilized (Figure 6). Since SNAP benefit levels are based on income, the deduction increases benefits for homeless families by allowing them to reduce their reported net monthly income by $143 if they have shelter-related expenses. Families do not need to document costs to use the deduction, a policy that reduces administrative burden and assists homeless families who may have difficulty providing documentation.17
- States should adopt the “Heat and Eat” provision to increase SNAP benefit levels for families at risk of becoming homeless.
As of June 2014, only ten states and the District of Columbia had committed to provide the “Heat and Eat” provision, which increases household SNAP benefit levels through a Standard Utility Allowance when reporting income in the SNAP application. To qualify, households must receive a minimal amount of energy cost assistance through the Low Income Home Energy Assistance Program (LIHEAP). The Agricultural Act of 2014 (the 2014 Farm Bill) increased the minimum amount of LIHEAP assistance needed to qualify for the allowance from $1 to $20 per year.18
- States should distribute special WIC food packages for homeless families who lack access to sanitary water, cooking facilities, refrigeration, and sufficient food storage.
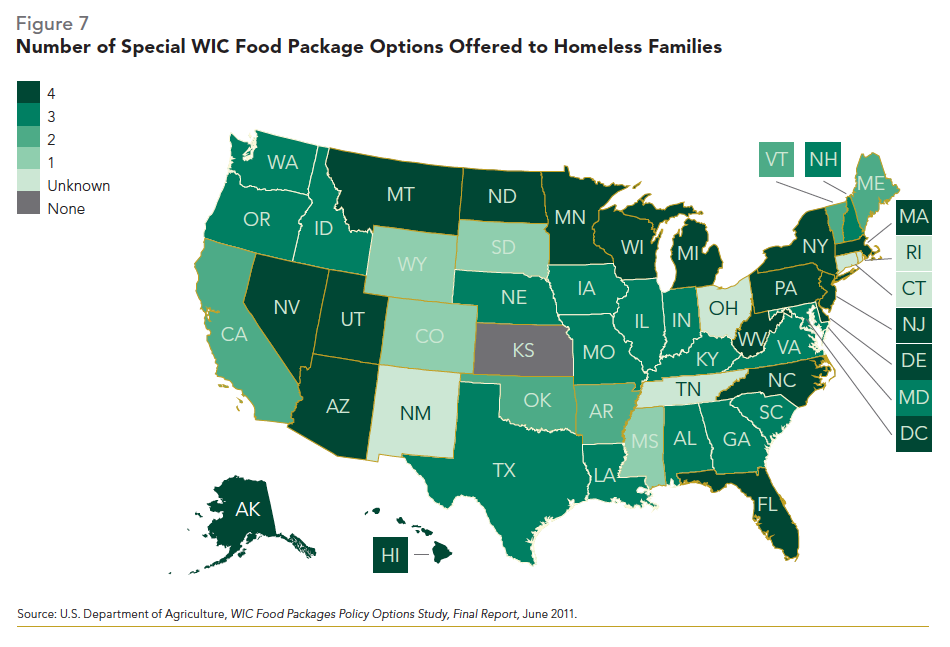
Only 18 states and the District of Columbia account for all four unique needs (Figure 7). Most states account for at least some of these situations, while Kansas is the only state that does not provide any special packaging for homeless families. WIC provides specific packages of foods to families based on the child’s age. Families experiencing homelessness may not have access to a refrigerator to store perishable foods or to a kitchen with sanitary water to prepare and cook them. WIC allows homeless families living in these situations to receive foods that they can store and prepare.19
For more information on the relationship between and impact of food insecurity on homelessness, see Issue 3: Effects of Homelessness on Families and Children. For more information on SNAP and WIC, including what is currently known about homeless family participation rates, see Issue 6: Mainstream Social Safety Net Programs. The three state-level policies are included as part of the State Family Homelessness Rankings.
Ideas for Action
Research and Targeted Assistance
Addressing Accountability: Requests for Federal Data Collection
The U.S. Department of Housing and Urban Development (HUD) and other federal agencies have long recognized that collecting and analyzing the right data is essential to developing effective homelessness-reduction strategies. In the pursuit of ending veteran and chronic homelessness by 2015, HUD released detailed data specific to those populations. Pairing this effort with dedicated funding, HUD is on track to end homelessness for these two groups. When HUD has collected and released data on homeless families, on the other hand, it has often been combined with data on individuals.
- Distinguish adults with custodial children from single adults for existing national homelessness data sources.
HUD asks Continua of Care around the country to provide information on the number of adults who access mainstream benefits, including Medicaid, SNAP, Temporary Assistance for Needy Families, and WIC but does not distinguish single adults from heads of family households.20 Making this distinction is a critical step toward connecting homeless families with the larger system of social safety net benefits. Without knowing the share of homeless families receiving a particular benefit, it is impossible to know if communities are maximizing available resources to resolve a family’s homelessness. HUD should mandate the collection and disclosure of such data so that technical assistance can be targeted to underperforming communities.
- Collect national data necessary to address family homelessness, such as reasons for becoming homeless and the frequency and duration of homeless episodes.
Federal policies have placed an emphasis on housing as a solution for homelessness, but the underlying causes of homelessness are too complex and multifaceted to be solved by housing alone. The U.S. Conference of Mayors’ annual Hunger and Homelessness survey is the only source of regularly collected data examining why families and individuals become homeless. However, the data in the report are based on city officials’ perceptions and only represent a handful of cities.21 HUD already collects data through Homeless Management Information Systems (HMIS) on living situations prior to a family entering shelter but not on the reasons why they have sought shelter.22 Through HMIS, shelter staff should track reasons why families become homeless, such as whether they experienced an eviction, lost a housing subsidy or public benefits, lost employment due to domestic violence, or experienced physical or emotional health problems within a certain timeframe. In addition to the reasons why families enter shelter, HMIS should also report the number of families who return to shelter by the type of housing intervention they received and the length of time that they were out of the homelessness system.
In addition, data collection for homeless families should respond to changing policy environments. For example, during the recent foreclosure crisis, it would have required minimal effort to add a question to HMIS about foreclosures, but few researchers or localities collected this information. Despite a few limited studies, the extent to which the crisis contributed to the rise in family homelessness is unknown.23 HUD should require that HMIS be more adaptable so that questions can be added quickly. This would enable researchers, governments, and homelessness advocates to evaluate issues as they arise and develop appropriate policy responses.
For more information on the reasons why families become homeless, see Issue 2: Macroeconomic Causes of Family Homelessness. To learn more regarding the challenges that homeless parents and their children face, see Issue 3: Effects of Homelessness on Families and Children.
Align Federal Definitions of Homelessness
With the exception of HUD, all other federal agencies consider any child or youth who lacks a fixed, regular, and adequate nighttime residence to be homeless. As dictated by the Homeless Emergency Assistance and Rapid Transition to Housing Act of 2009, HUD may only consider families living in shelters, places not meant for human habitation, or hotels/motels paid for by a governmental or charitable organization, as well as those losing their housing within 14 days to be homeless. The differing definitions lead to drastically different estimates of the homeless population. Notably, three-quarters (75.5%) of the 1.25 million homeless students identified during the 2012–13 school year would not be considered homeless based on HUD’s definition.24
- Broaden HUD’s definition of homelessness to align with the more inclusive definition used by all other relevant federal statutes.
The Homeless Children and Youth Act, introduced in both chambers of Congress with bipartisan support, would align the federal definitions of homelessness, thereby enabling much more effective planning and allocation of resources to support homeless families. The bill also allows communities to target HUD resources according to their prevailing needs, which can include serving homeless families with children.25
For more information on the conflicting federal definitions of homelessness, see Issue 1: Definitions, Demographics, and Trends in Student and Family Homelessness.
Dedicate Funding for Homeless Families
The increased focus on and earmarked funding for programs exclusively serving chronically homeless individuals has coincided with a 30.0% decrease in the population from 2007 to 2014. Mirroring the federal push to eliminate chronic homelessness, funding for homeless veterans tripled from $0.5 billion in FY09 to $1.5 billion in FY13 (Figure 8 and Table 1). With the implementation of new targeted programs and services, the number of homeless veterans decreased by one-third (32.6%) between 2009 and 2014. Homeless parents and their children have not received the same level of fiscal support, and homelessness among families accessing shelters increased slightly (2.5%) from 2009 to 2014.26
- Dedicate federal funding and prioritize resources for homeless families with children as has been done for chronically homeless adults and veterans.
Little federal funding is currently dedicated to programs exclusively serving homeless children and their families. The only long-term federal program that singularly assists homeless families is the McKinney-Vento Act’s Education for Homeless Children and Youth (EHCY) program, which addresses the educational needs of homeless students. EHCY allocations remained stagnant at $62– 65 million between FY05 and FY13 and represented only 1.5% of all targeted homelessness assistance across seven federal agencies in FY13.27 Federal policymakers should consider the accomplishments of targeted programs and support a similar surge in funding for homeless families.
For more information about the increase in homeless families since 2007, see Issue 1: Definitions, Demographics, and Trends in Student and Family Homelessness. For details on the ways in which recent policies have not benefitted homeless children and their parents, see Issue 5: Federal Homelessness Policy.
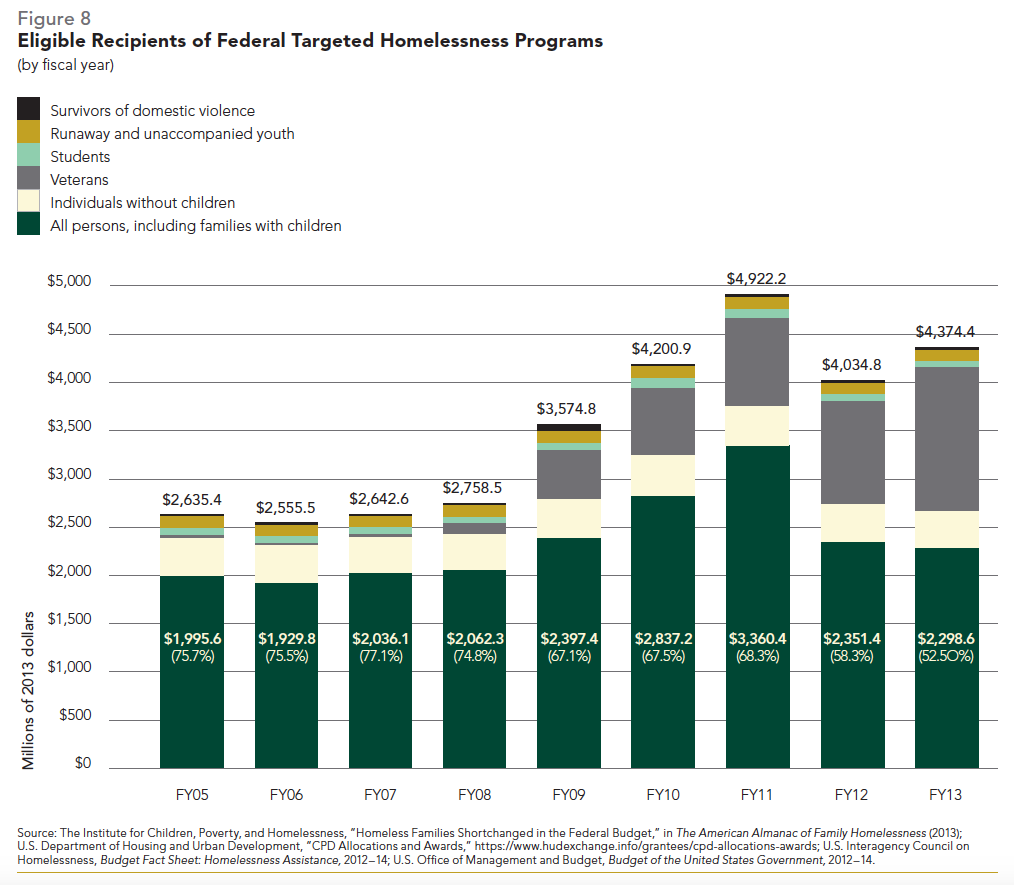
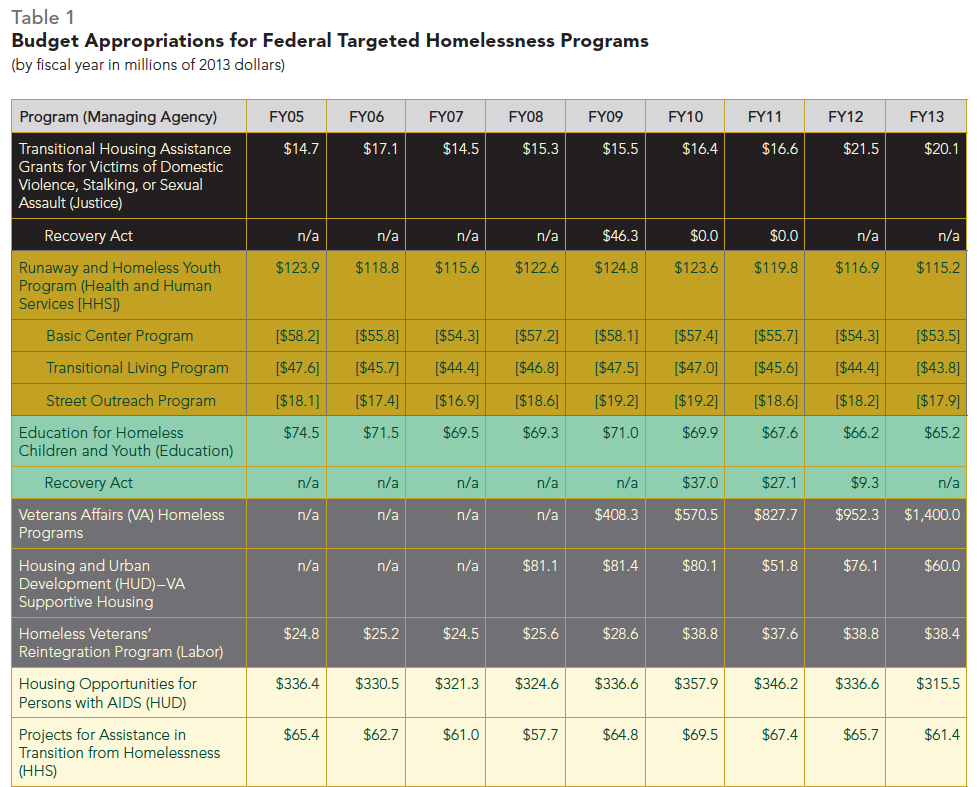
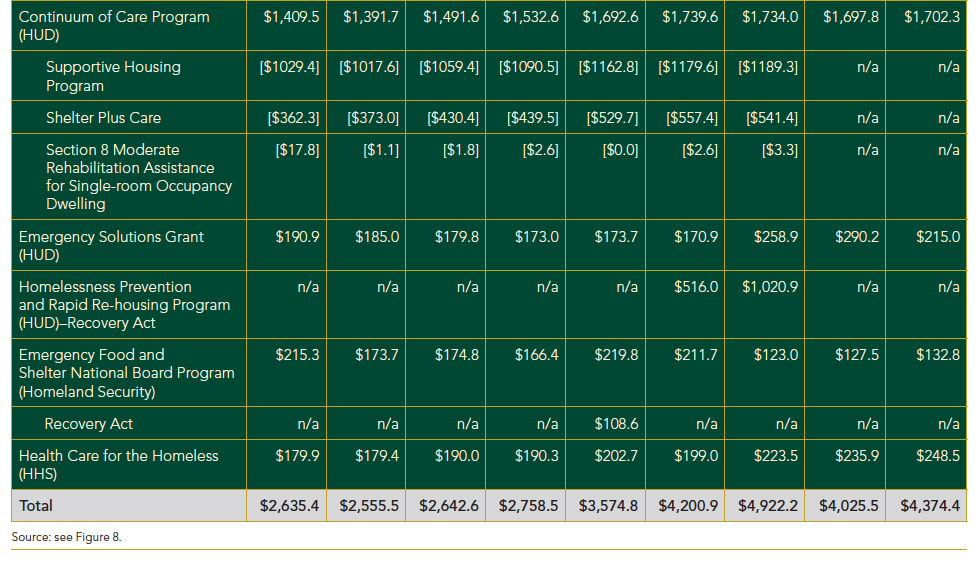
Endnotes
Ideas for Action
1 Improving Head Start for School Readiness Act, Public Law 110–134, U.S. Code 42 (2007), § 9836A; U.S. Department of Health and Human Services, Head Start Collaboration Offices Priority Areas, September 2009; U.S. Department of Health and Human Services, Building Partnerships to Address Family Homelessness, July 2014.
2 U.S. Department of Health and Human Services, Head Start Program Information Report, Survey Summary Report—National Level, 2007–13.
3 National Institute for Early Education Research, The State of Preschool 2014; National Association for the Education of Homeless Children and Youth, Access to Early Childhood Programs for Young Children Experiencing Homelessness: A Survey Report, 2015; Strong Start for America’s Children Act of 2015, S 1380, 114th Cong., 1st sess.
4 U.S. Department of Education, State Funding History Tables by Program, Education Department Budget History State Tables: FY 1980–FY 2014 President’s Budget, 2014; National Center for Homeless Education, Education for Homeless Children and Youth Program Data Collection Summary, 2010; National Center for Homeless Education, Education for Homeless Children and Youth, Consolidated State Performance Report Data, 2014.
5 National Association for the Education of Homeless Children and Youth, Homeless Children and Youth and the Reauthorization of the Elementary and Secondary Education Act —Background and Comments on Senator Alexander’s ESEA Discussion Draft, January 2015; National Association for the Education of Homeless Children and Youth, Summary of Homeless Education Provisions in the Student Success Act, HR 5, February 2015; National Association for the Education of Homeless Children and Youth, Summary of Major Amendments on Homelessness in “The Every Child Achieves Act of 2015,” April 2015.
6 U.S. Department of Education, Office of Federal Student Aid, “Applicants with Homelessness Indicated on the FAFSA by State: 2012–13 Application Cycle” (unpublished data); Higher Education Access and Success for Homeless and Foster Youth Act, S 1754, 113th Cong., 1st sess.; National Association for the Education of Homeless Children and Youth, College Access and Success for Students Experiencing Homelessness, A Toolkit for Educators and Service Providers, June 2013; National Association for the Education of Homeless Children and Youth, Financial Aid for Unaccompanied Homeless Youth: A Survey Report, 2014.
7 Higher Education Access and Success for Homeless and Foster Youth Act, S 1754, 113th Cong., 1st sess.
8 National Low Income Housing Coalition, Housing Spotlight—Affordable Housing is Nowhere to be Found for Millions, March 2015; Julia Gordon, Hearing on Inequality, Opportunity, and the Housing Market (testimony given before the U.S. Senate Committee on Banking, Housing, and Urban Affairs, Subcommittee on Housing, Transportation, and Community Development, December 9, 2014); National Low Income Housing Coalition, “The National Low Income Housing Coalition Applauds Decision to Direct Fannie and Freddie to Fund the National Housing Trust Fund,” press release, December 11, 2014; U.S. Office of Management and Budget, Budget of the United States Government, Fiscal Year 2016, February 2015; National Low Income Housing Coalition, Estimated State Allocations for Every $250 Million Invested in the National Housing Trust Fund, January 2015.
9 Center on Budget and Policy Priorities, Mortgage Interest Deduction is Ripe for Reform—Conversion to Tax Credit Could Raise Revenue and Make Subsidy More Effective and Fairer, June 2013; Tax Policy Center, Updated Options to Reform the Deduction for Home Mortgage Interest, May 2014; Common Sense Housing Investment Act of 2015, HR 1662, 114th Cong., 1st sess.
10 Institute for Children, Poverty, and Homelessness, Meeting the Child Care Needs of Homeless Families: How Do States Stack Up?, July 2014; Child Care and Development Block Grant Act of 2014, S 1086, 113th Cong., 2nd sess.
11 Office of the Assistant Secretary for Planning and Evaluation, U.S. Department of Health and Human Services, Estimates of Child Care Eligibility and Receipt for Fiscal Year 2006.
12 National Law Center on Homelessness & Poverty, Lost Housing, Lost Safety: Survivors of Domestic Violence Experience Housing Denials and Evictions Across the Country, February 2007.
13 U.S. Department of Housing and Urban Development, “Reauthorization of the Violence Against Women Act,” https://www.hudexchange. info/news/reauthorization-of-the-violence-against-women-act-vawa; National Network to End Domestic Violence, The Violence Against Women Reauthorization Act of 2013: Summary of Changes.
14 Legal Momentum, State Law Guide: Housing Protections for Victims of Domestic and Sexual Violence, June 2013; National Law Center on Homelessness & Poverty, There’s No Place Like Home: State Laws that Protect Housing Rights for Survivors of Domestic and Sexual Violence, 2012.
15 National Network to End Domestic Violence, Domestic Violence Counts 2013: A 24-hour Census of Domestic Violence Shelters and Services.
16 Urban Institute, How Much Does SNAP Reduce Food Insecurity?, 2010; James Mabli and Julie Worthington, “Supplemental Nutrition Assistance Program Participation and Child Food Security,” Pediatrics 133, no. 4 (2014): 2,013–23; Barrett A. Lee and Meredith J. Greif, “Homelessness and Hunger,” Journal of Health and Social Behavior 49, no. 1 (2008): 3–19; Craig Gundersen, et al., “Homelessness and Food Insecurity,” Journal of Housing Economics 12, no. 3 (2003): 250–72; Dena Herman, et al., “The Effect of the WIC Program on Food Security Status of Pregnant, First-time Participants,” Family Economics and Nutrition Review 16, no. 1 (2004): 21– 9; Rickelle Richards, et al., “Maternal Health Behaviors and Infant Health Outcomes among Homeless Mothers: U.S. Special Supplemental Nutrition Program for Women, Infants, and Children (WIC) 2000–07,” Preventive Medicine 52, no. 1 (2011): 87–94.
17 Center on Budget and Policy Priorities, SNAP’s Homeless Shelter Deduction Can Provide Much-needed Help for Homeless Individuals and Families, 2011; U.S. Department of Agriculture, Supplemental Nutrition Assistance Program State Options Report: Tenth Edition, 2012.
18 Sixteen states offered the “Heat and Eat” provision prior to the Agricultural Act of 2014; Randy A. Aussenberg and Libby Perl, The 2014 Farm Bill: Changing the Treatment of LIHEAP Receipt in the Calculation of SNAP Benefits, 2014; Jake Grovum, “States Resist Food Stamp Cuts,” http://www. pewtrusts.org/en/research-and-analysis/blogs/ stateline/2014/03/17/states-resist-food-stamp-cuts.
19 U.S. Department of Agriculture, WIC Food Packages Policy Options Study, 2011.
20 U.S. Department of Housing and Urban Development, HUD’s Exhibit 1 Continuum of Care (CoC) Application, 2005–13.
21 U.S. Conference of Mayors, Hunger and Homelessness Survey: A Status Report on Hunger and Homelessness in America’s Cities, 2011–13.
22 U.S. Department of Housing and Urban Development, The 2012 Annual Homeless Assessment Report to Congress Volume II: Estimates of Homelessness in the United States, September 2013.
23 Institute for Children, Poverty, and Homelessness, “Foreclosures and Homelessness: Understanding the Connection,” in The American Almanac of Family Homelessness (2013).
24 Homeless Emergency Assistance and Rapid Transition to Housing Act of 2009, S 896, 111th Cong., 1st sess.; National Center for Homeless Education, Education for Homeless Children and Youth, Consolidated State Performance Report Data, 2014.
25 Homeless Children and Youth Act of 2014, S 2653, 113th Cong., 2nd sess.; Homeless Children and Youth Act of 2014, HR 5186, 113th Cong., 2nd sess.; Homeless Children and Youth Act of 2015, S 256, 114th Cong., 1st sess.; Homeless Children and Youth Act of 2015, HR 576, 114th Cong., 1st sess.
26 See Figure 8; U.S. Department of Housing and Urban Development, The 2014 Annual Homeless Assessment Report to Congress.
27 The American Recovery and Reinvestment Act of 2009 (ARRA)—the federal economic stimulus package—included an additional $70 million for EHCY between FY10–12; National Alliance to End Homelessness, Summary of the HEARTH Act, June 2009; U.S. Department of Housing and Urban Development, “CPD Appropriations Budget,” http://portal.hud.gov/hudportal/ HUD?src=/program_offices/comm_planning/ about/budget.
Issue by Issue
An Overview of National Policies and Practices Affecting Homeless Families
Although family homelessness impacts individual families and communities differently, it can be useful for state and local government officials and service providers to understand trends across the country. National data not only exposes the gaps between local need and federal efforts to address family homelessness but also helps inform the response of state and local governments.
With new analyses and up-to-date data, the Issue by Issue part of the 2015 edition of the American Almanac of Family Homelessness explores the ways in which stakeholders at the federal, state, and local level have responded to the enduring, multifaceted challenge of family homelessness. The following six sections present what we know and what we still have to learn about the experiences and needs of homeless parents and children, the efficacy of public programs that aim to support them, and the policies that most directly aid, or impede, their paths to self-sufficiency.
The Issue by Issue part of the Almanac begins with a discussion of what family homelessness is and why it must be addressed. Issue 1 defines family homelessness in terms of its scope and who is most likely to be affected, taking into consideration the varying federal definitions of homelessness. Student-level data show that there has been a drastic rise in homelessness in recent years, and that homeless children are more likely to live doubled up with another household than in a shelter. Issue 2 then identifies macroeconomic problems that create a national environment in which family homelessness exists and continues to grow. The factors that can cause poverty, such as unemployment, a lack of health insurance, and insufficient aid from mainstream benefit programs are likely to increase a family’s risk for homelessness.
Issue 3 looks at the impact that homelessness has on the members of a family, including the connection between homelessness and other social issues. Young children are more at risk for physical, mental, and behavioral health problems. Parents, who are most often young mothers, may be survivors of domestic violence or have substance abuse issues. Experiencing multiple social problems can have compounding effects, increasing the risk for and duration of homeless episodes. Homelessness, therefore, cannot be addressed in a vacuum.
Education is critical to ensure homeless children do not become the next generation’s homeless parents. Issue 4 explores the characteristics and needs of homeless students, from young children in early childhood education programs to students in high school. Though data on educational outcomes show conflicting results, homeless students are more likely than their housed peers to qualify for special education services and be English Language Learners, requiring additional services and resources in order to succeed.
Lastly, this part of the Almanac concludes with two sections that focus on past and present policy responses to homeless families’ need for housing and mainstream benefits. Issue 5 examines the federal policy response to family homelessness, starting with the 1980s. It compares different types of housing assistance, including emergency shelter, transitional housing, and permanent supportive housing, ending with a description of the current service system known as Continua of Care (CoCs). Issue 6 considers the low enrollment rate of homeless families in mainstream benefit programs as well as efforts to overcome the barriers to participation. CoCs are now required to create plans to increase benefit enrollment in order to compete for federal funding, and the majority are working to assist clients with the application process.
The information in these sections is meant to convey how family homelessness developed and what the nation is currently doing to address the issue. It is vital that stakeholders understand the specific needs of homeless families so that strategies and interventions can be targeted appropriately.
Issue 1
Definitions, Demographics, and Trends in Student and Family Homelessness
Nationally, the typical homeless family consists of a young single mother with one or two young children who live doubled up with another household. Homeless families often face a variety of unstable housing environments, with short stays in doubled-up situations and housing programs common. While many families in urban areas can access shelter, families in rural locations are more likely to live doubled up due to a dearth of available services. To address family homelessness, the issue must first be defined, but this is in itself a challenge because federal agencies currently disagree on who is considered homeless. Understanding the scope and demographics of homeless children and their families is important because data can inform policymakers in instituting effective interventions and help service providers better distinguish children in need.
The nation’s schools are at the frontlines of family homelessness, with educators both identifying homeless students and connecting them with supportive services to ensure educational success. Schools provide safety and continuity in unstably housed children’s lives, but the ever-increasing number of homeless students (more than 1.25 million) and limited financial resources at school districts’ disposal most likely translate into unseen and unserved children.
Minority families are more likely to experience homelessness due to interrelated barriers to economic self-sufficiency that vary by racial and ethnic group, including generational poverty and institutionalized discrimination. The influence of longstanding racial and ethnic prejudice cannot be overstated and is discussed at length in the second half of this chapter. Facing the most severe barriers to housing stability, black and American Indian or Native Alaskan families are greatly overrepresented in shelter statistics compared to their share of the general population. Hispanic families are slightly underrepresented, while white and Asian households are significantly underrepresented. In comparison to the rate at which white families experience homelessness, black, American Indian or Alaskan Native, and Hispanic families are eight, seven, and three times more likely to live in homeless shelters, respectively.
Conflicting Federal Definitions of Homelessness
The U.S. Department of Education (ED) considers any child or youth who lacks a fixed, regular, and adequate nighttime residence to be homeless.1 This includes students living in emergency or transitional shelters and those sleeping in cars, parks, public spaces, abandoned buildings, substandard housing, bus or train stations, or similar public or private settings that are not designated for or ordinarily used as regular sleeping accommodations. More importantly, ED’s definition includes types of unstable housing not traditionally understood by the public to be forms of homelessness. These precarious situations include living doubled up with family, friends, or others due to loss of housing, economic hardship, or similar reasons. In addition, students living in motels or hotels, trailer parks, or camping grounds due to the lack of alternative adequate accommodations and children who are abandoned in hospitals or are awaiting placement in foster care are also defined by ED as homeless due to the temporary nature of these situations. Migratory children are considered homeless if living under any of these circumstances. Programs administered by the U.S. Departments of Health and Human Services, Labor, Justice, and Agriculture all use definitions similar to that of ED.2
The U.S. Department of Housing and Urban Development (HUD), which funds most emergency housing services, uses a definition of homelessness that greatly differs from that of ED and other federal agencies.3 While HUD considers families residing in homeless shelters or in places not meant for human habitation to be unconditionally homeless, its definition of homelessness for families in doubled up or hotel/motel situations is more limited. Families living doubled up are eligible for HUD-funded emergency housing and related services only if they are losing their primary nighttime residences within 14 days. The same requirement applies to families with children residing in hotels or motels, unless the housing units are paid for by governmental or charitable organizations. Exceptions are made for families in these living arrangements if they have moved twice; did not hold a lease within the last 60 days; and have either chronic disabilities or physical or mental conditions, substance addiction, histories of domestic violence or childhood abuse, a disabled child, or two or more severe barriers to employment. These complicated differences in definitions among federal agencies are a logistical and bureaucratic challenge to providing services to the most vulnerable children and families.
Demographics and Trends of Homeless Students
More than 1.25 million children experienced homelessness during School Year 2012–13 (SY12–13). Three-fourths (75%) of homeless students lived doubled up, 16% resided in shelters, and 6% stayed temporarily in hotels or motels. Three percent, or more than 40,000 students, lived unsheltered on the streets or in other places not fit for human habitation.4
Over 2.5% of all students, or one in every 39, were homeless in SY12–13. California and New York, states that accounted for more than 30% of all homeless students nationwide, also had high rates at 4.1% and 4.9%, respectively.5 While city-level data are scarce, New York City had a rate (7.4%) three times the national average. Chicago’s rate (4.5%) was nearly double that of the nation; however, rates in other large urban areas, including Los Angeles (2.1%) and Dallas (1.6%), were lower than the national average.6
The rate of homelessness also varies across school grades. Younger students are far more likely to be homeless than older students, as limited access to child care makes families with younger children more vulnerable to homelessness.7 With the exception of slight increases in the 9th and 12th grades, the rate of student homelessness steadily decreases from a high of more than 3% among kindergarteners to a low of less than 2% in the 11th grade (Figure 1).8
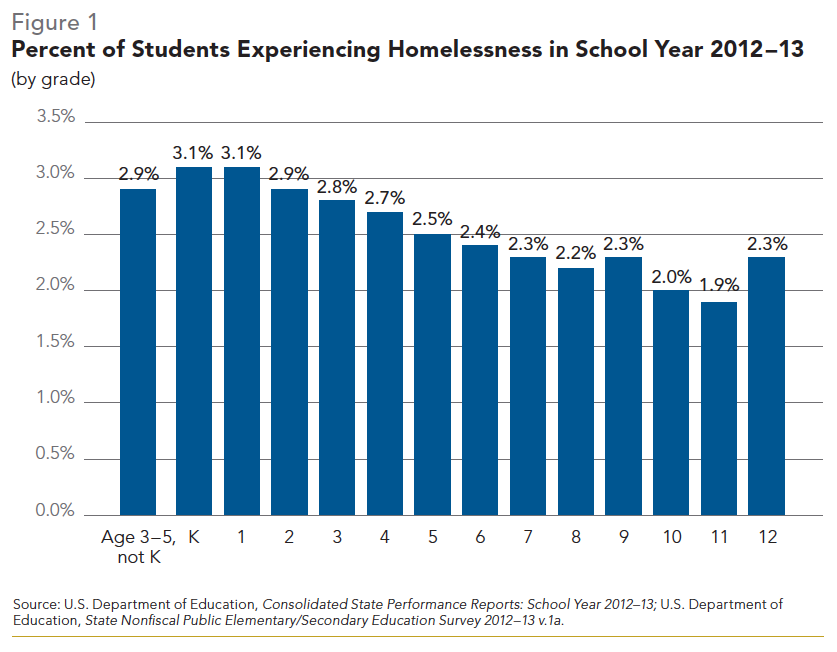
In recent years, there has been an unparalleled rise in the number of homeless students. Since SY06 – 07, the year before the Great Recession, and SY12–13, the number of homeless students increased by over four-fifths (85%). Led by the District of Columbia at 357%, 28 states saw an increase in student homelessness that surpassed the national rate. Some of the states with the most homeless students—New York (131,600) and Texas (101,088)—saw the number of homeless students triple during this time period (increases of 199% and 198%, respectively). Only two states, Louisiana and Mississippi, had decreases in the number of homeless students, in part due to children displaced by 2005’s Hurricanes Katrina and Rita. In general, states in the Midwest and Great Plains experienced the highest increases, while states in New England and the West saw more modest upticks (Figure 2).9
During the two school years that coincided with the economic downturn, student homelessness increased by 16.9% in SY07– 08 and 20.4% in SY08– 09 (Figure 3). Even after the official end of the recession (June 2009), the number of homeless students has continued to grow. At first glance, the number of homeless students appeared to have decreased slightly (-1.8%) during SY09–10; however, California under-reported its numbers that year. Excluding California, the number of homeless students actually rose 11.6% that year.10
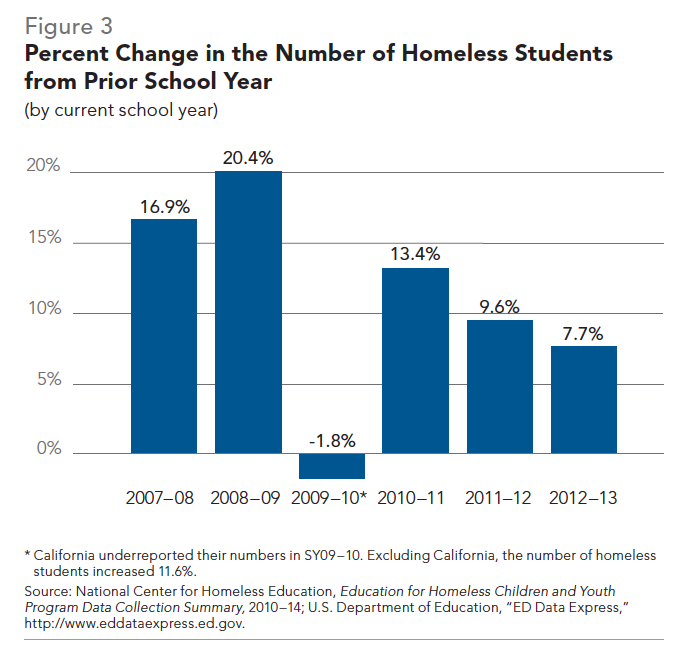
Not surprisingly, in a 2010 survey, almost two-thirds (62%) of state education departments and local school districts cited the economic downturn as the primary cause of the sharp increase in the number of homeless students reported. However, two in five (40%) educators attributed the increase to more community awareness and one-third (33%) to a greater ability to identify students who are homeless.11 In recent years, educators have heightened outreach efforts to homeless students and have been particularly successful at identifying those living doubled up, who often do not self-identify as homeless. The number of homeless students living in doubled-up situations more than doubled (122.4%) between SY06 – 07 and SY12–13, far outpacing the increase of students in shelters (19.0%) and those in hotels or motels (37.8% [Table 1]).12 The State Dashboards part of the Almanac provides additional information on the living arrangements of homeless students in each state between SY06–07 and SY12–13.
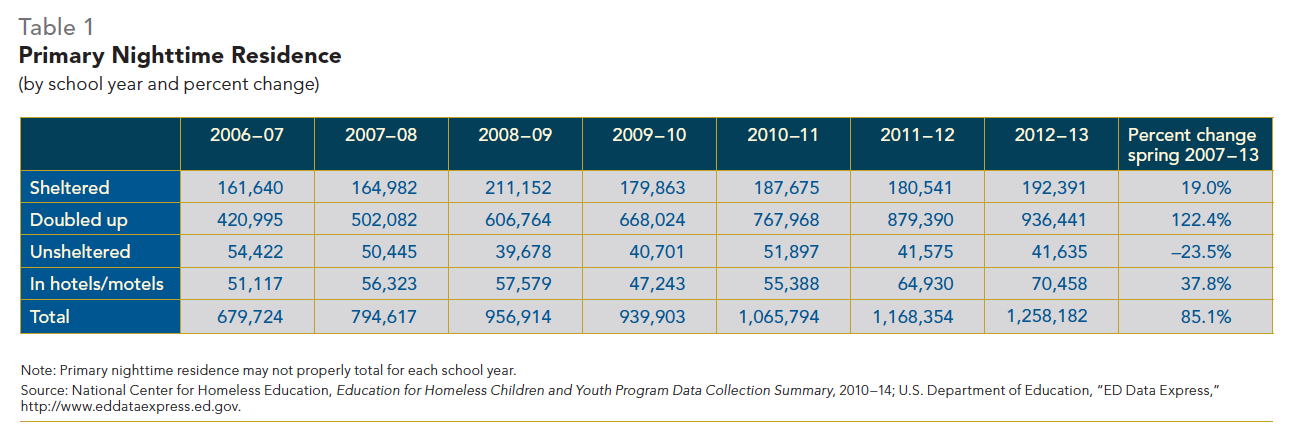
Though the recent improvements are notable, schools still struggle with under-identifying homeless students and providing services to those in need. Many districts rely on entrance questionnaires to find out which students are homeless, but these tend to provide limited information. Once identified, there are barriers to providing homeless students with services, including student mobility, social stigma, insufficient staffing, and the varying definitions of homelessness for federal program eligibility.13
Federal funding is another significant factor in how many homeless students are identified and served; the number of homeless students served is directly related to the amount of available funding. Authorized through the federal McKinney-Vento Homeless Assistance Act, the Education for Homeless Children and Youth (EHCY) program is the only dedicated source of federal funding source for identifying, enrolling, and providing services to homeless students.14
Prompted by dire economic conditions and improved community awareness, homeless education liaisons working at the school level have been able to reach more students despite little change in EHCY funding (Figure 4); the American Recovery and Reinvestment Act of 2009 (ARRA), however, presented an additional $69.9 million in stimulus funds for EHCY disbursed over the 2009–11 federal fiscal years.15 ARRA stimulus funds provided essential financial assistance, filling significant budget gaps that existed as a result of the economic downturn and doubled the number of school districts receiving support through the program. Nevertheless, only one in five school districts received financial assistance through either the ARRA or EHCY allocations.16 For the first time in FY14, federal Title I, Part A funding to improve academic achievement of low-income students can be used to support homeless school liaisons and provide transportation to homeless students schools of origin, which help ease local fiscal shortfalls of EHCY allocations.17
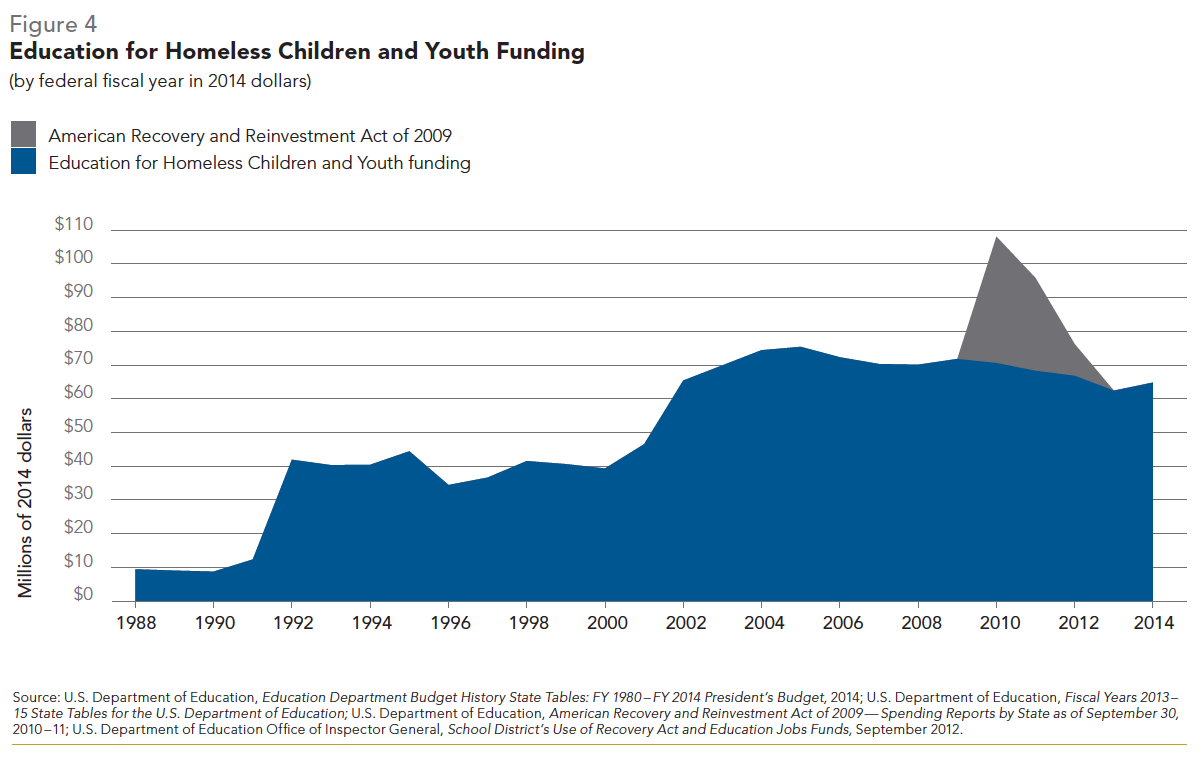
Number and Characteristics of Homeless Families
An estimated 495,714 parents and children entered emergency shelter or transitional housing over the course of 2013, a 4.7% increase since 2007, before the recent economic downturn began.18 Although tabulations vary across studies, an estimated 2.1 million family members lived in doubled-up situations in 2008, four times more than those who stayed in homeless shelters over the course of that same year.19 At least 24,000 family members lived unsheltered on a single day in January 2014; however, counts of families living on the streets, under bridges, or in cars, abandoned buildings, wooded areas, camp sites, and other places not meant for human habitation are likely underestimates.20 The total number of homeless families who stayed temporarily in hotels or motels is unknown.
HUD conducts two separate counts of the number of family members who access shelter, both of which should be interpreted with caution when evaluating trends in family homelessness. For the first count, communities across the country conduct one-day “point-in-time” counts of the number of sheltered (conducted annually) and unsheltered (required every other year) persons during the last ten days in January. While it is relatively straightforward to count those living in shelter, the process of determining the number of unsheltered persons has several limitations, which can lead to erroneous counts and underestimates. These difficulties range from the unknown locations at which unsheltered families may congregate to inclement winter weather that inhibits volunteers’ ability to identify and count persons living in places not meant for human habitation. Local changes in methodology pose yet another issue. Therefore, separating the number of sheltered and unsheltered family members produces different trends. Although the total number of family members dropped 8.2% between 2007 and 2014, the decline was entirely due to half (57.4%) as many unsheltered family members counted in 2014 than in 2007. The number of homeless parents and children in shelter actually increased 7.6% during this time period (Figure 5).21
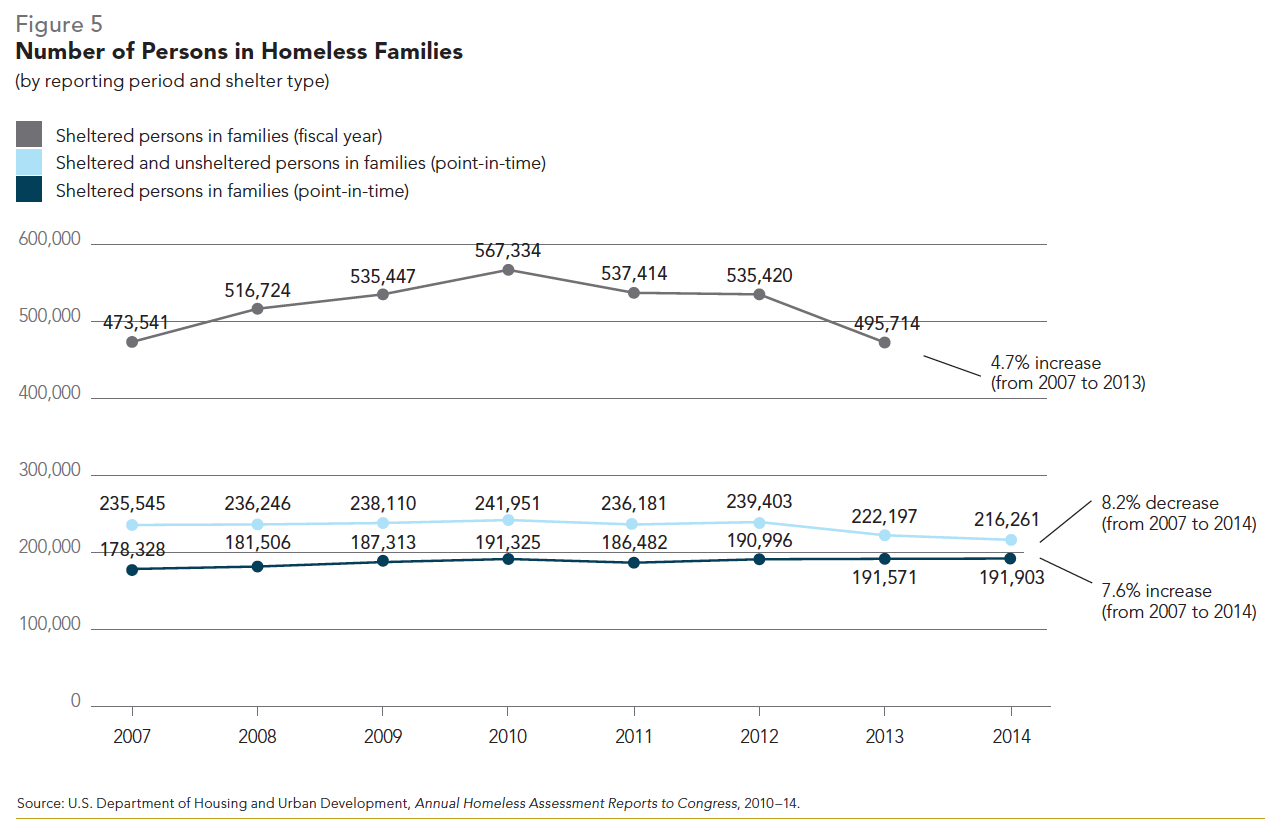
For the second count, HUD estimates the total number of homeless family members who access shelter over the course of one fiscal year based on a sample of communities. By collecting data annually rather than on a single day, the chance of random fluctuations due to changes in the number of shelter beds, the length of stay in shelter, and the occupancy rate, among other factors, is reduced (although not eliminated). Between 2007 and 2013, the number of family members who used shelter over the course of one year increased by 4.7% (Figure 5). Year over year changes during this time period indicate that more families accessed shelter during the recession and then fewer did as the economy began recovering, in part due to fewer available shelter beds (Figure 6).22
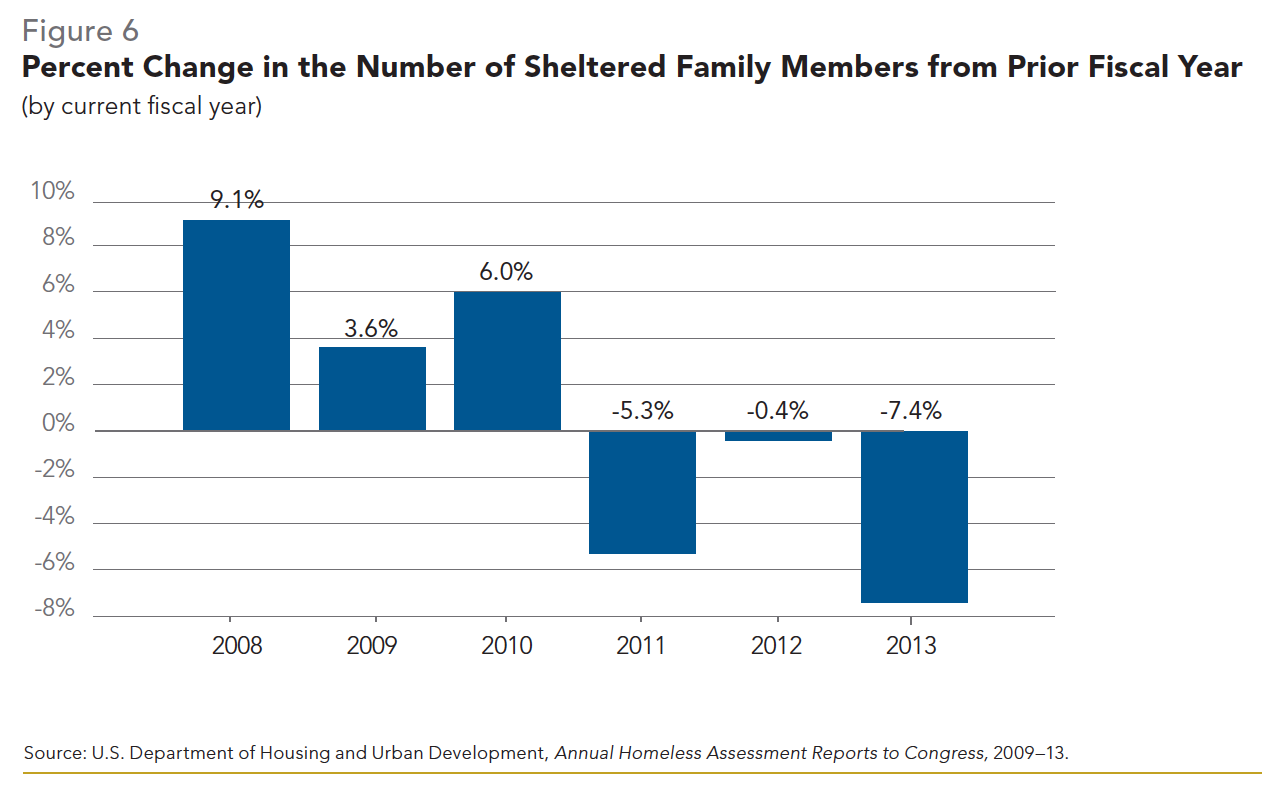
This data is also limited in its applicability since HUD restricts its definition of homelessness to only those families living in shelter or unsheltered situations. As discussed in the previous section, data collected by ED also includes students living doubled up with another household or in hotels and motels, which accounted for more than four-fifths (81.1%) of all students in SY12–13.
As a result of these conflicting definitions, little is known regarding the demographics of homeless families living doubled up, in hotels or motels, or on the streets, but it can be assumed that they closely resemble those of families who stay in homeless shelters. In fact, only 20% of families in 2012 entered shelter directly from their own rented or owned housing; nearly half (40%) previously lived doubled up. About one-third (31%) came from other shelter facilities or unsheltered locations, while 7% lived in other settings, including hotels and motels, the night before entering shelter. Only 2% of families were discharged into homeless situations directly from institutional settings, such as psychiatric and correctional facilities and hospitals.23
On a single night in 2014, 7.0% of persons in families were chronically homeless, meaning that the head of household has a disability, and the family has been either homeless for over one year or on four occasions within the three previous years. Nationally, 15.2% of all chronically homeless people were persons in families, though this rate varied widely by state.24 The federal Homeless Emergency Assistance and Rapid Transition to Housing Act of 2009 expanded the definition of “chronically homeless” to include families with children.25 Because this family population has only recently been singled out for observation, little research exists on their characteristics and needs. What is apparent is families’ extreme vulnerability due to co-occurring disabilities (serious mental illness, substance abuse, or developmental or physical impairment) and long-term homelessness conditions. Studies on family supportive housing programs— whose clients share characteristics with chronically homeless individuals—reveal mothers who are typically older and better educated (but with similarly poor employment patterns), with longer histories of homelessness and more disabilities than those served by the emergency shelter system.26
The demographics of homeless parents and their children living in shelter differ from those of stably housed poor families and those in the general population. Parents in homeless families are overwhelmingly more likely to be female (78%), compared with housed poor families (64%) and families overall (55%). Homeless parents also tend to be younger than parents in non-homeless poor families or parents overall, although the national median or average age of homeless parents is unknown.27
Homeless families in shelter have smaller household sizes than other U.S. families. About one-quarter (24%) of homeless families consist of a single parent with one child, a rate six times higher than families in the general population (4%). Homeless families are also less likely to consist of five or more people (25% versus 41%). Given the prevalence of younger mothers and smaller families within the homeless population, homeless children are more likely to be younger. Half (52%) of homeless children living in shelters are preschool-aged (under 6), while one-third (35%) are elementary school-aged (6 to 12), and 14% are middle- and high school-aged (13 to 17).28
Homelessness is often considered to be an urban issue, where both unsheltered individuals living on the streets and the facilities that serve them, such as emergency shelters and soup kitchens, dominate stories about homelessness in the media and public perception. Sheltered urban families outnumber suburban and rural families two to one and homeless families are more likely to live in principal cities (63%), compared with poor families (37%) and families in the general population (23%). Rural homelessness, by contrast, is more often unseen and, as a result, unaddressed. Between 2007 and 2012, the number of parents and children living in rural and suburban areas increased by more than half (54%), while those in urban areas decreased by 2%.29 This trend is due in part to the movement of more low-income households from urban to suburban areas over the past decade.30 Some causes of homelessness are specific to, or more pronounced in, rural settings, such as high unemployment linked to local “boom and bust” economic cycles, lack of transportation in locations where long distances separate places of employment and affordable housing, and limited access to a variety of other services, including health care. Although factors such as poverty, unemployment, lack of affordable housing, substance use, and domestic violence are common throughout the country, they are often experienced at higher rates in rural areas.31 With the majority of services centered in urban and suburban locales, families experiencing rural homelessness are more likely to live doubled up. In fact, only 6% of homeless persons access shelter in rural locations, despite those areas having higher poverty rates than cities.32
Regardless of their geographic locale, parents and children enduring homelessness tend to face frequent housing instability. Less than one-quarter (22%) of families who enter shelter lived in their prior residence for one year or more; 34% had stable housing for less than one month, with another 16% of families relocating between one and three months prior to shelter entry. Many families living in emergency shelter, where the average length of stay is 65 days, move into transitional housing and stay for an average of six additional months (178 days).33 Some families are unable to attain self-sufficiency after leaving shelter and return after they exit.34
In the pursuit of affordable housing, earning and saving money is a struggle for homeless parents. Only one-quarter (25%) of all adults (including those who have children and those who do not) who exit shelter, supportive housing, or rental-assistance programs earn income from employment (Figure 7).35 Even when parents work, their jobs typically do not pay a living wage or provide health insurance or other benefits.
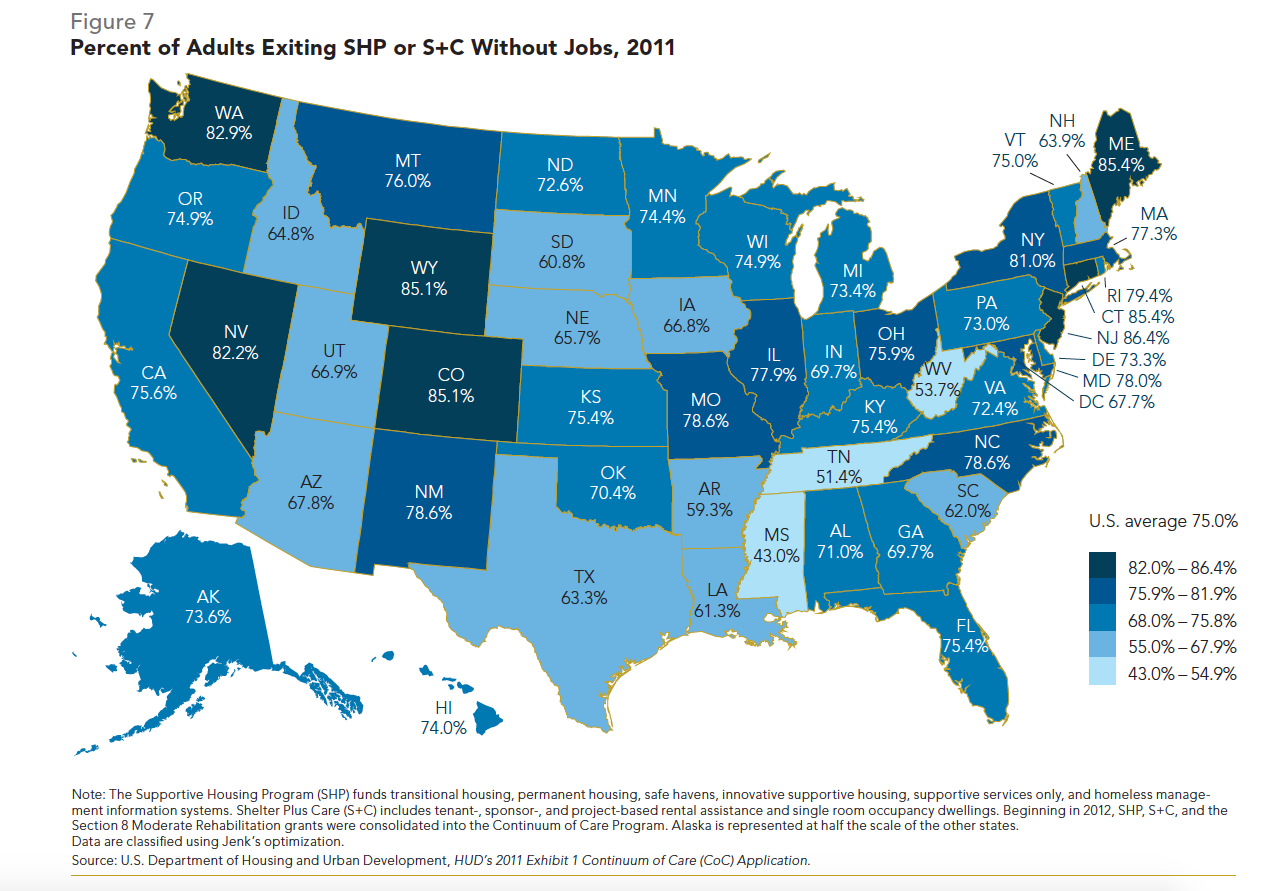
Studies estimate that between 39% and 65% of homeless mothers did not graduate high school or earn an equivalency degree, compared with 16% of all single mothers and 26% of poor housed mothers.36 Differences also exist between at-risk families and those who experience homelessness; one report found that 48% of those at risk of housing instability did not complete high school, compared with 60% of homeless parents.37 Low educational attainment often inhibits a parent’s ability to obtain employment that is sufficient to support a family and maintain stable housing. A higher level of education is strongly correlated with increased annual earnings; workers with bachelor’s degrees earn nearly twice as much as those with high school diplomas over the course of 40 years. Lack of education is often intergenerational, as children of parents without high school diplomas are more likely to drop out of school themselves.38
The Struggles of Homeless Minority Families
The stark reality is that racial and ethnic minority families are overrepresented in U.S. homelessness and poverty statistics. Factors such as institutionalized discrimination and generational poverty result in disparities in access to quality housing, employment, and education. These social exclusions leave minorities more likely to have smaller financial buffers to fall back on in emergency situations; to reside in poor, segregated, and unsafe neighborhoods that lack community resources; and to experience homelessness. Black as well as American Indian and Native Alaskan families are greatly over-represented in sheltered homeless populations, facing the most severe barriers to housing stability. Hispanic families are slightly underrepresented, while white and Asian households are severely underrepresented compared with their share of the general population.39
Black Homeless Families
In 2012, one-third (33.2%) of black families with children lived in poverty, close to three times the rate of white families (12.3% [Figure 8]). Black families also experience homelessness at much higher rates. In 2012, one of every 134 black family members stayed in homeless shelters, a rate eight times higher than that for persons in white families (one in 1,115 [Figure 9]).40
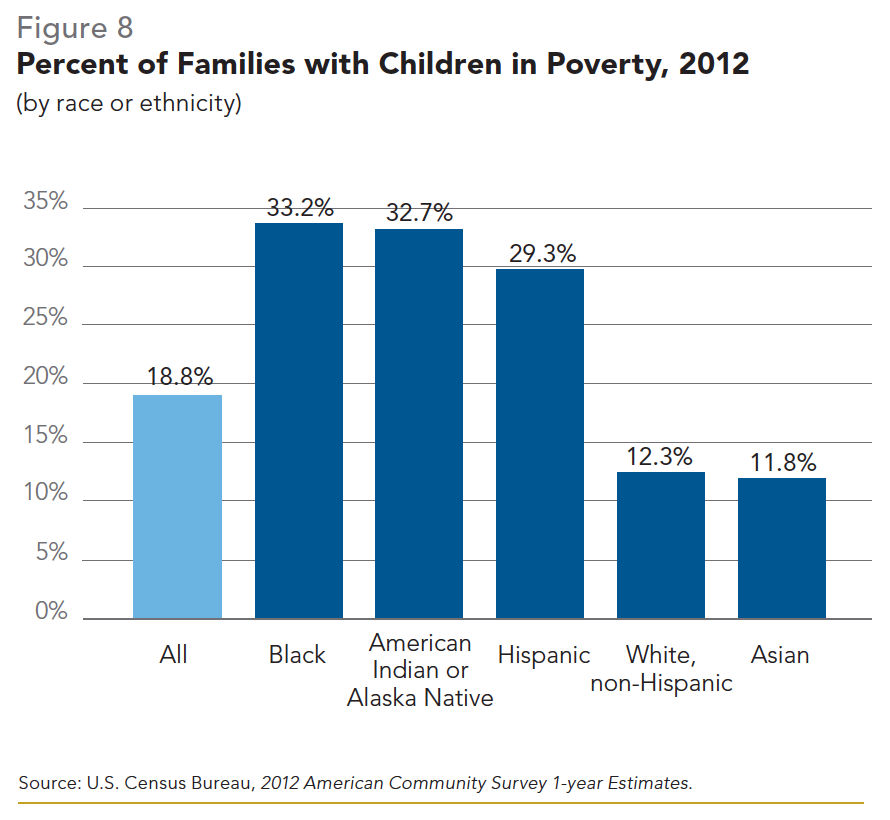
Understanding why blacks are so overrepresented in homelessness statistics requires an examination of the longstanding and interrelated social and structural issues facing the black community. Throughout U.S. history, housing discrimination based on race has been ever-present, both in the form of official government policies and societal practice. Federal policies that reduced the stock of affordable housing through urban renewal projects, beginning in 1949, displaced a disproportionate number of poor blacks concentrated in impoverished areas of cities, relocating them to other substandard neighborhoods. Residential segregation, which affects black households to a greater extent than other minorities, perpetuates poverty patterns by isolating blacks in areas that lack employment opportunities and services and have higher crime and poverty rates.41 Blacks are also overrepresented in the criminal justice system, which increases the risks of homelessness and developmental delays among their children.42
Lower educational attainment among blacks serves as a barrier to employment and especially to well-compensated jobs. Blacks earn bachelor’s degrees at nearly half the rate of whites (18.7%, compared with 32.5%).43 Employment disparities rooted in subtle forms of discrimination persist even with academic advancement.44 In 2012, blacks with associate degrees experienced a higher unemployment rate than whites with high school diplomas (10.2% and 7.5%, respectively). Furthermore, a black employee with a bachelor’s degree or higher was paid nearly one-fifth (17.5%) less on average in weekly full-time salary ($972) in 2012 than a white worker ($1,178) with the same level of education.45
Inequality in earnings impedes families’ attempts to exit poverty and contributes strongly to the relative lack of wealth accumulated by black households. In 2009, the median wealth of white households was 20 times that of blacks’ nationwide ($113,149 versus $5,677).46 Financial assets serve as a crucial buffer in times of economic hardship, covering unexpected health expenses and preventing loss of housing during periods of unemployment. Access to additional funds improves living conditions during working years and retirement. Intergenerational wealth transfers can enhance the economic circumstances of younger relatives, for example through investments in children’s education, inheritances, and other monetary gifts.47
American Indian and Alaska Native Homeless Families
In 2012, one-third (32.7%) of American Indian or Alaska Native (AIAN) families lived in poverty, a rate nearly three times that of white families (12.3% [Figure 8]).48 The poverty rate for the more than one-fifth (21.3%) of families with children living on designated federal and state-recognized American Indian reservations was even higher, at 39.7%.49 In 2012, AIAN families were the second most likely to experience homelessness, with one in 149 AIAN family members staying in homeless shelters (Figure 9).50
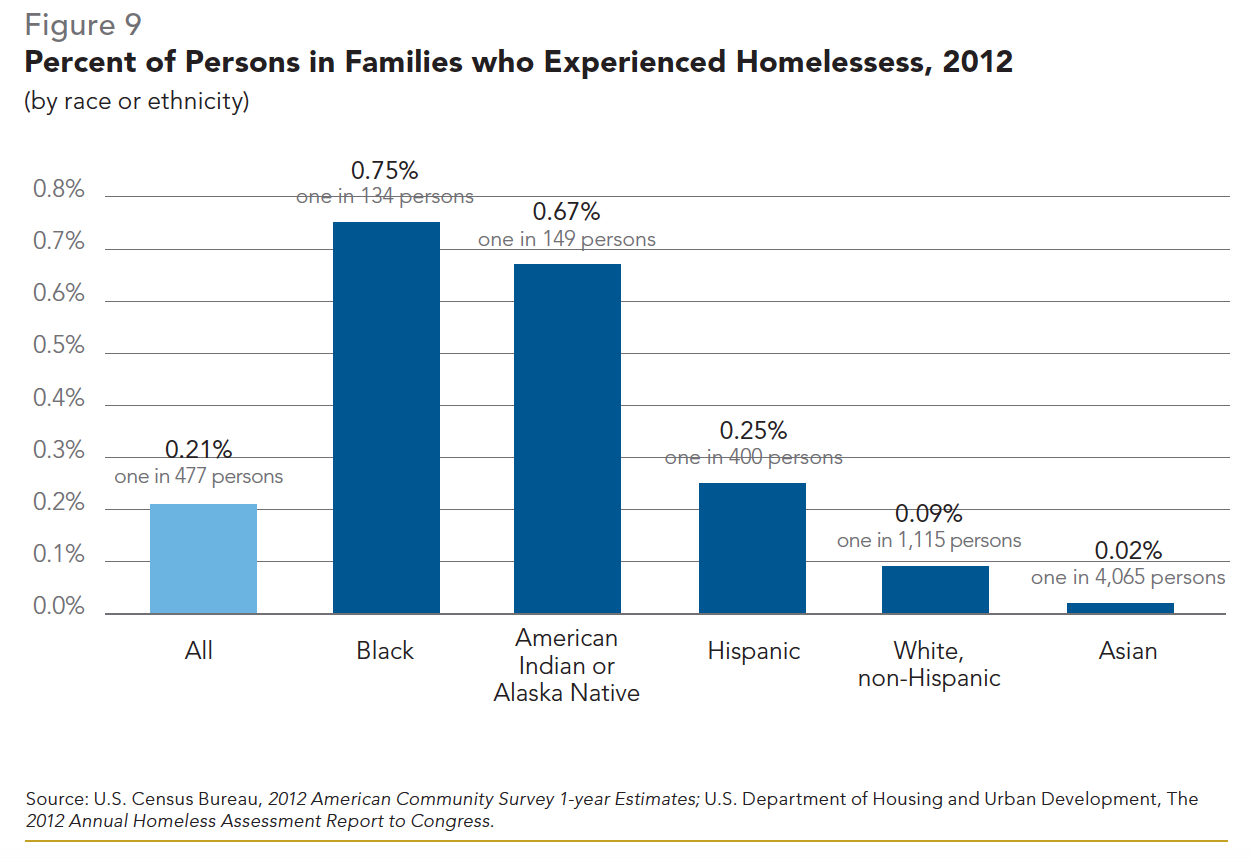
Historical mistreatment, decades of neglect from federal funding sources, policies of social marginalization, and housing discrimination surpassing that of other minorities have resulted in a large share of AIAN families— particularly those residing on reservations and similar lands—experiencing entrenched poverty and living conditions far below adequate-quality thresholds.51 Overcrowded and substandard housing conditions and insufficient access to health care and social services have led American Indian households to suffer poorer health and lower life expectancy than other minorities.52 Many AIAN communities also lack economic opportunities and sources of credit and see low levels of private investment.53
The subpar quality of educational services and facilities and a scarcity of early childhood educational programs on reservations, as well as a lack of culturally appropriate curricula and supports for AIAN students attending public schools, contribute strongly to below-average academic achievement and low rates of high school completion.54 Among American Indians and Alaska Natives, over one-fifth (21.2%) have less than a high school diploma, more than twice the rate (8.5%) for whites (Figure 10).55 A 2012 Minnesota study comparing the experiences of homeless persons in different regions found that the lack of high school diplomas was more common among homeless American Indians living on Minnesota reservations (32.0%) than among the general homeless population in the state (24%).56 In 2012, the average unemployment rate for AIAN individuals was 15.9%, compared with the national average of 9.4%. Unemployment on reservations is typically much higher due to limited job opportunities.57
Hispanic Homeless Families
In 2012, over one-quarter (29.3%) of Hispanic families with children lived in poverty, more than twice the rate of white families (12.3% [Figure 8]). Despite the similarities in poverty rates between Hispanics and blacks, fewer Hispanic family members (one in 400 compared to one in 134) stayed in homeless shelters in 2012 (Figure 9).58
Such homelessness statistics may represent an undercount due to a range of factors unique to Hispanic homeless families. Language barriers, fear of deportation of an undocumented family member, and migratory labor patterns result in lower service utilization and subsequent underrepresentation in homelessness statistics. Hispanic families may rely on close-knit, kinship-based social networks over agency-run social services, reducing the rate of literally homeless Hispanics but increasing the number of doubled-up families potentially living disconnected from services in overcrowded and substandard conditions. This preference may further reduce access to employment and other opportunities by decreasing the frequency of interactions and closeness of relationships with a wider range of non-related individuals, such as coworkers and friends. Some studies suggest that literally homeless Hispanics are also more likely to stay in atypical unsheltered locations, for example in abandoned buildings, thus frequently “hidden” from and overlooked by homelessness surveyors.59
Issues surrounding immigration status limit low-income Hispanic families’ access to benefit programs that could keep them from experiencing homelessness. Welfare reform legislation passed in 1996 resulted in much lower public benefit participation rates among legal non-citizen households; even qualified immigrant families living in poverty are prevented from receiving aid due to complex application rules, confusion over eligibility criteria, limited English skills among applicants, and fear that participation may disqualify family members from obtaining permanent residency status (“green cards”). In “mixed-status” households, fear of deportation keeps undocumented parents from applying for assistance for their qualifying U.S.-born children.60 Harsh legislative measures taken in recent years by states seeking to address unlawful immigration initially heightened deportation concerns among Hispanics, but subsequent legal challenges were largely successful at blocking most provisions.61 Instead, federal policies focused on aggressively increasing the number of deportations have become the major focus, resulting in fear of racial profiling and fewer Hispanics reporting crimes to local law enforcement.62
Several factors place many Hispanic families and individuals in a financially unstable position. Over one-third (36.0%) of Hispanics have less than a high school degree, a rate substantially higher than for blacks or whites (Figure 10).63 In 2012, a Hispanic full-time employee with a bachelor’s degree or higher earned close to one-fifth (17.9%) less in weekly full-time salary ($967) than a white worker ($1,178) with the same level of education.64 In 2009, when facing economic hardship, Hispanic households had 18 times less accumulated wealth to fall back on than whites ($6,325, compared with $113,149). This amount decreased by two-thirds (65.5%) between 2005 and 2009, primarily due to the housing-market crash, which strongly affected states with large Hispanic populations. White households experienced a significantly lower 15.6% decline during the same time period.65
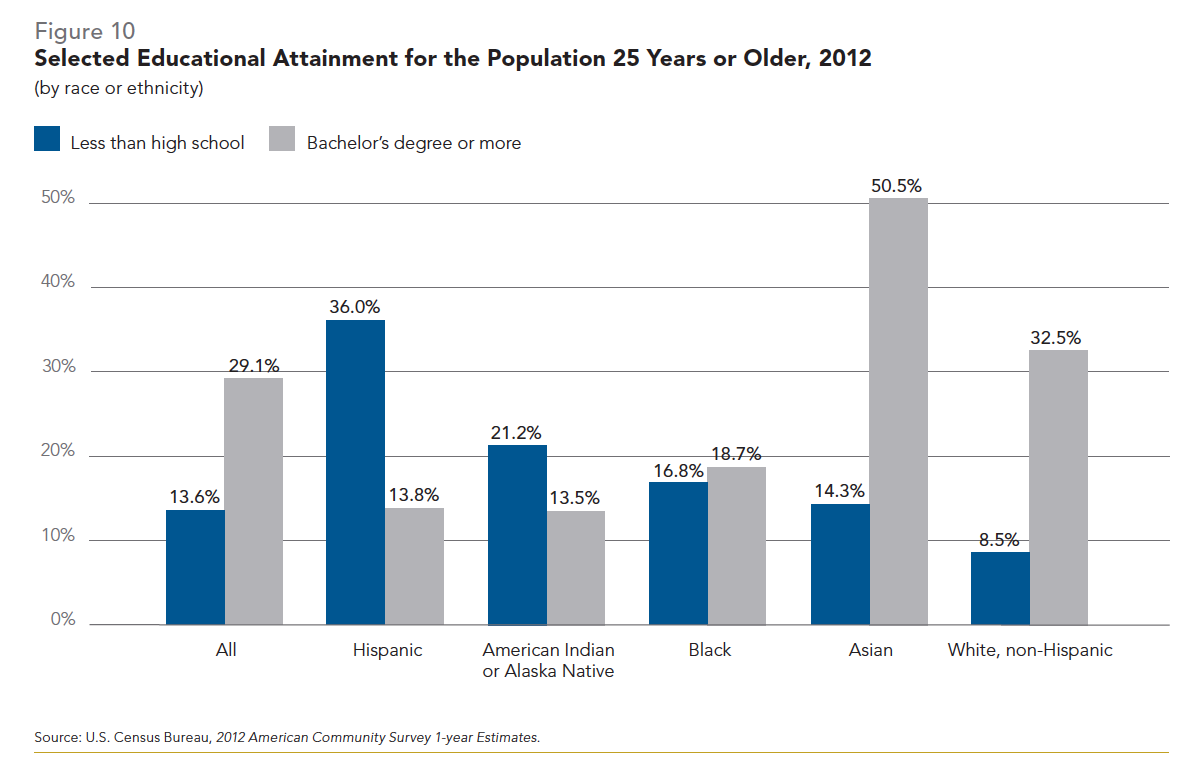
Differences also exist within the broad “Hispanic” category, which disguises homelessness-vulnerability factors linked to national origin, generational status (such as foreign-born versus third generation), immigration status, and level of English language proficiency.66 For example, the poverty rate among foreign-born families originating in Mexico was 27.8% in 2012, as opposed to 14.0% for families from South America. Over two-thirds (69.4%) of U.S. families born in Mexico have limited English language skills, compared with less than half (44.7%) of South American–born families, which further contributes to difficulties in achieving economic stability.67
Asian Homeless Families
More than one in ten (11.8%) Asian families with children in the U.S. lived in poverty in 2012, slightly less than the rate for white families (Figure 8). Asian families were also greatly underrepresented in homelessness statistics (one in 4,065 [Figure 9]).68 When viewed as a homogenous group, Asian households appear to be the least likely of the main racial and ethnic groups to experience homelessness. However, some Asian ethnicities are among the poorest and least educated of all minority groups in the country. In particular, Hmong immigrants (an ethnic group from China, Vietnam, Laos, and Thailand) and persons from Vietnam, Cambodia, Laos, and Bangladesh struggle with high poverty, language barriers, low educational attainment and per capita incomes, and overcrowding.69 For example, the low poverty rate in 2012 for all Asian families with children (11.8%) masks the fact that poverty among families born in Laos (23.2%), Cambodia (23.2%), Thailand (22.5%), and Vietnam (16.0%) was much higher.70
Cultural attitudes toward domestic violence could also be contributing to lower rates of homelessness among Asians. Domestic violence is a common reason for homelessness among women with children generally, but research within some Asian communities has highlighted cultural norms attaching strong stigma and shame to family violence that prevent women from seeking assistance. Other studies have identified cultural acceptance of violence against women. Both would discourage Asian victims of domestic violence from seeking agency-based assistance and therefore lead to data that reflect falsely low incidence. Simultaneously, the belief held by mainstream society that domestic violence is rare among Asian families serves to limit the availability of specialized supportive resources.71
Local Disparities by Race or Ethnicity
To explore the relationship between race and homelessness in more detail, Fiscal Year 2011 data were examined for white, black, and Hispanic homeless families in the largest 25 cities for which data were available (Figure 11—see next page).72 Due to their low rates of homelessness in urban settings, AIAN and Asian families were not included. Rural or suburban areas were also not considered due to a lack of available data.73 Across these 25 cities, persons in black families experienced higher rates of homelessness (1.15%) than Hispanic (0.40%) and white families (0.07%). Similarly, the proportion of persons in shelter from black families (63.0%) was much higher than the percentage of blacks in the residential population (22.3%, a percentage point difference of 40.7%). Hispanics were slightly underrepresented in shelter (29.9%, versus 31.3%), while whites were severely underrepresented (6.2%) compared with the residential population (36.8%, a percentage point difference of 30.6%).
Hope for the Future
Although government-sanctioned racial and ethnic discrimination may be a relic of the past, minority groups are still overrepresented in shelter when compared with whites due to prejudice and substantial access barriers to decent employment, education, health care, and housing. The nature and expression of biases vary by racial and ethnic group, but the effects are similar: longstanding poverty, higher unemployment, lower educational attainment and earned income, considerable gaps in wealth accumulation, and homelessness.
Despite research consistently showing that many minorities often fare worse economically, it is important to note that society is continuously changing. Just as policies and attitudes created these inequities and biases over time, if adjusted, they can actively serve to shape a more equal society for future generations. Homelessness preventative and supportive services, identification and outreach efforts, and policy formation must be culturally sensitive and informed of the inequalities leading to greater vulnerability for each racial or ethnic minority group.
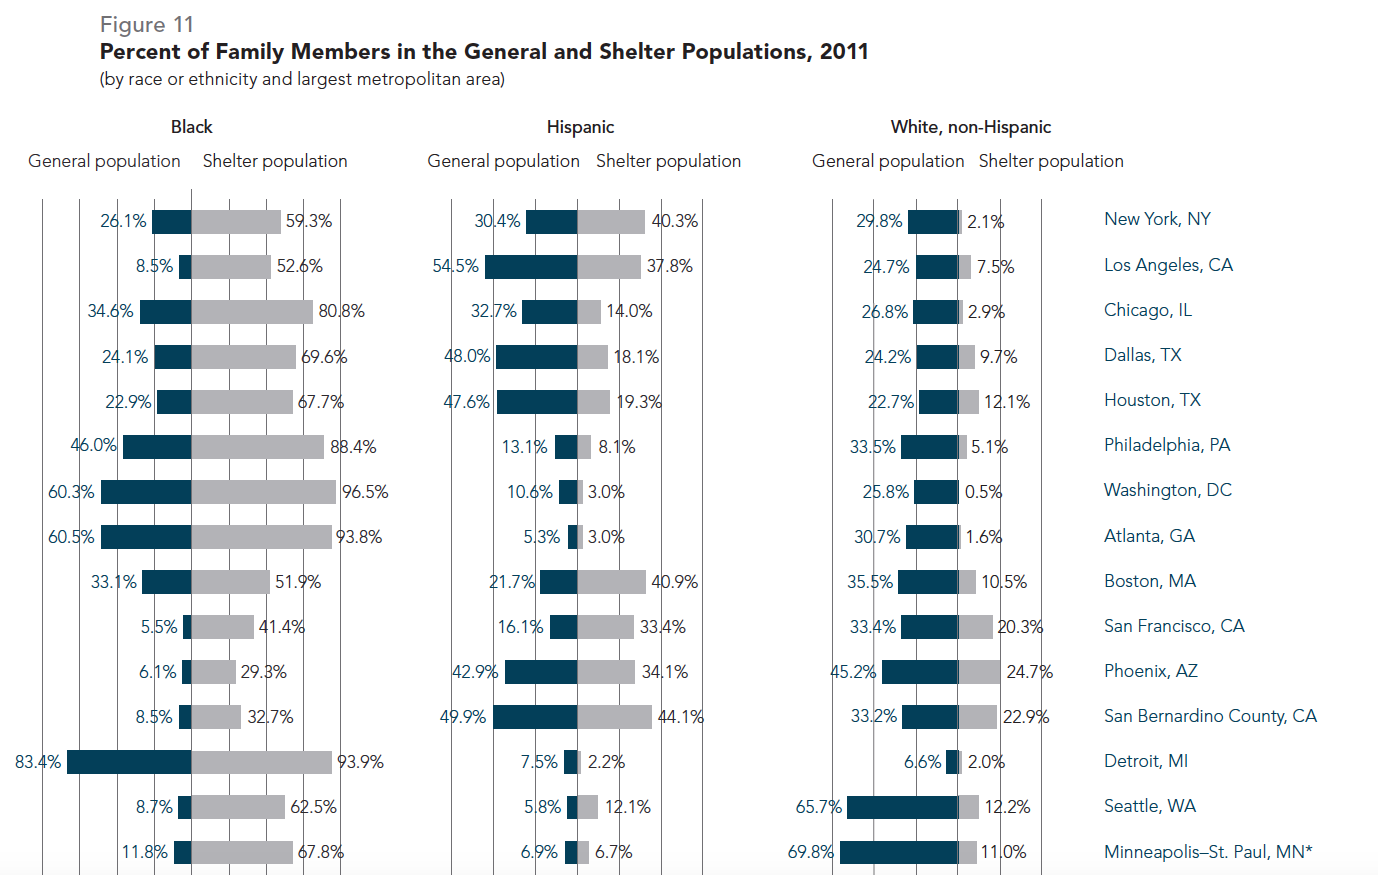
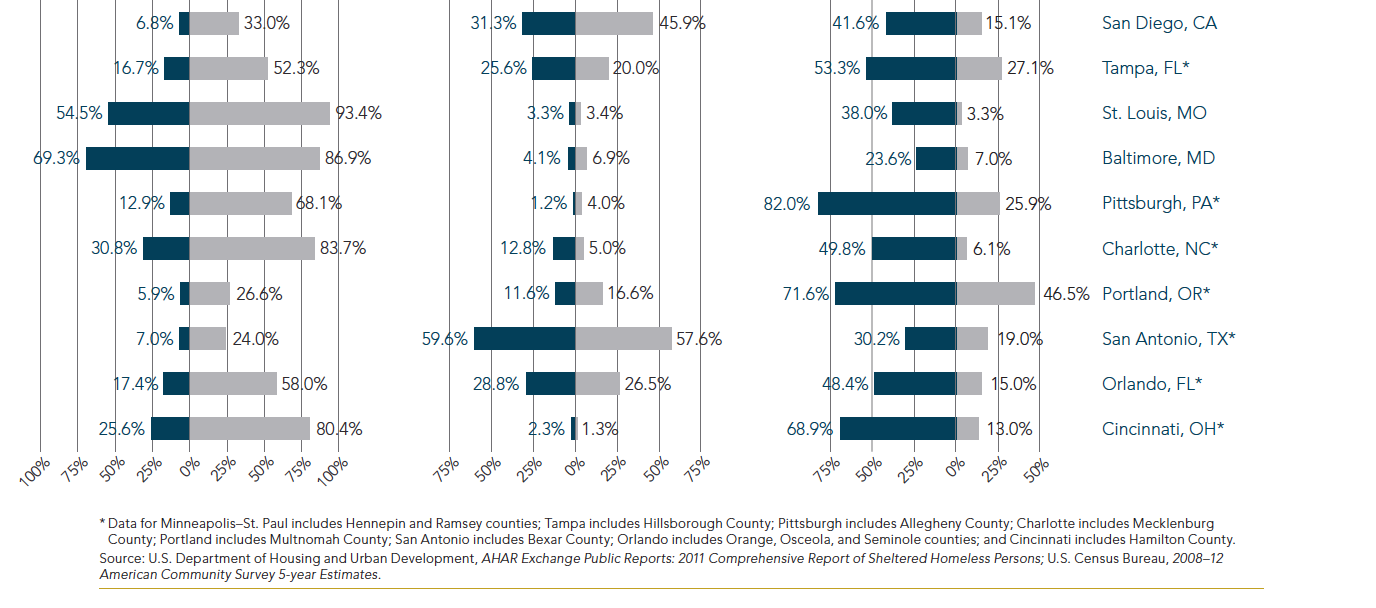
Issue 2
Macroeconomic Causes of Family Homelessness
The overall state of the U.S. economy can offer insight into both the current status of family homelessness and its future outlook. When unemployment and inflation are high, it is likely that families will have difficulty affording housing. The economic health of the country has an impact on microeconomic decisions, particularly for low-income families that are vulnerable to fluctuations in income and benefits. This chapter discusses the main macroeconomic issues that can lead to and perpetuate poverty and homelessness among families, including a lack of adequate employment opportunities, the deficit of affordable housing, the foreclosure crisis, welfare reform, limited child care availability, and low rates of health insurance coverage.
The Cycle of Poverty and Homelessness
Many of the macroeconomic causes of family homelessness are closely intertwined with the overarching issue of poverty. Between 2000 and 2012, the number of persons in families with children experiencing severe poverty—with incomes below 50% of the federal poverty level ($9,545 for a family of three)—increased by over half (56.2%). During that same time, the number of severely poor children rose by 2.4 million, a 52.2% increase.1 This is especially alarming, as poverty is often intergenerational; children who grow up in poverty are more likely to remain poor as adults. Compared with 4% of non-poor children, over one-fifth (21%) of children born into poverty spend at least half of their early adult years living below the poverty line.2
Racial minorities experience poverty at high and disproportionate rates. One-third (33.2% and 32.7%, respectively) of black and American Indian and over one-quarter (29.3%) of Hispanic families with children live in poverty, compared with 12.3% of white children. Not surprisingly, minority families are also overrepresented in homelessness statistics. In 2012, black family members experienced homelessness at a rate eight times (0.75%) higher than that of persons in white families (0.09%), while American Indian and Hispanic family members were about seven (0.67%) and three (0.28%) times more likely to stay in shelters, respectively.3
Families headed by single mothers are among the poorest households; nearly one-third (30.9%) lived in poverty in 2012, a rate five times greater than that of families with married parents (6.3%).4 These families are more likely to experience multiple chronic stressors—unemployment, inadequate and unavailable housing, poor health, and disintegrating social networks—due to their economic insecurity.5 As a result, single mothers are more vulnerable to becoming homeless. Over three-quarters (77.9%) of homeless families nationwide are headed by single women.6
The poverty rate tends to rise during periods of economic recession and fall during times of stability (Figure 1). Children are consistently more likely to live in poverty than adults. The percent of poor children decreased from 2012 to 2013, the first year-to-year decline in the child poverty rate since 2000.7
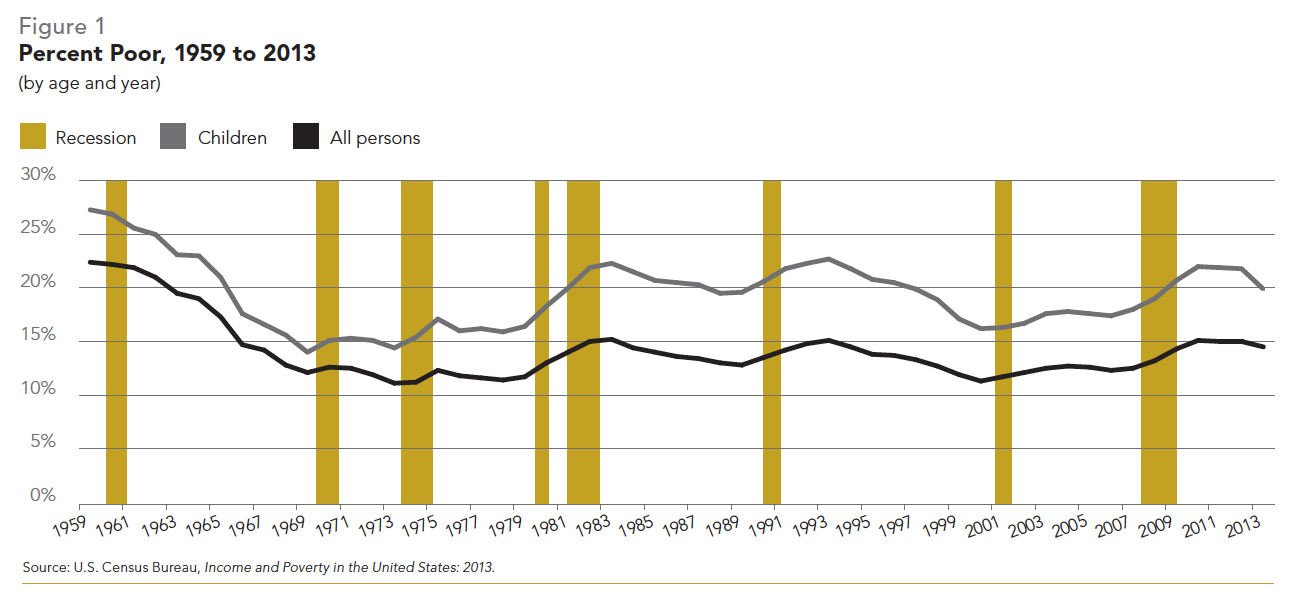
Lack of Adequate Employment Opportunities
As a result of the nationwide economic crisis now known as the Great Recession (December 2007–June 2009), unemployment doubled, peaking at 10.0% in October 2009 (Figure 2).8 Over half of American workers in 2010 were affected by unemployment, reduced work hours, pay cuts, and underemployment.9 Many unemployed adults have been forced to accept temporary or part-time positions with lower wages, fewer benefits, and less job security. Residual financial repercussions remain, with 13.8% unemployed, discouraged from finding a job, or involuntarily working part time for economic reasons in 2013.10 As of October 2014, blacks were over twice as likely to be unemployed as whites (10.9% versus 4.8%). Hispanics also experienced job loss at a higher rate (6.8%) than whites.11
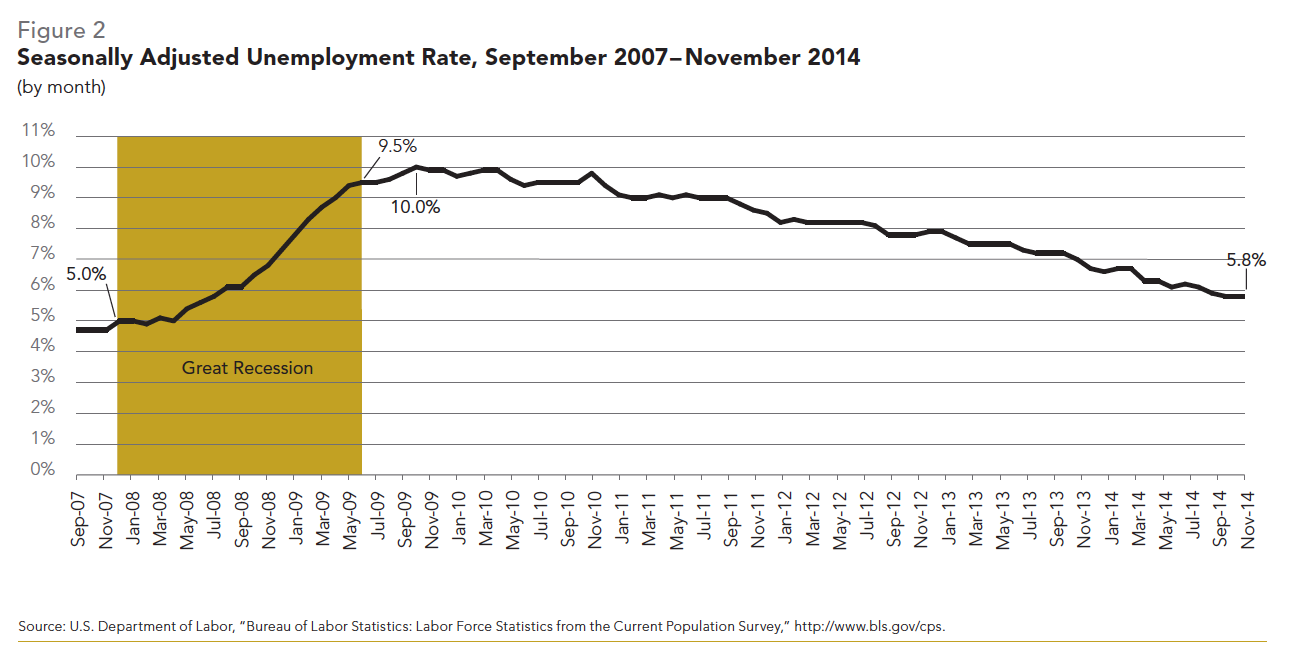
Although the loss of a job may not immediately result in housing instability, unemployment can cause families to deplete their savings and eventually lose their homes. Low-income working families—those hardest hit by the recession—often lack financial reserves or exhaust their resources, leaving them particularly vulnerable to homelessness after job loss.12 One-third (32.0%) of the 9.0 million persons unemployed in October 2014 had been looking for work for longer than 27 weeks.13 This type of long-term unemployment is even more likely to drain families’ savings and create housing instability.
The ability to obtain adequate employment to support a family and maintain stable housing is often inhibited by low educational attainment. An estimated 39– 65% of homeless mothers have not graduated high school or earned an equivalency degree, compared with 16.3% of single mothers nationwide.14 There is a strong correlation between higher levels of education and increased annual earnings; over the course of 40 years persons with bachelor’s degrees earn nearly twice as much as workers with high school diplomas. Lack of education often becomes an intergenerational problem, as children of parents without high school diplomas are more likely to drop out of school themselves.15
Discrimination in the workforce also presents a challenge for homeless families. The cumulative difference in lifetime earnings between male and female workers, the latter earning significantly less at each educational level, ranges from approximately $350,000 for high school dropouts to almost $2 million for persons with professional degrees. There is also an association between race and income: whites earn more than blacks or Hispanics in almost every income bracket. What this means for homeless and at-risk families—which are predominately minority households headed by single women—is a devaluation of their work in the form of lower wages, regardless of educational attainment level.16
Lack of Affordable Housing for Extremely Low-income Families
One of the primary reasons for homelessness among families with children is lack of affordable housing. For housing to be considered affordable, a family must spend no more than 30% of its income on housing costs.17 Extremely low-income (ELI) renter families—those earning 30% or less of their local metropolitan or rural area’s median income (AMI)—face the greatest shortfall of affordable units. After the federal government ceased development of affordable housing decades ago, the housing deficit for ELI renters has grown, reaching roughly 7.1 million units nationwide in 2011. Today’s limited housing stock, coupled with inadequate wages, leaves three-quarters (75%) of ELI families with severe rent burdens (spending 50% or more of their income on rent) and places them at risk of homelessness.18 While federal rental assistance offers relief to some families, the number of available vouchers does not meet the need. States have been forced to dedicate revenue to financing the development of affordable housing through housing trust funds.19 The U.S. Interagency Council on Homelessness (USICH) has advocated for increased access to affordable housing and targeted rental assistance as key to reducing homelessness.20
The Federal Government’s Role in Subsidized Housing
During the 1980s, the federal government essentially relinquished its responsibility for developing affordable housing for low-income families. Between Fiscal Years 1980 and 1989, the Reagan administration cut the U.S. Department of Housing and Urban Development’s (HUD) budget by three-quarters (75.3% [Figure 3]).21 Simultaneously, Congress chose not to fund new project-based Section 8 contracts, which had subsidized the construction and rehabilitation of housing units for low-income households.22 As a result, development of federally subsidized housing plummeted from more than one million units between 1976 and 1982 to only 25,000 units annually in subsequent years.23 While federal production of affordable housing declined, more households were given rental assistance.
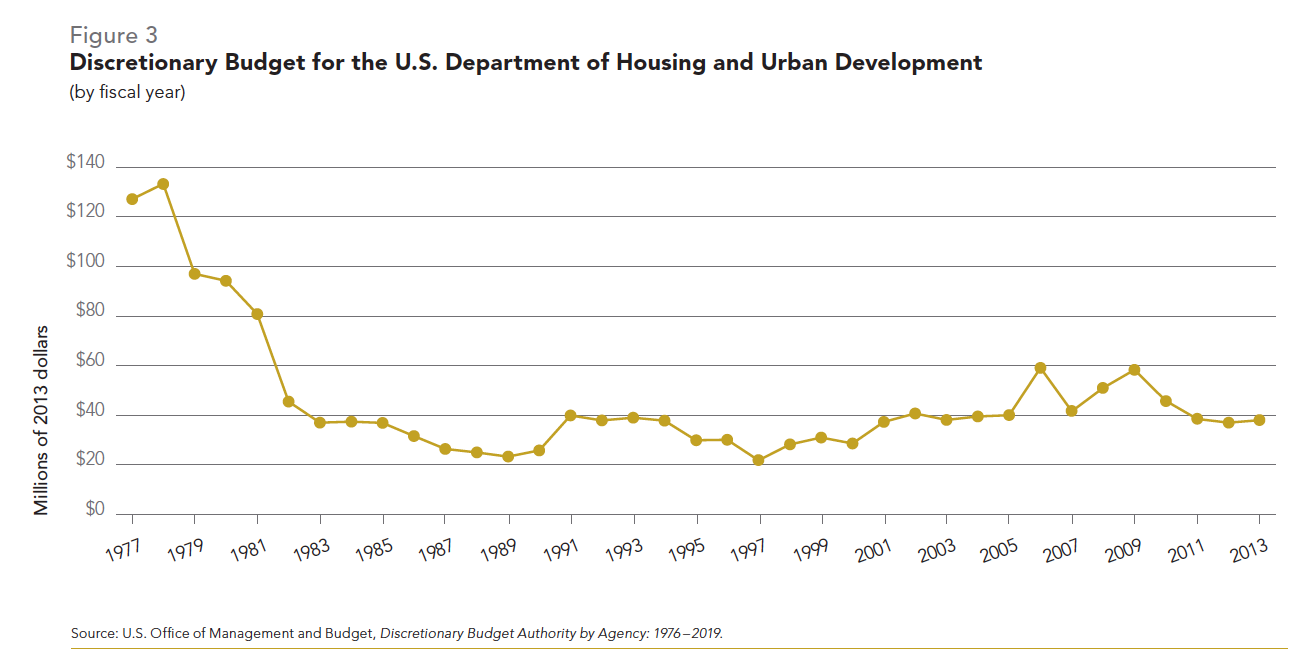
HUD’s system of Section 8 vouchers—created in 1974, but known since 1998 as the Housing Choice Voucher (HCV) program—is the largest federal rental assistance program for low-income households.24 Vouchers, which are not time-limited, are administered by local public housing authorities to subsidize rent for families earning 80% or less of AMI. Families must pay 30% of their income toward rent and utilities.25 The program targets the most vulnerable families; three-quarters of households newly admitted to the HCV program must be extremely low-income, or earning 30% or less of AMI.26
The number of households receiving housing vouchers steadily grew, from 0.3 million in 1978 to 2.0 million in 2002; however, fewer than 12,000 new vouchers have been added each year on average since then (Figure 4). A total of 180,000 new vouchers were created between 2005 and 2010, many of which targeted families whose members have specific needs, such as homeless veterans, persons with disabilities, parents reuniting with their children, and low-income families in the Gulf Coast.27 Congress had annually renewed all existing housing vouchers until 2013, when sequestration resulted in federal funding cuts of nearly $1 billion to the HCV program. Some local housing agencies have drawn down funding from reserves and utilized other funding sources in order to prevent terminating families’ assistance, but the funding short-fall may lead to fewer families being served.28 The President’s Fiscal Year 2015 (FY15) budget requested funding to fill the gap caused by the sequestration cuts and provide for an additional 40,000 new vouchers, including 10,000 specifically for homeless veterans.29 These efforts still fall short of the need; though up-to-date data are not available, a 2004 study by the National Low Income Housing Coalition (NLIHC) found that waiting lists for vouchers included over one million families, and two-fifths (40.3%) of public housing agencies had closed lists.30
The Widening Rent-income Gap
While the lack of affordable housing production in the 1980s created an increased need for rental assistance, the co-occurring surge in the number of ELI renters further exacerbated the housing crisis. Between 1978 and 2011, the number of ELI renters doubled to nearly 12 million households (Figure 4).31 In 2011, there were only 4.2 million units available for the 12 million ELI renters. Although there were 6.9 million affordable units in existence, renters with higher incomes occupied nearly two-fifths (38.4%) of those units.32 For more on the number of affordable and available units for ELI renters in each state, see the State Dashboards part of the Almanac.
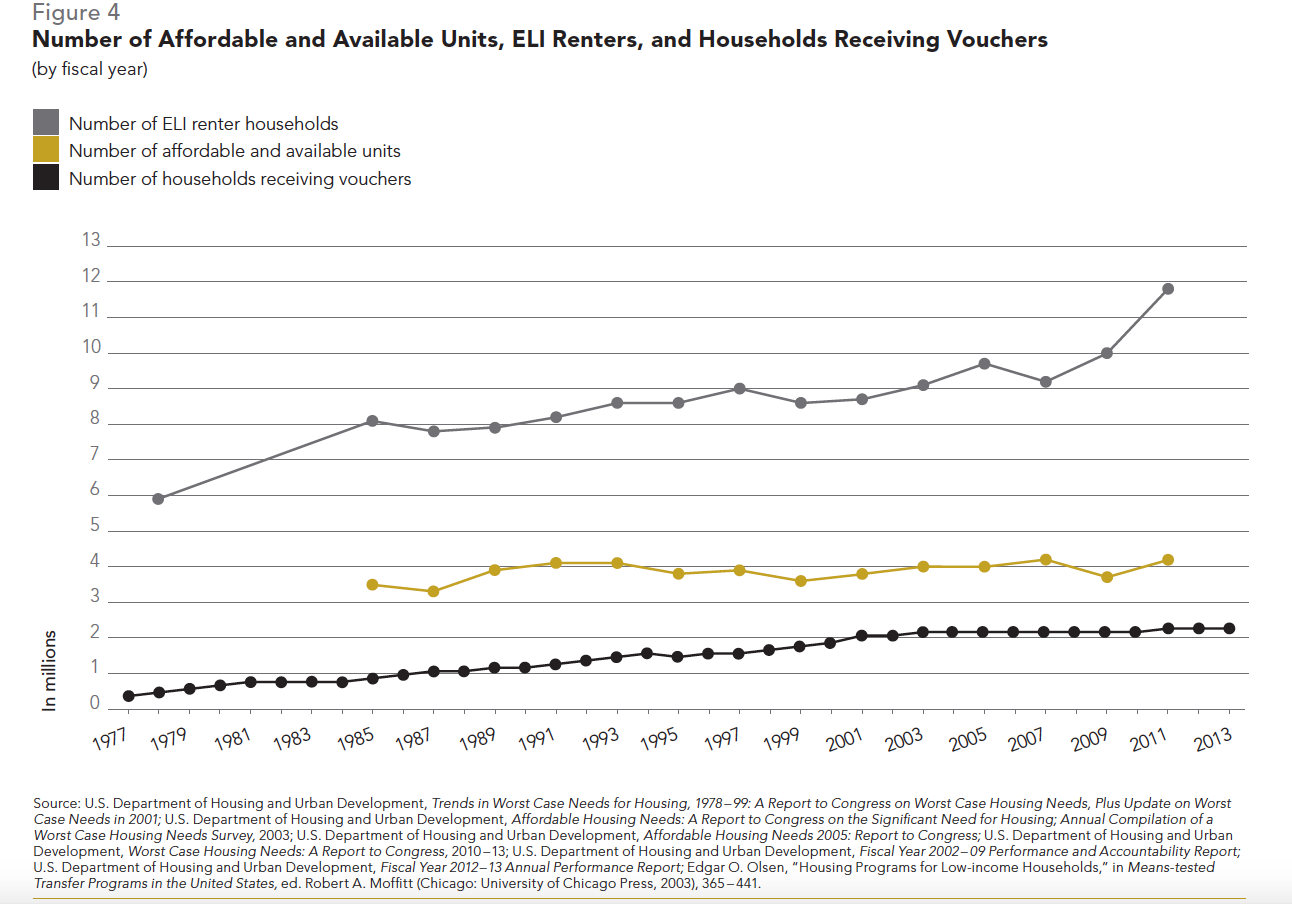
Numerous national studies have concluded that the increased demand for affordable units has caused rents to rise faster than household income. According to the NLIHC, the national Fair Market Rent (FMR) for a two-bedroom apartment in 2014 was $984 per month, a 57.4% increase from 2000. In comparison, the national household median income grew only by 21.0% to $51,017 in 2012, the latest year for which data are available. To afford an apartment at FMR without rental assistance, a family has to earn $39,360 annually or $18.92 per hour, a rate more than twice (161.0%) the federal minimum wage ($7.25). Minimum wage earners would have to spend over three-quarters (78.3%) of their income on housing costs alone, not including food, child care, transportation, and other basic living expenses.33 Specific information for each state on the relationship between the minimum wage and affordable housing is examined further in the Almanac State Dashboards.
For many families, the gap between household income and cost of housing results in an increased risk of homelessness. In 2012, more than half (52.0%) of all renters nationwide were cost-burdened (spending 30% or more of their income on housing expenses), with more than one-quarter (27.0%) severely cost-burdened (spending 50% or more of their income on rent).34 While households in communities nationwide experience difficulties affording housing, the concentration of homeless families in certain areas of the country indicates that local factors—including unemployment, underemployment, and low earnings—also impact rent burdens and housing instability.35
Insufficient Funding for Affordable Housing
The number of HCVs has remained stagnant over the last decade, despite research indicating that vouchers are one of the best solutions to prevent future episodes of homelessness. In a HUD study conducted between 1999 and 2006, families eligible for or receiving cash assistance who obtained vouchers experienced a 74% reduction in future episodes of literal homelessness and a 69% decrease in living doubled up with another household. Subsequently, HUD has directed local public housing authorities to admit more homeless families into public housing.36
Since the late 1970s, in response to the lack of federal support, state and local governments have established housing trust funds dedicated to financing affordable housing. Independent of national-level policy, nearly 700 housing trust funds exist in states, counties, and cities across the country, collecting a combined total of more than $1 billion a year (compared with HUD’s $19 billion budget for Section 8 vouchers in FY14). For every dollar invested by state trust funds in affordable housing, an average of nearly seven dollars is leveraged through public and private monies.37 Of the 700, 57 state-level trust funds have been established, representing 47 states and the District of Columbia. A majority of states (36) have financed their funds through dedicated public revenues (including real estate transfer taxes and documentary stamp taxes), while others receive government appropriations or other public funds.38 From 2009 to 2010, one-quarter (24.4%, or ten out of 41) of states witnessed an increase in funding. However, more than half (51.2%) of all states with trust funds experienced a decrease in funding as a result of either policy changes (29.3%) or economic conditions (22.0%).39 This trend continued in 2011, with revenues for state housing trust funds generally declining.40
To increase and preserve the supply of affordable rental housing, the federal government created the National Housing Trust Fund (NHTF) under the Housing and Economic Recovery Act of 2008. The NHTF is the first new federal housing assistance program to target ELI renters since the founding of the Section 8 program in 1974. The block grant provides states and territories with monies to build, rehabilitate, and maintain affordable rental homes for ELI families. USICH identified the NHTF as a key component of the federal strategy to end homelessness, but the initiative only began to be funded in December 2014.41 Monitoring the implementation of the NHTF is necessary to ensure that the needs of homeless families will be adequately addressed.
Foreclosures and Homelessness: Understanding the Connection
The number of high-cost, subprime mortgages issued to lenders increased rapidly from 2003 to 2006, initiating a foreclosure crisis that spiraled into the Great Recession (December 2007 through June 2009).42 The housing market, the strength of which is commonly measured by the change in the actual resale value of single-family homes, fell sharply as the number of foreclosures skyrocketed (Figure 5). Initially, borrowers could avoid default by refinancing or selling their homes, but by late 2006, the housing market had begun to collapse and the number of delinquent loans had surged. In 2008 and 2009, propelled by escalating unemployment and a deepening economic downturn, the crisis spread to the prime mortgage sector and has become a protracted problem (Figure 6).43
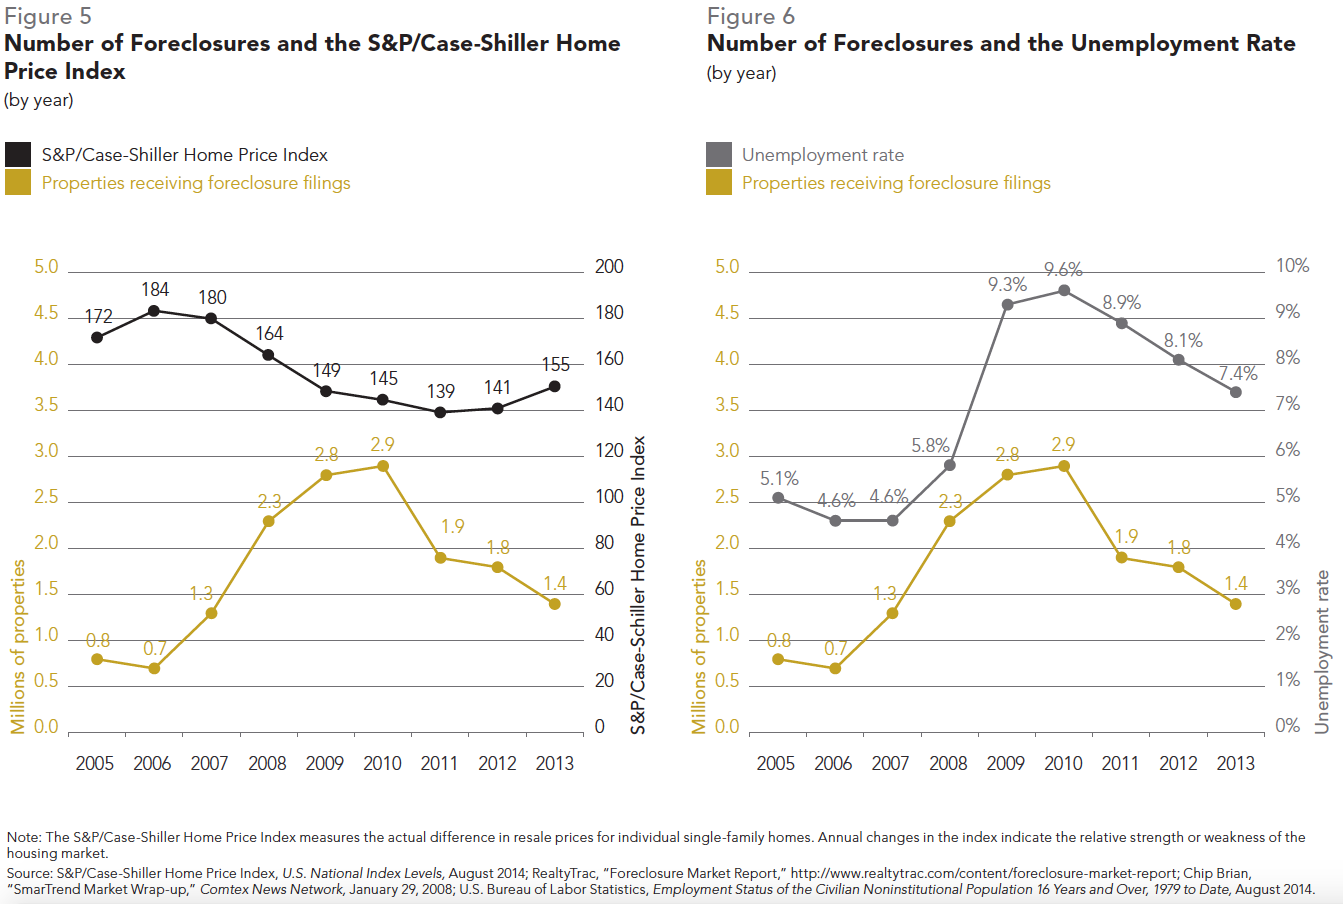
In 2010, 2.9 million properties received foreclosure filings, an increase of 239.1% since 2005, representing the height of the effects of the recession. The next two years showed improvement, with 1.9 million foreclosure filings in 2011, followed by 1.8 million in 2012. Foreclosures continued to decline in 2013, but remained almost twice as high as pre-recession numbers. As home values appreciate, the foreclosure rate tends to decrease. A January 2014 analysis noted the significant increase in property values in the previous year, projecting some volatility in the housing market as home value appreciation slows and the economy continues its recovery.44
The increase in family homelessness during the Great Recession can be partially attributed to the foreclosure crisis, although the extent of the relationship is unclear.45 Studies that examined the rate of homelessness caused by foreclosure are limited either to service-provider perceptions or single localities and provide varying estimates. According to a 2009 survey of service providers, the percentage of clients who were homeless due to foreclosure ranged from 5% (the estimate of those working at homeless shelters) to 20% (the figure given by service-only providers), with 10% being the median.46 In a 2010 survey of school districts and state departments of education, 38% of respondents identified the foreclosure crisis as a reason for the rapid increase in the number of homeless students since the 2007– 08 school year.47 Researchers evaluating a homelessness prevention program in New York City in 2011 estimated that for every 100 properties beginning the foreclosure process, three to five additional households entered shelter.48
Welfare Reform and Homeless Families: The Big Disconnect
The Personal Responsibility and Work Opportunity Reconciliation Act (PRWORA, also known as “welfare reform”) of 1996 was legislation designed to restructure federal welfare entitlement programs to end long-term dependence on government aid. PRWORA replaced multiple funding streams with the Temporary Assistance for Needy Families (TANF) program and made adjustments to the Food Stamp Program, which dramatically reduced participation in both programs (Figure 7). TANF’s original aim was to provide cash assistance to low-income families with children or expectant mothers for up to five years with the condition that parents meet strict work requirements. In all but one state (Alaska), the maximum amount of cash assistance offered by TANF for a family of three is less than 50% of the federal poverty level—in 34 states it is under 30%—inadvertently putting many families at risk of homelessness.49 Furthermore, TANF benefits, at a national monthly average of $424, provide less than half the cost of a two-bedroom apartment at Fair Market Rent in half (25) of states.50 Even families moving from assistance to work are not always able to climb out of poverty. As TANF caseloads declined by 22.6% from 2000 to 2012, the number of families with children living in extreme poverty (less than 50% of the federal poverty level) increased by two-thirds (66.9%). The Government Accountability Office notes that 800,000 fewer children would live in extreme poverty were it not for the sharp decrease in participation.51 Although TANF is an essential part of the safety net for thousands of low-income and homeless families, its current design makes it difficult for families to reach self-sufficiency.
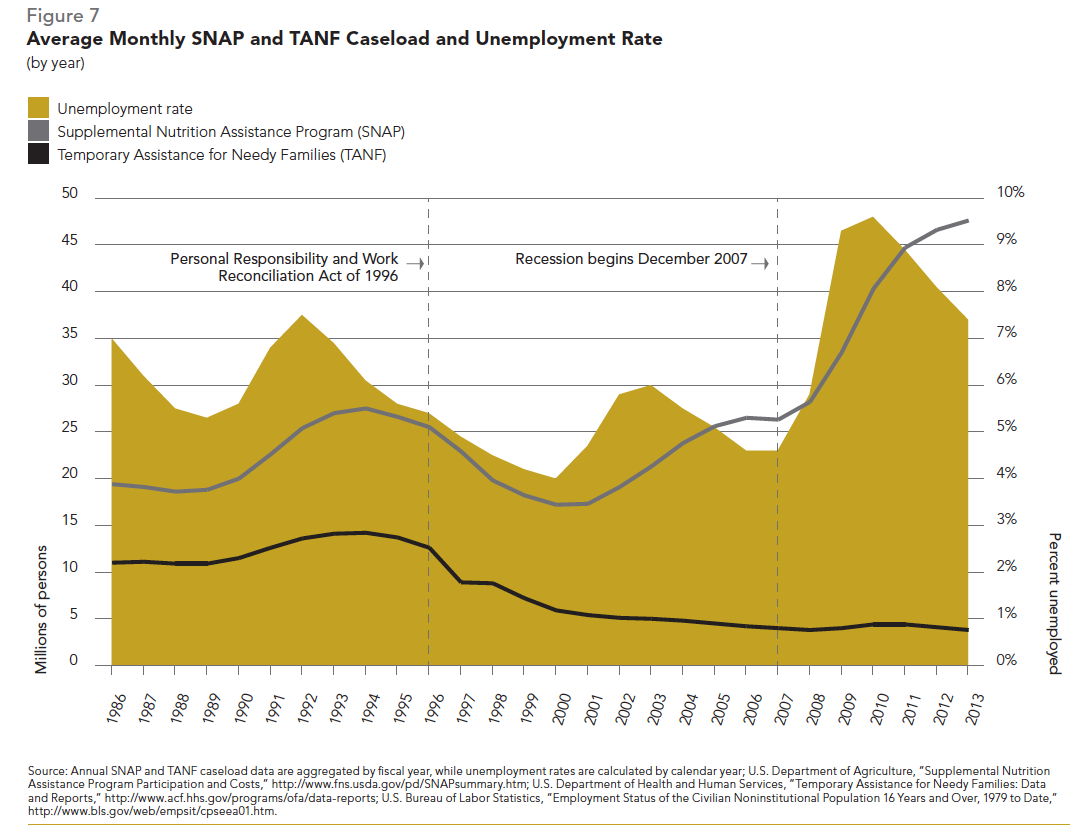
Since TANF’s creation, federal policy has influenced states to focus their efforts on decreasing caseloads through restrictive eligibility policies, formal diversion programs, mandatory job searches, and work requirements. These policies resulted in a 63.9% decrease in the total number of families enrolled in TANF between 1996 and 2013.52 In 2011, just two-fifths of eligible families received aid, compared with four-fifths pre-reform.53
Critics point to one problematic element of the program: the caseload-reduction credit, which incentivizes states to decrease their caseloads regardless of clients’ employment status. Federal law penalizes states financially if they do not have at least 50% of all single and 90% of all two-parent families receiving TANF participating in specified work-related activities. The credit allows states to lower their mandated work-participation proportions by the percent by which they decreased their overall TANF enrollment.54
The Deficit Reduction Act of 2005 reset the base year for the caseload-reduction credit from 1995 to 2005, as states had already greatly reduced their caseloads since TANF’s creation. The act also changed how states calculate their work-participation rate, by expanding the category of persons deemed “work-eligible” to include non-recipient parents living with children who are receiving assistance.
In order to meet the higher rates, many states adopted stringent diversion strategies in an effort to remove families needing minimal assistance from their potential caseloads. These policies contributed to an 11.5% drop in caseloads from 2005 to 2007 (before the economic downturn began).55 Thirty-three states provide for formal diversion programs whereby families may choose to receive one-time cash payments in lieu of monthly benefits, and 18 states require mandatory job search at application.56 Diversion strategies do not always target the appropriate families; anecdotal evidence suggests that many families are misled about their eligibility in an effort to deter new applicants and that clients receiving benefits are often wrongfully terminated from the program.57
Closed TANF Cases Do Not Indicate Family Self-sufficiency
TANF’s end goal of families attaining self-sufficiency through employment is not reached in the majority of cases. Less than one-fifth (17.4%) of case closures in FY12 were due to employment, meaning that families’ incomes exceeded ongoing eligibility amounts (Figure 8). Maximum earnings that recipients can retain while remaining eligible for assistance vary greatly across states and often fall beneath the federal poverty level. The national average maximum earnings for families in 2013 ranged from $1,199 during the second month of assistance to $965 in the 25th month.58 Although a family’s income may be too high for them to qualify for cash benefits, it may not be enough to fully meet their financial needs. Mothers leaving TANF typically enter jobs that pay between $7 and $8 an hour.59 Low-wage jobs often do not provide benefits or opportunities for advancement and frequently do not accommodate the scheduling needs of single parents, which can result in further housing instability for families.60
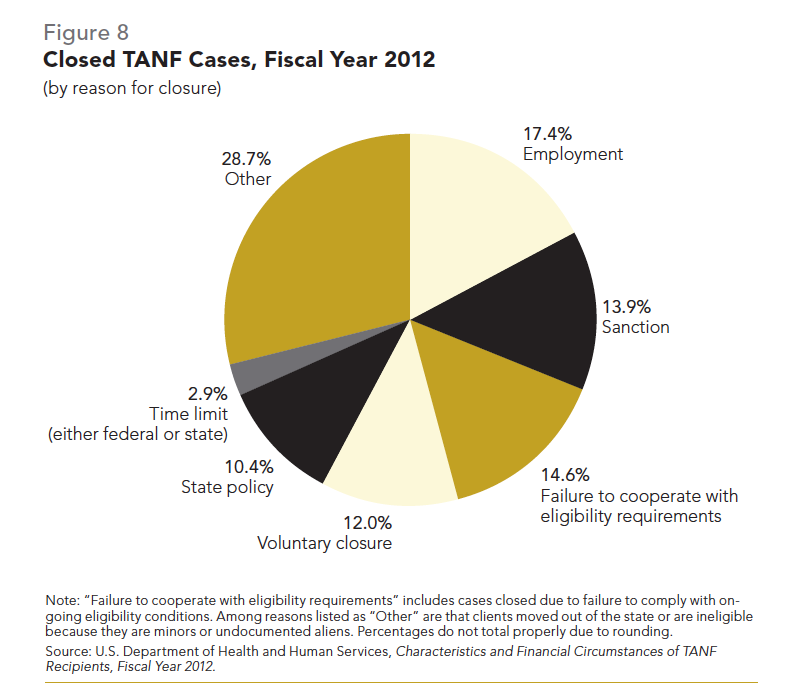
In FY12, 13.9% of case closings nationwide were due to sanctions. Federal rules sanction families for not cooperating with work or child support requirements. Many states impose additional penalties for non-compliance with requirements such as children’s immunization recommendations and school attendance. States do allow children to receive aid if they either live without their parents or have parents who do not qualify for benefits; nearly half (46.7%) of all cases in FY12 were “child-only” cases.61 Studies on the well-being of TANF recipients find higher rates of hardship among sanctioned families, including residential instability, food insecurity, and inability to obtain medical care for children.62
Helping Families Without TANF Cash Benefits
Families who have lost their benefits or who are unable to meet TANF’s strict work requirements can still use the program’s other services. Most states spend TANF funds not used for cash assistance on a range of additional services and work supports, including child care, transportation, and housing.63 TANF-funded child care reduces one of the main financial burdens facing mothers living in poverty, who spend one-fifth (19.6%) of their family income on child care every year.64 Many states offer vouchers or payments for car repair to aid families in finding and maintaining employment. Funds may also be used for short-term rental assistance, eviction prevention, and security deposits to help families exit or avoid shelter.
Since the program’s inception, the ratio of cash assistance to work-support funds has changed; in FY97, 73.1% of all funds went toward basic cash assistance, compared with 27.6% in 2013.65 A strong economy resulted in falling case-loads, causing states to reinvest TANF funds in other programs to support low-income working families. The recession led to a growing proportion of families in need of basic cash assistance, but states are unable to reclaim these dollars for cash assistance. Instead, states responded to the crisis by tightening eligibility rules and cutting benefits. In 2011, cuts to cash assistance and other TANF-funded programs affected 700,000 low-income families, over one-third (37.5%) of all families receiving benefits nationwide.66 Many states also took advantage of the law’s flexibility to divert federal monies for services that are not in the program’s design, such as foster care, in order to cover their own budget gaps.67
Lack of Funding Hinders TANF’s Effectiveness
Insufficient funding has increasingly become a problem for TANF as more struggling families fall into poverty due to the distressed economy and declining wages. TANF’s appropriation has been fixed at $16.5 billion since the program’s inception in 1996; however, over one-quarter (28%) of TANF’s value has been lost due to inflation.68 TANF’s block grant structure is also not responsive to growing need—such as when the economy weakens or the number of families living in poverty rises—which has put greater strain on states. The TANF Contingency Fund—originally financed at $2 billion in 1996 to assist states in times of economic stress—has not served its purpose due to outdated restrictive eligibility rules, lack of state accountability for use of funds, and insufficient capital. The original allocation was used up by December 2009 and subsequent funding was depleted at the end of 2010.69 While Congress has provided annual appropriations for the TANF Contingency Fund, including $610 million in FY14, these monies were already allocated as of March 2014.70
Food Insecurity and SNAP Enrollment
Policies to reform cash assistance also affected participation in the Supplemental Nutritional Assistance Program (SNAP), formerly the Food Stamp Program. The SNAP caseload fell by over one-third (37.4%) between 1994 and 2000 and then more than doubled (134.4%) between 2000 and 2010, continuing to increase each year since then (Figure 7). Studies concur that economic factors, commonly measured using the unemployment rate, are the main driver of SNAP participation; low unemployment accounted for 31% of the decline in the 1990s and high unemployment was responsible for 27% to 55% of the rise in the 2000s. The sharp decrease in government cash assistance to families following PRWORA explained 13% of the reduction in SNAP enrollment in the 1990s due to the adoption of strict sanction policies. SNAP policy changes in the early 2000s to expand eligibility, simplify enrollment, and improve outreach caused 16% to 20% of the increase in the decade.71
Research examining SNAP participation during 1996 –2004 indicates that receiving SNAP reduces the likelihood of food insecurity by nearly one-third (31.2%) among housed, low-income clients, consistent with 2012 data that also found a one-third reduction.72 Other studies have shown that homeless households who regularly stay in shelters or are enrolled in SNAP have decreased food insecurity.73 Furthermore, increased SNAP benefits have been associated with lowered probability of homelessness, as food stamps free up other income sources for necessities such as housing.74
Lack of Child Care Exacerbates Instability
Access to reliable child care supports homeless parents’ ability to work and gain financial stability. Without first arranging care for their children, homeless mothers cannot look for work or participate in the education and training programs necessary to improve their employability.75 Studies have shown that having subsidized child care has a positive effect on low-income parents’ work participation.76 By supporting parents’ ability to work and meet more of their families’ basic needs, child care strengthens a family’s overall economic security and helps prevent future episodes of homelessness. Disruptions in child care, on the other hand, can lead to homeless or at-risk parents losing much-needed income or even their jobs.
A 2012 ICPH report found that homeless mothers are less likely to receive child care subsidies than both mothers who are at risk of becoming homeless and mothers who are stably housed.77 Research has also shown that low-income families receiving subsidies have higher incomes and report fewer risk factors than eligible non-recipients, which suggests that the child care subsidy system is particularly difficult for more vulnerable parents to navigate.78
One of the most significant obstacles homeless parents face in accessing high-quality care is the expensive price. In 2012, the average annual cost of center-based care for a four-year-old was $7,817, ranging from $4,312 in Mississippi to $16,908 in the District of Columbia.79 Subsidies bring the cost of care down substantially—the average fee for subsidized care in FY12 equaled 5% of a family’s income, or $990 a year for a family of three at the federal poverty level.80 However, even a reduced fee could be unmanageable for homeless families with few, if any, financial resources.
Like many low-income families, those experiencing housing instability often work in low-wage jobs with nonstandard and unpredictable hours and little workplace flexibility. Finding high-quality child care providers who can accommodate their work schedules, which may include overnight or weekend shifts, can be difficult.81 As of 2013, only 11 states had higher reimbursement rates for providers offering subsidized care during these ‘nontraditional’ hours.82 The unstable employment patterns and high mobility that accompany homelessness can also cause homeless children to be absent from care frequently. Families can lose their subsidies for excessive absences, and providers who are reimbursed based on the number of hours of care they provide can lose revenue.
Lack of information and misinformation can also limit homeless parents’ child care choices. Low-income families tend to rely on informal sources and networks such as family and neighbors to help them make decisions about child care.83 Many parents do not know that they could get help paying for child care; those who know can be deterred from utilizing child care subsidies due to the complexity of the application process and both perceived and real eligibility restrictions, such as the program’s documentation requirements.84 At least 24 states require families applying for child care to provide birth certificates or other documentation difficult for homeless parents to locate. The Child Care and Development Block Grant (CCDBG) Act of 2014 requires states to ensure homeless children are enrolled while documentation is obtained and to provide a grace period for homeless children to meet immunization requirements.
Broad guidelines for administering the Child Care and Development Fund (CCDF) are set at the federal level, but states largely determine how their share of CCDF funding is spent and who ultimately is eligible for subsidized care. As CCDF is a block grant and not an entitlement program, states are not mandated to provide assistance to all eligible applicants. HHS estimates that only one in six eligible children receives assistance.85 Although the CCDBG Act of 2014 makes significant quality improvements to the program, it fails to adequately address the shortage of subsidies. In setting their eligibility guidelines and priorities, states have the opportunity to eliminate several of the structural barriers homeless families face in accessing child care. Yet, only nine states include homeless children as a priority population to serve, and only seven states provide care for parents to look for housing.86
Lack of Health Insurance
The lack of comprehensive health-insurance coverage for families living in poverty is one of the underlying structural causes of homelessness. In 2012, 48 million or 15.4% of Americans, including 6.6 million children (8.9%), were without health insurance. Persons living below the federal poverty level were almost twice as likely to lack insurance (29.6%).87 For uninsured families, one serious illness or injury can result in insurmountable debt. Over half (62.1%) of all personal bankruptcies in the country are attributed to health problems.88 The financial burden of illness— high out-of-pocket medical expenditures and decreased income due to job loss or reduced work hours—makes homelessness a real possibility for many families. Expanding health insurance is an important step; without access to affordable health care, homeless families risk worse health outcomes that only hamper their ability to become self-sufficient.
As a result of these obstacles, the emergency room is frequently the first choice for homeless families requiring medical attention. Over one-third of homeless families in Los Angeles use emergency departments or community clinics for preventive care (35%) and sick care (37%).89 Aside from their high costs to society—hospitals account for 63% of the $40.7 billion in uncompensated care primarily funded by the government—these services do not adequately address chronic health problems, treating only immediate symptoms and health crises.90
The Patient Protection and Affordable Care Act (ACA) was signed into law in March 2010 to reduce the cost of health care and expand health insurance to all Americans, including low-income individuals who are not enrolled in or were previously ineligible for Medicaid. Starting in January 2014, states were allowed to expand Medicaid coverage to all persons whose earnings are at or below 138% of the federal poverty line. As of January 2015, only 28 states and the District of Columbia have chosen to do so (Figure 9).91 Capacity was also increased for U.S. Health Resources and Services Administration health centers, including Health Care for the Homeless programs, which receive 8.7% of total funding for all health centers.92
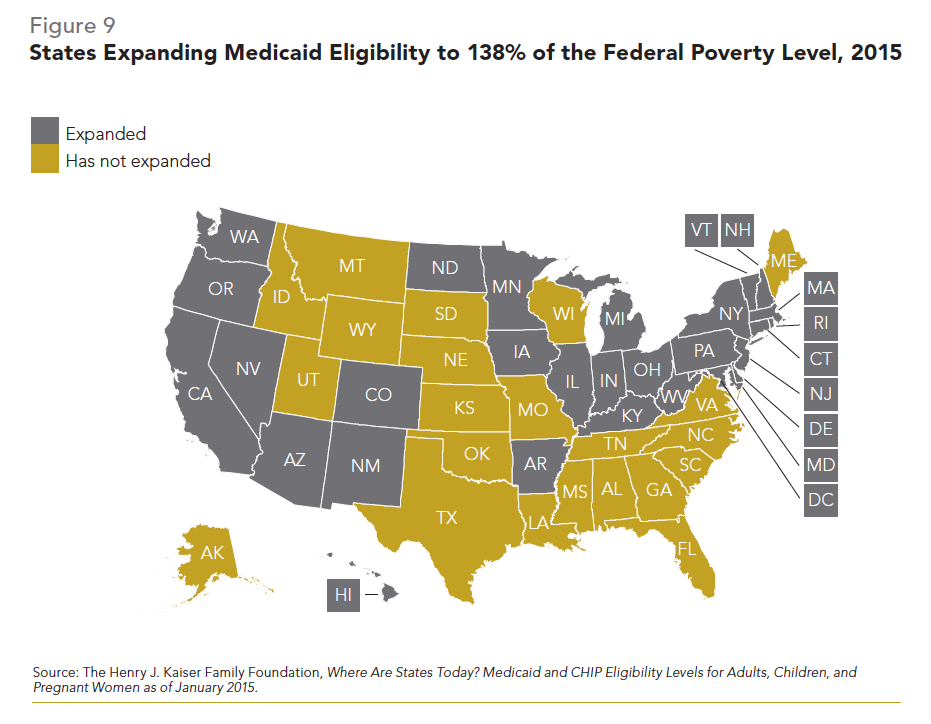
The shortage of Medicaid providers continues to pose a challenge for families with limited resources. Sixty-two million Americans (19.8% of the total population) lack adequate access to primary health care, which is due, in part, to the scarcity of Medicaid physicians in their communities.93 To incentivize physicians to accept patients with Medicaid, the ACA provided a temporary increase in reimbursement rates for 2014. Few states chose to continue this rate increase for 2015.94
Issue 3
Effects of Homelessness on Families and Children
Homeless families often face challenges in addition to attaining and maintaining housing. Homeless mothers are more likely than housed mothers to experience domestic violence, mental illness, and substance abuse. A lack of access to medical care results in poorer health outcomes and higher rates of HIV/AIDS among homeless parents. For these and many other reasons, homeless children are more likely than their housed peers to suffer from developmental delays; chronic and acute health problems; and behavioral, emotional, and mental health issues. Insufficient access to a nutritious diet negatively affects homeless students’ classroom performance. Additional stressors can include abuse or exposure to family and community violence. The myriad negative effects that homelessness can have on families cannot be understated. This chapter discusses the short and long-term consequences for families that experience homelessness because this knowledge is essential for the formation of effective interventions.
Domestic Violence
Family homelessness is strongly linked to domestic violence. Households consisting of a mother with children are ten times more likely to experience intimate partner violence than their married counterparts, and six times more likely than single females without children.1 On one day in 2013, 16,917 adults and 19,431 children escaping abuse were served in emergency domestic violence shelters and transitional housing throughout the country, with another 30,233 adults and children receiving non-residential assistance (Figure 1).2 These numbers do not capture the total need for services as only one-quarter to one-half of women who experience domestic violence report their abuse and many programs place survivors on waiting lists due to underfunding.3 Domestic violence has a devastating effect on women and children nationwide, and its impact is exacerbated by gender disparities and other forms of inequality. Prevalence among low-income and homeless women is especially high; 91.6% of homeless mothers have experienced severe physical and/or sexual abuse during their lifetimes.4
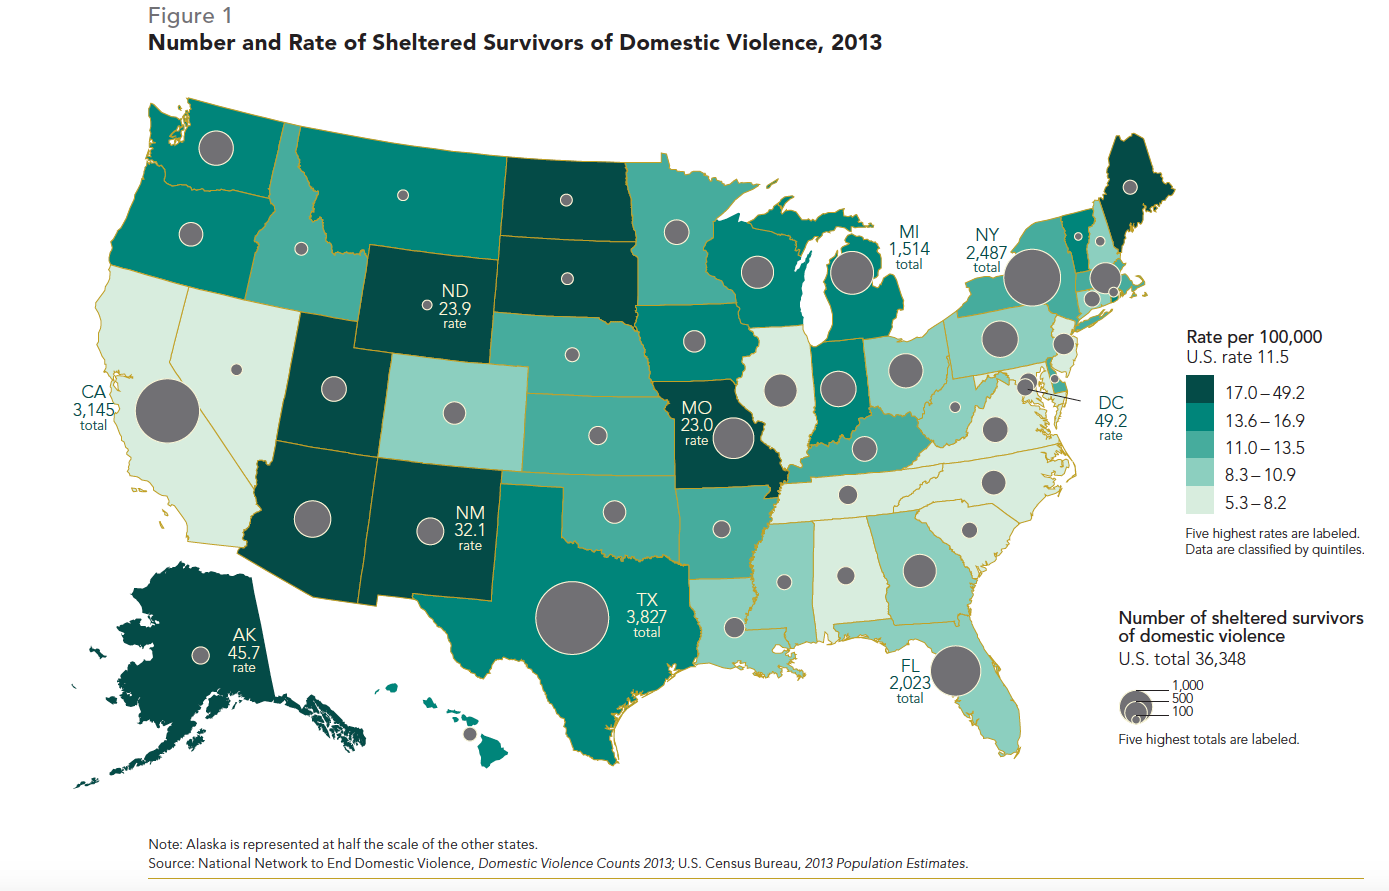
Each year, approximately 15.5 million children are exposed to domestic violence, which can have long-lasting detrimental effects. Children who grow up in households where domestic violence is prevalent are more likely to abuse drugs and alcohol, attempt suicide, and have mental health problems. These children often experience violence themselves due to the intergenerational nature of the problem. Men who witnessed and experienced abuse as children are almost four times more likely to perpetrate violence as adults. Women who experienced childhood physical or sexual abuse are three times more likely to be victimized as adults.5
Women facing domestic violence experience high rates of depression, post-traumatic stress disorder, and physical health problems. These women are more likely to abuse alcohol and drugs (15 and nine times, respectively) than women who have not suffered from violence.6 Hospitalization and trauma recovery may necessitate leaves of absence from work, negatively impacting women’s ability to support their families. Nationally, survivors lose nearly 8.0 million days of paid work due to violence each year. Physical assault and rape result in an average of $4.1 billion in direct medical care and mental health bills and $1.8 billion in indirect costs of lost productivity and present value of lifetime earnings.7
Poverty status is linked to higher rates of domestic violence; women in the lowest pay category (earning less than $7,500 annually) and those living in economically disadvantaged neighborhoods experienced more than six times the rate of abuse of women earning over $50,000.8 The power and control present in abusive relationships can lead to isolation and financial dependency, which are especially detrimental for those with already limited incomes and poor credit histories. Without social and economic support, survivors are left with few alternative housing options. A Minnesota study revealed that nearly one in three women listed domestic violence as a primary reason for their homelessness. Almost half (47.5%) of homeless women in Minnesota reported staying in abusive relationships because they had nowhere else to go.9 Because battered women usually attempt to leave their abusers several times before successfully escaping, their children may experience multiple episodes of homelessness.
Food Insecurity
Due to their low incomes and housing instability, homeless families and individuals experience higher levels of food insecurity—defined by the U.S. Department of Agriculture as limited or unstable availability of adequate amounts of nutritious food—than their housed, economically disadvantaged counterparts.10 While the prevalence of food insecurity among poor but housed families with children is well-documented (42.1% in 2013), national statistics on the number of food-insecure homeless families are not available.11
Food pantry and soup kitchen records offer some evidence of the high prevalence and nature of food insecurity among homeless households. Approximately 1.1 million homeless households nationwide accessed shelter in 2012, and the following year, at least 759,000 sheltered and unsheltered homeless households received emergency food assistance through the Feeding America network of pantries, soup kitchens, and other partner agencies. If the definition of homelessness were expanded to include those who are doubled up, the number of homeless households receiving food aid would significantly increase. In 2013, 23.3% of Feeding America clients reported living with another person or family within the past year. More than half of the total 15.5 million families served in 2013 had to choose between having enough food and at least one other everyday necessity, such as utilities (69%), rent or mortgage (57%), or medical care (66%).12
Food insecurity is particularly harmful for children. Food-insecure homeless and low-income children have worse physical and mental health, greater developmental delays, and poorer academic performance than their food-secure peers. Infants and toddlers are twice as likely to have fair or poor health, two-thirds more likely to experience developmental risk, and one-third more likely to be hospitalized if they are food insecure.13 Those with severe hunger experience almost twice the risk of chronic health conditions and over twice the risk of anxiety.14 Preschoolers facing food insecurity are almost two-thirds more likely to demonstrate behavior problems in the form of aggression, anxiety, depression, inattention, or hyper-activity.15 Food insecurity is also predictive of worse reading and mathematics scores among school-aged children.16
Food insecurity among pregnant mothers has negative health consequences for their newborn children, leading to low birth weights and greater risks for some birth defects.17 Mothers who are low-income or socially disadvantaged utilize the least prenatal care and have the highest infant mortality and premature birth rates.18 Breastfeeding mitigates demographically-based disadvantages; in one study, infants of immigrant mothers in food-insecure households showed fewer signs of negative health outcomes—such as reports from their mothers of fair or poor health, acute hospital admissions, and low weight for age—when they were breastfed.19
The Health Status of Homeless Parents …
While no data exist exclusively for adults in families, homeless persons experience three to six times the rates of serious illness and injury as the general population.20 Homelessness increases the risk and severity of certain medical conditions, including upper respiratory infections, heart disease, hypertension, gastrointestinal problems, and HIV/AIDS. Ensuring proper nutrition, which can help prevent many chronic diseases, is challenging for homeless parents. With limitations in income and access to nutritious foods, many typically eat diets high in fat, cholesterol, and sugar.
Among homeless mothers, heightened risk of injury from physical violence, mental illness, and substance abuse pose serious health concerns.21 Abused women are more likely to suffer from depression. A Massachusetts study found that homeless mothers have three times the rate of post-traumatic stress disorder and more than twice the rate of major depressive disorders and substance abuse of those of women in the general population.22 Health disparities such as these can cause homeless parents to struggle to meet the needs of their families.
… and Their Children
Even before they are born, the wellbeing of homeless children is inextricably linked to that of their mothers. Half (50%) of homeless women had not had a prenatal visit in the first trimester of pregnancy, compared with 15% of women in the general population. Lack of prenatal care, coupled with substance abuse, negatively impacts babies’ health. Approximately one-fifth of homeless women report drug and alcohol abuse during pregnancy, which increases the risk of adverse birth outcomes such as low birth weight.23 The duration and frequency of homelessness itself also significantly predicts low birth weight.24
Homeless children exhibit more health problems and unmet medical needs than housed and low-income children. Homeless children suffer from chronic illnesses (including heart disease and neurologic disorders) and acute illnesses (such as minor upper respiratory infections) at twice the rate of the general ambulatory population.25 Due to poor nutrition, they are seven times more likely to experience iron deficiencies, which can lead to anemia.26 The most prevalent nutritional problem is obesity; a Los Angeles study found that 12% of the city’s homeless children under the age of five were obese.27 ICPH analysis of national Head Start data found that nearly two-fifths (38.3%) of children in the program who had experienced housing instability were reported as overweight or obese.28
Environmental factors strongly influence the health of homeless children. Babies born in low-income neighborhoods have lower birth weights than those in more affluent residential areas. Asthma—which affects one-third (33%) of homeless children in New York City shelters (compared with 13.0% of children citywide)—is endemic in old, crowded buildings with high exposure to smoke and other allergens.29
Children who are homeless not only have poorer overall health, but also limited access to ongoing health and dental care.30 Over one-fifth (22%) of children in New York City shelters lack essential immunizations and one-third (33%) of homeless families surveyed nationwide report that their children never visit a dentist.31
Mental Illness
For mothers of children under the age of four, socioeconomic status is strongly associated with mental health; one-third (33.4%) of mothers in the lowest household income distribution experience depressive symptoms, compared with 9.2% of mothers in the highest fifth.32 Homelessness is further correlated with mental illness. Among homeless mothers in a Massachusetts study, the rate of psychiatric disability was almost three times higher than that of their housed counterparts.33 Maternal psychological distress is negatively related to homeless children’s emotional and behavioral health, although more research on long-term outcomes is necessary. Homeless families with mental illness experience more long-term homelessness than non-mentally ill families, as well as greater risk of separation of parents from their children. Mental illness also increases vulnerability to physical health problems by impairing families’ ability to maintain self-care and practice risk reduction.34
Substance Abuse
Homeless mothers have a higher lifetime rate of substance abuse than that of housed low-income mothers, 41.1% versus 34.7%, which is twice that of women in the general population (20.3%).35 A Massachusetts study indicated that women who abuse substances have an increased risk of contracting sexually transmitted diseases and of developing anemia and heart disease. Homeless mothers who have ever injected drugs (8.3%, compared with 1.8% of low-income housed mothers) are in particular danger of contracting HIV.36 Substance abuse is also associated with violence; a Los Angeles County study revealed that homeless women who experienced either physical or sexual violence were three times more likely (24.3%) to abuse drugs and alcohol than women who were not victimized (7.9%).37 Abuse of substances complicates women’s ability to seek care for other health problems.38 Making matters worse, there is a short-age of comprehensive residential treatment facilities for mothers with children.39
Families living in poverty often use drugs and alcohol as coping mechanisms, with negative consequences for their children. Parental substance abuse is a contributing factor for between one- and two-thirds of children in the child welfare system.40 Babies born to mothers who abuse drugs and alcohol have a heightened risk of low birth weight and serious medical and neurobehavioral problems.41
HIV/AIDS
Homeless women, mothers in particular, with their limited access to screenings and preventative care, have a higher risk of HIV infection than their housed peers.42 The effects of the disease (exorbitant health care costs and job loss from discrimination or extended absence) can increase the risk of homelessness for low-income families; up to 70% of persons living with HIV/AIDS report one or more episodes of housing instability.43 Conversely, homelessness is associated with HIV risk behaviors, including substance abuse; a Florida study reported that almost one-third (30.5%) of HIV-positive homeless clinic clients were injection drug users, nearly three times the national rate (11.7%).44 Homeless unaccompanied youth, who are frequently exposed to high-risk environments and behaviors, are at two to ten times greater risk of HIV infection than their stably housed peers.45
Veterans
Although the majority of homeless veterans are single adults (135,119, which represents 13.9% of total sheltered individuals), 3.1% (4,344) are adults in families (2.1% of sheltered families nationwide).46 Homeless veteran families are under-counted since many veterans live and request shelter separately from their children. Female veterans have two to four times the risk of becoming homeless as the general female population and are most at risk when they are heading families with young children.47 Homeless veteran families are more than twice as likely as their nonveteran counterparts to have a male adult present (53.5% and 21.6%, respectively).48 Over half (53%) of homeless female veterans have at least one major mental disorder, which some studies attribute to their high rate (20%– 48%) of military sexual trauma.49 Almost three-quarters (74.2%) of homeless female veterans suffer from PTSD, which has been linked to social and behavioral problems in their children.50 Domestic violence rates are also high (19%) among all female veterans and close to two-thirds (62.1%) of clients served by the Health Care for Homeless Veterans program have a substance use disorder.51
Issue 4
Educating Homeless Children
Homeless students face complex and interrelated challenges, which are often unique to their experiences living in unstable housing situations. Doubled-up arrangements can end abruptly; children may constantly fear that they will be forced to leave the places where they are staying. Mothers may tolerate abusive relationships to avoid losing housing, placing their children and themselves at risk. Shelter environments can be vastly different depending on the service provider, with some fostering caring environments and others offering less supportive settings. Even the physical structure of shelters varies widely, from large, congregate barracks-style settings to communal living spaces shared by two or three families to private rooms. Homeless children may also encounter the stress of short or medium time limits on how long they can stay. Shelters—and the hotels or motels that homeless families can afford—are usually in less desirable neighborhoods that offer few opportunities for children to safely relax and play. Furthermore, shelter staff tend to focus predominately on the needs of parents in order to resolve their homelessness and often lack the time and resources to address the needs of their children as well.1
For these and many other reasons, schools are frequently the only stable environment for children who experience homelessness. Fortunately, federal legislation—sensitive to the particular circumstances of homelessness—protects the rights of students in unstable housing. After covering these laws, this section discusses educational outcomes for both pre-kindergarten and school-aged homeless students and concludes with issues surrounding the co-occurrence of homelessness and the need for special-education or English-language services.
Laws Governing the Education of Homeless Students
Established in 1987 and reauthorized in 2002 under the No Child Left Behind Act, the McKinney-Vento Homeless Education Assistance Improvements Act (McKinney-Vento) provides important safeguards to ensure that every homeless student has equal access to the same free, appropriate public education provided to stably housed children and youth. The law gives limited funding to states, distributed to about one in five local education agencies, in order to guarantee the rights of homeless students, establish or designate an office to coordinate such activities within a state educational agency, create and implement a state plan to meet the needs of homeless students, and institute professional development programs to raise awareness of and bolster school personnel’s capacity to respond to those needs. The law prohibits the segregation of homeless students into separate schools, classrooms, or programs and the stigmatization of homeless students by school employees.2
McKinney-Vento also requires every local educational agency to designate a homeless education liaison to ensure that homeless students are immediately enrolled in school regardless of whether they lack immunization records, parental consent, or prior school or other required documentation. Liaisons can provide homeless students with school supplies, clothing, supportive services or referrals for services, and before- and after-school, mentoring, summer, and other educational programs. Should a parent choose, the liaison must also coordinate transportation to a homeless child’s school of origin, regardless of the district in which the child currently resides, to avoid the additional educational disruption of a school transfer. Liaisons also work to connect homeless students with other educational services for which they are eligible and make appropriate referrals to dental, health, and mental health care.3
McKinney-Vento mandates that homeless children and youth with disabilities have the right to a free public education comparable to that of their housed peers. The Individuals with Disabilities Education Improvement Act (IDEA), established in 1975, guarantees rights and services for all children and youth with special needs. Under this federal law, students with disabilities—which can be broadly defined to include five types of impairments: speech or language, cognitive, behavioral or emotional, sensory, or physical—are eligible to receive specifically designed instruction (special education) and related supportive services (such as transportation, physical therapy, and student and parent counseling).4
In 2004, IDEA was amended to emphasize child outcomes, focusing on preparing students with disabilities for further education, employment, and independent living. Recognizing the difficulties facing homeless students with disabilities, the 2004 reauthorization called for coordination between IDEA early intervention (Part C) and special education (Part B) programs and McKinney-Vento homelessness-education programs. All states receiving IDEA funds must guarantee that the requirements of McKinney-Vento are met for all homeless children and youth with disabilities, which include both literally homeless and doubled-up children.5 The reauthorization reinforced the need for timely assessments, appropriate service provision and placement, and continuity of services for homeless and highly mobile students with disabilities.6
Early Childhood Education: Risk and Readiness
The years prior to kindergarten comprise a crucial period in child development. Early years in school are highly predictive of future academic achievement, making it critical that children enter kindergarten equipped for success.7 School readiness encompasses mastery of a number of cognitive and noncognitive competencies as well as healthy physical development. Since learning is a cumulative process, young children who lack these foundational skills early often struggle to catch up to their peers. These gaps in school readiness have been shown to persist—and frequently worsen—in later grades.8
Children from low-income families encounter more barriers to achieving school readiness than their affluent peers, combating risks associated with poverty such as limited parental education, constrained financial resources, poor health care and nutrition, and exposure to family and community violence.9 Homeless children are at an even greater disadvantage, experiencing additional risk for developmental delays and health problems due to discontinuity in schooling, disrupted access to services, and stressful housing situations.10 Young homeless children often have less, and less consistent, exposure to the resources and early engagement necessary to support healthy development.11 A high-quality early education, however, can help mitigate the confluence of poverty- and homelessness-related risks these children face.12 Nevertheless, homeless families are less likely to access these programs. Only one-quarter (24%) of urban homeless or highly mobile young children are enrolled in high-quality center-based care, roughly half the rate of poor but stably housed children (45%) and those at risk of homelessness (55%). Homeless parents are more likely to rely upon informal, relative-provided care (46%) than at-risk (36%) and stably housed (22%) families.13
Head Start is the largest federal program providing early childhood education and related services to young children from low-income families, serving more than one million children annually.14 In analyzing a cohort of three-year-old children who began receiving Head Start services in 2006, the Institute for Children, Poverty, and Homelessness found that children experiencing homelessness or high mobility (HHM) began with poorer socio-emotional, cognitive, and health-related outcomes on average than their low-income, stably housed peers. After two years in Head Start, HHM children exhibited varying degrees of improvement, making the greatest progress relative to their peers on measures of socio-emotional development. Overall, however, the gains HHM children made did not increase their scores enough to meet the average low-income, stably housed child’s outcomes, leaving a school-readiness gap in place before kindergarten entry.15
Classroom Performance of School-aged Homeless Students
Trauma, toxic stress, and other factors such as hunger and poor health negatively impact school-aged homeless students’ development and classroom performance. Whether there are differences between the academic achievement of homeless and other poor students is less clear. Several studies have observed no substantial differences, while others suggest that homeless children have more adverse academic outcomes, on average, than poor students. Ultimately, the circumstances of homelessness—in particular, high mobility—make homeless students difficult to study. Additionally, those living doubled up or unsheltered are challenging to research, and most studies are limited to students residing in shelters.16
Research has shown, however, that some homeless children are resilient in the face of homelessness and actually meet or exceed the math and reading achievement scores of housed students. A study of elementary school children in Minneapolis indicated that 45% of homeless students were able to score relatively well; the remainder performed much worse on assessments than other poor and stably housed children.17
Many intrapersonal and interpersonal factors foster resiliency. For example, high-quality parenting, characterized by a close and positive relationship, has been linked to higher levels of executive functioning among children, which can profoundly affect their capacity to develop good social skills, build healthy interpersonal relationships, and, eventually, parent their own children effectively.18 Other resiliency correlates include positive bonds with caregivers, positive relationships with other nurturing adults, and supportive friends or romantic partners. Cognitive and self-regulation skills, as well as positive self-perceptions and -efficacy, and a sense of meaning in life are also important. High-quality communities (defined as neighborhoods with low levels of pollution and violence); cultures that provide positive standards, rituals, relationships, and supports; and bonds to positive sociocultural systems such as schools, all also help children overcome adversity.19
All children, regardless of their housing status, have the ability to be resilient when faced with difficult situations. Homeless children can adapt and cope with trauma, as long as the balance between the protective and positive factors within themselves and their environment is manageable.20 Sometimes, the effects of homelessness are overwhelming for children. Not surprisingly, homeless children have been shown to be less resilient when they experience multiple risk factors, such as being exposed to violence or conflict at home, having parents with substance-abuse or psychological disorders, or being separated from their families. Engaging children in cognitive tasks, even in such adverse circumstances, has been shown to decrease their stress levels.21
The experiences of homeless children are both diverse and challenging. By providing opportunities and settings in which children can form positive, caring relationships with adults, schools can play a key role in supporting children’s resiliency. A school can provide a safe and stable environment, where students are free to explore and learn. Fostering resiliency among homeless students does not require extraordinary talents or resources, but educators need to be aware of the characteristics of resilient children, understand the factors influencing students’ capacity to cope, and support students in achieving positive outcomes.22
Special Education Services for Homeless Students with Disabilities
The stressors associated with being homeless—housing instability, poor nutrition, and lack of quality health care— negatively impact child development. As a result, homeless children experience twice the rate of learning disabilities (such as speech delays and dyslexia) and three times the rate of emotional or behavioral problems when compared to their housed peers.23 While numerous studies highlight the educational inequalities experienced by either homeless students or all students with disabilities, research on the co-occurrence of homelessness and disability among students is extremely limited and outdated.
While national academic achievement statistics do not exist for homeless students with disabilities, available data suggest that the co-occurrence of homelessness and disability has the potential to greatly hinder students’ academic performance and educational outcomes. Students with disabilities score lower on national-level standardized tests across all grade levels and subject areas than the general student population or their low-income counterparts. During the 2012–13 school year, only 18% of fourth-grade students with disabilities scored at or above proficiency level in math and 11% did so in reading.
Eighth-grade students with disabilities performed even worse on national assessments; 8% scored at or above proficiency level in both math and reading (Figure 1).24
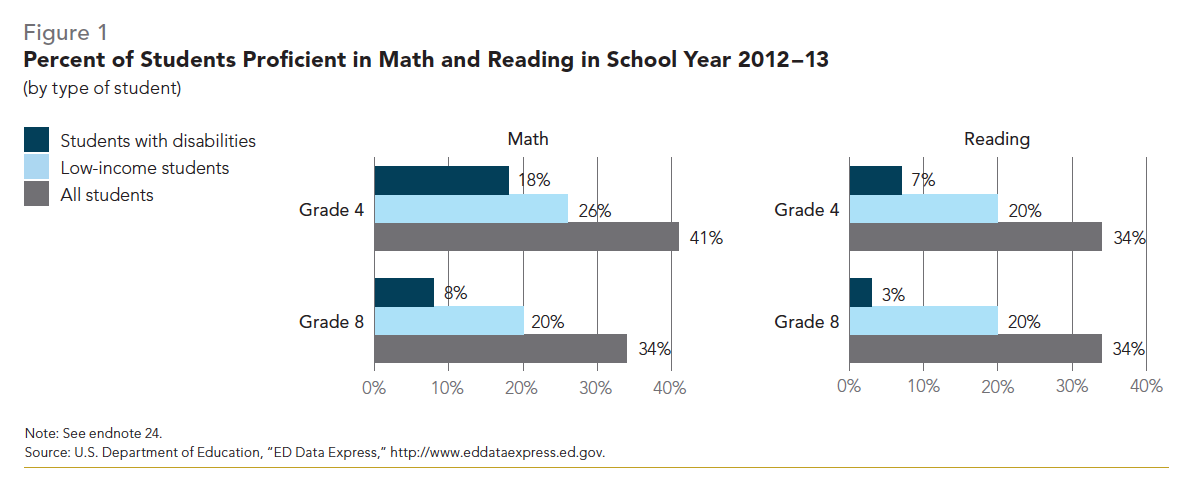
During the 2012–13 school year, one out of every six (16.0%) homeless students had a disability. Thirty-seven states had rates of disabilities among homeless students that surpassed the national average. States with the largest proportions of homeless students with disabilities were generally found in the Midwest, Mid-Atlantic, and Northeast regions (Figure 2).
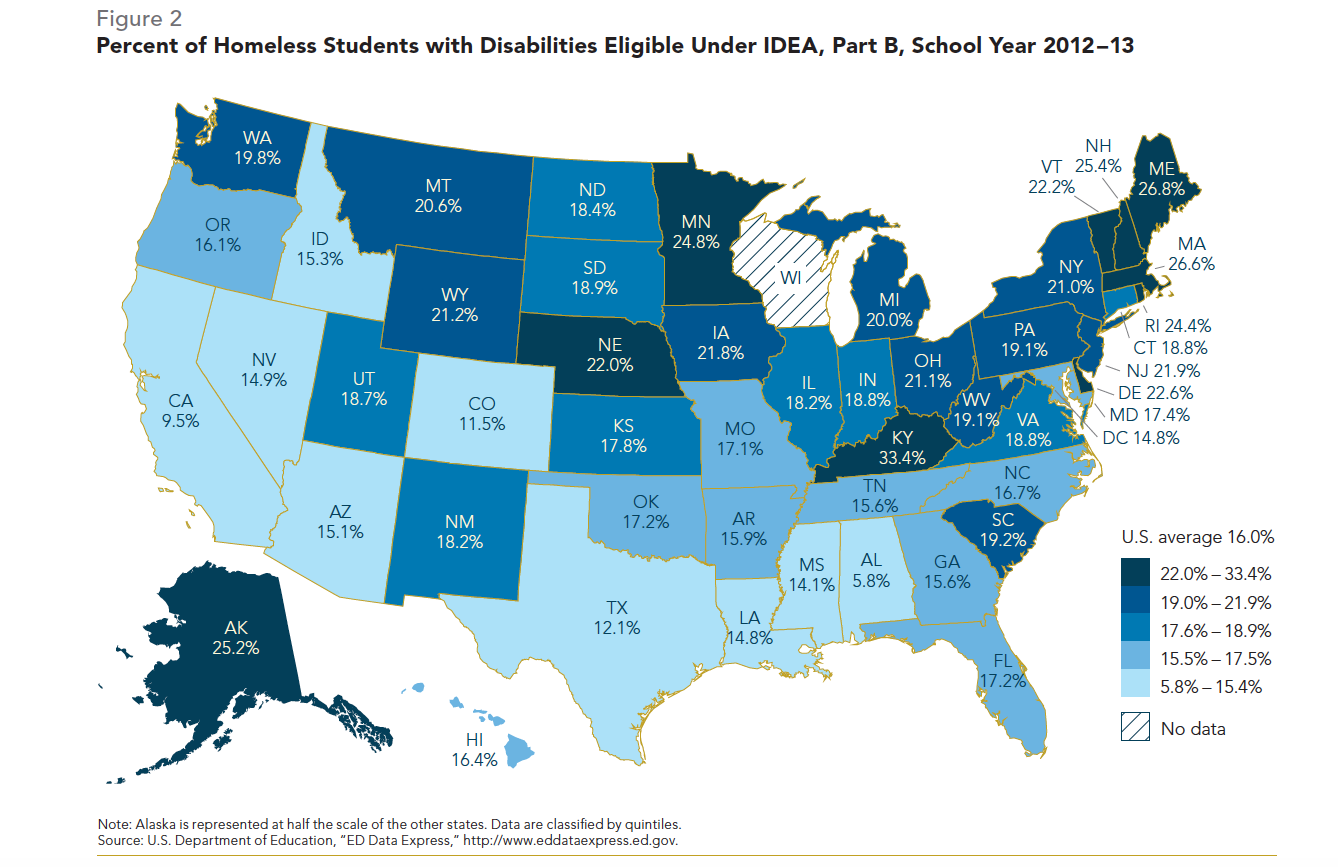
Kentucky had the highest rate, at one-third (33.4%), while Maine, Massachusetts, New Hampshire, and Alaska each identified more than one-quarter, or twice the national average, of their homeless students as eligible for services under IDEA, Part B. Alabama had the lowest percentage of homeless students who required special education at 5.8%.25
Since homeless children have higher rates of developmental delays and learning impairments, the proportion of homeless students with disabilities is expected to be higher than that of the general student population. However, national rates are similar for the 2012–13 school year—14.2% versus 12.9%— and the previous six school years (Table 1).26 The lack of differentiation between these two groups suggests that homeless children and youth with disabilities are often not identified as such and are not accessing the educational services they need.
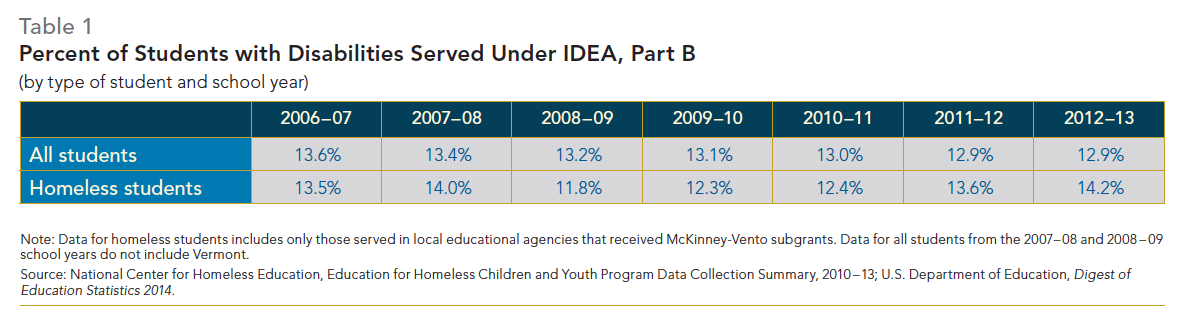
For homeless students with disabilities, the first of many barriers to receiving special education services is identification.27 For students with disabilities who are identified as homeless, a number of factors—such as chronic absenteeism, missing documentation, and incomplete school records— complicate the special education evaluation process and delay service delivery.28
Conditions commonly associated with homelessness, such as sleep deprivation, depression, and hunger interfere with learning and classroom performance. This can lead to a misdiagnosis that will affect a child for the duration of his or her academic career. A student experiencing the adverse effects of homelessness can be incorrectly labeled as having a disability. Conversely, a student’s disability can go unnoticed, with his or her poor classroom performance being attributed to housing status alone. Both errors can lead to children being placed in the wrong classroom setting, hampering their educational attainment.29
Since parental consent is required for all special education assessments, parents’ lack of awareness or acknowledgment of their children’s developmental delays or disabilities can postpone or prevent the evaluation process and access to services. The strict timelines and complex paperwork involved with assessments can pose another stressor for homeless families, deterring family members from seeking services. Parents are often poorly informed of their child’s educational rights under McKinney-Vento, including the mandate that allows homeless students to remain in their schools of origin. School transfers may result in delayed assessments and inefficient record transfers and can disrupt the continuity of special education services. On average, homeless students change schools three times per year, with students taking between four to six months to recover academically from each transfer.30
There are many ways in which states and school districts can better identify, evaluate, and serve homeless students who also have a disability, but localities are ultimately constrained by limits on financial resources. Under the initial passage of IDEA in 1975, the federal government committed to support up to 40% of the program’s costs. However, Congress contributed only an estimated 16.1% ($11.6 billion) in FY13, leaving states and school districts to cover the vast majority of expenses.31 Sufficient allocations would greatly improve service provision for homeless students with disabilities and encourage their inclusion in the national conversation on education policy.
Lending New Voice: Homeless English Language Learners
Homelessness results in educational disadvantages for students because of factors such as high mobility, poor nutrition, and higher rates of learning disabilities, which are likely compounded for students with language barriers. Most English language learners (ELLs) in elementary schools are second-generation immigrants whose parents and older siblings know only limited English, if any at all.32 Although the needs of homeless students and ELLs have been studied separately, even basic statistics on the intersection of these two populations are rare.
While national academic achievement statistics do not exist for homeless ELL students, available data suggest that the co-occurrence of homelessness and language barriers may result in significantly diminished educational outcomes. Low-income students are proficient in math and reading at just over half the rate of the general student population in grades four and eight, and studies show that homeless children perform worse academically than their low-income peers (Figure 3).33 Fourth-grade ELLs also receive lower marks than low-income students, with disparities worsening by eighth grade.34
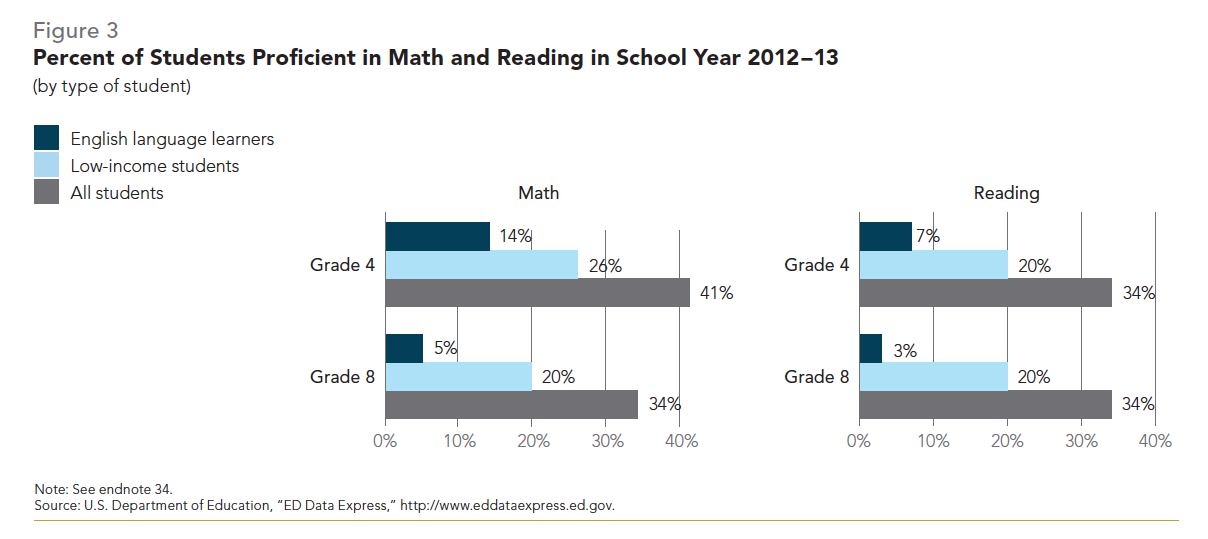
ELLs, or students who qualify for English as a Second Language or Bilingual Education services, comprised 14.2% of the one million students who received homelessness services during the 2012–13 school year a rate higher than the percentage of ELLs in the overall student population (9.7%). Spanish is the most common language spoken by ELLs at 77%, followed by Chinese, Arabic, and Vietnamese.35 Among homeless students enrolled during the 2012–13 school year, high concentrations of ELLs in the homeless student population are found in the West and Southwest (Figure 4), areas with high concentrations of ELLs in the general student population.36
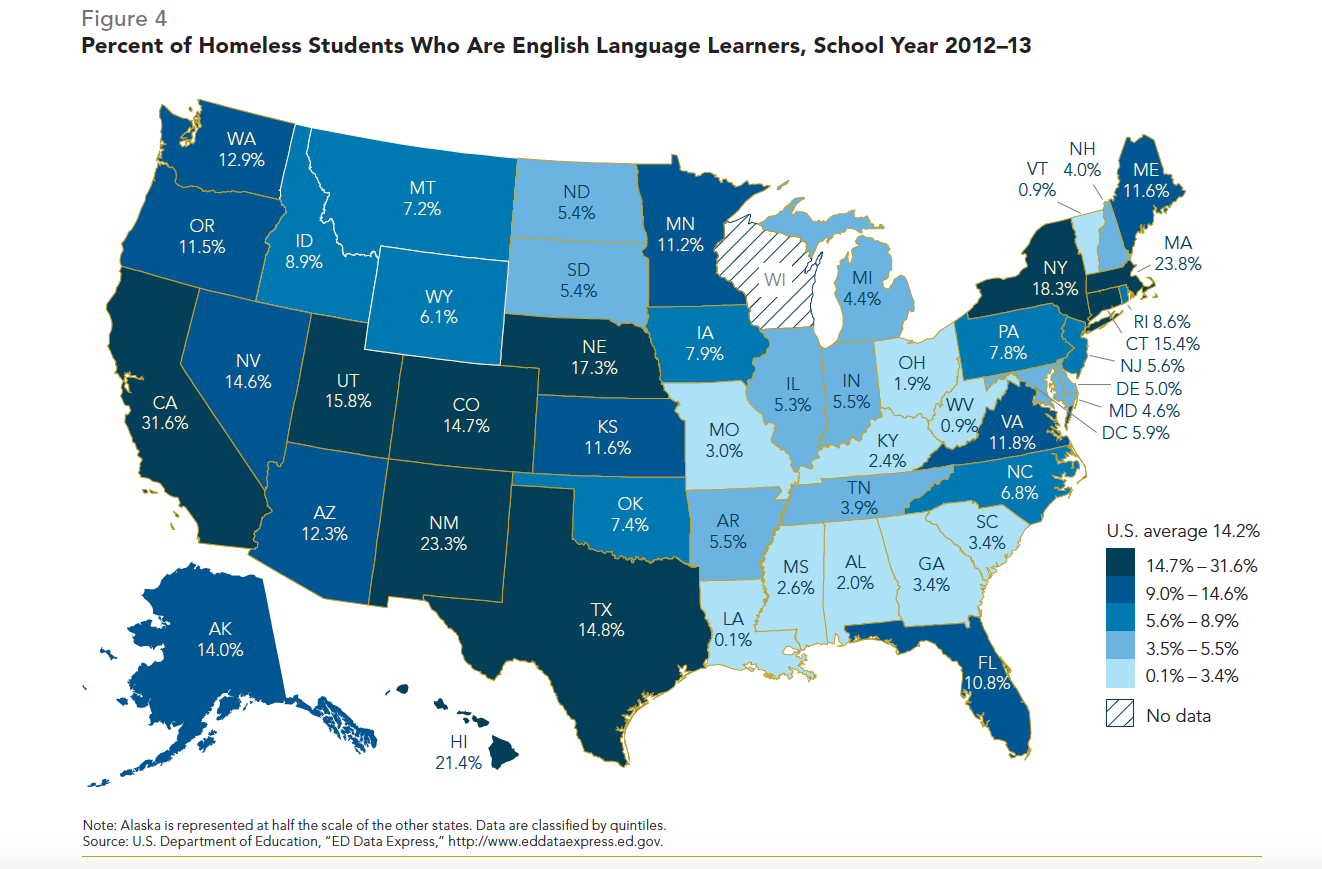
The vast majority (94.5%) of ELLs in kindergarten through 12th grade are enrolled in federally funded language instruction programs. The English Language Acquisition State Grants—originally amended to the Elementary and Secondary Education Act of 1967 and renamed by Title III of the No Child Left Behind Act of 2001—assist ELLs in reaching state academic achievement standards. Funded at $723.4 million in Fiscal Year 2014, the formula grant gives states flexibility to identify evidence-based practices and develop their own annual measurable achievement objectives.37 ELL students who are homeless are also eligible to receive critical homeless-specific services under McKinney-Vento.
Issue 5
Federal Homelessness Policy
In 2010, the U.S. Interagency Council on Homelessness released Opening Doors: Federal Strategic Plan to Prevent and End Homelessness, the first federal plan to prevent and end homelessness. Goals were set to end homelessness among chronically homeless single adults living on the streets and veterans by 2015, with the additional target of ending family, child, and youth homelessness by 2020.1 This chapter discusses the federal response to homelessness leading up to Opening Doors, which was largely a reaction to two crippling recessions. Research on various housing models is also presented, with a detailed examination of the reasons why the federal strategy to end homelessness among families shifted from service-enriched transitional housing to a rapid re-housing approach that provides short- or medium-term rental subsidies with fewer supportive services. The chapter concludes by outlining the current, but albeit limited, understanding of which families should receive which types of assistance to prevent and end their homelessness.
Modern History: The 1980s and 1990s
Before the Great Recession (December 2007–June 2009), the highest number of unemployed Americans since the Great Depression had occurred in the early 1980s (July 1981 to November 1982). Congress responded in 1983 by creating the Emergency Food and Shelter National Board Program (EFSP) to provide non-disaster related emergency assistance. EFSP is overseen by the Federal Emergency Management Agency and administered through partnering non-profit organizations.2 The program was authorized in 1987 with the passage of what is now known as the McKinney-Vento Homeless Assistance Act (McKinney-Vento), the first large-scale federal response to the needs of homeless individuals and families. This statute established programs to provide homeless households with shelter and supportive services through multiple federal agencies, including the U.S. Department of Education, the U.S. Department of Housing and Urban Development (HUD), and the U.S. Department of Health and Human Services (HHS). Reauthorized and amended several times since its inception, the law remains the primary funding mechanism to prevent and alleviate homelessness.3
Since 1995, homeless families have been served through the Continuum of Care (CoC) system. The CoC structure encourages regional networks of providers and state and local government agencies to collaborate in creating a comprehensive homeless services system. The first access point for families into this system is emergency shelter, where they may stay for 30 to 90 days to solve immediate crises. Families with greater barriers to self-sufficiency can move to transitional housing for an additional period of up to 24 months, during which they receive supportive services to prepare for a stable return to permanent housing. Funded mainly through HUD, transitional housing provides access to job skills training, parenting education, and financial literacy classes; treatment for mental illnesses, addictions, and other disabilities; child care and transportation to enable parents to attend classes, access employment, and apply for apartments; housing search assistance; and up to six months of follow-up services. A minority of clients with disabilities that prevent them from achieving complete self-sufficiency in transitional housing, are instead directly placed in permanent supportive housing. As opposed to families in emergency shelter or transitional housing, these families are then by definition no longer considered homeless.4
The Benefits of Transitional Housing for Families
As of October 2014, the most in-depth research on transitional housing for homeless families was a report released by HUD in 2010. The study used data collected between November 2005 and July 2007 (before the Great Recession began). Among participating mothers, the employment rate increased from 18% at transitional housing entry to 61% at exit, rising four more percentage points by the 12-month follow-up interview. During the year after leaving the program, two-thirds (64%) of mothers lived in their own residences, either directly out of transitional housing or after short stays in other places, and an additional 19% were always in their own housing but moved at least once. Only 5% never had their own residences and 2% experienced another episode of homelessness at some point during the 12 months after exit, with some overlap between the two categories (Figure 1). In addition, 86% of families maintained the same household composition for at least one year after leaving transitional housing. Longer stays in transitional housing enabled families to develop the skills necessary for self-sufficiency and were associated with higher educational attainment and employment rates, greater likelihood of consistent work during the year after program exit, greater likelihood of having one’s own residence during this time, and better mental health among children one year after move-out.5
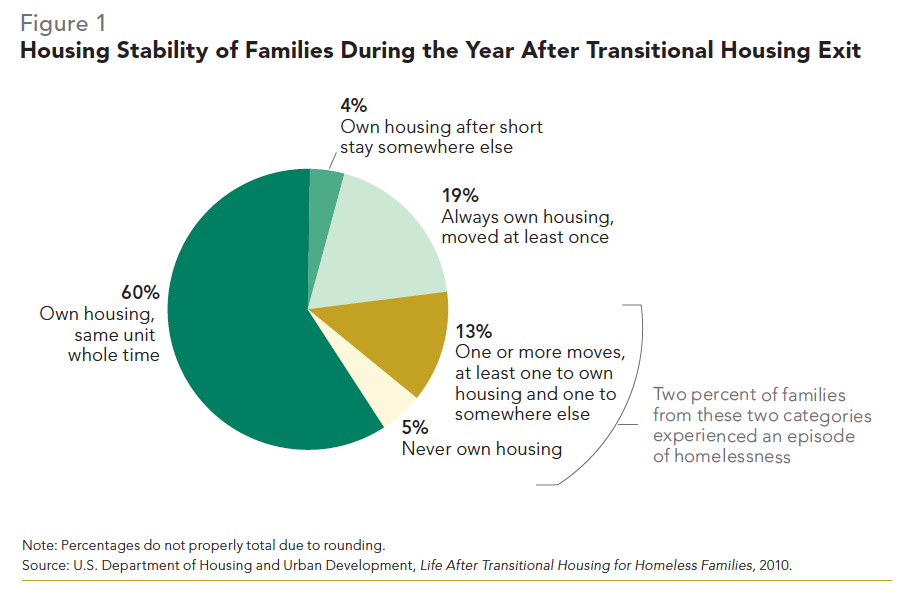
Additional research released by HUD in 2010 shows that transitional housing is the most effective type of shelter for assisting homeless persons in finding work. Due to a greater emphasis on job-related services, 36.8% of families and individuals exiting transitional housing in 2007 had employment income (an 84.9% jump since program entry), as opposed to one-fifth of those leaving permanent supportive housing (19.2%, a 51.2% increase) or supportive services only programs (21.1%, a 77.3% increase [Figure 2]).6
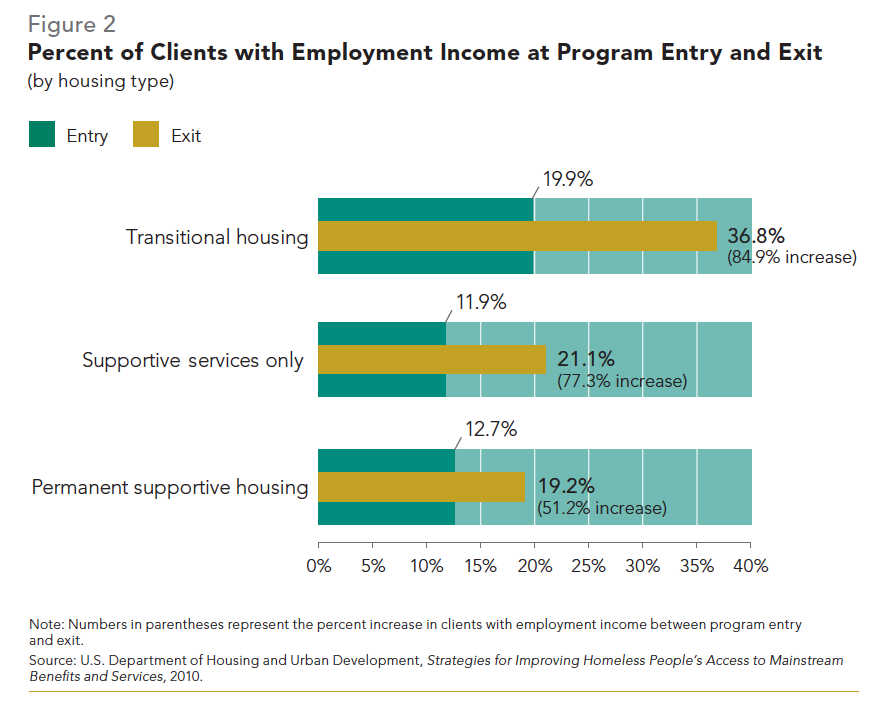
Although the rates at which homeless parents are employed when exiting all three program models is low, homeless families in transitional housing are more likely to receive income from employment than those in permanent supportive housing or families only receiving supportive services. Without jobs, it is unlikely that homeless parents can cobble together enough cash and non-cash benefits from the larger social safety net for families to avoid future episodes of housing instability. These are important facts to consider when evaluating the reasons why the federal government has shifted its focus away from funding transitional housing.
A Paradigm Shift for the 21st Century
When HUD began funding emergency shelters, transitional housing, and permanent supportive housing following the 1987 landmark McKinney-Vento legislation, communities and service providers were allowed to use funds at their discretion for housing and supportive services. In 2000, only 40% of HUD funds were used for housing. Since other federal agencies were already administering supportive service programs, such as child care and health care, Congress directed HUD to target more resources to creating permanent supportive housing.7
Permanent supportive housing was initially developed to serve single adults with disabilities experiencing chronic homelessness, defined by HUD as unaccompanied individuals with disabling conditions who have been homeless for more than one year or who have had four or more episodes of homelessness in the last three years. Under this model, clients who cycle through shelter and expensive emergency services—such as incarceration, hospitalization, and inpatient psychiatric and substance abuse care—are placed in apartments and linked to voluntary supportive services.8 Evaluations of permanent supportive housing for chronically homeless singles have found this program to be almost cost-neutral or even cost-effective, depending on the locality, and it is associated with increased housing stability for homeless single adults with severe mental illnesses.9 Converting the homeless family housing infrastructure to one favoring permanent housing with optional supportive services has appealed to policymakers because it is less expensive per family per day for households experiencing their first episodes of homelessness.10
In 2002, the Bush administration began an initiative for states and localities to develop 10-year plans to end homelessness among chronically homeless adults.11 The push was influenced by the argument that a housing-first approach for chronically homeless adults results in reduced costs overall, due to a decreased reliance on expensive emergency services.12 To enforce this policy shift toward a housing-first model, the Bush administration directed funding to serve chronically homeless single adults.13 The change was well-received by Congress, which viewed it as a cost-effective approach to ending homelessness. States and localities responded by creating plans that varied in time frame and target population. While data do not exist for 2002–04, the number of permanent supportive housing beds for single adults increased by over 60,000 (or 48.5%) between 2005 and 2014 (from 125,710 to 186,623).14 Subsequently, chronic homelessness among single adults declined by more than one-quarter (30.0%) between 2007 and 2014.15
Misinformed Policy: Phasing Out Transitional Housing for Families
Due to the success of a housing-first approach for chronically homeless single adults, a similar model was developed and applied to homeless families. Instead of long stays in transitional housing, families could quickly be placed in their own permanent housing and given a short- or medium-term rental subsidy. This policy, known as rapid re-housing, remains the federal strategy to end homelessness among homeless parents and their children despite limited research on the efficacy of the model and misguided theoretical underpinnings.
This federal policy shift for homeless families was influenced primarily by a study released in 2007. The study examined family shelter usage data collected over two to three years per household in three major cities and one state. The study placed families into three different groups according to the total length and number of stays in shelter. The three groups were: families who had multiple short stays, families who had one short stay, and families who had one long stay in shelter.
The study found that a large majority (95%) of families, those with infrequent shelter use, did not have intensive service needs that would significantly impact housing stability. Conversely, the remaining 5% of families (identified as “episodic”) seemed stuck in a cycle of homelessness.16 The study therefore recommended transforming the homelessness services system to consist mostly of housing voucher programs to address the needs of the 95% of families with a lower frequency of shelter use. This approach was also meant to lower costs and reduce length of stay in shelter.
A 2011 study highlighted several flaws in the research design and data analysis of the 2007 study, findings that call into question its policy applicability. The 2011 study replicated the original analysis and initially found six groups of families instead of three; further analysis using a more appropriate statistical approach identified ten distinct types of families. The authors of the 2011 study concluded that no single typology exists. Therefore, the system was changed based on a single, flawed study. In areas other than homelessness, such as medicine, the economy, and climate change, decisions are made by conducting a wide variety of studies and reaching a general consensus within the scientific community to inform policy recommendations. In homelessness public policy, however, it has become commonplace for decisions to be made based on limited research that is not evidence-based and would not meet the quality standards of other disciplines.17
The Great Recession Hastens Implementation of Rapid Re-housing
In 2008, HUD decided to test the feasibility of rapid re-housing for homeless families. The following year, funding for the Rapid Re-housing for Families Demonstration Program (RRHD) was allocated to 23 localities and targeted to assist families who had at least one moderate barrier to housing and were likely to independently sustain housing after the assistance ended. Sites could select from providing leasing assistance for 3–6 or 12–15 months. In contrast to rental assistance programs, participants were not required to make contributions toward their housing costs. RRHD allowed housing placement, case management, legal assistance, literacy training, job training, mental health and substance abuse treatment, and child care as eligible supportive services. However, grantees were limited to spending no more than 30% of funds on such activities. Although initial results have been shared with grantees, as of November 2014, the study has not been publically released. Furthermore, before the pilot program could be tested and thoroughly evaluated, the Great Recession, which officially lasted from December 2007 to June 2009, prompted the federal government to implement rapid re-housing on a system-wide scale (Table 1).
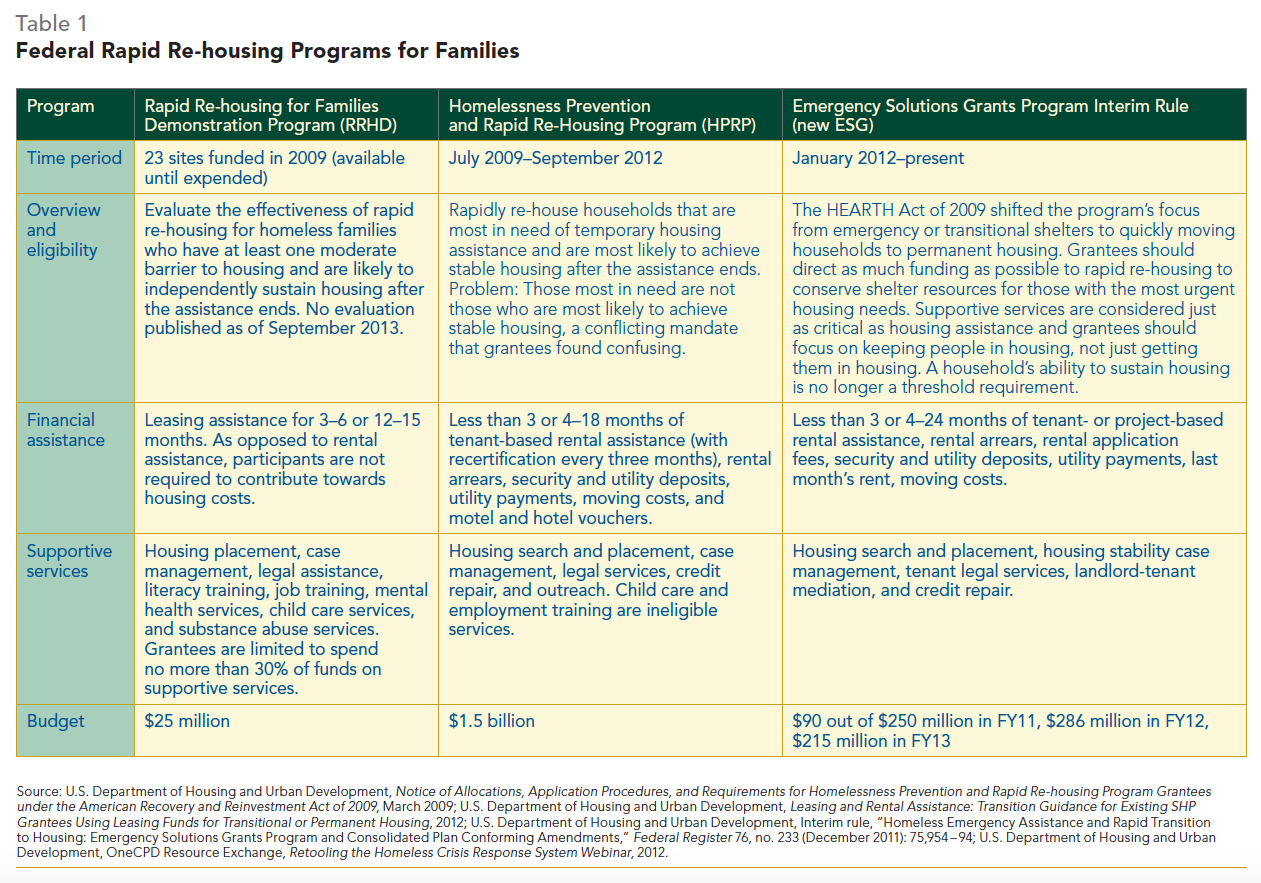
The Homelessness Prevention and Rapid Re-housing Program (HPRP), a component of the American Recovery and Reinvestment Act of 2009 (ARRA), was created by Congress to mitigate rising homelessness due to the economic downturn. ARRA dedicated $1.5 billion to this one-time, three-year program for short- and medium-term housing-related financial assistance, including rental subsidies and security deposits, and housing-related supportive services, such as landlord mediation and housing search assistance. The goal of HPRP was to prevent homelessness for at-risk families and to quickly move homeless families into their own housing. HUD, which managed HPRP, used the opportunity to test new strategies for the Emergency Shelter Grants Program—now known as the Emergency Solutions Grants Program (ESG).18
The Creation of HPRP: Testing the New ESG
When HPRP was created in 2008, the Homeless Emergency Assistance and Rapid Transition to Housing (HEARTH) Act, which reauthorized McKinney-Vento and solidified federal policy favoring rapid re-housing for homeless families, had yet to pass. In the original Emergency Shelter Grants Program, there was no cap on funding for emergency shelter, but no more than 30% of grant monies could be spent on prevention. Whereas emergency shelters were intended for short-term stays, clients could reside in transitional housing for up to two years while receiving supportive services. The HEARTH Act, passed in 2009, limited new ESG funds for emergency shelter or street outreach to either 60% of a grantee’s total ESG allocation or the amount of funds used for those activities in the last year of the old version of the program, whichever is greater, and lifted the cap on prevention spending (Table 2). In addition, the Act incentivized providers to rapidly re-house clients (a new eligible activity) out of emergency shelters and transitional housing by tying funding allocations for transitional housing to communities’ ability to reduce the length of clients’ homelessness. Although the maximum length of stay in transitional housing remains two years under the new system, providers are now encouraged to move clients out much more quickly.19
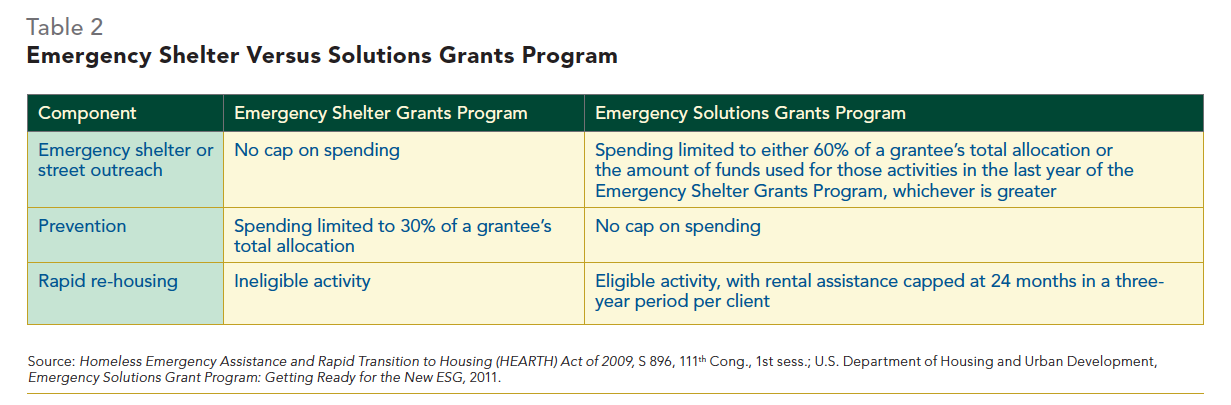
HUD adapted some of the prevention and rapid re-housing sections of the HEARTH Act when creating regulations for HPRP.20 The Act itself does not define the length of short-and medium-term financial assistance but does specify to a certain extent which families are considered at risk of homelessness.21 HPRP regulations limited the length of financial assistance to 18 months for homeless and at-risk households but gave grantees latitude in determining what constituted “at risk of homelessness.” Furthermore, HUD instructed grantees to both serve households most in need of assistance and select participants most likely to achieve stable housing, a seemingly conflicting mandate that, according to a survey by the National Law Center on Homelessness and Poverty, 62% of providers had difficulty interpreting.22
State and local HPRP grantees began expending funds in July 2009. By the end of March 2011, $868 million (57.9%) had been spent to serve 977,871 persons in 409,610 households nationwide. Almost three-quarters (72.7%) of families served were categorized as being at risk of homelessness and more than one-quarter (27.9%) were considered homeless at program entry according to HUD’s restrictive definition.23
Rapid Re-housing: Lessons Learned from HPRP
While research to date concludes that housing subsidy receipt is the main predictor of housing stability among homeless families, there is little evidence that they put families on the road to self-sufficiency.24 HPRP data suggest that for many households, short- or medium-term housing subsidies—without additional financial aid or supportive services—do not give families enough time to regain independence. According to HPRP regulations, grantees were permitted to provide families with up to three months of short-term rental assistance and up to 18 months of medium-term aid, but most served households for less than six months.25 By design, HPRP could cover only housing-related services. For example, employment support and training were ineligible activities. Most families accessing HPRP did not regain self-sufficiency; 70.3% exited the program with no change in income and one out of four (27.7%) exited with no income at all (Figure 3).26 Further exacerbating the problem, less than half (43.4%) of homeless families exiting HPRP to rental housing had housing subsidies.27 With no increase in income and no long-term housing subsidy, it is difficult to see how six months of HPRP participation would stabilize a family beyond the period of assistance.
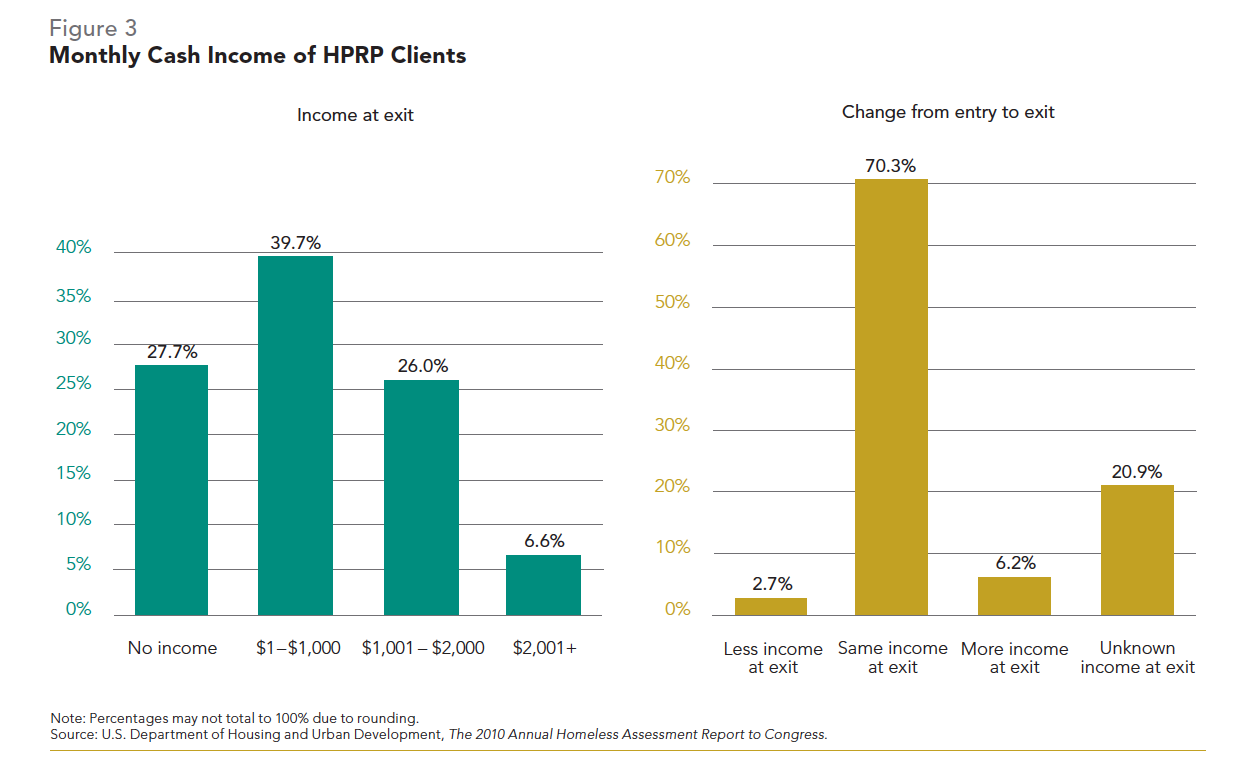
Prevention: Assistance Must Target Those Most at Risk
ARRA included homelessness prevention as a key component of HPRP, seeking to minimize both the negative effects of homelessness on families’ well-being and the higher costs to the social service system.28 However, the average prevention/ rapid re-housing participant exhibited higher levels of housing stability than adults in traditional emergency shelter or transitional housing did before program entry: 66.4% of adults receiving HPRP assistance lived in their own housing at program entry, compared with 11.8% of adults in traditional emergency shelter or transitional housing, and 15.4% of those receiving HPRP were living doubled up, as opposed to 30.2% of adults in shelter or transitional housing.29
The significantly greater housing stability among HPRP participants at program entry suggests inefficient targeting strategies. These were in part due to some providers’ confusion over HUD’s mandate to both serve households most in need of assistance and simultaneously select participants most likely to achieve housing stability after a short period of housing-related aid.30 HUD reported that more than one million persons were averted from or exited homelessness through HPRP, but the number served was most certainly much greater than the number who were or would have become homeless without assistance.31 Whereas many grantees needed to invest time in order to develop rapid re-housing programs, prevention programs were already in place to distribute HPRP funds immediately.32 As a result, grantees served almost three times as many at-risk households (297,857) as homeless ones (114,146) from July 2009 to March 2011.33
Current Understanding of the Homelessness Services Delivery System: A Continuum of Need
Based on the lessons learned from HPRP, however, HUD has advised participants to spend a greater percentage of ESG dollars on rapid re-housing, provided a strict definition of “at risk of homelessness,” and suggested that grantees restrict prevention activities to diversion, which targets families as they are applying to shelter.34 HUD has also placed greater emphasis on services to ensure that rapidly re-housed families stay stably housed.35
Local homelessness service systems should have a centralized or coordinated assessment system, which is a promising method for increasing access to homelessness programs and other services, as well as the improved coordination between and effective use of available resources. The passage of the HEARTH Act, and the subsequent release of the 2012 CoC Program Interim Rule, made the implementation of a centralized or coordinated assessment system a requirement for receiving federal CoC funding.36
A community’s centralized or coordinated assessment system can take many forms depending on factors such as local needs and geography. The one set requirement is the use of a standardized tool for assessing client needs. The tool, which can vary between but not within communities, can be administrated through a phone hotline, a physical location, multiple locations scattered throughout the CoC, a “no wrong door” policy, specialized caseworker teams deployed to service providers, or a combination of these methods.37
By screening all families in the same way, assistance may be more tailored to individual families’ levels of need and barriers to self-sufficiency, rather than using a single service model. Some families will leave emergency shelter after a few weeks with limited assistance. For other families with moderate needs, a short- or medium-term rapid re-housing rental subsidy with additional supportive services is the best use of limited financial assistance. Transitional housing should be reserved for families with high barriers to self-sufficiency. Only families who are chronically homeless or have disabilities should be placed in permanent supportive housing. Rather than the former continuum of care model, in which families graduate to permanent housing when ready, a “continuum of need” approach is theoretically the best use of limited financial resources to maximize the number of families served.38
In addition, there has been a push by HHS to connect homeless families with permanent housing and supportive services using Temporary Assistance for Needy Families (TANF) funds, as well as to coordinate the administration of housing assistance and employment support interventions between TANF agencies and homelessness service providers. TANF funding may be used for family planning and stability programs and to provide cash assistance to cover food, clothing, shelter, supportive services, and work subsidies. Under these guidelines, it is allowable to use TANF in conjunction with ESG and CoC Program dollars to house and support families at imminent risk of or experiencing homelessness. Jurisdictions have the discretion to alter cash benefits to adjust for housing costs and/or provide a housing supplement on top of cash assistance allotments.39
Homelessness researchers have yet to undertake a statistically rigorous exploration of the personal and systemic characteristics of homeless families. Data collection is ongoing for the first controlled, randomized study comparing service models for homeless families, conducted by HUD.40 Until this research is completed, it is impossible to determine whether rapid re-housing—originally based on the successes of a housing first approach for chronically homeless single adults— will better aid homeless families than transitional housing and the previous CoC system.
Issue 6
Mainstream Social Safety Net Programs
In 2011, only one-quarter (25.0%) of all adults who exited transitional housing, permanent or supportive housing, rental assistance, and other programs earned income from full- or part-time employment.1 With low levels of education, the jobs that homeless parents typically qualify for do not pay a living wage or provide health insurance or other benefits. As a result, homeless families depend on existing social safety net programs that serve all low-income families. However, complex application and eligibility requirements for mainstream programs coupled with the trauma, stress, and unique circumstances of homelessness act as barriers that prevent homeless families from enrolling.
This section presents a detailed discussion of mainstream benefit programs that can both prevent and raise families out of homelessness by providing cash assistance through the Temporary Assistance for Needy Families (TANF) program; improving early childhood education outcomes through Head Start; providing child care subsidies to find and maintain employment through the Child Care and Development Fund (CCDF); combating food insecurity with the Supplemental Nutritional Assistance Program (SNAP, formerly the Food Stamp Program), the Special Supplemental Nutrition Program for Women, Infants, and Children (WIC), and the National School Lunch Program (NSLP); improving access to health care through Medicaid and the Children’s Health Insurance Program (CHIP); and providing disabled families with financial aid through Social Security Disability Insurance (SSDI) and Supplemental Security Income (SSI). When available, the information is supplemented by ICPH state-by-state analysis of individual mainstream benefit programs using data reported on the U.S. Department of Housing and Urban Development’s (HUD’s) 2011 homelessness funding applications (see the Almanac State Dashboards for a single-page reference for each state). The chapter concludes with a review of where federal strategy and providers are failing homeless families: clients exiting programs without any financial assistance, neither through employment income nor benefits. Without the necessary resources, families are likely to continue to experience housing instability.
TANF
The U.S. Department of Health and Human Services (HHS) administers TANF, which provides cash assistance to low-income pregnant mothers and families with children for up to five years under the condition that parents fulfill strict work requirements. Federal financial penalties reduce TANF grant allocations to states that do not meet required client work-participation thresholds, which discourages states from assisting the hardest to employ: homeless parents. Data collected by HUD in 2011 reveal that only 9.5% of all homeless adults exiting the former Supportive Housing Program (SHP) or Shelter Plus Care (S+C) program nationwide were enrolled in TANF (Figure 1).2 However, data remain scarce on TANF enrollment among homeless parents or homelessness rates of TANF recipients. While 41 states include homelessness indicators or risk factors in their TANF documentation, only five states report conducting any analysis of the information. No state enrollment data are publicly available.3
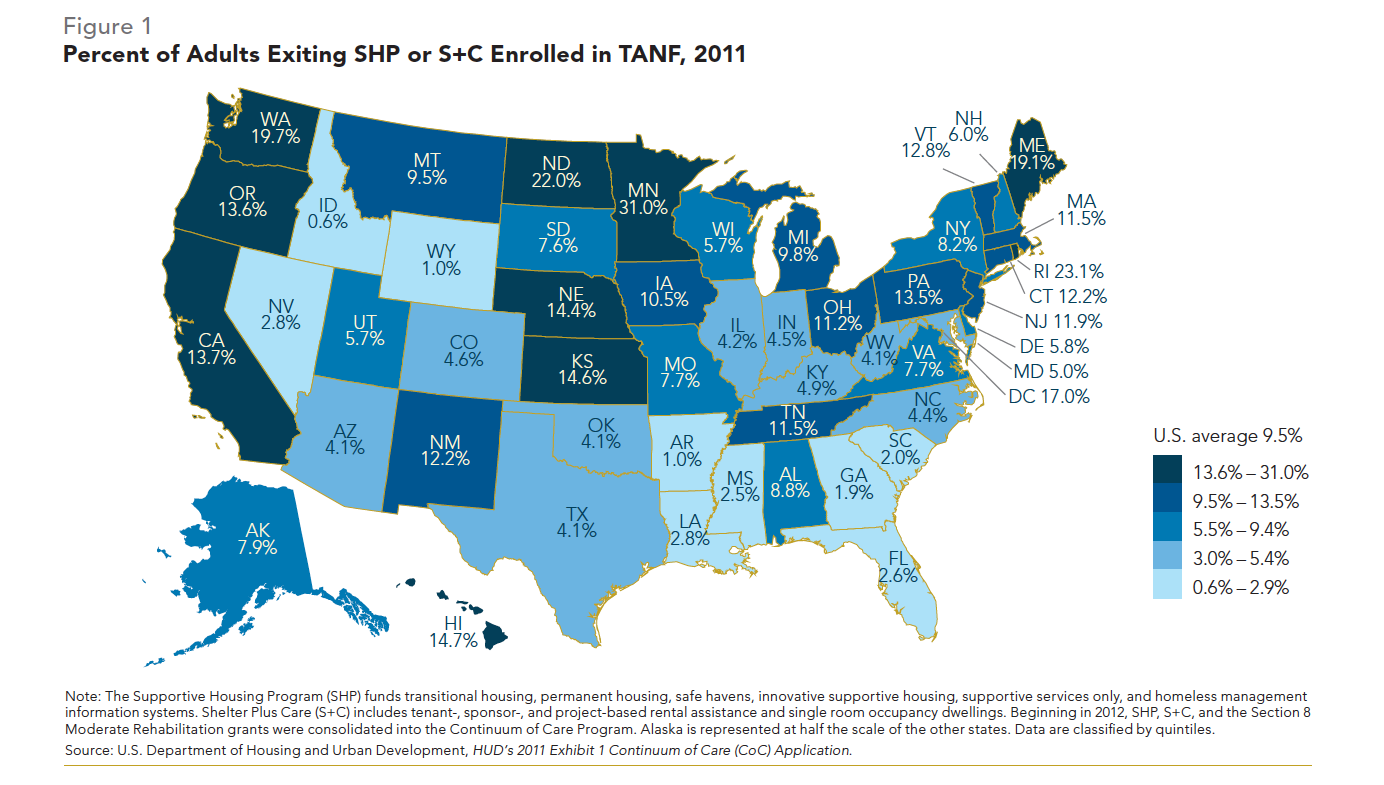
Low enrollment can be attributed, in part, to TANF regulations that fail to account for the specific needs of homeless families. Federal law requires that half of all single parents enrolled in TANF be engaged in a specified work-related activity for at least 30 hours per week (20 hours for those with children under age six) and that 90% of all two-parent families participate for a combined average of 35 hours a week. Homeless parents tend to have low levels of educational attainment and lack sufficient job skills, which hinder their ability to participate in program work requirements and later move from assistance to employment. Compared with 16% of single mothers nationwide, 39– 65% of homeless mothers do not graduate high school or obtain an equivalency degree.4 While education and job-skills training are permissible work activities, they count for only a limited number of hours and for a small proportion of eligible families. Exemptions from work requirements do exist for all parents with children under age one and those with children under age six to whom child care is unavailable, although this varies by state.5
Head Start
Established in 1965, Head Start is a federally funded early childhood development program administered by HHS that serves low-income children from birth to age five and their families. Income-eligible families receive access to supportive social services in areas including education, health care, nutrition, and parenting. Head Start is primarily comprised of two components: Early Head Start (EHS), for children zero to three years of age and pregnant women, and Head Start (HS), for children ages three to five.6 Head Start policies recognize that homeless children are more at risk than their housed peers for developmental delays; chronic and acute health problems; and behavioral, emotional, and mental health issues.7 With the passage of the Improving Head Start for School Readiness Act of 2007, all homeless children were made automatically eligible for EHS and HS programs, and all states were directed to identify and prioritize homeless children for enrollment. Homelessness also became one of ten federally mandated service and priority areas to be overseen by Head Start State Collaboration Offices—bodies that coordinate services between Head Start grantees and other state and local entities.8 In program year 2012–13, 46,800 homeless families (including 50,992 children) were registered in Head Start programs throughout the country, representing an 80.2% increase from 2008.9
In 2012–13, there were just under 3,000 Head Start programs (1,020 EHS, 1,777 HS, and 56 Migrant and Seasonal), serving 1,033,698 low-income families with 1,129,805 children.10 Nearly five percent (4.53%, or 46,800) of Head Start families nationwide were homeless (Figure 2).11 States that served the greatest percentage of homeless families were located in the Northwest and New England, with Alaska, Vermont, and Montana enrolling these households at the highest rates (12.1%, 11.4%, and 11.2%, respectively). Among most states in the Southeast, less than 3.0% of all families registered in Head Start were homeless.12
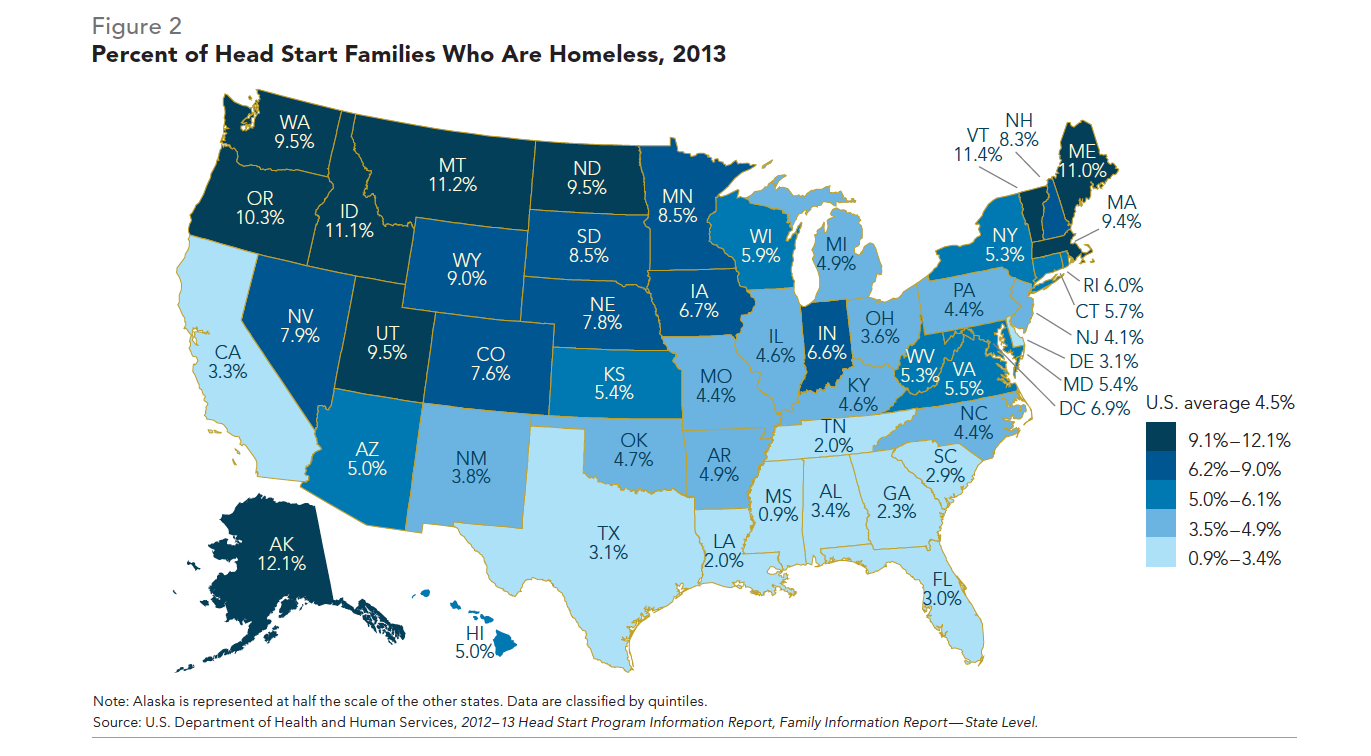
Research has shown that EHS and HS are beneficial for all children. Head Start participants demonstrate better cognitive, social, emotional, and educational outcomes than their nonparticipating low-income peers. Head Start parents have greater quality of life satisfaction, increased coping skills, and fewer health-related problems. Furthermore, every dollar spent on a child’s participation in HS yields an economic return of seven dollars or more, through increased earnings and decreased costs associated with welfare receipt, grade repetition, and crime.13
Through EHS and HS families also have access to the housing assistance and emergency intervention services they need to gain shelter and stability. Head Start grantees partner with community agencies to place families in stable housing that best fits their needs. Head Start reported that in 2012–13, 33.5% of all enrolled homeless families acquired their own residences.14 In three states—Vermont (60.9%), Delaware (55.8%), and Wyoming (53.1%)—50% or more of families secured housing. The District of Columbia saw the lowest housing rate, at 16.7%.15
While Head Start grantees have made great strides in enrolling homeless children and connecting their families to stable housing, there is still room for improvement. A combination of conflicting Head Start program requirements and collaboration deficiencies act as barriers to serving more homeless children. For example, grantees face possible funding cuts if participation falls below 97% and must maintain an average daily attendance rate of 85%. Simultaneously, programs must prioritize homeless children, who often experience frequent moves and unpredictable schedules that can make it difficult to maintain these attendance and enrollment levels. Furthermore, slots are often not available for children who become homeless after the start of the program year. In states with exceptional collaborative partnerships among Head Start programs, shelters, and government agencies, grantees have been able to overcome these obstacles by quickly enrolling homeless children if slots open during the year.16
Other barriers include the difficulty of establishing working relationships with school district personnel and other publicly funded preschool programs, engaging school homeless liaisons in cross training and coordinated planning, and obtaining homelessness data.17 In 2009, the most common strategies for improving services for homeless children involved conferences or workshops, meetings or joint planning sessions with educational personnel, and meetings of collaborative bodies such as homelessness coalitions.18 In January 2013, HHS released guidance on increasing homeless children’s access to early education services, including Head Start.19
Grantees must also contend with changes brought on by regulations following the passage of the Improving Head Start for School Readiness Act of 2007. In November 2011, HHS announced its plan to enhance program quality and accountability. For the first time since the program’s inception, Head Start grantees that fail to meet new quality benchmarks will not have their grants automatically renewed. All grantees who do not address one or more of seven problem areas—such as deficiencies in on-site reviews, failure to establish and use school-readiness goals, and low performance in classroom quality evaluations—have to instead compete for funding. An estimated one-third of grantees will not meet these standards; in December 2011, the first Head Start agencies— 132 in total—were informed that they had to compete for continued Head Start monies, and in January 2013, 122 agencies were designated for recompetition.20
Child Care Subsidies
Administered by HHS, CCDF is the primary source of child care subsidies for low-income families. In Fiscal Year 2013 (FY13), CCDF served nearly 1.5 million children and 900,000 families on average each month.21 Federal guidelines state that to be eligible, a child must be under 13 years old (or under 19 and physically or mentally incapable of caring for himself or herself), and a family’s income must not exceed 85% of the state median income. Parents must work or participate in an education or job training program, with the exception of families with children deemed to have a need for protective services and more immediate care.22 Congress leaves it to HHS and states to determine the activities that fulfill work or education requirements and which vulnerable children have a protective-services need. As of 2013, six states included at least some homeless children in that latter definition. Only seven states include housing search as an eligible work-related activity.23
As CCDF is a block grant and not an entitlement program, states are not mandated to provide assistance to all eligible applicants. HHS estimates that only one in six eligible children actually receives assistance.24 States have the flexibility to establish additional eligibility rules and, given the limited resources, to target subsidies to particularly at-risk families, including those experiencing homelessness. ICPH’s analysis of states’ CCDF state plans reveals that only nine states include homeless children as a priority population to serve. Only 18 states even mention homeless families in their CCDF plans. Seven state-level CCDF policies that reduce homeless families’ barriers to accessing child care are included in the Almanac’s State Family Homelessness Rankings.
The number of homeless children utilizing child care subsidies is currently unknown. However, the latest reauthorization of CCDF, the Child Care and Development Block Grant Act of 2014, requires that states begin to report homeless children’s enrollment monthly. This information will provide a clearer picture of how many homeless families states’ CCDF programs are reaching and what state-level CCDF policies may be correlated with higher participation among homeless families.
SNAP
Administered by the U.S. Department of Agriculture (USDA) nationwide since 1974, SNAP provides low-income participants with financial assistance for acquiring food and nutritional education. As an entitlement program, SNAP must aid all eligible applicants, with the level of cash assistance decreasing as income rises (Figure 3). In addition to meeting income and asset qualifications, able-bodied adults between 18 and 50 years of age without dependents must be employed or participate in work programs to remain enrolled. Parents are exempt from the work requirement if they are pregnant or are responsible for the care of a child. In FY13, SNAP served an average of 47.6 million people per month.25
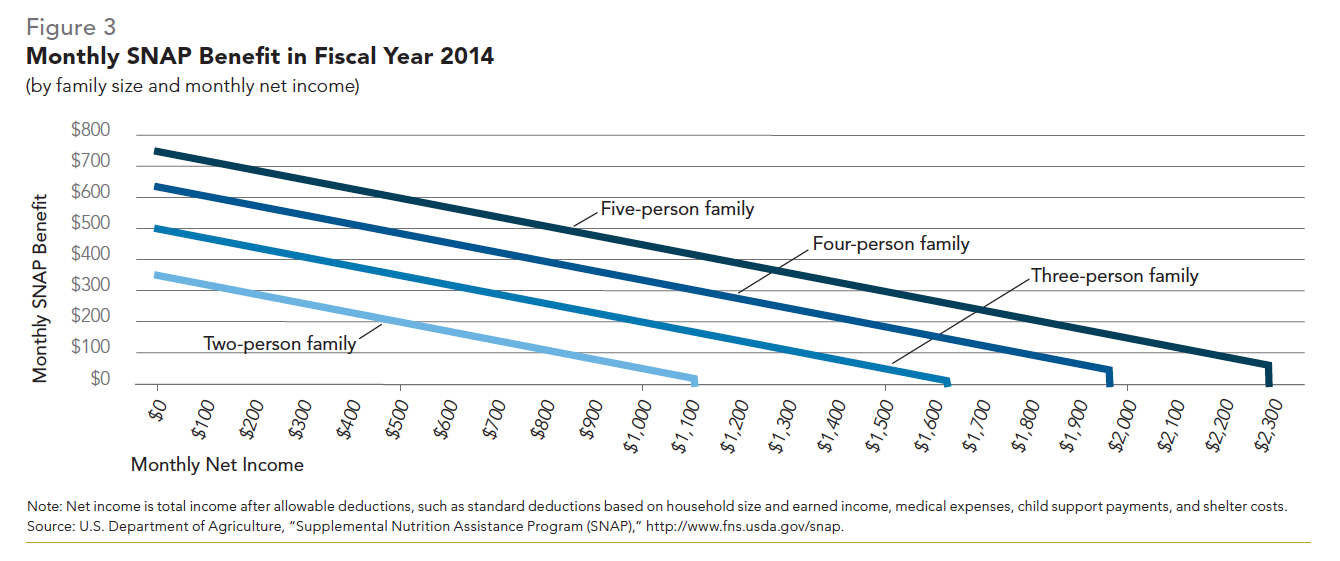
According to 2011 CoC funding application data submitted to HUD, two-fifths (39.1%) of all adults exiting the former SHP or S+C programs—which included transitional housing, permanent or supportive housing, rental assistance, and other programs—participated in SNAP, with enrollment generally higher in the North and lower in the South (Figure 4).26 Because SNAP exempts parents from work requirements if they are pregnant or are responsible for the care of a child, it is likely that the participation rate of parents differs from that of single adults.27
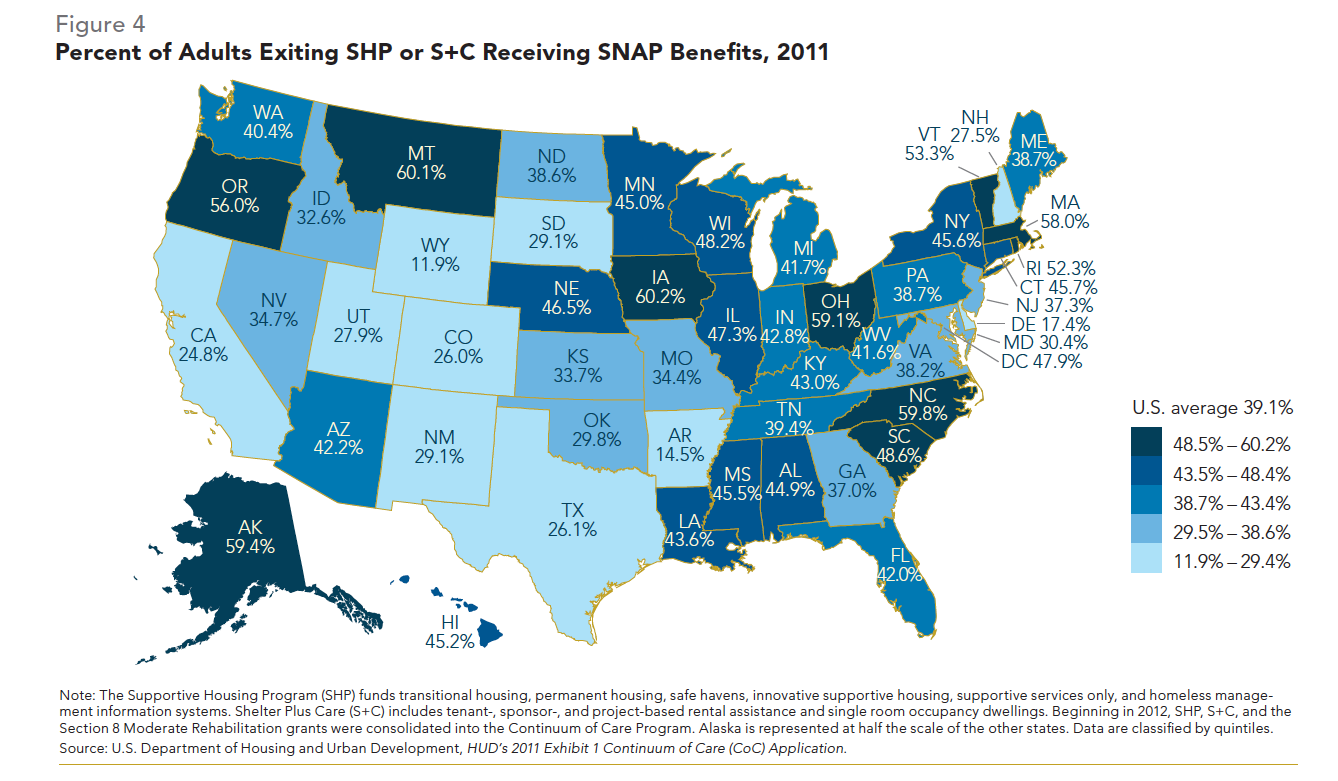
WIC
In 1974, the same year that SNAP started serving low-income individuals and families, the USDA began providing supplemental food; nutrition education; breastfeeding counseling and equipment; and referrals to other health, welfare, and social services through WIC. The program targets low-income pregnant, breastfeeding, and postpartum women as well as children ages zero through four who are at nutritional risk. As WIC is not an entitlement program, not all eligible applicants must be served. If state budget limitations create a waiting list, federal guidelines allow states to prioritize homeless mothers and children.28 In FY13, WIC served 8.7 million clients per month.29
A Centers for Disease Control and Prevention (CDC) survey found that 4% of recent mothers were homeless and three-quarters (75.7%) of homeless mothers were enrolled in WIC. The researchers calculated enrollment rates by locality, allowing administrators to assess low-performing states—such as Colorado (63.8%), Georgia (64.1%), and Mississippi (65.6%)—to determine barriers to access and measures to improve outreach. Planners seeking to improve their states’ WIC participation rates can look to high-performing states such as Montana (89.3%), Vermont (88.2%), or West Virginia (85.5%) for assistance in developing more effective enrollment strategies.30
WIC participation is associated with greater food security, healthier practices among mothers, and better physical health among newborns. In a study of low-income, pregnant, first-time clients in California, half of participants who were food insecure at program entry were food secure one year later.31 Research by the CDC in 30 states and New York City found that among homeless mothers, WIC enrollment was associated with positive maternal health behaviors and infant health outcomes.32
School Nutrition Programs
Administered by the USDA since 1946, NSLP provides cash subsidies and food to public and non-profit private schools and residential child care institutions, including those run by homeless service providers. These entities in turn offer nutritionally balanced, reduced-price or free lunches to students— over 31 million meals per day in 2013. Since 1998, NSLP has also included reimbursements for snacks served in after-school programs. NSLP is an entitlement program; all eligible schools can receive subsidies, and all students at participating institutions may take advantage of the program. The program cost a total of $12.2 billion in 2013.33
In addition to NSLP, the School Breakfast Program (SBP) and the Child and Adult Care Food Program (CACFP) also provide free meals to children from families with incomes at or below 130% of the federal poverty level and those whose families’ incomes are between 130% and 185% can receive reduced-price meals. When school is not in session, the Summer Food Service Program (SFSP) reimburses community summer programs for free meals provided to all children who qualify for free or reduced-price meals during the school year. Homeless service providers can also receive funding through NSLP and SBP if they have child care or after-school programs and through SFSP if they run summer programs. Emergency shelters can get reimbursed for up to three meals a day for all residents age 18 and under through CACFP. Homeless children are categorically eligible for free meals, as are students in households that receive SNAP or TANF, foster care children, and Head Start participants.34
Participation in NSLP improves children’s health and decreases food insecurity. One study found that NSLP reduces poor health by at least 24% and food insecurity by at least 6%. Another revealed that most of the reduction in food insecurity occurs in households at higher risk. For example, among households with children who experienced hunger over the course of a year, those that participated in NSLP were 33% less likely to be food insecure during the last 30 days of the year.35
About three-quarters of households with eligible children receive free or reduced-price lunches through NSLP.36 One study found that predictors of NSLP participation are broader than those of food insecurity. Both NSLP participation and food insecurity are related to low paternal educational attainment and economic factors such as family income and SNAP receipt. However, for NSLP enrollment, race is also a noteworthy predictor; black children are almost five times more likely to participate in NSLP than students of other races. The researchers describe this finding as an indication of the importance of culture in NSLP enrollment. They speculate that, for example, black children may attend schools with higher rates of NSLP participation and therefore less stigma is attached to free and reduced-price lunches.37
Studies have shown that the risk of food insecurity is lower in states with higher rates of participation in NSLP and SFSP. The one study that also included SBP found that the program had no significant effect on food insecurity.38 Little research has been done to look at the outcomes of CACFP participation, but a 2013 study found that children attending CACFP-enrolled daycare centers consume more milk and vegetables and show a slight decrease in food insecurity.39
In FY13, 18.9 million NSLP participants, 10.16 million SBP students, and 2.43 million SFSP children ate free meals, an increase of 22.7%, 35.8%, and 14.0%, respectively, since FY08. CACFP served free and reduced-price meals to 3.68 million clients, with participation relatively steady since FY08.40 Data on enrollment rates among homeless children are not available.
Medicaid and CHIP
Established in 1965 pursuant to the Title XIX amendments to the Social Security Act, Medicaid is a joint federal-state program that provides health insurance coverage to certain low-income families and persons with disabilities. The Centers for Medicare and Medicaid Services provides oversight while states control program eligibility requirements. Created in 1997 as part of the Balanced Budget Act, CHIP provides matching funds for state health insurance programs serving uninsured children and pregnant women in families who do not qualify for Medicaid but are unable to afford private insurance.41 Due to the expansion of federal programs including Medicaid and CHIP prior to the Patient Protection and Affordable Care Act of 2010, fewer children were uninsured in 2012 (8.9%) than in 2007 (11.0%).42 Together, Medicaid and CHIP currently cover approximately 33.7 million children.43
Despite the expansion of Medicaid and CHIP, homeless participation rates are low. Only one-fifth (20.2%) of adults exiting shelter nationwide in 2011 received Medicaid benefits (Figure 5). Participation was generally higher in the Midwest, Mid-Atlantic, and Northeast, with Massachusetts (57.3%) enrolling the greatest percentage of adults and Wyoming (3.0%) the least. Enrollment in CHIP was even lower than Medicaid at 1.2% in 2011 (Figure 6). Homeless parents in Wisconsin (8.7%), Indiana (7.5%), Vermont (7.5%), Tennessee (5.9%), and Nebraska (5.3%) utilized CHIP at the highest rates. In eight states and the District of Columbia, no homeless families participated in CHIP.44
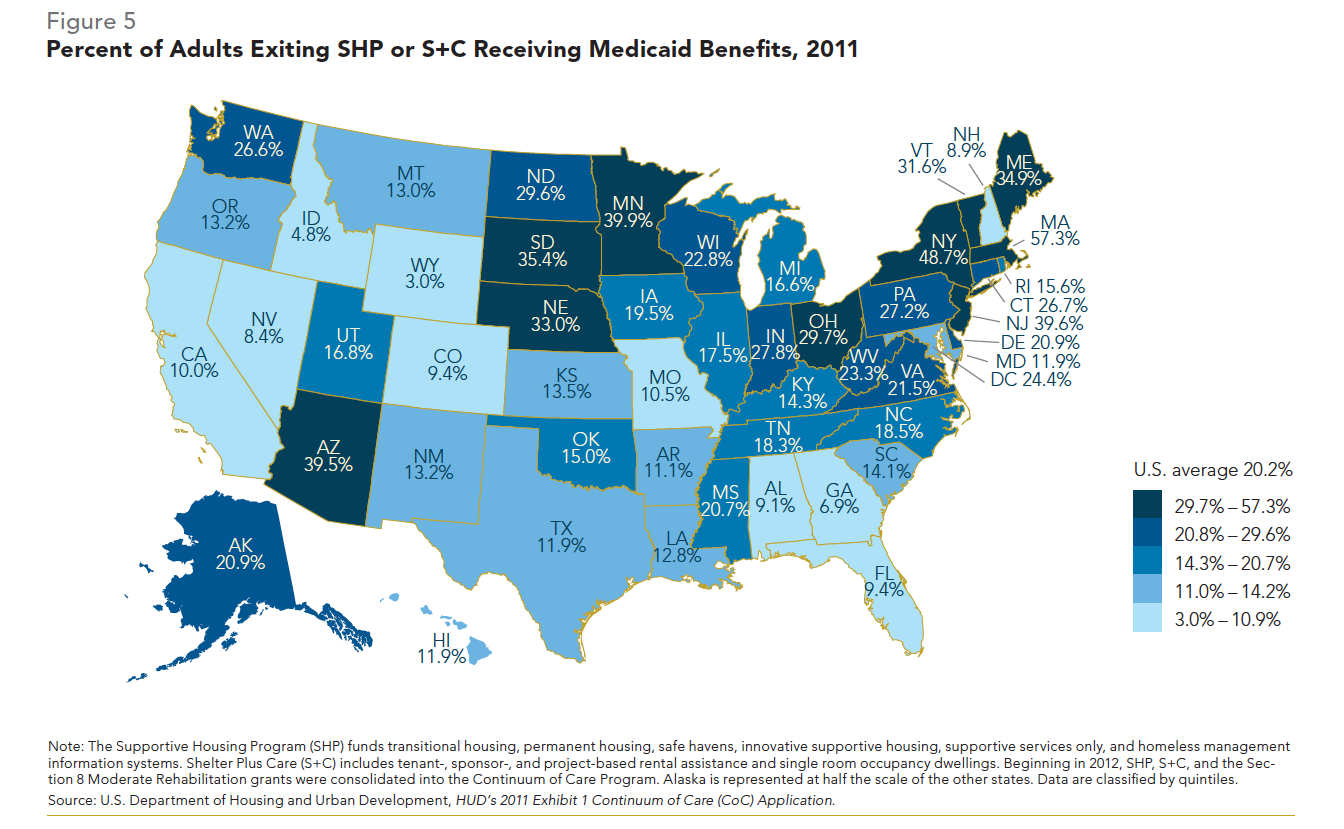
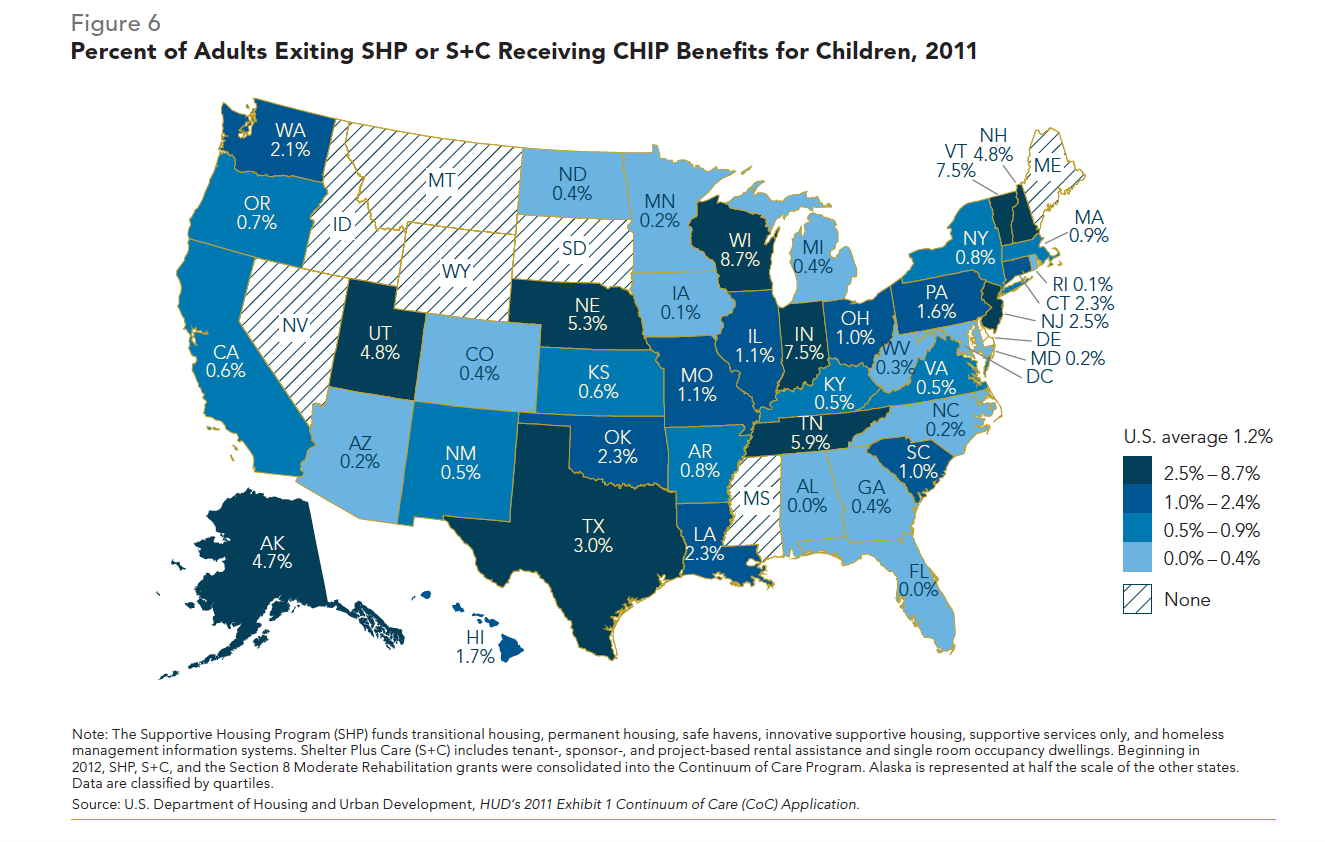
In addition to the lack of health care insurance in many low-income households, homeless families face further obstacles to accessing health care. Transportation is a significant problem for families living in rural or suburban areas where clinics are typically far apart. School-based health centers work to decrease transit barriers for rural families and have been found to reduce asthma hospitalizations among children by 75%.45 Families with language barriers or limited education may be deterred by complicated registration procedures, while restricted clinic hours and lack of child care can prevent working families from seeking medical care. Nearly one-third (31.8%) of homeless women in Massachusetts listed not having child care as a major barrier to accessing medical services.46
Health Care for the Homeless
In addition to Medicaid and CHIP, federally funded Health Care for the Homeless (HCH) programs specifically serve homeless families and individuals unable to access or afford health services on their own. HCH is one of the few programs targeted to exclusively serve homeless persons, even though the mainstream programs of Medicaid and CHIP are also available. Founded in 1985, HCH was created with the goal of using health care to address a broader range of problems affecting homeless persons. At community-based centers throughout the country, health workers provide free comprehensive medical and dental care to homeless families. Social workers link participants to services related to shelter, jobs, and permanent housing. In 2013, 250 federally funded HCH projects served 851,641 persons (including 818,882 homeless patients), more than half (57.0%) of whom were uninsured. California accounted for 224,932 or over one in four (27.5%) of all patients served (Figure 7).47 Separate data for homeless families with children are not available.
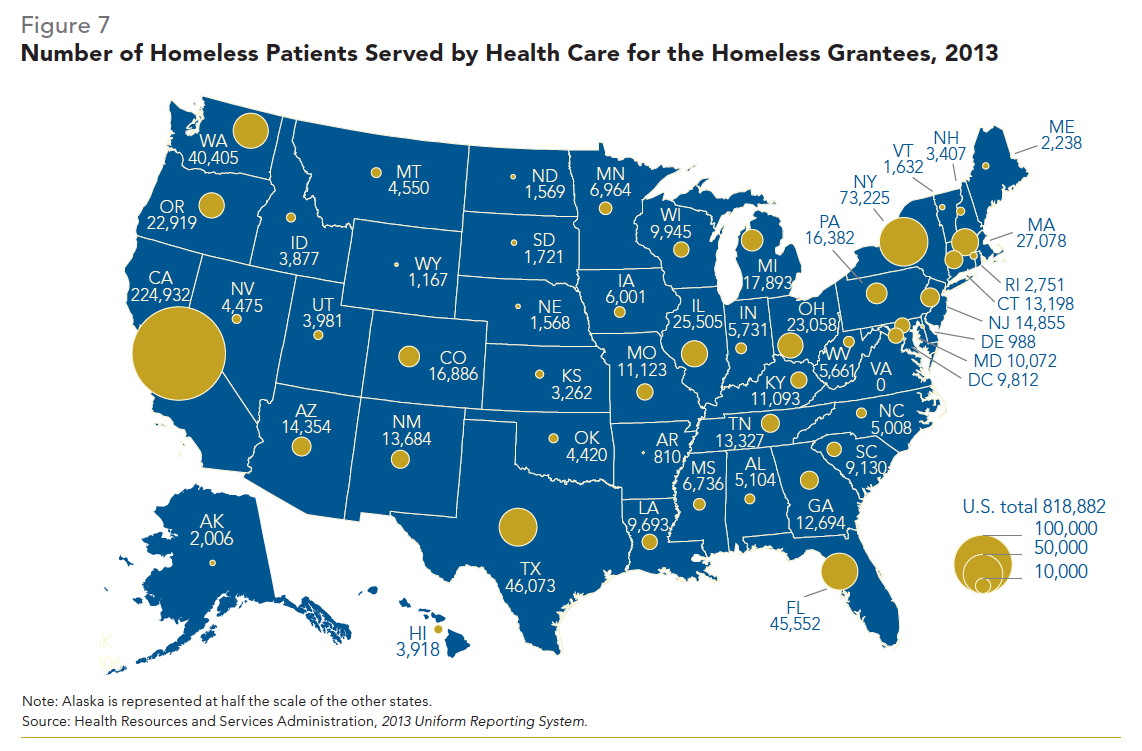
Unfortunately, HCH centers reach less than one-third of the three to four million homeless persons in need of care annually.48 A 2006 study on the availability of health services for homeless families and individuals revealed that due to a lack of resources, one quarter (25%) of persons requesting primary health care were turned away and approximately one third of programs were unable to provide dental care.49 Families unable to access care at HCH centers often endure significant wait times before receiving services from other health providers, which can exacerbate their illnesses.
SSI/SSDI
Homeless families experience disproportionally high rates of disability; 18.6% of sheltered adult family members had a disability in 2012 compared with 8.1% of adults in families nationwide.50 SSI and SSDI are disability benefit programs that are not time-limited. Managed by the Social Security Administration (SSA), they provide monthly cash assistance to eligible low-income adults and children.51 Increasing SSI and SSDI enrollment reduces expenditures from state-funded general assistance programs and state-only medical or mental health services and lowers the rate of uncompensated emergency care.52 Launched in 2005, the federally funded SSI/SSDI Outreach, Access and Recovery (SOAR) initiative helps states and localities increase eligible homeless persons’ enrollment in SSA disability benefits. Although chronically homeless singles are the primary recipient group for benefits among homeless persons, SSI and SSDI are also crucial supports for homeless and at-risk families, providing better access to income and health insurance.53
One-fifth (19.7%) of all adults exiting SHP or S+C received SSA disability benefits in 2011, with 13.4% enrolled in SSI and 6.3% obtaining SSDI (Figure 8). Delaware had the greatest proportion of homeless persons enrolled in disability benefit programs (52.3%). Northeastern states, along with Alabama (33.4%), Alaska (32.7%), Minnesota (26.3%), Oklahoma (26.3%), and Wisconsin (25.7%), also had high participation rates. States in the Midwest, West, and Southeast regions had the lowest percentage of recipients, with Wyoming (5.0%) having the lowest rate.54
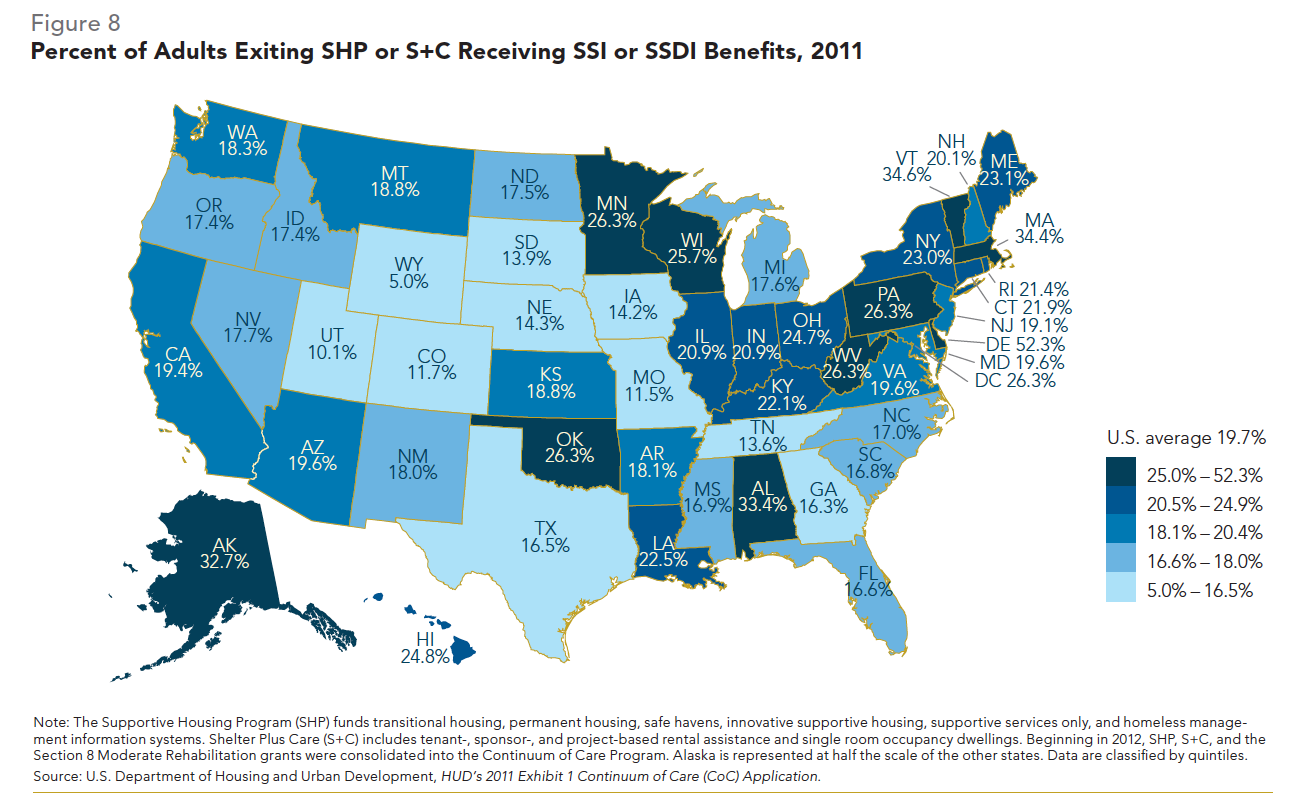
Nationally, about 29% of SSI or SSDI applications are approved after the first submission. However, for homeless persons without guidance during the application process, the approval rate is roughly 10 –15%.55 Homeless persons also face a number of barriers to accessing benefits, including disability evaluators inexperienced with homelessness, a lack of medical history documentation, and a lack of transportation to application offices. While homeless families and individuals frequently meet SSA disability criteria, they are often unaware of their eligibility.56
Social service providers receive SOAR training based on the Substance Abuse and Mental Health Services Administration’s Stepping Stones to Recovery curriculum, which provides an in-depth, step-by-step model for identifying eligible homeless persons and offering guidance on SSI and SSDI applications.57 When homeless clients received assistance during the submission process, the approval rate on initial requests averaged 65.0% between 2006 and 2013 (up from 10 –15% without guidance).58
SOAR has been implemented in all 50 states and the District of Columbia making SOAR training available nationwide.59 According to data taken from the annual competitive applications for HUD homelessness funding, 77.3% of Continua of Care (CoCs) had participated in SOAR training by 2011. Analysis of this data from 2008 to 2011 indicates that CoCs trained in SOAR have more adults exiting SHP or S+C with SSA disability benefits. The 51 CoCs that received SOAR training in 2009 improved their participation rates from 19.5% in 2008 to 21.2% in 2010 and 21.6% in 2011 (Figure 9).
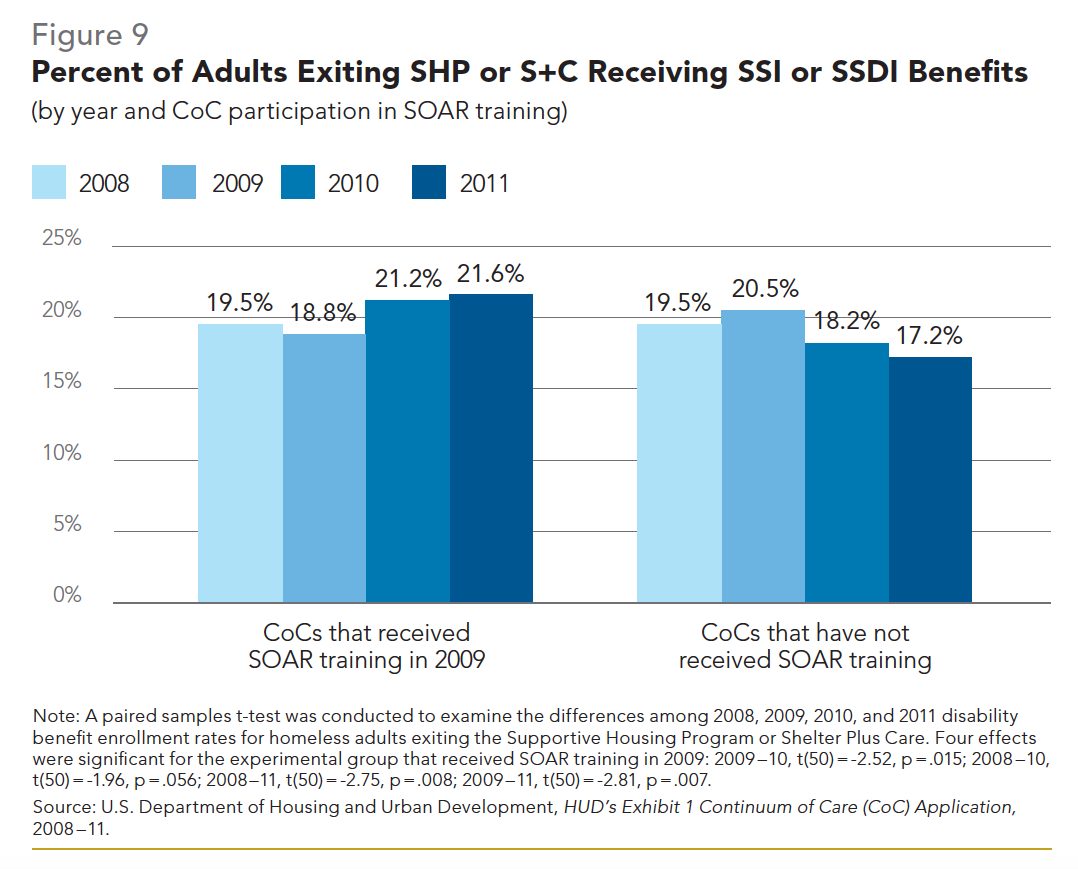
There was no statistical difference among rates for the 90 CoCs that did not receive training by 2011.60
SOAR implementation after the initial training period remains crucial. Despite informative in-state SOAR trainings, a 2009 study found that case managers rarely put what they learn into practice. Rather than discrediting program effectiveness, the lack of follow-through highlights the importance of additional support. States with the greatest success in connecting eligible homeless persons to benefits have had consistent leadership from qualified trainers, strong organization-level commitment, and significant levels of engagement, interagency communication, targeted implementation, and outcome-data collection. In-state SOAR trainers already familiar with the SSI/SSDI application process are more effective in training case managers on the SOAR curriculum. States that piloted the initiative and systematically tracked outcome data were able to troubleshoot problems and overcome initial barriers.61
No Cash Income or Non-cash Benefits
Federal policy has emphasized using mainstream resources to fill gaps in targeted funding and services for homeless families. However, due to access barriers ranging from transportation to documentation to eligibility, homeless families are connected to mainstream services at low rates. Once enrolled, homeless families have difficulty maintaining their benefits. As a result of low enrollment and poor retention, over one-fifth (22.5%) of adults nationwide exiting SHP and S+C in 2011 had no source of income. Homeless persons are least likely to exit these programs without income in Mississippi (2.1%), Alaska (3.9%) and New Jersey (7.2%), and most likely to do so in Rhode Island (42.3%), Arizona (35.1%), and Florida (34.8%) (Figure 10).62
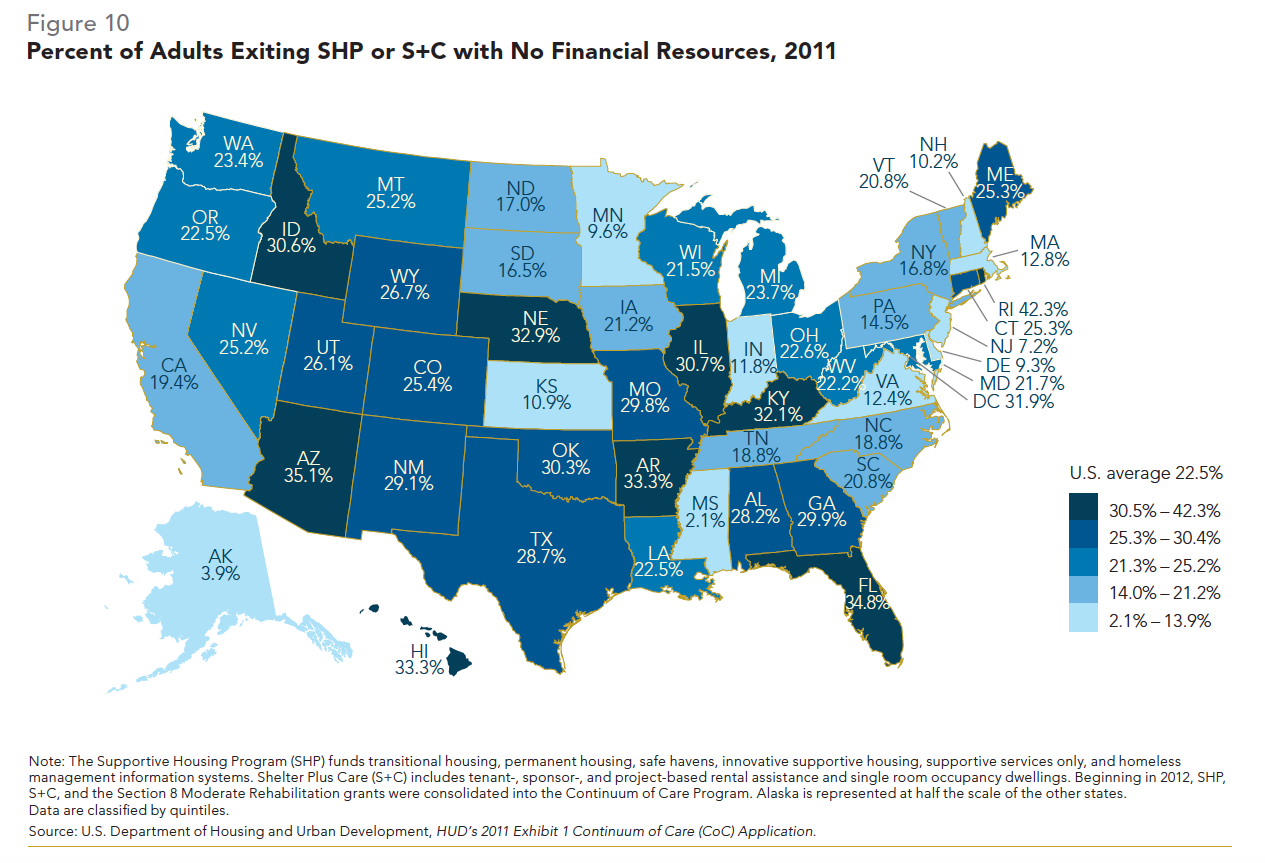
Federal Strategy and Local Performance
The 2010 federal strategic plan to prevent and end homelessness, Opening Doors, calls for homeless families to be connected to mainstream benefits in order to maximize targeted homelessness funds for housing; the 2013 plan update reiterates this goal.63 Utilizing these existing social safety net programs instead of creating homelessness-specific programs avoids duplication of services. HUD has enforced this policy by requiring that local homelessness coordinating and planning bodies, organized as CoCs, demonstrate how they intend to systematically connect homeless families to mainstream benefits as a condition to receive funding.64
Before a homelessness service provider within a CoC can receive federal funding, HUD requires that a specific plan be established to ensure that homeless clients will be individually assisted by specialized staff to obtain the mainstream health, social service, and employment benefits for which they are eligible. CoCs have to provide training to its members on how to determine eligibility and communicate with provider staff any changes to mainstream program requirements. CoCs must also analyze Homeless Management Information Systems (HMIS) data collected in shelters in order to monitor and improve access to mainstream programs. CoCs must have active planning committees focused on this goal that meet at least three times per year and collaborate with the state’s interagency council on homelessness.65
Since FY08, HUD has used its annual competitive funding application process to measure CoC progress on connecting homeless households to mainstream benefits. Specifically, HUD requires CoCs to report on the percentage of service providers who are implementing four specific performance indicators. Case managers should help clients complete applications for mainstream benefits; provide transportation assistance to benefit appointments, employment training, and jobs; use a single application form for four or more mainstream programs; and systematically follow up with clients to ensure mainstream benefits are received.66
ICPH analysis of FY11 CoC applications for HUD funding finds that the majority of service providers are performing well on these four indicators. Out of 427 CoCs, over two-thirds (68.9%, or 294) reported that all providers in the CoC systematically assist clients in completing mainstream benefit applications, while just 2.1% noted that less than 50% of providers met this requirement (Figure 11). Nearly half (46.1%, or 197) of CoCs reported that all providers supply transportation assistance to clients in order to attend mainstream benefit appointments, employment training, and jobs (Figure 12). CoCs demonstrated mixed results in streamlining the application process by consolidating forms for four or more mainstream programs into a single application (Figure 13). Although 38.6%, or 165, CoCs indicated that all of their providers simplified the benefit application process in FY11, nearly an equivalent number, 31.1%, or 133, reported that no providers in their CoC did so. Nearly two-thirds (62.1%, or 265) of CoCs indicated in FY11 that all providers have staff who systematically follow up with clients to ensure that they received the mainstream benefits for which they applied (Figure 14). Only 4.0%, or 17 CoCs reported that less than 50% of providers have staff verify that clients received their mainstream benefits.67
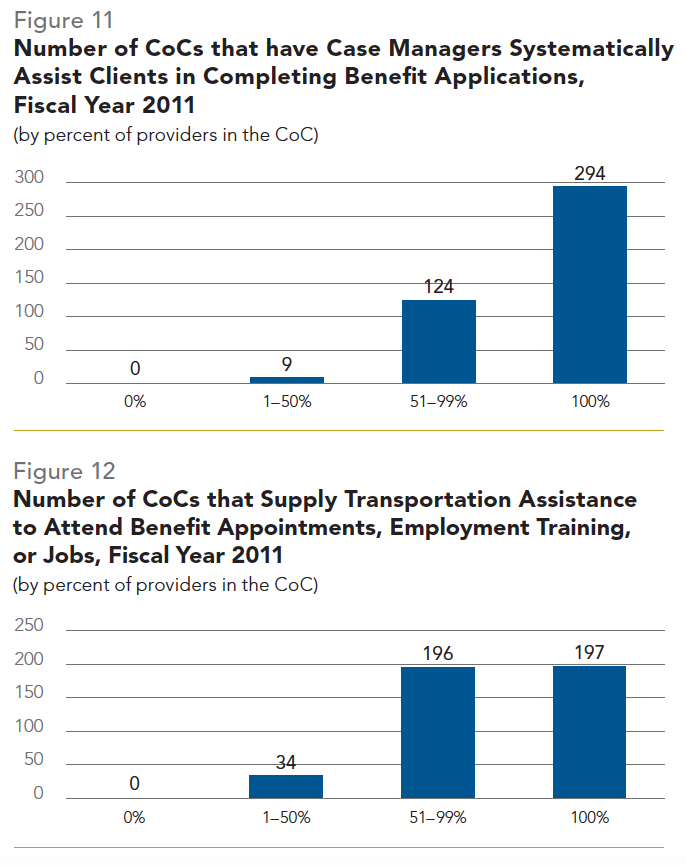
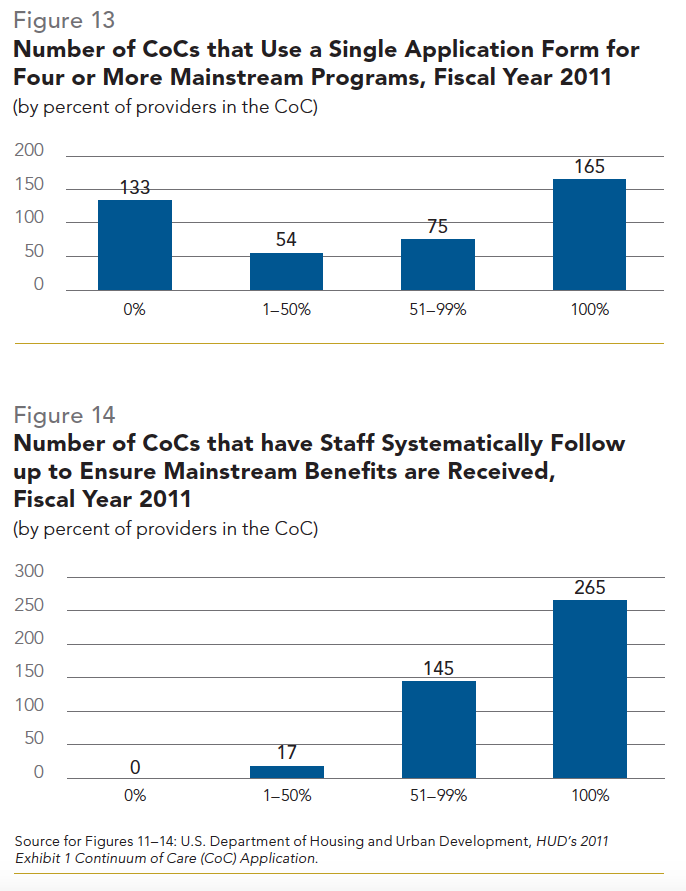
In FY05–11, CoCs were also required to report the number of adults exiting homelessness programs who received specific mainstream benefits. In the FY12 competitive application process, HUD began including the increased use of mainstream benefits as one of six national policy priorities. CoCs are now required to indicate the percent of clients enrolled in social safety net programs and propose future target benchmarks to achieve. In FY12, HUD also expanded the number of benefit programs for which CoCs must help clients apply. A complete list of the programs is provided in Table 1 (see on next page), separating sources of cash income from non-cash benefits. Although increasing the number of programs should improve accountability, discerning participation rates for family-only benefits, such as TANF, WIC, and CHIP, will continue to be a challenge since the total number of adults exiting programs are not distinguished by household composition.68
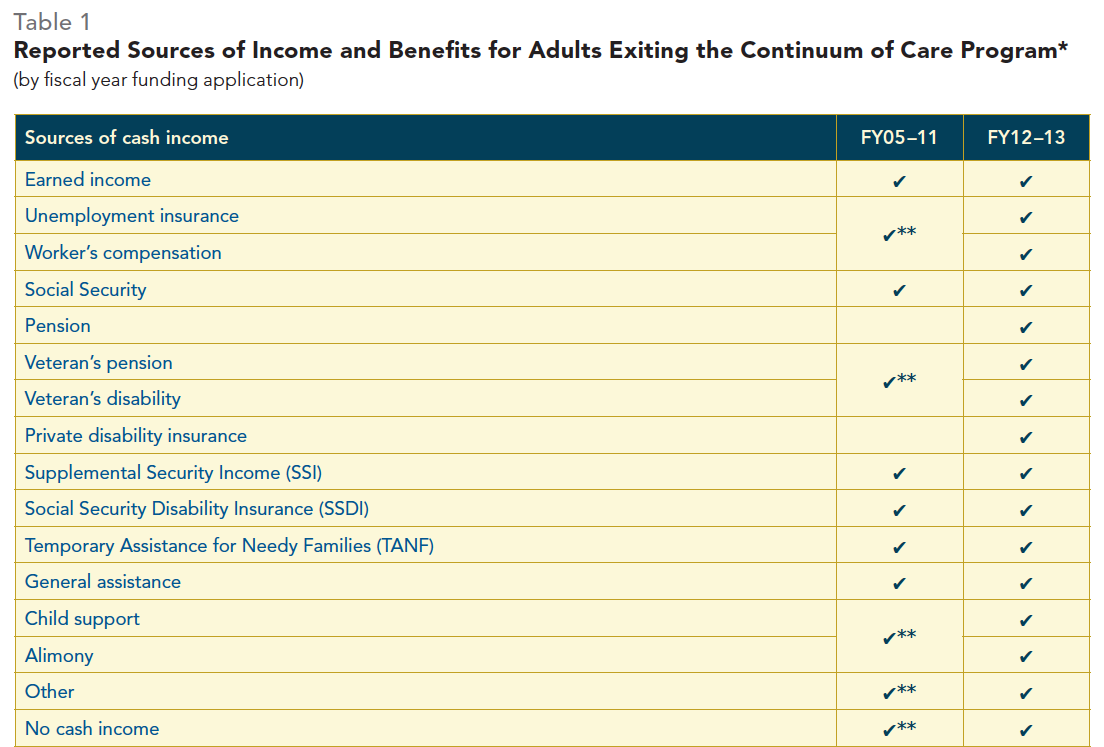
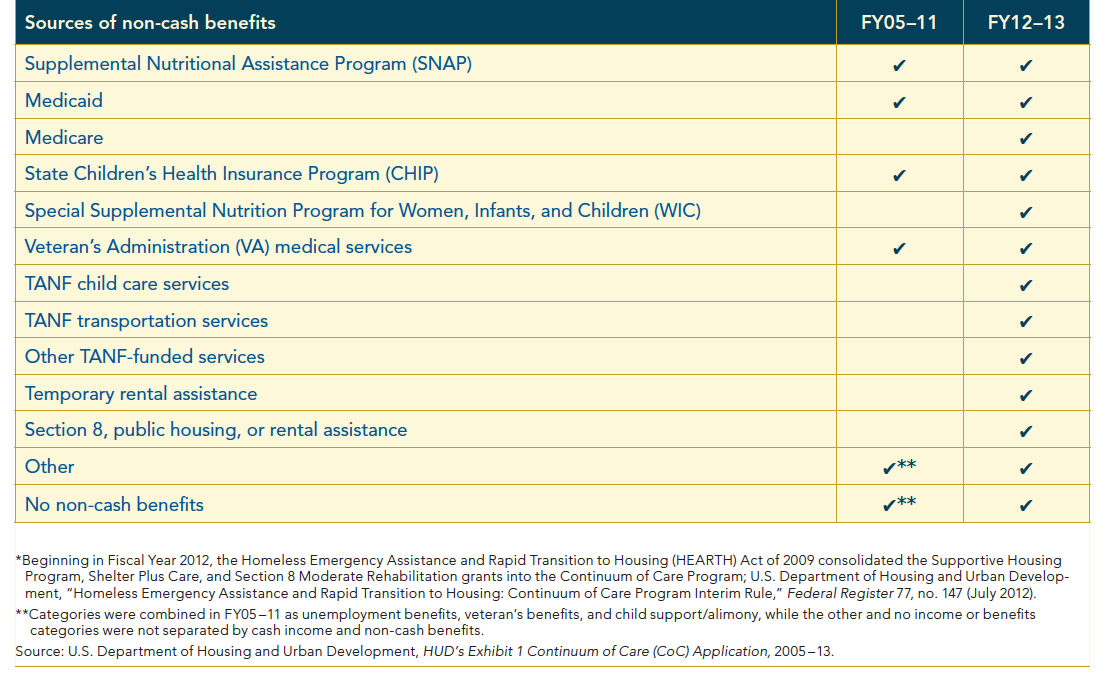
Endnotes
Issue by Issue
Issue 1
Definitions, Demographics, and Trends in Student and Family Homelessness
1 McKinney-Vento Homeless Education Assistance Improvements Act of 2001, Public Law 107–110, U.S. Code 42 (2002), §11431 et seq.
2 U.S. Department of Health and Human Services, Homeless Children: Update on Research, Policy, Programs, and Opportunities, May 2010.
3 Homeless Emergency Assistance and Rapid Transition to Housing Act of 2009, S 896, 111th Cong., 1st sess.
4 U.S. Department of Education, “ED Data Express,” http://www.eddataexpress.ed.gov.
5 Ibid.; U.S. Department of Education, Digest of Education Statistics 2013.
6 NYS-TEACHS, Data and Statistics on Homelessness, School Year 2012–13; New York City Department of Education, Demographic Snapshots 2007–08 to 2013–14; Los Angeles Unified School District, Homeless Education Program Data, 2012–13; California Department of Education, “DataQuest,” http://data1.cde.ca.gov/dataquest; Chicago Coalition for the Homeless, City, State Homeless Enrollments Rose 8% in 2012–13, 2013; Dallas Independent School District, Evaluation and Assessment At-a-glance 2012–13; Dallas Independent School District, State Compensatory Education Program: 2012–13.
7 Ralph da Costa Nunez and Matthew Adams, “Primary Stakeholders’ Perspectives on Services for Families without Homes,” in Supporting Families Experiencing Homelessness, ed. Mary E. Haskett, Staci Perlman, and Beryl Ann Cowan (New York, NY: Springer, 2014).
8 U.S. Department of Education, Consolidated State Performance Reports: School Year 2012–13; U.S. Department of Education, State Nonfiscal Public Elementary/Secondary Education Survey 2012–13 v.1a.
9 National Center on Family Homelessness, America’s Youngest Outcasts 2010; National Council on Disability, The Impact of Hurricanes Katrina and Rita on People with Disabilities: A Look Back and Remaining Challenges, August 2006; National Center for Homeless Education, Education for Homeless Children and Youth Program Data Collection Summary, 2010; U.S. Department of Education, “ED Data Express,” http://www.eddataexpress.ed.gov.
10 National Center for Homeless Education, Education for Homeless Children and Youth Program Data Collection Summary, 2010–14; U.S. Department of Education, “ED Data Express,” http:// www.eddataexpress.ed.gov.
11 National Association for the Education of Homeless Children and Youth and First Focus, A Critical Moment: Child and Youth Homelessness in Our Nation’s Schools, 2010.
12 National Center for Homeless Education, Education for Homeless Children and Youth Program Data Collection Summary, 2010–14; U.S. Department of Education, “ED Data Express,” http:// www.eddataexpress.ed.gov.
13 United States Government Accountability Office, Education of Homeless Students: Improved Program Oversight Needed, July 2014.
14 Institute for Children, Poverty, and Homelessness, “Federal Aid for Homeless Students,” in The American Almanac of Family Homelessness (2013).
15 U.S. Department of Education, Education Department Budget History State Tables: FY 1980–FY 2014 President’s Budget; U.S. Department of Education, Fiscal Years 2013–15 State Tables for the U.S. Department of Education; U.S. Department of Education, American Recovery and Reinvestment Act of 2009—Spending Reports by State as of September 30, 2010–11; U.S. Department of Education Office of Inspector General, School District’s Use of Recovery Act and Education Jobs Funds, September 2012.
16 National Center for Homeless Education, Data Collection Summary, 2010–14.
17 Consolidated Appropriations Act of 2014, HR 3547, 113th Cong., 2nd sess.
18 U.S. Department of Housing and Urban Development, The Annual Homeless Assessment Report to Congress, 2009–13.
19 National Alliance to End Homelessness, Economy Bytes: Doubled Up in the United States, 2010; U.S. Department of Housing and Urban Development, The 2009 Annual Homeless Assessment Report to Congress.
20 U.S. Department of Housing and Urban Development, HUD’s 2014 Continuum of Care Homeless Assistance Programs— Homeless Populations and Subpopulations.
21 U.S. Department of Housing and Urban Development, A Guide to Counting Sheltered Homeless People: Third Revision, January 2012; U.S. Department of Housing and Urban Development, A Guide to Counting Unsheltered Homeless People: Second Revision, January 2008; U.S. Department of Housing and Urban Development, The Annual Homeless Assessment Report to Congress, 2009–14.
22 U.S. Department of Housing and Urban Development, The Annual Homeless Assessment Report to Congress, 2009–13; U.S. Department of Housing and Urban Development, 2007–14 Housing Inventory Chart (HIC) Data by CoC.
23 U.S. Department of Housing and Urban Development, The 2012 Annual Homeless Assessment Report to Congress.
24 Adult is defined as a person over age 24; U.S. Department of Housing and Urban Development, HUD’s 2014 CoC Homeless Assistance Programs—Homeless Populations and Subpopulations.
25 Chronically homeless families are those that have at least one adult member with a disabling condition and that have been continuously homeless for at least a year or have had at least four episodes of homelessness in the past three years; Homeless Emergency Assistance and Rapid Transition to Housing (HEARTH) Act of 2009, S 896, 111th Cong., 1st sess.
26 Corporation for Supportive Housing, Family Permanent Supportive Housing: Preliminary Research of Family Characteristics, Program Models, and Outcomes, February 2006.
27 U.S. Department of Housing and Urban Development, The 2012 Annual Homeless Assessment Report to Congress.
28 Ibid.
29 Ibid.
30 Metropolitan Policy Program at Brookings, The Suburbanization of Poverty: Trends in Metropolitan America, 2000 to 2008, 2010.
31 Carsey Institute, The Unequal Distribution of Child Poverty: Highest Rates among Young Blacks and Children of Single Mothers in Rural America, 2010; Housing Assistance Council, Poverty in Rural America, October 2010; National Alliance to End Homelessness, Fact Sheet: Rural Homelessness, January 2010; Marjorie Robertson, et al., “Rural Homelessness,” in Toward Understanding Homelessness: The 2007 National Symposium on Homelessness Research, ed. Deborah Dennis, Gretchen Locke, and Jill Khadduri (Washington, D.C.: U.S. Department of Health and Human Services and U.S. Department of Housing and Urban Development, 2007); U.S. Department of Agriculture, “Understanding Rural America,” http://www.ers.usda.gov/publications/aib-agricultural-information-bulletin/aib710.aspx.
32 Institute for Children, Poverty, and Homelessness, “Rural Homeless Families: Undercounted and Underserved,” in The American Almanac of Family Homelessness (2013).
33 U.S. Department of Housing and Urban Development, The 2012 Annual Homeless Assessment Report to Congress.
34 Vera Institute of Justice, Understanding Family Homelessness in New York City, 2005; Marybeth Shinn, “Efficient Targeting of Homelessness Prevention Services,” (conference presentation, International Homelessness Research Conference, Philadelphia, PA, June 3, 2013).
35 U.S. Department of Housing and Urban Development, 2011 Exhibit 1 Continuum of Care (CoC) Application.
36 U.S. Department of Health and Human Services, Characteristics and Dynamics of Homeless Families with Children, 2007; U.S. Census Bureau, 2013 American Community Survey 1-year Estimates.
37 Institute for Children, Poverty, and Homelessness, Profiles of Risk: Education, 2011.
38 Civic Enterprises, The Silent Epidemic: Perspectives of High School Dropouts, 2006.
39 Data sets analyzed in this report use slightly different definitions for racial and ethnic categories. The U.S. Census Bureau, U.S. Bureau of Justice Statistics, and U.S. Department of Housing and Urban Development data define “white” as “non-Hispanic white,” while “white” in U.S. Bureau of Labor Statistics data sets also include white persons identifying as “Hispanic.” Hispanics may identify as any race. Therefore, the “black,” “Asian,” and “Native American or Alaska Native” categories overlap to a very minor extent with the “Hispanic” group except in the case of U.S. Bureau of Justice Statistics data, where “blacks” refers to “non-Hispanic blacks” only.
40 U.S. Department of Housing and Urban Development, The 2012 Annual Homeless Assessment Report to Congress; U.S. Census Bureau, 2012 American Community Survey 1-year Estimates.
41 Marybeth Shinn, “International Homelessness: Policy, Socio-cultural, and Individual Perspectives,” Journal of Social Issues 63, no. 3 (2007): 657–77; George Carter, “From Exclusion to Destitution: Race, Affordable Housing, and Homelessness,” Cityscape 13, no. 1 (2011): 33–70; Roberta Ann Johnson, “African Americans and Homelessness: Moving Through History,” Journal of Black Studies 40, no. 4 (2010): 583–605; Robert Rosenheck, et al., “Special Populations of Homeless Americans,” in Practical Lessons: The 1998 National Symposium on Homelessness Research, ed. Linda Fosburg and Deborah Dennis (Washington, D.C.; U.S. Department of Health and Human Services and U.S. Department of Housing and Urban Development, 1999), 46–76; Kim Hopper and Norweeta Milburn, “Homelessness among African Americans: A Historical and Contemporary Perspective,” in Homelessness in America, ed. Jim Baumohl (Westport, CT: Oryx Press, 1996), 123–31.
42 Christopher Wildeman, Parental Incarceration, Child Homelessness, and the Invisible Consequences of Mass Imprisonment, August 2011; Princeton University, Center for Research on Child Wellbeing, Parental Incarceration and Child Wellbeing in Fragile Families, April 2008; U.S. Bureau of Justice Statistics, Parents in Prison and Their Minor Children, August 2008.
43 U.S. Census Bureau, 2012 American Community Survey 1-year Estimates.
44 New York City Commission on Human Rights, Race At Work: Realities of Race and Criminal Record in the NYC Job Market, December 2005; Devah Pager, “The Use of Field Experiments for Studies of Employment Discrimination: Contributions, Critiques, and Directions for the Future,” The ANNALS of the American Academy of Political and Social Science 609, no. 1 (2007): 104–33.
45 U.S. Bureau of Labor Statistics, Labor Force Characteristics by Race and Ethnicity, 2012.
46 Pew Research Center, Wealth Gaps Rise to Record Highs Between Whites, Blacks and Hispanics, July 2011.
47 John Karl Scholtz and Kara Levine, “U.S. Black-white Wealth Inequality,” in Social Inequality, ed. Kathryn Neckerman (New York, NY: Russell Sage Foundation, 2004), 895–929.
48 U.S. Census Bureau, 2012 American Community Survey 1-year Estimates.
49 U.S. Census Bureau, The American Indian and Alaska Native Population: 2010; U.S. Census Bureau, 2008–12 American Community Survey 5-year Estimates.
50 U.S. Department of Housing and Urban Development, The 2012 Annual Homeless Assessment Report to Congress; U.S. Census Bureau, 2012 American Community Survey 1-year Estimates.
51 U.S. Commission on Civil Rights, A Quiet Crisis: Federal Funding and Unmet Needs in Indian Country, July 2003; U.S. Department of Housing and Urban Development, Discrimination in Metropolitan Housing Markets: Phase III—Native Americans September 2003; Housing Assistance Council, Housing on Native American Lands, June 2008.
52 National Health Care for the Homeless Council, Health Care for Homeless Native Americans, February 2004.
53 Housing Assistance Council, Taking Stock: Rural People, Poverty, and Housing at the Turn of the 21st Century, December 2002.
54 U.S. Department of Education, Tribal Leaders Speak: The State of American Indian Education, 2010; U.S. Commission on Civil Rights, A Quiet Crisis, 2003; U.S. Department of Education, Status and Trends in the Education of American Indians and Alaska Natives: 2008.
55 U.S. Census Bureau, 2012 American Community Survey 1-year Estimates.
56 Wilder Research, Homelessness and Near-homelessness on Minnesota Indian Reservations: 2012 Minnesota Homeless Study.
57 U.S. Census Bureau, 2012 American Community Survey 1-year Estimates; U.S. Commission on Civil Rights, A Quiet Crisis, 2003.
58 U.S. Department of Housing and Urban Development, The 2012 Annual Homeless Assessment Report to Congress; U.S. Census Bureau, 2012 American Community Survey 1-year Estimates.
59 Stephen Conroy and David Heer, “Hidden Hispanic Homelessness in Los Angeles: The ‘Latino Paradox’ Revisited,” Hispanic Journal of Behavioral Sciences 25, no. 4 (2003): 530–8; Susan González Baker, “Homelessness and the Latino Paradox,” in Homelessness in America, ed. Jim Baumohl (Westport, CT: Oryx Press, 1996), 132–40.
60 Congressional Research Service, Noncitizen Eligibility for Federal Public Assistance: Policy Overview and Trends, September 2012; National Immigration Law Center, Overview of Immigrant Eligibility for Federal Programs, October 2011; Anna Pohl, et al., “Barriers to Accessing Services: The Importance of Advocates Accompanying Battered Immigrants Applying For Public Benefits,” in Breaking Barriers: A Complete Guide to Legal Rights and Resources for Battered Immigrants (2004); National Alliance to End Homelessness, Changes in Laws Relating to Immigration: Impact on Homeless Assistance Providers, 1997.
61 Associated Press, “Push For Tough State Immigration Measures Could Spread if Supreme Court Upholds Arizona Law,” Washington Post, April 28, 2012; Gretchen Keiser, “Catholic Conference Testifies Against Immigration Bill,” The Georgia Bulletin, March 3, 2011; Pew Hispanic Center, Illegal Immigration Backlash Worries, Divides Latinos, October 2010; National Immigration Law Center, SB 1070 Four Years Later: Lessons Learned, April 2014.
62 Julia Preston, “Amid Steady Deportation, Fear and Worry Multiply Among Immigrants,” New York Times, December 22, 2013; University of Illinois at Chicago, Department of Urban Planning and Policy, Insecure Communities: Latino Perceptions of Police Involvement in Immigration Enforcement, May 2013.
63 U.S. Census Bureau, 2012 American Community Survey 1-year Estimates.
64 U.S. Bureau of Labor Statistics, Labor Force Characteristics by Race and Ethnicity, 2012.
65 Pew Research Center, Wealth Gaps Rise to Record Highs, 2011.
66 Pew Hispanic Center, Latino Children: A Majority Are U.S.-born Offspring of Immigrants, May 2009; Pew Hispanic Center, A Portrait of Unauthorized Immigrants in the United States, April 2009.
67 U.S. Census Bureau, 2012 American Community Survey 1-year Estimates.
68 U.S. Department of Housing and Urban Development, The 2012 Annual Homeless Assessment Report to Congress; U.S. Census Bureau, 2012 American Community Survey 1-year Estimates.
69 Asian American Justice Center and Asian Pacific American Legal Center, A Community of Contrasts: Asian Americans and Pacific Islanders in the United States, 2006.
70 U.S. Census Bureau, 2012 American Community Survey 1-year Estimates.
71 Asian Task Force Against Domestic Violence, Asian Family Violence Report: A Study of the Chinese, Cambodian, Korean, South Asian, and Vietnamese Communities in Massachusetts, 2000; Family Violence Prevention Fund, (Un)heard Voices: Domestic Violence in the Asian American Community, 2004.
72 Data were not available for Miami, FL or Denver, CO; U.S. Department of Housing and Urban Development, AHAR Exchange Public Reports: 2011 Comprehensive Report of Sheltered Homeless Persons; U.S. Census Bureau, 2008–12 American Community Survey 5-year Estimates.
73 While most homeless individuals and families are sheltered in urban areas (70.2%), racial and ethnic differences exist in suburban and rural locations. In 2012, the greatest share (43.2%) of urban homeless individuals and persons in families were black, while non-Hispanic white persons dominated suburban and rural homelessness statistics (52.7%); U.S. Department of Housing and Urban Development, The 2012 Annual Homeless Assessment Report to Congress.
Issue 2
Macroeconomic Causes of Family Homelessness
1 U.S. Census Bureau, Poverty in the United States: 2000; U.S. Census Bureau, Income, Poverty, and Health Insurance Coverage in the United States: 2012; U.S. Department of Health and Human Services, 2012 Poverty Guidelines.
2 Urban Institute, Childhood Poverty Persistence: Facts and Consequences, June 2010.
3 U.S. Census Bureau, 2012 American Community Survey 1-year Estimates; U.S. Department of Housing and Urban Development, The 2012 Annual Homeless Assessment Report to Congress.
4 U.S. Census Bureau, Income, Poverty, and Health Insurance Coverage in the United States: 2012.
5 U.S. Bureau of Labor Statistics, Employment Characteristics of Families Summary, April 2012; U.S. Department of Housing and Urban Development, Worst Case Housing Needs 2009: Report to Congress; Legal Momentum, Single Mothers Since 2000: Falling Farther Down, January 2011.
6 U.S. Department of Housing and Urban Development, The 2012 Annual Homeless Assessment Report to Congress.
7 U.S. Census Bureau, Income and Poverty in the United States: 2013; U.S. Census Bureau, “Income, Poverty and Health Insurance Coverage in the United States: 2013,” press release, September 16, 2014.
8 U.S. Department of Labor, “Bureau of Labor Statistics: Labor Force Statistics from the Current Population Survey,” http://www.bls.gov/cps.
9 Underemployment refers to persons not working as many hours as they would desire; U.S. Bureau of Labor Statistics, National Unemployment, 2011; National Low Income Housing Coalition, Out Of Reach 2011.
10 Andrew Sum and Ishwar Khatiwada, “The Nation’s Underemployed in the ‘Great Recession’ of 2007–09,” Monthly Labor Review 133, no. 11 (2010): 3–15; U.S. Department of Labor, “Bureau of Labor Statistics: Labor Force Statistics from the Current Population Survey,” http://www.bls.gov/cps.
11 U.S. Bureau of Labor Statistics, “Employment Situation Summary,” press release, November 7, 2014.
12 Center for Law and Social Policy, Low-income Workers and Families Hardest Hit by Economic Decline Need Help Now, June 2008.
13 U.S. Bureau of Labor Statistics, “Employment Situation Summary,” press release, November 7, 2014.
14 U.S. Department of Health and Human Services, Characteristics and Dynamics of Homeless Families with Children, 2007; U.S. Census Bureau, 2013 American Community Survey 1-year Estimates.
15 Civic Enterprises, The Silent Epidemic: Perspectives of High School Dropouts, March 2006.
16 U.S. Census Bureau, The Big Payoff: Educational Attainment and Synthetic Estimates of Work-life Earnings, July 2002.
17 U.S. Department of Housing and Urban Development, “Affordable Housing,” http://www.hud.gov/ offices/cpd/affordablehousing; U.S. Conference of Mayors, Hunger and Homelessness Survey: A Status Report on Hunger and Homelessness in America’s Cities, A 25-city Survey, December 2013.
18 U.S. Department of Housing and Urban Development, Worst Case Housing Needs 2011: Report to Congress; National Low Income Housing Coalition, Out of Reach 2014, March 2014.
19 U.S. House of Representatives, Committee on Ways and Means, 2008 Green Book (Washington, D.C.: U.S. Government Printing Office, 2008); Center on Budget and Policy Priorities, Introduction to the Housing Voucher Program, May 2009.
20 U.S. Interagency Council on Homelessness, Opening Doors: Federal Strategic Plan to Prevent and End Homelessness, 2010; U.S. Interagency Council on Homelessness, Opening Doors: Federal Strategic Plan to Prevent and End Homelessness, Update 2011.
21 U.S. House of Representatives, Committee on Ways and Means, 2008 Green Book; U.S. Office of Management and Budget, Discretionary Budget Authority by Agency: 1976–2016.
22 Section 8 operates a number of rental assistance programs that are classified as either tenant- or project-based. Under project-based Section 8 programs, HUD contracts private property owners to construct, rehabilitate, or set aside units to house low-income residents. Section 8 primarily consisted of project-based rental assistance programs until the 1980s, when new construction and rehabilitation contracts were eliminated. No new project-based contracts have been issued since. However, existing contracts may be renewed upon their expiration; U.S. House of Representatives, Committee on Ways and Means, 2008 Green Book; U.S. Department of Housing and Urban Development, “Section 8 Program Background Information,” http://portal.hud.gov/hudportal/HUD?src=/program_offices/housing/mfh/rfp/s8bkinfo.
23 Center on Budget and Policy Priorities, Introduction to the Housing Voucher Program, 2009; U.S. Department of Housing and Urban Development, “Housing Choice Vouchers Fact Sheet,” http://portal.hud.gov/hudportal/HUD?src=/program_ offices/public_indian_housing/programs/hcv/ about/fact_sheet; U.S. House of Representatives Committee on Ways and Means, 2008 Green Book; National Housing Task Force, A Decent Place to Live, March 1988.
24 The Housing Choice Voucher (HCV) program—the tenant-based component of Section 8—primarily comprises tenant-based vouchers, which are awarded to individual households based on income. However, local public housing authorities can dedicate up to 20% of their funds for project-based vouchers, which are subsidies designated to specific housing units rather than families. Similar to former Section 8 project-based program components, property owners must agree to construct, rehabilitate, or set aside subsidized housing units for low-income households; U.S. House of Representatives, Committee on Ways and Means, 2008 Green Book; Center on Budget and Policy Priorities, Introduction to the Housing Voucher Program, 2009.
25 Once a family is selected for a voucher, public housing authorities determine the family’s payment standard based on the local housing market. Families then secure their own housing, which must be approved by public housing authorities before vouchers are issued. When families cannot find housing that is affordable (with rent at 30% or less of their income), public housing authorities may grant vouchers that require families to pay up to 40% of their income toward housing costs; Center on Budget and Policy Priorities, Introduction to the Housing Voucher Program, 2009; U.S. Department of Housing and Urban Development, “Housing Choice Vouchers Fact Sheet.”
26 Center on Budget and Policy Priorities, Policy Basics: The Housing Choice Voucher Program, May 2014.
27 Given the increase in demand, Congress authorized two types of tenant-based vouchers to serve additional families in recent years: tenant-protection and incremental. Tenant-protection vouchers prevent low-income tenants from losing affordable housing when property owners choose not to renew their contracts under project-based Section 8 programs or public housing developments are demolished. Incremental vouchers target households containing members with specific needs, including homeless veterans, persons with disabilities, parents reunifying with their separated children, and low-income families in the Gulf Coast. Between 2005 and 2010, more than 180,000 tenant-protection vouchers and incremental vouchers were administered to serve additional households. There are also enhanced vouchers, which are a subcategory of tenant-protection vouchers and cover somewhat higher rents so that tenants can remain in buildings where rents rise after federal subsidies are eliminated; Center on Budget and Policy Priorities, Introduction to the Housing Voucher Program, 2009; Center on Budget and Policy Priorities, Section 8 Rental Assistance Programs Are Not Growing as a Share of HUD Budget: Proposed Reforms Would Make Section 8 Even More Efficient, July 2011; U.S. Office of Management and Budget, Discretionary Budget Authority by Agency: 1976–2016.
28 Center on Budget and Policy Priorities, Sequestration Could Cut Housing Vouchers for as Many as 185,000 Low-income Families by the End of 2014, November 2013.
29 U.S. Office of Management and Budget, Budget of the United States Government, Fiscal Year 2015, March 2014.
30 National Low Income Housing Coalition, A Look at Waiting Lists: What Can We Learn from the HUD Approved Annual Plans?, 2004.
31 U.S. Office of Management and Budget, Discretionary Budget Authority by Agency; U.S. Department of Housing and Urban Development, Fiscal Year 2002–09 Performance and Accountability Report; Edgar O. Olson, “Housing Programs for Low-income Households,” in Means-tested Transfer Programs in the United States, ed. Robert A. Moffitt (Chicago, IL: University of Chicago Press, 2003), 365–441; U.S. Department of Housing and Urban Development, Trends in Worst Case Needs for Housing, 1978–99: A Report to Congress on Worst Case Housing Needs Plus Update on Worst Case Needs in 2001; U.S. Department of Housing and Urban Development, Affordable Housing Needs: A Report to Congress on the Significant Need for Housing; Annual Compilation of a Worst Case Housing Needs Survey, 2003; U.S. Department of Housing and Urban Development; Affordable Housing Needs 2005: Report to Congress; U.S. Department of Housing and Urban Development, Worst Case Housing Needs 2007: A Report to Congress; U.S. Department of Housing and Urban Development, Worst Case Housing Needs 2009; U.S. Department of Housing and Urban Development, Worst Case Housing Needs 2011: Report to Congress.
32 U.S. Department of Housing and Urban Development, Worst Case Housing Needs 2011: Report to Congress.
33 According to HUD, the national Fair Market Rent (FMR) for a two-bedroom apartment in 2000 was $625. The National Low Income Housing Coalition did not report national FMR in their Out of Reach 2000 report; National Low Income Housing Coalition, Out of Reach 2014; U.S. Department of Housing and Urban Development, U.S. Average Two-bedroom Fair Market Rent, 2009; U.S. Census Bureau and U.S. Department of Commerce, Money Income in the United States: 2000, U.S. Census Bureau and U.S. Department of Commerce, Income, Poverty, and Health Insurance Coverage in the United States: 2012.
34 U.S. Census Bureau, 2012 American Community Survey 1-year Estimates.
35 U.S. Interagency Council on Homelessness, Opening Doors: Federal Strategic Plan to Prevent and End Homelessness, 2010; Joint Center for Housing Studies of Harvard University, Rental Housing— Meeting Challenges, Building on Opportunities, 2011.
36 Michelle Wood, Jennifer Turnham, and Gregory Mills, “Housing Affordability and Family Well-being: Results from the Housing Voucher Evaluation,” Housing Policy Debate 19, no. 2 (2008): 367–412; U.S. Department of Housing and Urban Development, Final Report: Study of PHA’s Efforts to Serve People Experiencing Homelessness, February 2014.
37 Seven jurisdictions have created trust funds specifically dedicated to combat homelessness; Center for Community Change, “Housing Trust Funds,” http://housingtrustfundproject.org; U.S. House of Representatives, Committee on Ways and Means, 2008 Green Book.
38 Center for Community Change, The Status of State Housing Trust Funds, March 2013.
39 Percentages do not total due to rounding. Since 2010, Pennsylvania and North Dakota have developed state housing trust funds; Center for Community Change, 2010 Survey: State Housing Trust Funds; Corporation for Enterprise Development, Assets and Opportunity Special Report: Recent Progress on the 12 Scorecard Policy Priorities, September 2010.
40 Center for Community Change, The Status of State Housing Trust Funds, March 2013.
41 In his FY15 budget proposal—for the sixth consecutive year—President Obama called for $1 billion to capitalize the NHTF. The Common Sense Housing Investment Act of 2013 sought to fund the NHTF permanently and support the HCV rental assistance program through revenue generated by converting the home mortgage interest deduction into a tax credit. In December 2014, the Federal Housing Finance Agency reversed a November 2008 suspension of setting aside and allocating monies to the NHTF; National Low Income Housing Coalition, “NHTF Included in Anti-poverty Bill,” press release, August 4, 2014; National Low Income Housing Coalition, “National Housing Trust Fund: Current Avenues for Funding,” September 2013; U.S. Office of Management and Budget, Fiscal Year 2015 Budget of the U.S. Government, March 2014; Federal Housing Finance Agency, “FHFA Statement on the Housing Trust Fund and Capital Magnet Fund,” press release, December 11, 2014.
42 Subprime loans are those issued to borrowers with incomplete, poor, or limited credit histories and have higher interest rates than prime loans.
43 U.S. Department of Housing and Urban Development, Report to Congress on the Root Causes of the Foreclosure Crisis, January 2010; Ingrid Gould Ellen, “The Foreclosure Crisis: Origins, Consequences, and Responses” (conference presentation, Grand Rounds, Columbia Center for Homelessness Prevention Studies, New York, NY, December 9, 2010).
44 Realty Trac, “Record 2.9 Million U.S. Properties Receive Foreclosure Filings in 2010 Despite 30-month Low in December,” http://www.realtytrac.com/content/press-releases/record-29-million-us-properties-receive-foreclosure-filings-in-2010-despite-30-month-low-in-december-6309; RealtyTrac, “2011 Year-end Foreclosure Report: Foreclosures on the Retreat,” http://www.realtytrac.com/content/ foreclosure-market-report/2011-year-end-foreclosure-market-report-6984; Realty Trac, “1.8 Million U.S. Properties With Foreclosure Filings in 2012,” http://www.realtytrac.com/ content/foreclosure-market-report/2012-year-end-foreclosure-market-report-7547; RealtyTrac, “1.4 Million U.S. Properties with Foreclosure Filings in 2013 Down 26 Percent to Lowest Annual Total Since 2007,” http://www.realtytrac.com/ content/foreclosure-market-report/2013-year-end-us-foreclosure-report-7963; Zillow Real Estate Research, “Housing Recovery Entering 2014, Local Market Performances Expected to Vary,” http://www.zillow.com/research/2013-q4-real-estate-market-report-6157.
45 Urban Institute, The Impacts of Foreclosures on Families and Communities, May 2009; National Coalition for the Homeless, Foreclosure to Homelessness 2009: The Forgotten Victims of the Subprime Crisis; Peter Goodman, “Foreclosures Force Ex-homeowners to Turn to Shelters,” New York Times, October 18, 2009; Manny Fernandez, “Helping to Keep Homelessness at Bay as Foreclosures Hit More Families,” New York Times, February 4, 2008; Wendy Koch, “Homeless Numbers ‘Alarming,’” USA Today, October 21, 2008; Ross Colvin, “Family Homelessness Rising in the United States,” Reuters, November 12, 2008; U.S. Conference of Mayors, Hunger and Homelessness Survey: A Status Report on Hunger and Homelessness in America’s Cities; A 25-city Survey, December 2008.
46 National Coalition for the Homeless, Foreclosure to Homelessness, 2009.
47 First Focus and the National Association for the Education of Homeless Children and Youth, A Critical Moment: Child and Youth Homelessness in Our Nation’s Schools, July 2010.
48 Peter Messeri, Brendan O’Flaherty, and Sarena Goodman, Can Homelessness Be Prevented? Evidence from New York City’s HomeBase Program, December 2011.
49 States can provide extensions for up to 20% of their caseloads. The maximum monthly benefit for a family of three with no income assumes that the assisted household includes one parent and two children, contains no children subject to a family cap (denying financial assistance after the birth of additional children), has no special needs, pays for all shelter costs with no subsidies, and is subject to the benefit standard that applies to the majority of the state’s caseload. California’s cash-benefit amount was 50.9% of the Federal Poverty Level in 2010; Urban Institute, Welfare Rules Databook: State TANF Policies as of July 2013, August 2014; Center on Budget and Policy Priorities, TANF Benefits Fell Further in 2011 and Are Worth Much Less Than in 1996 in Most States, November 2011; U.S. Department of Health and Human Services, “2014 Poverty Guidelines,” http://aspe.hhs.gov/ poverty/14poverty.cfm.
50 Center on Budget and Policy Priorities, TANF Cash Benefits Continued to Lose Value in 2013, October 2013.
51 U.S. Census Bureau, Poverty in the United States: 2000; U.S. Census Bureau, Income, Poverty, and Health Insurance Coverage in the United States: 2012; U.S. Department of Health and Human Services, “Temporary Assistance for Needy Families (TANF),” http://www.acf.hhs.gov/programs/ofa/ programs/tanf; U.S. Government Accountability Office, Temporary Assistance for Needy Families: Fewer Eligible Families Have Received Cash Assistance Since the 1990s, and the Recession’s Impact on Caseloads Varies by State, February 2010.
52 U.S. Department of Health and Human Services, “Temporary Assistance for Needy Families (TANF).”
53 Legal Momentum, Welfare Reform at Age 15: A Vanishing Safety Net for Women and Children, April 2011.
54 The caseload-reduction credit is calibrated using FY05 as the base year; Urban Institute, Welfare Rules Databook, 2014; Center for Law and Social Policy, Goals for TANF Reauthorization, January 2011; Elizabeth Lower-Basch, Hearing on TANF’s Role in Providing Assistance to Struggling Families (testimony given before the U.S. House of Representatives, Committee on Ways and Means, Subcommittee on Income Security and Family Support, March 11, 2010).
55 Center on Budget and Policy Priorities and Center for Law and Social Policy, Implementing the TANF Changes in the Deficit Reduction Act: “Win–win” Solutions for Families and States (Second Edition), February 2007; U.S. Department of Health and Human Services, “Temporary Assistance for Needy Families (TANF).”
56 Urban Institute, Welfare Rules Databook, 2014.
57 Center on Budget and Policy Priorities, Georgia’s Increased TANF Work Participation Rate Is Driven by Sharp Caseload Decline: Available Data Raise Questions About Whether Georgia Should be Labeled as a Model for the Nation, March 2007; Stephanie Mencimer, “Brave New Welfare,” Mother Jones, January/February 2009; Legal Momentum, The Sanction Epidemic in the Temporary Assistance for Needy Families Program, August 2010.
58 The maximum income for ongoing eligibility for a family of three represents combined earnings from work and TANF. In the second month of assistance, five states had no maximum income requirement. Data for Wisconsin was unavailable; U.S. Department of Health and Human Services, “Temporary Assistance for Needy Families (TANF)”; Urban Institute, Welfare Rules Databook, 2014.
59 Elizabeth Lower-Basch and Mark Greenberg, “Single Mothers in the Era of Welfare Reform,” in The Gloves-off Economy: Workplace Standards at the Bottom of America’s Labor Market, ed. Annette Bernhardt, et al. (Champaign, IL: Labor and Employment Relations Association, 2008), 163–90.
60 Bart Miles and Patrick Fowler, “Changing the Face of Homelessness: Welfare Reform’s Impact on Homeless People,” in The Promise of Welfare Reform: Political Rhetoric and the Reality of Poverty in the Twenty-first Century, ed. Keith Kilty and Elizabeth Segal (Binghamton, NY: The Hawthorn Press, 2006): 143–9.
61 Families that receive assistance from TANF-funded programs are required to assign their rights to child support to the state and cooperate with child support enforcement efforts. Federal time limits do not apply to “child-only cases” or state-funded benefits; Urban Institute, Welfare Rules Databook, 2014; U.S. Department of Health and Human Services, “Temporary Assistance for Needy Families (TANF).
62 Legal Momentum, The Sanction Epidemic, 2010.
63 U.S. Department of Health and Human Services, “Temporary Assistance for Needy Families (TANF).”
64 Suzanne Macartney and Lynda Laughlin, Child Care Costs in the Current Population Survey’s Annual Social and Economic Supplement (CPS ASEC): A Comparison to SIPP, January 2011.
65 U.S. Department of Health and Human Services, Temporary Assistance for Needy Families Program (TANF): Tenth Report to Congress, December 2013; U.S. Department of Health and Human Services, “Temporary Assistance for Needy Families (TANF).”
66 Center on Budget and Policy Priorities, TANF Benefits Fell Further, 2011.
67 Services are listed in the “Other” and “Authorized Under Prior Law” spending categories; Mathematica Policy Research, Inc., Understanding Two Categories of TANF Spending: “Other” and “Authorized Under Prior Law,” September 2009.
68 Center on Budget and Policy Priorities, TANF’s Inadequate Response to Recession Highlights Weakness of Block-grant Structure: Proponents Wrong to See It as Model for Medicaid, SNAP, or Other Low-income Programs, July 2011.
69 Center on Budget and Policy Priorities, Redesigning the TANF Contingency Fund to Make it More Effective, June 2011; Center on Budget and Policy Priorities, TANF Weakening as a Safety Net for Poor Families, March 2012; Center on Budget and Policy Priorities, Using TANF Emergency Funds to Help Prevent and Address Family Homelessness, July 2010.
70 U.S. Department of Health and Human Services, “TANF Contingency Awards by State and Federal Fiscal Year, 2006–13,” http://www.acf.hhs.gov/programs/ofa/resource/tanf-contingency-awards; U.S. Department of Health and Human Services, “Monthly TANF Contingency Fund Awards by State for Federal Fiscal Year 2014,” http://www.acf.hhs.gov/programs/ofa/resource/tanf-contingency-fund-awards-2014.
71 Changes to SNAP policies varied by state and included exclusion of vehicles in asset determination, expansion of categorical eligibility and simplified reporting, reduction of income and job change reporting requirements, and allocation of funds for outreach; Mathematica Policy Research, Supplemental Nutrition Assistance Program Caseload Trends and Changes in Measures of Unemployment, Labor Underutilization, and Program Policy from 2000 to 2008, 2010; U.S. Department of Agriculture, “Supplemental Nutrition Assistance Program Participation and Costs,” http://www.fns.usda.gov/pd/ supplemental-nutrition-assistance-program-snap; Jacob Klerman and Caroline Danielson, “The Transformation of the Supplemental Nutrition Assistance Program,” Journal of Policy Analysis and Management 30, no. 4 (2011): 863–88.
72 Urban Institute, How Much Does SNAP Reduce Food Insecurity?, 2010; James Mabli and Julie Worthington, “Supplemental Nutrition Assistance Program Participation and Child Food Security,” Pediatrics 133, no. 4 (2014): 2,013–23.
73 Barrett A. Lee and Meredith J. Greif, “Homelessness and Hunger,” Journal of Health and Social Behavior 49, no. 1 (2008): 3–19.
74 Craig Gundersen, et al., “Homelessness and Food Insecurity,” Journal of Housing Economics 12, no. 3 (2003): 250–72.
75 Ralph da Costa Nunez and Matthew Adams, “Primary Stakeholders’ Perspectives on Services for Families without Homes,” in Supporting Homeless Families: Current Practices and Future Directions, ed. Mary E. Haskett, Staci Perlman, and Beryl Ann Cowan (New York: Springer, 2014): 209–32.
76 Charles L. Baum II, “A Dynamic Analysis of the Effect of Child Care Costs on the Work Decisions of Low-income Mothers with Infants,” Demography 39, no. 1 (2002): 139–64; David Blau and Erdal Tekin, “The Determinants and Consequences of Child Care Subsidies for Single Mothers in the USA,” Journal of Population Economics 20, no. 4 (2007): 719–41; Haksoon Ahn, “Child Care Subsidy, Child Care Costs, and Employment of Low-income Single Mothers,” Children and Youth Services Review 34, no. 2 (2012): 379–87; Jay Bainbridge, Marcia K. Meyers, and Jane Waldfogel, “Child Care Policy Reform and the Employment of Single Mothers,” Social Science Quarterly 84, no. 4 (2003): 771–91.
77 Institute for Children, Poverty, and Homelessness, Profiles of Risk: Child Care, 2012.
78 Anna D. Johnson, Anne Martin, and Jeanne Brooks-Gunn, “Who Uses Child Care Subsidies? Comparing Recipients to Eligible Non-recipients on Family Background Characteristics and Child Care Preferences,” Children and Youth Services Review 33, no. 7 (2011): 1,072–83; Fred Brooks, “Impacts of Child Care Subsidies on Family and Child Well-being,” Early Childhood Research Quarterly 17, no. 4 (2002): 498–511.
79 Child Care Aware of America, Parents and the High Cost of Child Care: 2013 Report.
80 Calculation of average monthly copayment as a percent of family income excludes families with $0 income, families categorized as needing “protective services” or headed by children, and families with invalid income or copayment; Administration for Children and Families, U.S. Department of Health and Human Services, FY 2012 CCDF Data Tables (Preliminary Estimates, October 2013); U.S. Department of Health and Human Services, “2014 Poverty Guidelines,” http://aspe.hhs.gov/ poverty/14poverty.cfm.
81 Urban Institute, How Contextual Constraints Affect Low-income Working Parents’ Child Care Choices, February 2012; U.S. Department of Health and Human Services, National Study of Child Care for Low-income Families: Patterns of Child Care Use Among Low-income Families, Final Report, 2007.
82 Institute for Children, Poverty, and Homelessness, Meeting the Child Care Needs of Homeless Families: How Do States Stack Up?, July 2014.
83 Urban Institute, How Contextual Constraints Affect Low-income Working Parents’ Child Care Choices, February 2012.
84 Anne B. Shlay, Marsha Weinraub, Michelle Harmon, and Henry Tran, “Barriers to Subsidies: Why Low-income Families Do Not Use Child Care Subsidies,” Social Science Research 33, no. 1 (2004): 134–57.
85 Office of the Assistant Secretary for Planning and Evaluation, U.S. Department of Health and Human Services, Estimates of Child Care Eligibility and Receipt for Fiscal Year 2006.
86 Institute for Children, Poverty, and Homelessness, Meeting the Child Care Needs of Homeless Families: How Do States Stack Up?, July 2014; Child Care and Development Block Grant Act of 2014, S 1086, 113th Cong., 2nd sess.
87 U.S. Census Bureau, Income, Poverty, and Health Insurance Coverage in the United States: 2012; U.S. Census Bureau, Current Population Survey, 2012 Annual Social and Economic Supplement.
88 Health Care for the Homeless Council, Homelessness and Health: What’s the Connection?, January 2010; David Himmelstein, et al., “Medical Bankruptcy in the United States, 2007: Results of a National Study,” The American Journal of Medicine 122, no. 8 (2009): 741–6.
89 David Wood and Burciaga Valdez, “Barriers to Medical Care for Homeless Families Compared with Housed Poor Families,” American Journal of Diseases of Children 145, no. 10 (1991): 1,109–15.
90 The Henry J. Kaiser Family Foundation, The Cost of Care for the Uninsured: What Do We Spend, Who Pays, and What Would Full Coverage Add to Medical Spending?, May 2004.
91 The Henry J. Kaiser Family Foundation, Where Are States Today? Medicaid and CHIP Eligibility Levels for Adults, Children, and Pregnant Women as of January 2015.
92 Congressional Budget Office, Estimates for the Insurance Coverage Provisions of the Affordable Care Act Updated for the Recent Supreme Court Decision, July 2012; National Health Care for the Homeless Council, FY 2015 Health Center Funding Request, 2014.
93 National Association of Community Health Centers, Access is the Answer: Community Health Centers, Primary Care and the Future of American Health Care, March 2014; U.S. Census Bureau, American Community Survey 2012 1-year Estimates.
94 Kaiser Health News, “Six States Extending Medicaid Pay Raise Next Year to Primary Care Doctors,” http://kaiserhealthnews.org/news/6- states-extending-medicaid-pay-raise-next-year-to-primary-care-doctors; The Kaiser Family Foundation, How Much Will Medicaid Physician Fees for Primary Care Rise in 2013? Evidence from a 2012 Survey of Medicaid Physician Fees, December 2012.
Issue 3
Effects of Homelessness on Families and Children
1 U.S. Bureau of Justice Statistics, Intimate Partner Violence, 1993–2010, November 2012.
2 National Network to End Domestic Violence, Domestic Violence Counts 2013: A 24-hour Census of Domestic Violence Shelters and Services.
3 U.S. Department of Justice, Problem-oriented Guides for Police, Problem-specific Guides Series No. 45: Domestic Violence, January 2007.
4 Ellen Bassuk, et al., “The Characteristics and Needs of Sheltered Homeless and Low-income Housed Mothers,” The Journal of the American Medical Association 276, no. 8 (1996): 640–6.
5 National Network to End Domestic Violence, Domestic Violence and Sexual Assault Fact Sheet, 2014; Charles L. Whitfield, et al., “Violent Childhood Experiences and the Risk of Intimate Partner Violence in Adults: Assessment in a Large Health Maintenance Organization,” Journal of Interpersonal Violence 18, no. 2 (2003): 166–85; Sujata Desai, et al., “Childhood Victimization and Subsequent Adult Revictimization Assessed in a Nationally Representative Sample of Women and Men,” Violence and Victims 17, no. 6 (2002): 639–53.
6 National Coalition Against Domestic Violence, Domestic Violence and Substance Abuse.
7 National Center for Injury Prevention and Control, Costs of Intimate Partner Violence Against Women in the United States, March 2003.
8 U.S. Bureau of Justice Statistics, “Intimate Partner Violence,” http://www.bjs.gov/index. cfm?ty=pbdetail&iid=1002.
9 Wilder Research, 2012 Homeless Adults and Children—MN Statewide Survey Data: Physical and Sexual Abuse; Wilder Research, Homelessness in Minnesota: Findings from the 2012 Statewide Homeless Study, September 2013.
10 Barrett A. Lee and Meredith J. Greif, “Homelessness and Hunger,” Journal of Health and Social Behavior 49, no. 1 (2008): 3–19; Craig Gundersen, et al., “Homelessness and Food Insecurity,” Journal of Housing Economics 12 (2003): 250–72; U.S. Department of Agriculture, “Food Security in the United States: Measuring Household Food Security,” http://www.ers.usda. gov/topics/food-nutrition-assistance/food-security-in-the-us/measurement.aspx.
11 U.S. Department of Agriculture, Household Food Security in the United States in 2013, September 2014.
12 U.S. Department of Housing and Urban Development, The 2012 Annual Homeless Assessment Report to Congress, Part 2, 2013; Feeding America, Hunger in America 2014: Executive Summary; Feeding America, Hunger in America 2014: National Report.
13 John Cook, et al., “Food Insecurity Is Associated with Adverse Health Outcomes among Human Infants and Toddlers,” Journal of Nutrition 134, no. 6 (2004): 1,432–8; Ruth Rose-Jacobs, et al., “Household Food Insecurity: Associations with At-risk Infant and Toddler Development,” Pediatrics 121, no. 1 (2008): 65 –72.
14 Linda Weinreb, et al., “Hunger: Its Impact on Children’s Health and Mental Health,” Pediatrics 110, no. 4 (2002): e41–9.
15 Robert Whitaker, Shannon Phillips, and Sean Orzol, “Food Insecurity and the Risks of Depression and Anxiety in Mothers and Behavior Problems in the Preschool-aged children,” Pediatrics 118, no. 3 (2006): e859–68.
16 Diana Jyoti, Edward Frongillo, and Sonya Jones, “Food Insecurity Affects School Children’s Academic Performance, Weight Gain, and Social Skills,” Journal of Nutrition 135, no. 12 (2005): 2,831–9.
17 U.S. Department of Health and Human Services Office on Women’s Health, “Pregnancy: Staying Healthy and Safe,” http://www.womenshealth. gov; Ohio State University Extension, Nutritional Needs of Pregnancy and Breastfeeding, 2009; Ann E. Bryant Borders, et al., “Chronic Stress and Low Birth Weight Neonates in a Low-income Population of Women,” Obstetrics & Gynecology 109, no. 2 (2007): 331–8; Lise M. Stevens, “Low Birth Weight,” Journal of the American Medical Association 287, no. 2 (2002): 270; Suzan L. Carmichael, et al., “Maternal Food Insecurity Is Associated with Increased Risk of Certain Birth Defects,” The Journal of Nutrition 137, no. 9 (2007): 2,087–92.
18 Greg R. Alexander, et al., “US Birth Weight/ Gestational Age-specific Neonatal Mortality: 1995–97 Rates for Whites, Hispanics, and Blacks,” Pediatrics 111, no. 1 (2003): e61– 6; Michael S. Kramer, et al., “Socio-economic Disparities in Pregnancy Outcome: Why Do the Poor Fair So Poorly?” Paediatric and Perinatal Epidemiology 14, no. 3 (2000): 194–210; Anthony M. Vintzileos, et al., “Prenatal Care and Black-white Fetal Death Disparity in the United States: Heterogeneity by High-risk Conditions,” Obstetrics & Gynecology 99, no. 3 (2002): 483–9; U.S. Department of Health and Human Services Centers for Disease Control and Prevention, PRAMS 2002 Surveillance Report, 2006.
19 Nicole B. Neault, et al., “Breastfeeding and Health Outcomes among Citizen Infants of Immigrant Mothers,” Journal of the American Dietetic Association 107, no. 12 (2007): 2,077–86.
20 Health Care for the Homeless Council, Homelessness and Health: What’s the Connection?, 2010.
21 Institute for Children, Poverty, and Homelessness, Profiles of Risk: Maternal Health and Well-being, February 2012.
22 Ellen Bassuk, et al., “The Characteristics and Needs of Sheltered Homeless and Low-income Housed Mothers,” Journal of the American Medical Association 276, no. 8 (1996): 640–6.
23 Family Housing Fund, Homelessness and its Effects on Children, 1999.
24 Judith Stein, et al., “Applying the Gelberg-Andersen Behavioral Model for Vulnerable Populations to Health Services Utilization in Homeless Women,” Journal of Health Psychology 12, no. 5 (2007): 791–804.
25 James Wright and Eleanor Weber, Homelessness and Health (Washington, D.C.: McGraw-Hill, 1987).
26 Family Housing Fund, Homelessness and its Effects on Children, 1999.
27 David Wood, et al., “Health of Homeless Children and Housed, Poor Children,” American Academy of Pediatrics 86, no. 6 (1990): 858–66.
28 Institute for Children, Poverty, and Homelessness analysis of Head Start Family and Child Experiences Survey (FACES) 2006 data.
29 Roy Grant, et al., “Asthma Among Homeless Children in New York City: An Update,” American Journal of Public Health 97, no. 3 (2007): 448–50; Luz Claudio, Jeanette A. Stingone, and James Godbold, “Prevalence of Childhood Asthma in Urban Communities: The Impact of Ethnicity and Income,” Annals of Epidemiology 16, no. 5 (2006): 332–40.
30 Marguerite Ann DiMarco, Susan M. Ludington, and Edna M. Menke, “Access to and Utilization of Oral Health Care by Homeless Children/ Families,” Journal of Health Care for the Poor and Underserved 21 (2010): 67–81.
31 Roy Grant, et al., “The Health of Homeless Children Revisited,” Advances in Pediatrics 54 (2007): 173–87; Urban Institute, Homelessness: Programs and the People They Serve, Findings of the National Survey of Homeless Assistance Providers and Clients—Technical Report, September 1999.
32 Robert Kahn, et al., “State Income Inequality, Housing Income, and Maternal Mental and Physical Health: Cross Sectional National Survey,” British Medicine Journal 321, no. 7,272 (2000): 1,311–5.
33 John C. Buckner, et al., “Mental Health Issues Affecting Homeless Women: Implications for Intervention,” American Journal of Orthopsychiatry 63, no. 3 (1993): 385–99.
34 National Health Care for the Homeless Council, HIV/AIDS & Homelessness: Recommendations for Clinical Practice and Public Policy, February 2000.
35 Ellen Bassuk, et al., “Prevalence of Mental Health and Substance Use Disorders Among Homeless and Low-income Housed Mothers,” American Journal of Psychiatry 155, no. 11 (1998): 1,561–4.
36 Linda Weinreb, et al., “Health Characteristics and Medical Service Use Patterns of Sheltered Homeless and Low-income Housed Mothers,” Journal of General Internal Medicine 13, no. 6 (1998): 389–97.
37 Susan Wenzel, et al., “Antecedents of Physical and Sexual Victimization Among Homeless Women: A Comparison to Homeless Men,” American Journal of Community Psychology 28, no. 3 (2000): 367–90.
38 Joy Lewis, et al., “Health Care for Homeless Women: Unmet Needs and Barriers to Care,” Journal of General Internal Medicine 18, no. 11 (2003): 921–8.
39 U.S. Department of Housing and Urban Development, The 2010 Annual Homeless Assessment Report to Congress.
40 U.S. Department of Health and Human Services, Blending Perspectives and Building Common Ground: A Report to Congress on Substance Abuse and Child Protection, April 1999.
41 Linda Weinreb, “Substance Abuse: A Growing Problem Among Homeless Families,” Family Community Health 13, no. 1 (1990): 55–64.
42 National Health Care for the Homeless Council, HIV/AIDS & Homelessness: Recommendations for Clinical Practice and Public Policy, February 2000.
43 Angela Aidala, et al., “Housing Need, Housing Assistance, and Connection to HIV Medical Care,” AIDS Behavior 11 (2007): 101–15.
44 James Shultz, et al., “HIV Seroprevalence and Risk Behaviors Among Clients Attending a Clinic for the Homeless in Miami/Dade County, Florida, 1990–1996,” Population Research and Policy Review 18 (1999): 357–72; Irene Hall, et al., “Estimation of HIV Incidence in the United States,” Journal of the American Medical Association 300, no. 5 (2008): 520–9.
45 National Health Care for the Homeless Council, HIV/AIDS among Persons Experiencing Homelessness: Risk Factors, Predictors of Testing, and Promising Testing Strategies, December 2012.
46 U.S. Department of Housing and Urban Development, 2012 AHAR HMIS Estimates of Homeless Veterans, September 2013; U.S. Department of Housing and Urban Development, 2012 AHAR HMIS Estimates of People in Permanent Supportive Housing, September 2013.
47 Gail Gamache, et al., “Overrepresentation of Women Veterans Among Homeless Women,” American Journal of Public Health 93, no. 7 (2003): 1,132–6; National Center on Homelessness Among Veterans, Prevalence and Risk of Homelessness among U.S. Veterans: A Multisite Investigation, August 2011.
48 U.S. Department of Housing and Urban Development and U.S. Department of Veterans Affairs, Veteran Homelessness: A Supplemental Report to the 2010 Annual Homeless Assessment Report to Congress.
49 John C. Buckner, et al., “Mental Health Issues Affecting Homeless Women: Implications for Intervention,” American Journal of Orthopsychiatry 63, no. 3 (1993): 385–99; U.S. Department of Labor, Women’s Bureau, Trauma-informed Care for Women Veterans Experiencing Homelessness: A Guide for Service Providers, 2011.
50 Donna Washington, et al., “Risk Factors for Homelessness Among Women Veterans,” Journal of Health Care for the Poor and Underserved 21 (2010): 81–91.
51 U.S. Department of Labor, Women’s Bureau, Trauma-informed Care for Women Veterans Experiencing Homelessness: A Guide for Service Providers, 2011; Congressional Research Service, Veterans and Homelessness, July 2011.
Issue 4
Educating Homeless Children
1 Ralph da Costa Nunez and Matthew Adams, “Primary Stakeholders’ Perspectives on Services for Families without Homes,” in Supporting Families Experiencing Homelessness, ed. Mary E. Haskett, Staci Perlman, and Beryl Ann Cowan (New York, NY: Springer, 2014).
2 McKinney-Vento Homeless Education Assistance Improvements Act of 2001, Public Law 107–110, U.S. Code 42 (2002), §11431 et seq.; National Center for Homeless Education, Education for Homeless Children and Youth Program Data Collection Summary, 2014.
3 Ibid.
4 Federal definitions of disability under the Individuals with Disabilities Education Improvement Act (IDEA) guide how states should define who is entitled to special education programs and related services. Children and youth ages three through 21 may be eligible under IDEA Part B if they have disabilities that can be categorized under one of 13 disability categories: autism, deaf-blindness, deafness, emotional disturbance, hearing impairment, intellectual disability, multiple disabilities, orthopedic impairment, other health impairment, specific learning disability, speech or language impairment, traumatic brain injury, or visual impairment (including blindness). Additionally, states and local educational agencies can choose to include developmental delay in their definition of disability for children ages three through nine. These children must exhibit developmental delays in one of five areas of development: physical, cognitive, communicative, social or emotional, or adaptive; National Dissemination Center for Children with Disabilities, Categories of Disability Under IDEA, March 2012; National Center for Homeless Education, Best Practices in Homeless Education, Supporting Homeless Students with Disabilities: Implementing IDEA, 2007; National Center for Homeless Education, Individuals with Disabilities Education Improvement Act (IDEA) of 2004: Provisions for Homeless Children and Youth with Disabilities, 2007.
5 The Individuals with Disabilities Education Improvement Act (IDEA) addresses the special education needs of children with disabilities from birth through age 21, Part C of IDEA requires that any state receiving grant monies make early intervention services available to infants and toddlers (children under three years of age) with disabilities and their families and Part B covers all school-aged children and youth (ages three through 21). IDEA also includes the Child Find mandate, which requires all school districts to identify, locate, and evaluate all children with disabilities, including those experiencing homelessness; National Center for Homeless Education, Best Practices in Homeless Education, 2007.
6 According to McKinney-Vento, the definition of homeless children and youth includes individuals who lack a fixed, regular, and adequate nighttime residence, including children and youth living in doubled-up situations, motels or hotels, emergency or transitional shelters, or places not meant for human habitation and migratory children. The 2004 reauthorization of IDEA also established specific mandates regarding identification, student evaluations, Individual Education Programs, unaccompanied youth, and services; National Center for Homeless Education, Individuals with Disabilities Education Improvement Act (IDEA) of 2004, 2007.
7 James Heckman, “Skill Formation and the Economics of Investing in Disadvantaged Children,” Science 312, no. 5,782 (2006): 1,900–2; Kyunghee Lee, “Do Early Academic Achievement and Behavior Problems Predict Long-term Effects among Head Start Children?” Children and Youth Services Review 32, no. 12 (2010): 1,690–703; Tom Luster and Harriette McAdoo, “Family and Child Influences on Educational Attainment: A Secondary Analysis of the High/Scope Perry Preschool Data,” Developmental Psychology 32, no. 1 (1996): 26–39.
8 James Heckman, “Skill Formation and the Economics of Investing in Disadvantaged Children,” Science 312, no. 5,782 (2006): 1,900–02; Ann S. Masten, “Risk and Resilience in the Educational Success of Homeless and Highly Mobile Children,” Educational Researcher 41, no. 9 (2012): 363–65.
9 Robert H. Bradley and Robert F. Corwyn, “Socioeconomic Status and Child Development,” Annual Review of Psychology 53, no. 1 (2002): 371– 99; David H. Arnold and Greta L. Doctoroff, “The Early Education of Socioeconomically Disadvantaged Children,” Annual Review of Psychology 54, no. 1 (2003): 517–45; Vonnie C. McLoyd, “Socio economic Disadvantage and Child Development,” American Psychologist 53, no. 2 (1998): 185–204.
10 John C. Buckner, “Impact of Homelessness on Children: An Analytic Review of the Literature,” in Characteristics and Dynamics of Homeless Families with Children: Final Report, eds. Debra J. Rog, C. Scott Holupka, and Lisa C. Patton (Washington, D.C.: U.S. Department of Health and Human Services, Office of Human Services Policy, Office of the Assistant Secretary for Planning and Evaluation, 2007); John C. Buckner, “Understanding the Impact of Homelessness on Children: Challenges and Future Research Directions,” American Behavioral Scientist 51 (2008): 721–36; Ann S. Masten, et al., “Children in Homeless Families: Risks to Mental Health and Development,” Journal of Consulting and Clinical Psychology 61, no. 2 (1993): 335–43; Peter M. Miller, “A Critical Analysis of the Research on Student Homelessness,” Review of Educational Research 81, no. 3 (2011): 308–37; Jelena Obradovic´ , et al., “Academic Achievement of Homeless and Highly Mobile Children in an Urban School District: Longitudinal Evidence on Risk, Growth, and Resilience,” Development and Psychopathology 21, no. 2 (2009): 493–518; Edward Scanlon and Kevin Devine, “Residential Mobility and Youth Well-being: Research, Policy, and Practice Issues,” Journal of Sociology and Social Welfare 28, no. 1 (2001): 119 –38
11 Carole Norris-Shortle, et al., “Targeted Interventions for Homeless Children at a Therapeutic Nursery,” Zero to Three 26, no. 4 (2006): 46 –55.
12 W. Steven Barnett, “Effectiveness of Early Educational Intervention,” Science 333, no. 6,045 (2011): 371–99.
13 Institute for Children, Poverty, and Homelessness, Profiles of Risk: Child Care, 2012.
14 U.S. Department of Health and Human Services, 2012–13 Program Information Report, PIR Summary Report—National Level.
15 A family was considered “homeless or highly mobile” (HHM) if during the fall 2006, spring 2007, or spring 2008 interviews they reported their type of housing to be “transitional housing/ homeless shelter” or “house, apartment, or trailer shared with another family,” or they reported moving twice or more in the past year. All other children were labeled “always stably housed” (this group could include families living in subsidized housing). Existing research notes the negative impact that housing instability in the form of high mobility can have on children’s development, which is why it has been included here; see, for example, John C. Buckner, Ellen L. Bassuk, and Linda F. Weinreb, “Predictors of Academic Achievement among Homeless and Low-income Housed Children,” Journal of School Psychology 39, no. 1 (2001): 45–69 and Adam Voight, Marybeth Shinn, and Maury Nation, “The Longitudinal Effects of Residential Mobility on the Academic Achievement of Urban Elementary and Middle School Students,” Educational Researcher 41, no. 9 (2012): 385–92. Housing status composite variables, such as HHM, have been employed in previous studies on the achievement of homeless students. One limitation of the study design is that the duration of the episode of homelessness or high mobility is unknown; All children in the sample begin Head Start scoring, on average, below national norms across developmental areas; Institute for Children, Poverty, and Homelessness, Head Start and Housing (In)stability: Examining the School Readiness of Children Experiencing Homelessness, 2013; Louisa Tarullo, et al., A Second Year in Head Start: Characteristics and Outcomes of Children Who Entered the Program at Age Three, December 2010.
16 National Center for Homeless Education, Summary of the State of Research on the Relationship Between Homelessness and Academic Achievement Among School-aged Children and Youth, 2012.
17 J. J. Cutuli, et al., “Academic Achievement Trajectories of Homeless and Highly Mobile Students: Resilience in the Context of Chronic and Acute Risk,” Child Development 84, no. 3 (2013): 841–57.
18 Janette E. Herbers, et al., “Direct and Indirect Effects of Parenting on the Academic Functioning of Young Homeless Children,” Early Education and Development 22, no. 1 (2011): 77–104; Anne Shaffer, et al., “Intergenerational Continuity in Parenting Quality: The Mediating Role of Social Competence,” Developmental Psychology 45, no. 5 (2009): 1,227–40.
19 Ann S. Masten, “Ordinary Magic: Lessons from Research on Resilience in Human Development,” Education Canada 49, no. 3 (2009): 28–32; Margaret O’Dougherty Wright, Ann S. Masten, and Angela J. Narayan, “Resilience Processes in Development: Four Waves of Research on Positive Adaptation in the Context of Adversity,” in Handbook of Resilience in Children, eds. Sam Goldstein and Robert B. Brooks (New York, NY: Springer Science+Business Media, 2013): 15–37.
20 National Center for Homeless Education, Research Summary: Resilience and At-risk Children and Youth, 2013.
21 J. J. Cutuli, et al., “Cortisol Function Among Early School-aged Homeless Children,” Psychoneuroendocrinology 35, no. 6 (2010): 833–45.
22 Ann S. Masten, “Ordinary Magic: Lessons from Research on Resilience in Human Development,” Education Canada 49, no. 3 (2009): 28–32.
23 My Child Without Limits Advisory Committee, Introduction to Developmental Delay, November 2009; Family Housing Fund, Homelessness and its Effects on Children, December 1999; National Dissemination Center for Children with Disabilities, Categories of Disability Under IDEA, March 2012; Sarah Marchmont, “If You’re Homeless, You’re More Likely to Have a Learning Disability,” Medill Reports, February 24, 2010.
24 The National Assessment of Educational Progress (NAEP) is a nationally representative assessment of students in various subject areas. NAEP data are not available for homeless students. Students are defined as low-income if they are eligible for the U.S. Department of Agriculture’s National School Lunch Program (NSLP), which provides free meals to children from households with incomes at or below 130% of the federal poverty level and reduced-price meals to those from families with incomes between 130% and 185% of the poverty level. Given the income eligibility requirements for NSLP, this subset of students presumably includes homeless children and youth. Students with disabilities are offered accommodations, including extra time, small-group or one-on-one testing sessions, dictated test questions, and scribes for dictated responses; U.S. Department of Education, Mapping State Proficiency Standards Onto the NAEP Scales: Variation and Change in State Standards for Reading and Mathematics, 2005–09; U.S. Department of Education, “ED Data Express,” http://www.eddataexpress.ed.gov; U.S. Department of Agriculture, Eligibility Manual for School Meals: Determining and Verifying Eligibility, 2011; National Center for Educational Statistics, “National Assessment of Educational Progress: Inclusion of Special Needs Students,” http://nces.ed.gov/ nationsreportcard/about/inclusion.asp.
25 National Dissemination Center for Children with Disabilities, Categories of Disability Under IDEA, March 2012; U.S. Department of Education, “ED Data Express,” http://www.eddataexpress.ed.gov.
26 Bonnie T. Zima, et al., “Sheltered Homeless Children: Their Eligibility and Unmet Need for Special Education Evaluations,” American Journal of Public Health 87, no. 2 (1997): 236–40; Family Housing Fund, Homelessness and its Effects on Children, 1999; National Center for Homeless Education, Education for Homeless Children and Youths Program Data Collection Summary, 2013; U.S. Department of Education, Digest of Education Statistics 2013.
27 The vast majority (75.5%) of homeless children and youth live doubled up with family, friends, or other non-relatives, making them difficult to identify and count. Also, the stigma associated with being homeless leads many students to deny their housing instability; U.S. Department of Education, “ED Data Express,” http://www. eddataexpress.ed.gov; Project Hope—Virginia, Unlocking Potential!: What Families and Shelters Need to Know About Homelessness and Special Education, 2003.
28 National Center for Homeless Education, Individuals with Disabilities Education Improvement Act (IDEA) of 2004, 2007; Project Forum at National Association of State Directors of Special Education, Highly Mobile Children and Youth with Disabilities: Policies and Practices in Five States, March 2007; Project Hope—Virginia, Using the Best That We Know: Supporting Young Children Experiencing Homelessness, 2003; Project Forum at National Association of State Directors of Special Education, Homeless and Special Education Administrative Collaboration: Recommendations, October 2008.
29 Christine Walther-Thomas, Lori Korinek, Virginia L. McLaughlin, and Brenda T. Williams, “Improving Educational Opportunities for Students With Disabilities Who Are Homeless,” Journal of Children and Poverty 2, no. 2 (1996): 57–75; Family Housing Fund, Homelessness and its Effects on Children, 1999; National Center for Children and Poverty, Homeless Children and Youth: Causes and Consequences, 2009; National Association of State Directors of Special Education, Homeless and Special Education, 2008; Peter M. Miller and James B. Schreiber, Educating Homeless Children in Allegheny County: An Evaluation of Families, Agencies, and Services, 2009; Carol Smith, “School Districts Struggle to Help Homeless Kids as Number Grows Statewide,” InvestigateWest, October 23, 2010.
30 Urban Institute, Residential Instability and the McKinney-Vento Homeless Children and Education Program, May 2010; National Center for Homeless Education, Best Practices in Homeless Education, Supporting Homeless Students with Disabilities: Implementing IDEA, 2007; Project Hope—Virginia, Using the Best That We Know, 2003; Project Forum at National Association of State Directors of Special Education, Homeless and Special Education, 2008; Laurene M. Heyback and Patricia Nix-Hodes, “Reducing Mobility: Good for Kids, Good for Schools,” The Beam: The Newsletter for the National Association for the Education of Homeless Children and Youth 9, no. 1 (1999): 5.
31 U.S. Department of Education, Special Education—Grants to States, 2013; Alyson Klein, “Chairman Kline Seeks Big Increase in Federal Aid for Special Education,” Education Week, April 29, 2014; U.S. Department of Education, Special Education—Fiscal Year 2014 Budget Request.
32 Family Housing Fund, Homelessness and its Effects on Children, December 1999; Sarah Marchmont, “If You’re Homeless, You’re More Likely to Have a Learning Disability,” Medill Reports, February 24, 2010; Ruby Takanishi, “Leveling the Playing Field: Supporting Immigrant Children from Birth to Eight,” The Future of Children 14, no. 2 (2004): 61–79.
33 J.J. Cutuli, et al., “Academic Achievement Trajectories of Homeless and Highly Mobile Students: Resilience in the Context of Chronic and Acute Risk,” Child Development 84, no. 3 (2013): 841–57; Jelena Obradovic´, “Academic Achievement of Homeless and Highly Mobile Children in an Urban School District: Longitudinal Evidence on Risk, Growth, and Resilience,” Development and Psychopathology 21, no. 2 (2009): 493–518; Peter M. Miller, “A Critical Analysis of the Research on Student Homelessness,” Review of Educational Research 81, no. 3 (2011): 308–37; David H. Rubin, et al., “Cognitive and Academic Functioning of Homeless Children Compared with Housed Children,” Pediatrics 97, no. 3 (1996): 289–94; Janette E. Herbers, et al., “Early Reading Skills and Academic Achievement Trajectories of Students Facing Poverty, Homelessness, and High Residential Mobility,” Educational Researcher 41, no. 9 (2012): 366–74.
34 See endnote 26. ELLs are offered accommodations, including extra time, small-group or one-on-one testing sessions, and test directions read aloud in Spanish; U.S. Department of Education, “ED Data Express,” http://www.eddataexpress.ed.gov; U.S. Department of Agriculture, Eligibility Manual for School Meals: Determining and Verifying Eligibility, 2011; National Center for Education Statistics, “NAEP Accommodations Increase Inclusiveness,” http://nces.ed.gov/nationsreportcard/about/accom_ table.aspx.
35 States determine which students are designated as limited English proficient (LEP); U.S. Department of Education, Consolidated State Performance Reports, School Year 2012–13; U.S. Department of Education, State Nonfiscal Public Elementary/Secondary Education Survey 2012–13 v.1a.
36 U.S. Department of Education, “ED Data Express,” http://www.eddataexpress.ed.gov.
37 U.S. Department of Education, “English Language Acquisition State Grants,” http://www2.ed.gov/ programs/sfgp/index.html.
Issue 5
Federal Homelessness Policy
1 Should federal appropriations requests be met, the Obama administration intends to end veteran homelessness by the end of 2015 and chronic homelessness in 2017; U.S. Interagency Council on Homelessness, Opening Doors: Federal Strategic Plan to Prevent and End Homelessness, 2010; U.S. Office of Management and Budget, Budget of the United States Government, Fiscal Year 2016, February 2015.
2 Temporary Emergency Food Assistance Act, Public Law 98–8, U.S. Code 7 (1983); National Bureau of Economic Research, Recovery Began in November, 1983.
3 Maria Foscarinis, “The Federal Response: The Stewart B. McKinney Homeless Assistance Act,” in Homelessness in America, ed. Jim Baumohl (Phoenix: Oryx Press, 1996); Congressional Research Service, Homelessness: Recent Statistics, Targeted Federal Programs, and Recent Legislation, May 2005.
4 U.S. Department of Housing and Urban Development, Priority Home! The Federal Plan to Break the Cycle of Homelessness, 1994; U.S. Department of Housing and Urban Development, Life After Transitional Housing for Homeless Families, 2010; U.S. Department of Housing and Urban Development, Supportive Housing Program Desk Guide, 2008.
5 U.S. Department of Housing and Urban Development, Life After Transitional Housing, 2010.
U.S. Department of Housing and Urban Development, Strategies for Improving Homeless People’s Access to Mainstream Benefits and Services, 2010.
7 Ibid.
8 U.S. Department of Housing and Urban Development, The 2010 Annual Homeless Assessment Report to Congress; U.S. Interagency Council on Homelessness, Opening Doors: Federal Strategic Plan to Prevent and End Homelessness, 2010; U.S. Department of Housing and Urban Development, Supportive Housing Program Desk Guide: Section C; Program Components, 2008.
9 Dennis Culhane, Stephen Metraux, and Trevor Hadley, “Public Service Reductions Associated with Placement of Homeless Persons with Severe Mental Illness in Supportive Housing,” Housing Policy Debate 13, no. 1 (2002): 107– 63; State of Maine, Cost of Homelessness: Cost Analysis of Permanent Supportive Housing; State of Maine—Greater Portland, September 2007; State of Maine, Cost of Rural Homelessness: Rural Permanent Supportive Housing Cost Analysis, May 2009.
10 U.S. Department of Housing and Urban Development, Costs Associated with First-time Homelessness for Families and Individuals, 2010.
11 Mel Martinez, “National Alliance to End Homelessness” (speech, National Conference on Ending Homelessness, Washington, D.C., July 19, 2002); U.S. Department of Health and Human Services, Ending Chronic Homelessness: Strategies for Action, March 2003.
12 Corporation for Supportive Housing, The New York/New York Agreement Cost Study: The Impact of Supportive Housing on Services Use for Homeless Mentally Mentally Ill Individuals, May 2001; National Alliance to End Homelessness, A Plan, Not a Dream: How to End Homelessness in Ten Years, 2000.
13 U.S. Department of Housing and Urban Development, “Bush Administration Announces $75 Million to Provide Permanent Housing, Medical Care, Job Training and Other Services to Chronically Homeless—HHS, HUD, VA and Labor Collaborate to Help Most Vulnerable,” http://archives.hud.gov/news/2003/pr03-101.cfm; U.S. Department of Housing and Urban Development, “HUD Awards $6.5 Million to Help Provide Permanent Housing to Help End Chronic Homelessness—Community Organizations in 10 States to Move Homeless Persons Away from a Life on the Streets,” http:// archives.hud.gov/news/2004/pr04-030.cfm; U.S. Department of Housing and Urban Development, “HUD Awards $10 Million to Help Provide Permanent Housing for Persons Experiencing Chronic Homelessness—Funding Targeted to Persons Living on the Streets and Addicted to Alcohol,” http://archives.hud.gov/news/2005/ pr05-105.cfm; U.S. Department of Housing and Urban Development, “HUD Reports Drop in Number of Chronically Homeless Persons Living on Nation’s Streets—Decrease Largely Attributed to Increase in Supportive Housing,” http:// archives.hud.gov/news/2007/pr07-167.cfm; U.S. Department of Housing and Urban Development, “Jackson to Urge Nation’s Mayors to Adopt Bush Administration Strategy to End Chronic Homelessness in Ten Years—Resolution Follows National Plan to Target Most Vulnerable,” http:// archives.hud.gov/news/2003/pr03-068.cfm.
14 U.S. Department of Housing and Urban Development, HUD’s CoC Homeless Assistance Programs—Housing Inventory Chart Report, 2005–14.
15 U.S. Department of Housing and Urban Development, The 2014 Annual Homeless Assessment Report to Congress.
16 Dennis Culhane, et al., “Testing a Typology of Family Homelessness Based on Patterns of Public Shelter Utilization in Four U.S. Jurisdictions: Implications for Policy and Program Planning,” Housing Policy Debate 18, no. 1 (2007): 1–28.
17 William McAllister, Mary Clare Lennon, and Li Kuang, “Rethinking Research on Forming Typologies of Homelessness,” American Journal of Public Health 101, no. 4 (2011): 596–601; Ellen L. Bassuk, et al., “The Effectiveness of Housing Interventions and Housing and Service Interventions on Ending Family Homelessness: A Systematic Review,” American Journal of Orthopsychiatry 84, no. 5 (2014): 457–74.
18 American Recovery and Reinvestment Act of 2009, Public Law 111–5, Statutes 123 (2009); National Law Center on Homelessness and Poverty, On the Edge: How HUD Can Improve the Homelessness Prevention and Rapid Re-housing Program, 2011; U.S. Department of Housing and Urban Development, Interim rule, “Homeless Emergency Assistance and Rapid Transition to Housing: Emergency Solutions Grants Program and Consolidated Plan Conforming Amendments,” Federal Register 76, no. 233 (December 2011): 75,954–94.
19 Homeless Emergency Assistance and Rapid Transition to Housing (HEARTH) Act of 2009, S 896, 111th Cong., 1st sess.; U.S. Department of Housing and Urban Development, Emergency Solutions Grant Program: Getting Ready for the New ESG, 2011.
20 National Law Center on Homelessness and Poverty, On the Edge, 2011.
21 Homeless Emergency Assistance and Rapid Transition to Housing (HEARTH) Act of 2009.
22 U.S. Department of Housing and Urban Development, Notice of Allocations, Application Procedures, and Requirements for Homelessness Prevention and Rapid Re-housing Program Grantees Under the American Recovery and Reinvestment Act of 2009, March 2009; National Law Center on Homelessness and Poverty, On the Edge, 2011.
23 A small percentage of households participated in the program more than once, at least once as an at-risk family and once as a homeless family. The ratio of at-risk to homeless households was slightly inflated by improper data collection. For example, some homeless families were categorized by their case managers as stably housed if they received HPRP through a prevention agency or if they had recently obtained housing vouchers; U.S. Department of Housing and Urban Development, “The HPRP Annual Performance Report (APR) Webinar,” https://www.hudexchange.info/ resource/1854/hprp-webinar-annual-performance-report-apr.
24 Marybeth Shinn, et al., “Predictors of Homelessness Among Families in New York City: From Shelter Request to Housing Stability,” American Journal of Public Health 88, no. 11 (1998): 1,651–7.
25 U.S. Department of Housing and Urban Development, Notice of Allocations, Application Procedures, and Requirements, 2009; U.S. Department of Housing and Urban Development, Homelessness Prevention and Rapid Re-housing Program: Year 2 Summary, 2013.
26 U.S. Department of Housing and Urban Development, The 2010 Annual Homeless Assessment Report to Congress.
27 This figure excludes data from Phoenix, AZ; Sacramento County, CA (but not Sacramento City); Springfield, MO; North Las Vegas, NV; Rio Grande, PR; Pasadena, TX; and Richmond, VA. Documents from these localities were missing from the Homelessness Prevention and Rapid Re-housing Program (HPRP) quarterly performance reports for quarter seven that the Institute for Children, Poverty, and Homelessness received from the U.S. Department of Housing and Urban Development in response to a Freedom of Information Act request. These localities received a total of 0.9% of all HPRP funding; U.S. Department of Housing and Urban Development, HPRP Quarterly Performance Report Q7, 2011.
28 Academic literature had demonstrated years before the recession that homelessness prevention programs serve more households that would likely not have become homeless than families that are actually on a path to homelessness. The main difficulty is that the size of an extremely poor population considered at risk of homelessness is much larger than the group of persons who will eventually become homeless. This difference in population size is so large that even a small percentage of extremely poor persons incorrectly identified for prevention assistance will be greater than the number of persons who would become homeless without assistance. For example, a study of New York City’s welfare caseload in the 1990s correctly identified two-thirds (66%) of welfare recipient families that later became homeless and mistakenly selected 10% of the entire welfare caseload, which did not. While the model correctly identified 6,000 of the 9,000 welfare recipient households that entered the shelter system over the course of the year, the 10% of welfare recipient families incorrectly selected—27,000 out of 270,000—represents a much larger proportion (81.8%) of total households identified as homeless. More recent studies on prevention services in New York City have not examined the error rate at which applicant families are labeled as being on the path to homelessness. However, one did find that for every 100 families receiving prevention services in their neighborhoods, net shelter entries in the area fell by only ten to 20 households. None of these studies have conducted cost-benefit analyses of homelessness prevention; Marybeth Shinn, et al., “Predictors of Homelessness Among Families in New York City,” 1998; Marybeth Shinn, Jim Baumohl, and Kim Hopper, “The Prevention of Homelessness Revisited,” Analyses of Social Issues and Public Policy 1, no. 2 (2001): 95–127; Andrew Greer and Marybeth Shinn, “Targeting Homelessness Prevention Services More Effectively: Introducing a Screener for HomeBase” (conference presentation, 2012 National Conference on Ending Family and Youth Homelessness, Los Angeles, CA, February 9, 2012); Marybeth Shinn and Andrew Greer, Targeting Homelessness Prevention Services More Effectively: Introducing a Screener for HomeBase, 2012; Peter Messeri, Brendan O’Flaherty, and Sarena Goodman, Can Homelessness Be Prevented? Evidence from New York City’s HomeBase Program, 2011; Reauthorization of the McKinney-Vento Homeless Assistance Act: Hearings on the Homelessness Problem in America, the Strengths and Weaknesses of the McKinney-Vento Homeless Assistance Act Housing Programs, and Proposals that Should be Considered as Part of Reauthorizing Legislation to Increase the Effectiveness of Federal Funds in Preventing and Ending Homelessness, Before the Subcommittee on Housing and Transportation, 107th Cong. (2002), 3–7; National Alliance to End Homelessness, A Plan, Not a Dream, How to End Homelessness in Ten Years, 2000.
29 U.S. Department of Housing and Urban Development, The 2010 Annual Homeless Assessment Report to Congress.
30 National Law Center on Homelessness and Poverty, On the Edge, 2011; U.S. Department of Housing and Urban Development, Notice of Allocations, Application Procedures, and Requirements, 2009.
31 U.S. Department of Housing and Urban Development, “Obama Administration Prevented, Ended Homelessness for One Million Americans,” press release, September 13, 2011.
32 U.S. Department of Housing and Urban Development, The 2010 Annual Homeless Assessment Report to Congress.
33 These figures exclude data from Phoenix, AZ; Sacramento County, CA (but not Sacramento City); Springfield, MO; North Las Vegas, NV; Rio Grande, PR; Pasadena, TX; and Richmond, VA. Documents from these localities were missing from the Homelessness Prevention and Rapid Re-housing Program (HPRP) quarterly performance reports for quarter seven that the Institute for Children, Poverty, and Homelessness received from the U.S. Department of Housing and Urban Development in response to a Freedom of Information Act request. These localities received a total of 0.9% of all HPRP funding; U.S. Department of Housing and Urban Development, HPRP Quarterly Performance Report Q7, 2011.
34 U.S. Department of Housing and Urban Development, “Message to HUD’s Emergency Solutions Grant Recipients on the Importance of Rapid Re-housing,” http://www.youtube.com/watch?v=xAi5PMiEDsw&feature=youtu.be; U.S. Department of Housing and Urban Development, “Homeless Emergency Assistance and Rapid Transition to Housing,” 2011; U.S. Department of Housing and Urban Development, Notice of funding allocations and requirements, “Notice of the FY 2011 Substantial Amendment Process and Other Related Information for Recipients of Emergency Solutions Grants Program Funds,” Federal Register 77, no. 18 (January 2012): 4,337–58; Shinn, Baumohl, and Hopper, “The Prevention of Homelessness Revisited,” 2001; Greer and Shinn, “Targeting Homelessness Prevention Services More Effectively,” 2012.
35 U.S. Interagency Council on Homelessness and U.S. Department of Housing and Urban Development, “Homeless Crisis Response,” https://www.hudexchange.info/training-events/ courses/retooling-the-homeless-crisis-response-system-webinar.
36 Homeless Emergency Assistance and Rapid Transition to Housing: Continuum of Care Program, Code of Federal Regulations, title 24, sec. 578 (2012).
37 Ibid.
38 U.S. Interagency Council on Homelessness, Creating Effective Systems to End Homelessness: A Guide to Reallocating Funds in the CoC Program, September 2014.
39 U.S. Department of Health & Human Services, Use of TANF Funds to Serve Homeless Families and Families at Risk of Experiencing Homelessness (TANF-ACF-IM2013-01), February 2013.
40 U.S. Department of Housing and Urban Development, Notice of Public Interest (NOPI) for Fiscal Year 2010 Transformation Initiative: Homeless Families Demonstration Small Grant Research Program, 2011.
Issue 6
Mainstream Social Safety Net Programs
1 U.S. Department of Housing and Urban Development, HUD’s 2011 Exhibit 1 Continuum of Care (CoC) Application.
2 Statistics are for adults exiting the Supportive Housing Program (SHP), the Shelter Plus Care (S+C) program, or the Section 8 Moderate Rehabilitation for Single Room Occupancy Dwellings Program. SHP funds transitional housing, permanent housing, safe havens, innovative supportive housing, supportive services only, and homeless management information systems. S+C includes tenant-, sponsor-, and project-based rental assistance and single room occupancy dwellings. Beginning in Fiscal Year 2012, the Homeless Emergency Assistance and Rapid Transition to Housing (HEARTH) Act of 2009 consolidated the SHP, S+C, and Section 8 Moderate Rehabilitation grants into the Continuum of Care Program; Ibid.; U.S. Department of Housing and Urban Development, “Homeless Emergency Assistance and Rapid Transition to Housing: Continuum of Care Program Interim Rule,” Federal Register 77, no. 147 (July 2012).
3 U.S. Department of Health and Human Services, Homelessness Data in Health and Human Services Mainstream Programs, Winter 2009.
4 U.S. Department of Health and Human Services, Characteristics and Dynamics of Homeless Families with Children, 2007; U.S. Census Bureau, 2013 American Community Survey 1-year Estimates.
5 To qualify for the two-parent work rate, parents must participate for a combined total of at least 35 to 55 hours, depending on whether or not they receive federally funded child care; U.S. Department of Health and Human Services, “Temporary Assistance for Needy Families (TANF),” http://www.acf.hhs.gov/programs/ofa/programs/tanf; Urban Institute, Welfare Rules Databook: State TANF Policies as of July 2013, August 2014.
6 U.S. Department of Health and Human Services, “Head Start,” http://eclkc.ohs.acf.hhs.gov/hslc.
7 Barbara Duffield, “Serving Homeless Children Through Head Start” (conference presentation, National Association for the Education of Homeless Children and Youth, 21st Annual Conference, Denver, CO, November 14, 2009); Family Housing Fund, Homelessness and its Effects on Children, 1999.
8 Improving Head Start for School Readiness Act, Public Law 110–134, U.S. Code 42 (2007), § 9836A; U.S. Department of Health and Human Services, Head Start Collaboration Offices Priority Areas, September 2009.
9 U.S. Department of Health and Human Services, 2012–13 Head Start Program Information Report, Family Information Report Multi Year Report— National Level.
10 Migrant and Seasonal Head Start programs provide services to children of low-income farmworkers who relocate during harvest season to engage in agricultural labor; U.S. Department of Health and Human Services, 2012–13 Head Start Program Information Report, Survey Summary Report— National Level; U.S. Department of Health and Human Services, 2012–13 Head Start Program Information Report, Family Information Report—National Level.
11 U.S. Department of Health and Human Services, 2012–13 Head Start Program Information Report, Family Information Report—National Level.
12 U.S. Department of Health and Human Services, 2012–13 Head Start Program Information Report, Family Information Report—State Level.
13 The release of HHS’s Head Start Impact Study in 2010 has caused some to question decades of prior research demonstrating the positive benefits of Head Start. In the HHS study, nearly 5,000 eligible three- and four-year-olds were randomly assigned to either of two groups: an experimental group of children enrolled in Head Start programs during the initial year of the study or a control group of children who could not access Head Start but could receive non–Head Start services. The study found little difference for measures of school readiness and student achievement between these two groups at the end of first grade. However, results should be interpreted with caution, as the methodological design allowed for experimental and control groups to closely resemble each other. Three-fifths (60%) of all children in the control group accessed child care or early education programs during the first year of the study; 13.8% of four-year-old and 17.8% of three-year-old control group participants were able to enroll in Head Start after the study began. In addition, the sample was comprised of children who were likely to enroll in schools that serve primarily low-income children. Because the researchers did not examine the effect, if any, of school quality on academic performance, it is unclear if this variable played a role in findings; U.S. Department of Health and Human Services, Head Start Impact Study: Final Report, January 2010; National Forum on Early Childhood Policy and Programs, Evaluation Science Brief: Understanding the Head Start Impact Study, 2010; National Head Start Association, Benefits of Head Start and Early Head Start Programs; U.S. Department of Health and Human Services, Serving Homeless Families: Descriptions, Effective Practices, and Lessons Learned, April 1999; Jens Ludwig and Deborah Phillips, “The Benefits and Costs of Head Start,” Society for Research on Child Development, Social Policy Report 21, no. 3 (2007): 3–18; Preschool Services Department of San Bernardino County, Kindergarten Readiness Study: Head Start Success, Interim Report, 2003.
14 U.S. Department of Health and Human Services, 2012–13 Head Start Program Information Report, Family Information Report—National Level.
15 Ibid.
16 U.S. Interagency Council on Homelessness, Supplemental Document to the Federal Strategic Plan to Prevent and End Homelessness: External Experts’ Briefs, June 2010; U.S. Department of Health and Human Services, Information Memorandum: ACF-IM-92-12, June 1992; Improving Head Start for School Readiness Act, Public Law 110–34, U.S. Code 42 (2007), § 9836A; Matthew Adams, “Head Start’s Positive Impact on Homeless Families” (conference presentation, Young Children Without Homes National Conference, Boston, MA, May 30, 2012).
17 Alabama Department of Children’s Affairs, Alabama 2008–09 Needs Assessment Survey Results; Arizona Head Start Collaboration Office, 2010 Needs Assessment; Delaware Head Start Collaboration Office, 2010 Needs Assessment; Florida Head Start Collaboration Office, Needs Assessment: 2009–10 Survey Results; Georgia Head Start Association, Needs Assessment, December 2010; Maryland Head Start State Collaboration Office, Needs Assessment Report and Strategic Plan 2010–11; Mississippi Head Start State Collaboration Office, 2010 Needs Assessment Report; Missouri Head Start State Collaboration Office, Fiscal Year 2010 Needs Assessment Report; Montana Head Start/State Collaboration Office, 2008 Needs Assessment Report; Montana Head Start State Collaboration Office, Head Start Collaboration Needs Assessment: 2010 Update; National Americans Indian/Alaska Native Head Start Collaboration Office, National AIAN Head Start Collaboration Needs Assessment 2009; Nevada Head Start Collaboration and Early Childhood Systems Office, 2011 Head Start and Early Head Start Needs Assessment Report; North Dakota Head Start State Collaboration Office, Needs Assessment: 2009–10 Survey Results; North Dakota Head Start State Collaboration Office, Needs Assessment: 2011–12 Survey Results; South Dakota Head Start State Collaboration Office, Needs Assessment: 2001–11 Survey Results; Virginia Head Start, Needs Assessment Survey Results: 2009–10.
18 Office of Head Start, Head Start Collaboration Offices: 2009 Annual State and National Profiles.
19 U.S. Department of Health and Human Services, Strategies for Increasing ECE Services for Homeless Children, January 2013.
20 U.S. Department of Health and Human Services, “Head Start Continues Quality Reforms with Second Group of Competitions,” press release, January 17, 2013; U.S. Department of Health and Human Services, Report to Congress on the Final Head Start Program Designation Renewal System, November 2011; The White House, “We Can’t Wait: President Obama Takes Action to Improve Quality and Promote Accountability in Head Start Programs,” press release, November 8, 2011.
21 U.S. Department of Health and Human Services, FY 2013 CCDF Data Tables (Preliminary Estimates, October 2014).
22 Child Care and Development Block Grant Act of 1990, Public Law 101–508, U.S. Code 42 (1990), § 9858 et seq.
23 ICPH analysis of Child Care and Development Fund state plans for Fiscal Years 2014–15; Urban Institute, The CCDF Policies Database Book of Tables: Key Cross-state Variations in CCDF Policies as of October 1, 2012, November 2013.
24 U.S. Department of Health and Human Services, Estimates of Child Care Eligibility and Receipt for Fiscal Year 2006.
25 U.S. Department of Agriculture, “Supplemental Nutrition Assistance Program (SNAP),” http:// www.fns.usda.gov/snap.
26 See endnote 2; U.S. Department of Housing and Urban Development, HUD’s 2011 Exhibit 1 Continuum of Care (CoC) Application.
27 U.S. Department of Agriculture, “Supplemental Nutrition Assistance Program: Able-bodied Adults Without Dependents (ABAWDs),” http://www.fns.usda.gov/snap.
28 Homeless families may receive special food packages if they have do not have access to facilities where they can store perishables or cook food; U.S. Department of Agriculture, WIC Participant and Program Characteristics 2012 Final Report.
29 U.S. Department of Agriculture, “Women, Infants, and Children,” http://www.fns.usda.gov/wic.
30 Rickelle Richards, et al., “Maternal Health Behaviors and Infant Health Outcomes among Homeless Mothers: U.S. Special Supplemental Nutrition Program for Women, Infants, and Children (WIC) 2000–07,” Preventive Medicine 52, no. 1 (2011): 87–94.
31 Dena Herman, et al., “The Effect of the WIC Program on Food Security Status of Pregnant, First-time Participants,” Family Economics and Nutrition Review 16, no. 1 (2004): 21–9.
32 Rickelle Richards, et al., “Maternal Health Behaviors and Infant Health Outcomes among Homeless Mothers: U.S. Special Supplemental Nutrition Program for Women, Infants, and Children (WIC) 2000–07,” Preventive Medicine 52, no. 1 (2011): 87–94.
33 Gordon W. Gunderson, The National School Lunch Program: Background and Development, 1971; U.S. Department of Agriculture, “Annual Summary of Food and Nutrition Service Programs,” http:// www.fns.usda.gov/pd/overview; U.S. Department of Agriculture, National School Lunch Program, 2014; U.S. Department of Agriculture, “National School Lunch Program: Participation and Lunches Served,” http://www.fns.usda.gov/pd/child-nutrition-tables.
34 U.S. Department of Agriculture, National School Lunch Program, 2014; U.S. Department of Agriculture, Eligibility Manual for School Meals: Determining and Verifying Eligibility, 2012.
35 Rachel Dunifon and Lori Kowaleski-Jones, “The Influences of Participation in the National School Lunch Program and Food Insecurity on Child Well-being,” Social Service Review 77, no. 1 (2003): 72–92; Craig Gunderson, Brent Kreider, and John Pepper, “The Impact of the National School Lunch Program on Child Health: A Nonparametric Bounds Analysis,” Journal of Econometrics 166, no. 1 (2012): 79–91; Nader S. Kabbani and Myra Y. Kmeid, “The Role of Food Assistance in Helping Food Insecure Households Escape Hunger,” Applied Economic Perspectives and Policy 27, no. 3 (2005): 439–45.
36 Nader S. Kabbani and Myra Y. Kmeid, “The Role of Food Assistance in Helping Food Insecure Households Escape Hunger,” Applied Economic Perspectives and Policy 27, no. 3 (2005): 439–45; Craig Gunderson, Brent Kreider, and John Pepper, “The Impact of the National School Lunch Program on Child Health: A Nonparametric Bounds Analysis,” Journal of Econometrics 166, no. 1 (2012): 79–91.
37 Rachel Dunifon and Lori Kowaleski-Jones, “The Influences of Participation in the National School Lunch Program and Food Insecurity on Child Well-being,” Social Service Review 77, no. 1 (2003): 72–92.
38 Mark Nord and Kathleen Romig, “Hunger in the Summer: Seasonal Food Insecurity and the National School Lunch and Summer Food Service Programs,” Journal of Children and Poverty 12, no. 2 (2006): 141–58; Judi Bartfeld and Rachel Dunifon, State-level Predictors of Food Insecurity and Hunger Among Households with Children, 2005.
39 Sanders Korenman, et al., “The Child and Adult Care Food Program and the Nutrition of Preschoolers,” Early Childhood Research Quarterly 28, no. 2 (2013): 325–36.
40 U.S. Department of Agriculture, Eligibility Manual for School Meals: Determining and Verifying Eligibility, 2011; U.S. Department of Agriculture, “Child Nutrition Tables,” http://www.fns.usda. gov/pd/child-nutrition-tables.
41 Centers for Medicare and Medicaid Services, “Medicaid,” http://www.medicaid.gov.
42 U.S. Census Bureau, Income, Poverty, and Health Insurance Coverage in the United States: 2012; U.S. Census Bureau, Income, Poverty, and Health Insurance Coverage in the United States: 2007; Center on Budget and Policy Priorities, Statement by Robert Greenstein, President, on Census’ 2010 Poverty, Income, and Health Insurance Data, September 2011.
43 The Henry J. Kaiser Family Foundation, CHIP Enrollment Snapshot: December 2013, June 2014.
44 See endnote 2; U.S. Department of Housing and Urban Development, HUD’s 2011 Exhibit 1 Continuum of Care (CoC) Application.
45 Arturo Brito, et al., “The Enhanced Medical Home: The Pediatric Standard of Care for Medically Underserved Children,” Advances in Pediatrics 55 (2008): 9–28.
46 Linda Weinreb, et al., “Health Characteristics and Medical Service Use Patterns of Sheltered Homeless and Low-income Housed Mothers,” Journal of General Internal Medicine 13, no. 6 (1998): 389–97.
47 Health Resources and Services Administration, 2013 Uniform Data System.
48 Health Care for the Homeless Council, Homelessness and Health: What’s the Connection?, 2010.
49 National Health Care for the Homeless Council, Waiting for Care: the Availability of Health Services for Homeless Persons, 2006.
50 U.S. Department of Housing and Urban Development, The 2012 Annual Homeless Assessment Report to Congress.
51 Established in 1974 and financed by U.S. Treasury general funds, SSI offers cash assistance to individuals who are 65 years of age or older, blind, or disabled and have minimal income and limited assets. Minors or students under age 22 who are blind or disabled are also eligible. Founded in 1956, the SSDI program covers benefits for disabled workers (and their family members) who were employed, paid Social Security taxes, and can no longer work due to long-term or fatal medical conditions or disabilities. Persons with co-occurring substance abuse and mental health disorders can receive SSI or SSDI, but persons affected solely by alcoholism or drug addiction are not eligible. While states often allocate additional SSI monies, the 2014 federal amounts per month are $721 for an individual and $1,082 for a couple. Recipients’ monthly SSDI benefits vary by their prior payroll contributions and are funded by the federal Disability Insurance Trust Fund. SSI benefit recipients in most states are categorically eligible for Medicaid and SSDI recipients automatically get Medicare coverage after a two-year enrollment period. Thirty-two states and the District of Columbia have a dual SSI and Medicaid application, with benefit eligibility determined simultaneously. Other select states have the same eligibility criteria for Medicaid that SSA uses for SSI, but two separate applications; U.S. Social Security Administration, “Benefits for People with Disabilities,” http://www.ssa.gov/disability; U.S. Social Security Administration, “SSI Federal Payment Amounts for 2014,” http://www.ssa.gov/oact/cola/SSI.html; U.S. Interagency Council on Homelessness, “Supplemental Security Income,” http://www.usich.gov/about_us/funding_programs/programs; U.S. Interagency Council on Homelessness, “Social Security Disability Insurance,” http://www.usich.gov/about_us/funding_programs/programs; U.S. Department of Health and Human Services, Stepping Stones to Recovery: A Case Manager’s Manual for Assisting Adults Who are Homeless, with Social Security Disability and Supplemental Security Income Applications, 2005; U.S. Social Security Administration, “Medicaid Information,” http://www.ssa.gov/disabilityresearch/wi/medicaid.htm; National Health Care for the Homeless Council, Poverty, Employment and Homelessness, 2011 Policy Statement.
52 National Health Care for the Homeless Council, Poverty, Employment and Homelessness, 2011 Policy Statement.
53 Mathematica Policy Research, Findings From a Study of the SSI/SSDI Outreach, Access and Recovery (SOAR) Initiative, September 2009; U.S. Department of Housing and Urban Development, The 2010 Annual Homeless Assessment Report to Congress.
54 See endnote 2; U.S. Department of Housing and Urban Development, HUD’s 2011 Exhibit 1 Continuum of Care (CoC) Application.
55 Substance Abuse and Mental Health Services Administration, SOAR Technical Assistance Center, 2013 SOAR Outcomes Summary.
56 National Health Care for the Homeless Council, Disability, Employment and Homelessness, 2011.
57 U.S. Department of Health and Human Services, Stepping Stones to Recovery, 2005.
58 Substance Abuse and Mental Health Services Administration, SOAR Technical Assistance Center, 2011 SOAR Outcomes.
59 Substance Abuse and Mental Health Services Administration, SOAR Technical Assistance Center, “SOAR In Your State,” http://soarworks. prainc.com/directory.
60 A paired samples t-test was conducted to examine the differences among 2008, 2009, 2010, and 2011 disability benefit enrollment rates among homeless adults exiting the Supportive Housing Program or Shelter Plus Care. Four effects were significant for the experimental group that received SOAR training in 2009: 2009–10, t(50)=-2.52, p=.015; 2008–10, t(50)=-1.96, p=.056; 2008–11, t(50)=-2.75, p=.008; 2009–11, t(50)=-2.81, p=.007; U.S. Department of Housing and Urban Development, HUD’s Exhibit ^9 Continuum of Care (CoC) Application, 2008–11.
61 Mathematica Policy Research, Findings From a Study of the SSI/SSDI Outreach, Access and Recovery (SOAR) Initiative, 2009.
62 U.S. Department of Housing and Urban Development, 2011 Exhibit 1 Continuum of Care (CoC) Application; U.S. Department of Housing and Urban Development, Strategies for Improving Homeless People’s Access, 2010.
63 U.S. Interagency Council on Homelessness, Opening Doors: Federal Strategic Plan to Prevent and End Homelessness, 2010; U.S. Interagency Council on Homelessness, Opening Doors: Federal Strategic Plan to Prevent and End Homelessness: Update 2013.
64 U.S. Department of Housing and Urban Development, Notice of Funding Availability (NOFA) for the Continuum of Care Program, 2005 –13.
65 Ibid.
66 U.S. Department of Housing and Urban Development, HUD’s Exhibit 1 Continuum of Care (CoC) Application, 2005–13.
67 Ibid.
68 U.S. Department of Housing and Urban Development, Notice of Funding Availability (NOFA) for the Continuum of Care Program, 2005 –13.
References
Glossary
Affordable housing
Housing is considered affordable when a household spends no more than 30% of its income on housing-related costs, such as rent and utilities.
American Recovery and Reinvestment Act of 2009 (ARRA)
On February 13, 2009, Congress passed the American Recovery and Reinvestment Act (ARRA) in response to the Great Recession. This legislation aimed to create jobs, increase economic activity, invest in long-term economic growth, and demonstrate accountability and transparency in government spending. To achieve these goals, ARRA appropriated funds for tax cuts; entitlement programs; education; health care; and federal contracts, grants, and loans. The act also included $1.5 billion for homeless and at-risk households through the Homelessness Prevention and Rapid Re-housing Program.
Annual Homeless Assessment Report to Congress (AHAR)
The Annual Homeless Assessment Report to Congress (AHAR) is a yearly report by the U.S. Department of Housing and Urban Development about homelessness in the United States. The report describes year-to-year trends in homelessness as observed from point-in-time count and Homeless Management Information System data. The AHAR includes information on demographics, available services, subgroup censuses, duration of homelessness, and housing situations prior to homelessness.
Area Median Income (AMI)
Area Median Income is the median income within a particular metropolitan or nonmetropolitan area, adjusted for household size.
Block grant program
Block grants are federal monies allocated by formula to state and local governments. Block grants give recipients broad flexibility to design and implement designated programs because federal oversight and requirements are limited, but funding levels are unresponsive to increased need during economic downturns. Examples of block grants include: Temporary Assistance for Needy Families, Community Development Block Grant, Social Services Block Grant, and the Low Income Home Energy Assistance Program.
Centralized or coordinated assessment system
A centralized or coordinated assessment system uses a standardized tool to evaluate the needs of all homeless households in the same way prior to receiving homelessness services. Assistance is then tailored according to an individual family’s level of need and barriers to self-sufficiency.
Child Care and Development Block Grant (CCDBG) Act
The Child Care and Development Block Grant (CCDBG) Act is federal legislation that authorizes the Child Care and Development Fund, which provides child care subsidies for low-income families.
Child Care and Development Fund (CCDF)
The Child Care and Development Fund (CCDF) is the primary source of child care subsidies for low-income families. CCDF is a block grant administered by the U.S. Department of Health and Human Services.
Children’s Health Insurance Program (CHIP)
Created in 1997, the Children’s Health Insurance Program provides federal matching funds for state health insurance programs serving uninsured children and pregnant women in families who do not qualify for Medicaid but are unable to afford private insurance.
Chronic homelessness
Chronically homeless individuals are persons with disabling conditions who have been homeless for one or more years, or who have had four or more episodes of homelessness in the past three years. During these episodes, a chronically homeless person has resided in emergency shelter or a place not meant for human habitation; transitional housing and permanent supportive housing clients are not considered chronically homeless. As of January 2012, a family may be considered chronically homeless, pursuant to the Homeless Emergency Assistance and Rapid Transition to Housing Act of 2009, if the adult head of household fits the definition of a chronically homeless person.
Continuum of Care (CoC)
A Continuum of Care (CoC) is a coordinated, comprehensive, and strategic organizational structure representing an area of a state and mandated by the U.S. Department of Housing and Urban Development (HUD) to receive homeless assistance funding. A CoC may represent an area as small as a city and as large as an entire state. For the most part, CoCs are organized at the regional or local level, with the remaining jurisdictions within a state belonging to the Balance of State CoC. Within the CoC, community service providers, public housing authorities, nonprofit organizations, and local and state governments form a consortium to address local homelessness and housing issues. The CoC submits an application for funds available under the McKinney-Vento Homeless Assistance Act. Before the Homeless Emergency Assistance and Rapid Transition to Housing (HEARTH) Act, these included Supportive Housing Program and Shelter Plus Care grants. With the passage of the HEARTH Act, these include Continuum of Care Program and Emergency Solutions Grant Program funds.
Continuum of Care Program
The Homeless Emergency Assistance and Rapid Transition to Housing Act consolidated the U.S. Department of Housing and Urban Development’s Supportive Housing Program, Shelter Plus Care, and Section 8 Moderate Rehabilitation Program for Single-room Occupancy Dwellings for Homeless Individuals into the Continuum of Care (CoC) Program. The CoC Program funds permanent supportive housing, rapid re-housing, transitional housing, supportive services, and Homeless Management Information Systems. The program also formalizes the preexisting CoC funding application and service coordination process and requires increased collaboration between Emergency Solutions Grant recipients and CoCs.
Cost burden
A household is cost-burdened when it pays more than 30% of its income on housing-related expenses. A household is severely cost-burdened when it spends more than 50% of its income on housing-related costs.
Diversion
Diversion programs find housing alternatives for families as they are entering shelter. These programs either resolve the problems that forced families out of their former residences (for example, through landlord mediation) or find new housing for families.
Doubled up
Doubled-up households share the housing of other persons due to loss of housing, economic hardship, or a similar reason.
Education for Homeless Children and Youth Program (EHCY)
Authorized under Title VII-B of the McKinney-Vento Homeless Assistance Act, the Education for Homeless Children and Youth Program (EHCY) ensures that homeless students have equal access to free and appropriate public education. According to EHCY, homeless children must be enrolled immediately, have the right to remain in and receive transportation to their schools of origin, and receive supports to succeed academically. Each state provides activities and services for homeless children, including tutoring, summer enrichment programs, and school supplies, to increase enrollment, attendance, and achievement in school. State education agencies (SEAs) facilitate coordination between schools and other organizations, increasing their knowledge of and ability to address issues that homeless children face. SEAs also remove policy barriers to homeless children’s school attendance and success and allocate competitive subgrants to local educational agencies. At the local level, each school district must appoint a liaison responsible for the identification of homeless children, coordination and collaboration activities, local adherence to EHCY policies, and the delivery of EHCY services.
Emergency shelter
Emergency shelter programs are temporary residential programs where clients temporarily stay in order to avoid unsheltered homelessness and solve immediate crises.
Emergency Shelter Grants Program (ESG)
Superseded by the Emergency Solutions Grant Program, the Emergency Shelter Grants Program (ESG) was a formula-based federal block grant program allocated to metropolises, urban counties, and states. ESG could be used to fund the operational cost of a shelter facility, the remodeling or rehabilitation of a building used as a shelter, services that address the issues that underlie homelessness, street outreach, prevention, and grant administration. ESG was administered by the U.S. Department of Housing and Urban Development. Grantees had to match ESG dollars with local revenue.
Emergency Solutions Grant Program (ESG)
The Homeless Emergency Assistance and Rapid Transition to Housing Act replaced the U.S. Department of Housing and Urban Development’s Emergency Shelter Grants Program with the Emergency Solutions Grant Program (ESG). In addition to funding shelter, street outreach, and grant administration, the new ESG added rapid re-housing as an eligible activity and extended the maximum period for prevention assistance to 24 months.
Entitlement program
Entitlement programs are federal grants allocated based on the number of beneficiaries meeting predetermined eligibility criteria. Entitlement programs have narrowly defined allowable usages but are responsive to increased need during economic downturns. Entitlement programs include: Medicaid, Medicare, Supplemental Nutrition Assistance Program, and unemployment insurance benefits.
Fair Market Rent (FMR)
The Fair Market Rent (FMR) in an area is the 40th percentile rent, or the amount below which 40% of market-rent, standard-quality rental units cost. FMR standards are used to determine rent payments for the Section 8 Housing Choice Voucher program.
Federal minimum wage
Established by the Fair Labor Standards Act, the federal minimum wage represents the minimum hourly rate (currently set at $7.25) at which employers must pay employees.
Federal Poverty Level (FPL)
The federal poverty guidelines are a simple measure of the federal poverty threshold used for administrative purposes. The poverty line (level) was originally calculated by multiplying the U.S. Department of Agriculture’s economic food plan by a factor of three. The poverty line is now calculated according to the 1963 food plan, adjusted for inflation with the Consumer Price Index. The guidelines are updated annually by the U.S. Department of Health and Human Services and are adjusted for household size. For statistical purposes, the U.S. Census Bureau uses different poverty thresholds.
Food insecurity
According to the U.S. Department of Agriculture, food insecurity describes the condition of having limited or uncertain access to nutritionally adequate, safe foods or the inability to access adequate foods in socially acceptable ways (e.g., without scavenging or stealing).
Foreclosure
Foreclosure is a legal process initiated by the lender of a mortgage to a borrower who is unable to make payments or does not comply with other terms of the mortgage. The lender is due the remaining balance of the loan and may sell or repossess the home. The majority of foreclosures do not result in the loss of the borrower’s home.
Framework to End Youth Homelessness
The U.S. Interagency Council on Homelessness released the Framework to End Youth Homelessness in 2013 to provide a plan for ultimately preventing and ending youth homelessness. The framework proposes short-, medium-, and long-term strategies for improved data collection and capacity building at the federal, state, and local levels.
Great Recession
The term “Great Recession” refers to the period between December 2007 and June 2009, during which the U.S. experienced depressed economic conditions.
Head Start
Head Start is a high-quality early childhood development program that serves low-income children from birth to age five and their families. Under the Head Start Act of 2007, income-eligible families are connected to social services related to education, health care, nutrition, parenting, and other areas. Head Start is primarily comprised of two components: Early Head Start, for children zero to three years of age and pregnant women, and Head Start, for children ages three to five. Head Start is administered by the U.S. Department of Health and Human Services’ Administration for Children and Families.
Health Care for the Homeless (HCH)
Health Care for the Homeless (HCH) facilitates the operation of health clinics in shelters and soup kitchens. At these sites, health and social workers provide comprehensive medical care to homeless persons and link participants to services related to safe shelter, permanent housing, jobs, family relationships, and substance abuse. HCH grantees include nonprofit organizations, community health centers, local health departments, homeless shelters, and homeless coalitions. HCH is administered by the U.S. Department of Health and Human Services’ Health Resources and Services Administration.
Homeless
U.S. Department of Housing and Urban Development definition
Homeless persons are those who live unsheltered or in places not meant for human habitation (e.g., abandoned buildings, vehicles, parks, etc.); live in publicly or privately operated emergency shelters, transitional housing facilities, or the like, or in hotels or motels paid for by charitable or government entities; are exiting institutions after stays of 90 days or less and lived unsheltered or in homeless shelters prior to entry; are fleeing domestic violence; will imminently lose their primary nighttime residences; or are unaccompanied youth under age 25 or members of families with children or unaccompanied youth and qualify as homeless due to other legislation.
Subtitle B of Title VII of the McKinney-Vento Homeless Assistance Act definition
Homeless individuals are those who lack fixed, regular, and adequate nighttime residences, including persons who share others’ homes due to loss of housing or economic hardship; live in motels, hotels, trailer parks, or camping grounds due to lack of adequate alternative accommodations; reside in emergency or transitional shelters; live in abandoned hospitals; are awaiting foster care placement; or reside in public or private places not designed for or used as regular sleeping accommodations. The Almanac uses the McKinney-Vento definition of homelessness.
Homeless Emergency Assistance and Rapid Transition to Housing (HEARTH) Act of 2009
The Homeless Emergency Assistance and Rapid Transition to Housing (HEARTH) Act of 2009 is the most recent reauthorization of the McKinney-Vento Homeless Assistance Act. Most notably, the HEARTH Act expanded the definitions of homelessness and chronic homelessness used by the U.S. Department of Housing and Urban Development; replaced the Emergency Shelter Grants Program with the Emergency Solutions Grant Program to add rapid re-housing as an eligible activity and extend prevention assistance; and consolidated the Supportive Housing Program, Shelter Plus Care, and Section 8 Moderate Rehabilitation Program for Single-room Occupancy Dwellings for Homeless Individuals into the Continuum of Care Program.
Homeless Management Information Systems (HMIS)
Homeless Management Information Systems collect client-level data on client characteristics, the extent and nature of service use, and outcomes for all families accessing emergency shelter or transitional housing over the course of one year.
Homelessness Prevention and Rapid Re-housing Program (HPRP)
As part of the American Recovery and Reinvestment Act (ARRA) of 2009, the Homelessness Prevention and Rapid Re-housing Program funded programming that provided short- and medium-term financial assistance and housing stabilization to individuals and families who were homeless or at risk of becoming homeless. Designed to serve individuals and families who would have been homeless without this assistance, this $1.5 billion initiative gave recipients assistance for up to 18 months and was administered by the U.S. Department of Housing and Urban Development.
Housing first
The housing first strategy for ending homelessness provides homeless persons with immediate, permanent housing, followed by supportive services as needed.
Housing trust fund
Housing trust funds are state and local revenue bases used to develop, construct, and/or rehabilitate affordable housing for low- to moderate-income households. Localities finance trust funds through a variety of methods, including real estate taxes, taxes on select goods, interest on escrow accounts, and income tax write-offs.
Housing wage
The housing wage is how much a full-time worker must earn to afford a two-bedroom home at Fair Market Rent while paying no more than 30% of income towards rent. The housing wage will vary widely across communities due to differences in rents.
Income
Low-income
Low-income households have income below 80% of area median income (AMI).
Very low-income
Very low-income households have income below 50% of AMI.
Extremely low-income
Extremely low-income households have income below 30% of AMI.
Individuals with Disabilities Education Act (IDEA)
First enacted in 1990 and most recently reauthorized in 2004, the Individuals with Disabilities Education Act (IDEA) is federal legislation designed to protect the rights of children and youth with disabilities, ensuring that they have equal access to free appropriate public education. Administered at the federal level by the U.S. Department of Education, IDEA sets guidelines for and directs funding toward states and public agencies providing special education services. Part B of IDEA addresses services for children and youth ages three to 21 and Part C addresses early intervention for infants and toddlers ages two and under.
Liaison, homeless school
Under the Education for Homeless Children and Youth Program (EHCY), authorized by the McKinney-Vento Homeless Assistance Act, each school district must appoint a liaison responsible for the identification of homeless children, coordination and collaboration, local adherence to EHCY policies, and the delivery of EHCY services.
Living wage
The wage required to be able to meet a family’s basic needs and maintain minimum standards of living. The living wage is often compared to the minimum wage to highlight the inadequacy of the minimum wage rate.
Local education agency (LEA)
A local education agency is a legally constituted public authority in charge of administering free public elementary and/or secondary education to members of the community.
Mainstream benefit
A mainstream benefit is a government assistance program that may assist homeless persons but does not exclusively serve this population. Eligibility for mainstream benefits is determined by disability and/or income status. Common mainstream benefits include Temporary Assistance for Needy Families, Supplemental Security Income, Social Security Disability Income, Supplemental Nutrition Assistance Program, Medicaid, and veterans’ benefits.
McKinney-Vento Homeless Assistance Act
The McKinney-Vento Homeless Assistance Act of 1987 established 15 programs assisting homeless persons, including the Supportive Housing Program, Shelter Plus Care, Section 8 Moderate Rehabilitation Program for Single-room Occupancy Dwellings for Homeless Individuals, Emergency Food and Shelter Program, Education for Homeless Children and Youth, and the Emergency Shelter Grants Program. The act also defined homelessness, created the federal Interagency Council on Homelessness within the executive branch, and altered the Food Stamp Program (now Supplemental Nutrition Assistance Program) to be more accessible to homeless persons. The Homeless Emergency Assistance and Rapid Transition to Housing (HEARTH) Act of 2009 is the most recent reauthorization of the legislation. Among other things, the HEARTH Act updates the definition of homelessness, consolidates old programs, and adds eligible activities.
McKinney-Vento Homeless Education Assistance Improvements Act
The McKinney-Vento Homeless Education Assistance Improvements Act reauthorized the Education for Homeless Children and Youth Program (EHCY) through the No Child Left Behind Act in 2001. The Act added provisions to EHCY to further safeguard the educational rights of homeless children, such as the requirement that student transportation be provided to and from the school of origin, the appointment of local education agency (LEA) liaisons with specific duties, a prohibition against the segregation of homeless students into separate schools or classrooms, the requirement that states provide technical assistance to LEAs, and the inclusion of unaccompanied youth as a protected group in addition to children and youth in the physical custody of their parents.
Medicaid
Medicaid is a means-tested program providing funding to eligible (primarily low-income) individuals to pay for the costs of medical and health care. While the federal government and states jointly fund Medicaid, states administer the program individually and have the capacity to set different eligibility requirements and regulations. The Centers for Medicare and Medicaid Services within the U.S. Department of Health and Human Services provides oversight at the federal level for the implementation and efficacy of Medicaid programs, particularly in relation to any policy reforms or changes.
Opening Doors: Federal Strategic Plan to Prevent and End Homelessness
Released in June 2010, Opening Doors: Federal Strategic Plan to Prevent and End Homelessness is the guiding document used by the U.S. Interagency Council on Homelessness. Crafted under the Obama administration to be consistent with the Homeless Emergency Assistance and Rapid Transition to Housing Act of 2009, Opening Doors marked a shift in strategy from that of the previous administration. While the Bush administration focused on reducing chronic homelessness, Opening Doors sets targets for ending homelessness among veterans, families, youth, and children as well as chronically homeless individuals. The plan seeks to achieve these objectives by increasing collaboration, access to affordable housing, employment, and enrollment in mainstream programs; improving health care; advancing housing stability among persons exiting foster care, hospitals, and the criminal justice system; and transforming the homelessness services system to use prevention and rapid re-housing models more frequently.
Patient Protection and Affordable Care Act (ACA)
The Patient Protection and Affordable Care Act was signed into law in March 2010 to reduce the cost of health care and expand health insurance to all Americans, including low-income individuals who are not enrolled in or were previously ineligible for Medicaid. Starting in January 2014, states were allowed to expand Medicaid coverage to all persons whose earnings are at or below 138% of the federal poverty line.
Permanent supportive housing
Permanent supportive housing is subsidized housing coupled with supportive services for chronically homeless persons or those with disabilities. This housing model is not time-limited. Once in permanent supportive housing, persons are no longer considered homeless and hence not included in censuses of homeless persons.
Personal Responsibility and Work Opportunity Reconciliation Act of 1996 (PRWORA)
The Personal Responsibility and Work Opportunity Reconciliation Act of 1996, also known as welfare reform, was designed to restructure federal welfare entitlement programs to end long-term dependence on government aid. The act replaced multiple funding streams, including Aid to Families with Dependent Children, with the Temporary Assistance for Needy Families Program, placing a time limit on cash assistance and adding work requirements. The act also reduced access to the Supplemental Nutrition Assistance Program and increased child support enforcement.
Point-in-time count
The U.S. Department of Housing and Urban Development requires that each Continuum of Care (CoC) conduct an annual census of sheltered adults, children, and youth and a biennial census of unsheltered persons to be reported in the CoC application. Some CoCs choose to conduct surveys more frequently. Point-in-time counts present a “snapshot” of a CoC’s homeless population at a given time. This count must be administered one night during the last seven days of January, collect information on chronically homeless persons and other subpopulations, and use statistically acceptable methods.
Prevention
Prevention models target persons who are at risk of homelessness and provide them with cash assistance for rent or utilities or with housing stabilization services such as landlord mediation, connection with mainstream supports, or housing search.
Rapid re-housing
Rapid re-housing models use short- and medium-term housing subsidies to move families quickly out of emergency shelter with services provided to help families maintain permanent housing.
Rent burden
A household is rent-burdened when it pays more than 30% of its income on housing-related expenses. A household is severely rent-burdened when it spends more than 50% of its income on housing-related costs.
Resilience
Resilience refers to the ability to cope, adapt, and maintain healthy functioning even when facing difficult life circumstances and adversity such as homelessness. Resiliency is influenced by individual, family, and community factors, and can be nurtured and strengthened through targeted interventions.
Runaway and Homeless Youth Act (RHYA)
The Runaway and Homeless Youth Act (RHYA) authorizes programs to provide shelter and supportive services for homeless youth. Funding under RHYA is allocated to three initiatives. The Basic Center Program (founded in 1974) provides short-term shelter, food, counseling, and referral services to homeless youth aged 18 or younger. The Transitional Living Program (1988) offers longer-term shelter and supportive services to youth aged 16–22. The Street Outreach Program (1994) builds connections between vulnerable street youth up to age 22 and outreach workers to prevent and address exploitation. Although federal funding provided under RHYA cuts off eligibility at age 18 or 22, depending on the program type, it allows monies to be used for older clients when state laws permit.
Section 8 Housing Choice Voucher (HCV)
The Section 8 Housing Choice Voucher program (HCV) is a federally funded, tenant-based program that leases existing apartments in the private market through direct rent subsidy payments to landlords. The program helps very low-income families, disabled persons, and the elderly afford safe and sanitary housing. Public housing authorities (PHAs) administer HCV funding provided by the U.S. Department of Housing and Urban Development. At least 75% of HCV vouchers must serve households whose income does not exceed 30% of area median income (AMI), with the remainder allocated to households whose income does not exceed 80% of AMI. Families contribute 30% of their income toward rent and utilities or up to 40% when affordable housing is not available. PHAs may designate up to 20% of HCV funds for project-based vouchers, which are subsidies tied to specific housing units rather than families.
Shelter Plus Care (S+C)
The U.S. Department of Housing and Urban Development’s Shelter Plus Care (S+C) program provided rental subsidies to homeless persons with disabilities (such as mental illness, alcohol and/or drug dependency, or AIDS) and their families, combined with supportive services funded outside the S+C program. S+C funded tenant-based rental assistance, sponsor-based rental assistance, project-based rental assistance, and rehabilitation of and rental assistance for single-room occupancy dwellings. The Homeless Emergency Assistance and Rapid Transition to Housing Act consolidated this program with the Supportive Housing Program and Section 8 Moderate Rehabilitation Program for Single-room Occupancy Dwellings for Homeless Individuals into the Continuum of Care Program.
Social safety net
The social safety net is made up of government-funded, poverty-reduction programs that protect low-income families and individuals in times of economic hardship. These programs are often referred to as mainstream benefit programs and include both entitlement and block grant programs.
Social Security Disability Insurance (SSDI)
The Social Security Disability Insurance program covers benefits for disabled workers (and their family members) who were employed, paid Social Security taxes, and can no longer work due to long-term or fatal medical conditions or disabilities. The program is administered by the U.S. Social Security Administration.
Special Supplemental Nutrition Program for Women, Infants, and Children (WIC)
The Special Supplemental Nutrition Program for Women, Infants, and Children (WIC) addresses the health needs of low-income women who are pregnant, breastfeeding, or post-partum and children ages zero through four who are nutritionally at risk. The program issues grants to states to help provide supplemental foods, nutrition and breastfeeding counseling, health care referrals, and other health services to WIC participants. The Food and Nutrition Service of the U.S. Department of Agriculture administers the program.
Supplemental Nutrition Assistance Program (SNAP)
The Supplemental Nutrition Assistance Program (formerly known as the Food Stamp Program) is an entitlement program administered by the U.S. Department of Agriculture that provides low-income participants with financial assistance for acquiring food and nutritional education.
Supplemental Security Income (SSI)
The Supplemental Security Income program offers cash assistance to individuals who are 65 years of age or older, blind, or disabled and have minimal income and limited assets. Minors or students under age 22 who are blind or disabled are also eligible. The program is administered by the U.S. Social Security Administration.
Supportive Housing Program (SHP)
As part of the McKinney-Vento Homeless Assistance Act, the Supportive Housing Program (SHP) was a grant allocated to states, local governments, nonprofit organizations, and governmental entities by the U.S. Department of Housing and Urban Development. SHP funds developed housing and supportive services to help homeless persons maintain housing stability, increase skill levels and income, and live independently. Applicants could apply this grant to the acquisition, rehabilitation, construction, leasing, operating, implementation, or administrative costs of the following projects: Transitional Housing, Permanent Housing for Persons with Disabilities, Safe Havens, Homeless Management Information Systems, Innovative Supportive Housing, and Supportive Services Only. The Homeless Emergency Assistance and Rapid Transition to Housing Act consolidated this program, Shelter Plus Care, and Section 8 Moderate Rehabilitation Program for Single-room Occupancy Dwellings for Homeless Individuals into the Continuum of Care Program.
Supportive services
Supportive services are programs and assistance, other than housing, designed to help clients transition to self-sufficiency. Forms of supportive services include case management, education programming, job training, employment counseling, financial literacy courses, and child care.
Temporary Assistance for Needy Families (TANF)
Temporary Assistance for Needy Families (TANF) is the federal cash welfare grant that replaced Aid to Families with Dependent Children in 1996. This block grant program funds work-support services such as child care and transportation and provides time-limited cash assistance to low-income families with dependent children with the expectation that households will participate in approved work activities. The goals of TANF include: assisting low-income families so children can be cared for in their own homes; reducing dependency of low-income parents by promoting job readiness, work, and marriage; preventing pregnancies among unwed mothers; and encouraging the formation and stability of two-parent families.
Title I, Part A of the Elementary and Secondary Education Act
Title I, Part A of the Elementary and Secondary Education Act provides funds to local education agencies (LEAs) and schools that have high numbers of low-income students to ensure that all children meet state academic standards. Homeless students are included in Title I’s target population. All schools, regardless of whether they provide Title I services, must reserve funds to provide education-related supportive services for homeless students. These Title I set-asides can fund school uniforms, tutoring at homeless residential programs, and other programs to help homeless students achieve academic success. Each LEA determines the amount available through the Title I set-aside, often based on an assessment of needs or a per-pupil cost evaluation. Title I was last reauthorized through the No Child Left Behind Act of 2001, which added provisions strengthening the language on homeless children’s access to Title I funds and requiring states and LEAs receiving funding to coordinate their activities with the McKinney-Vento Homeless Assistance Act.
Toxic stress
Toxic stress is the excessive or prolonged activation of the body’s stress response systems. Caused by factors such as physical or emotional abuse, exposure to violence, or chronic neglect, it can result in disruptions to the development of a child’s brain and other organs. The damage caused by toxic stress can negatively affect learning, behavior, and health across a person’s lifespan.
Transitional housing
A transitional housing program helps residents transition to permanent housing by providing supportive services. Transitional housing programs serve clients for up to two years.
Unaccompanied youth
An unaccompanied youth is one who lacks a fixed, regular, and adequate nighttime residence and is not in the physical custody of a parent or guardian. The age range used to define this population varies by agency and program.
Unemployment rate
The unemployment rate is the percentage of persons in the civilian, noninstitutionalized labor force who do not have jobs, have actively looked for work within the past four weeks, and are available for work.
U.S. Conference of Mayors
The U.S. Conference of Mayors is a nonpartisan organization of the 1,393 U.S. cities with populations of 30,000 or more. The organization promotes the development of effective national policy, ensures that federal policy meets urban needs, and creates a forum for sharing ideas and information. Its Task Force on Hunger and Homelessness produces an annual report on homelessness.
U.S. Department of Agriculture (USDA)
The U.S. Department of Agriculture’s Food and Nutrition Service provides children and low-income individuals with access to healthful diets and nutrition education. Its programs include Supplemental Nutrition Assistance Program; Special Supplemental Nutrition Program for Women, Infants, and Children; National School Lunch Program; School Breakfast Program; Special Milk Program; Summer Food Service Program; Food Assistance for Disaster Relief; the Emergency Food Assistance Program; and the Child and Adult Care Food Program.
U.S. Department of Education (ED)
The U.S. Department of Education’s Office of Elementary and Secondary Education manages and distributes the Education for Homeless Children and Youth grants for state and local activities, as mandated by the McKinney-Vento Homeless Assistance Act.
U.S. Department of Health and Human Services (HHS)
The U.S. Department of Health and Human Services (HHS) is the federal agency responsible for administering essential health and social services, overseeing more than 300 programs, including Medicare, Medicaid, and Head Start, and providing funding for social science research. HHS also informs and solicits feedback from state and local entities on program regulations and policy reforms. The agency encompasses 11 operating divisions, including the Administration for Children and Families (ACF), Centers for Medicare and Medicaid Services, Food and Drug Administration, Health Resources and Services Administration (HRSA), and the Substance Abuse and Mental Health Services Administration. ACF funds state, territory, local, and tribal organizations to provide family assistance (welfare), child support, child care, Head Start, child welfare, and other programs relating to children and families. Actual services are provided by state, county, city, and tribal governments as well as by private local agencies. ACF also provides policy direction and information services. HRSA funds health care providers across the country to deliver services for uninsured or medically vulnerable populations, train health care professionals, improve access to health care in rural communities, and improve access to high-quality health care in other ways. HRSA administers the Health Care for the Homeless program.
U.S. Department of Housing and Urban Development (HUD)
The U.S. Department of Housing and Urban Development is a federal agency that aims to increase homeownership, expand community development, eliminate housing discrimination, and ensure access to affordable housing. Its programs include the Emergency Solutions Grant Program, the Continuum of Care Program, and the Section 8 Housing Choice Voucher program.
U.S. Department of Veterans Affairs (VA)
The U.S. Department of Veterans Affairs (VA) is the federal agency charged with administering benefits and services to veterans and their families, including health benefits, disability compensation, pensions, education benefits, and employment training. VA also leads the Homeless Veterans Initiative, providing counseling and directing funding to programs that target supportive services to veterans experiencing homelessness.
U.S. Interagency Council on Homelessness (USICH)
The U.S. Interagency Council on Homelessness (USICH), an independent federal agency, coordinates the implementation of Opening Doors: Federal Strategic Plan to Prevent and End Homelessness. Partnering with 19 federal Cabinet secretaries and other agency heads, USICH is charged with monitoring the effectiveness of federal programs in combating homelessness, facilitating improved collaboration among federal agency programs, and informing and assisting organizations and entities at the state and local levels working in the field of homelessness services. Formerly named the Interagency Council on the Homeless, which the McKinney-Vento Homeless Assistance Act of 1987 established, USICH was most recently reauthorized in 2009 under the auspices of the Homeless Emergency Assistance and Rapid Transition to Housing Act.
U.S. Social Security Administration (SSA)
The U.S. Social Security Administration administers the Retirement, Disability, and Survivor Insurance programs, including Supplemental Security Income and Social Security Disability Insurance, and determines eligibility for Medicare.