April 2016
Key Findings
-
Growth in the shelter system is not due to new homeless families with children entering shelter, but to long-term stayers and repeat entrants.
-
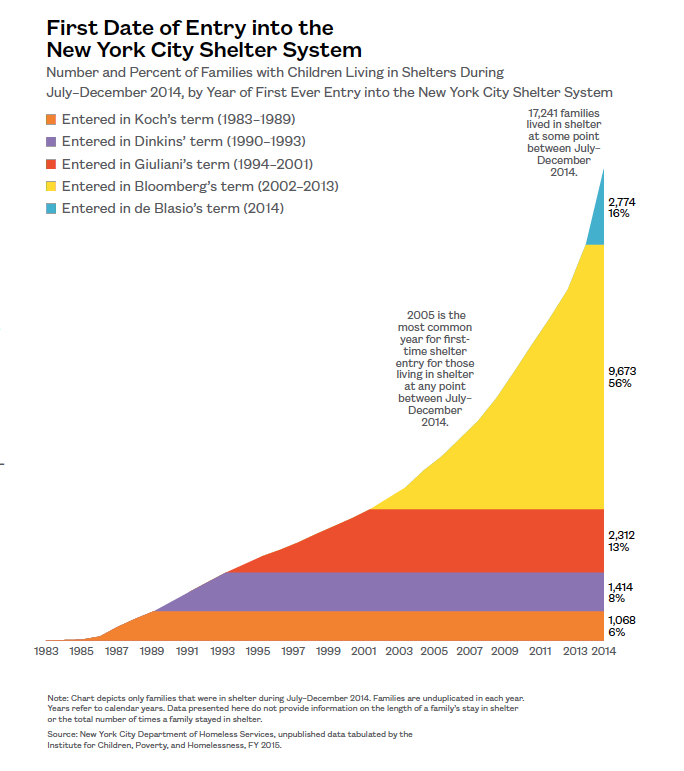
Only 16% of families with children living in shelter in the last half of 2014 entered for the first time during the 2014 calendar year. The remaining 84% entered for the first time prior to 2014.
-
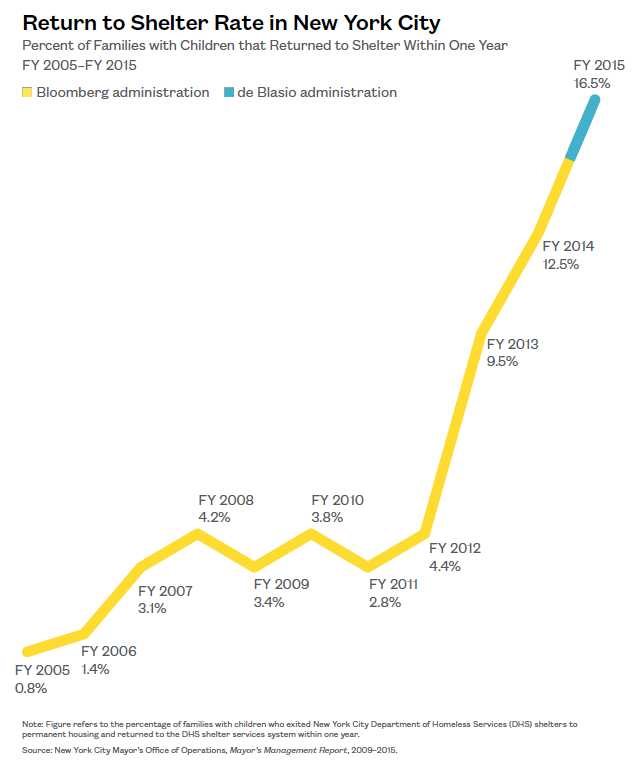
Even in the short term, more families are returning to shelter. In FY 2015, 17% of all families with children exiting shelter to permanent housing returned to shelter in less than one year. In FY 2005 the one-year return to shelter rate was less than 1%.
-
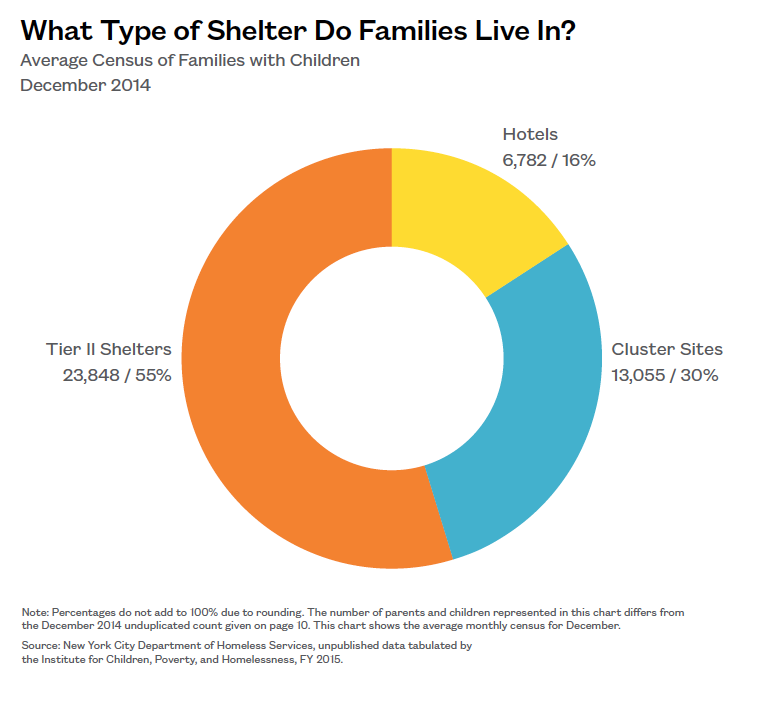
Close to half (46%) of all homeless parents and children lived in either a cluster site apartment or hotel in December 2014.
-
Domestic violence, not eviction, was the leading cause of shelter entry in New York City from July to December 2014.
-
One out of every five (18%) people living in a New York City shelter in December 2014 was a child age five or younger.
-
In under four years, the number of children aged 6–13 living in shelter grew by 85% (March 2011–December 2014).
xxx
Introduction
New York City faces an enormous challenge.
Despite a renewed focus on homelessness by the administration of Mayor Bill de Blasio, the number of families with children in need of emergency shelter continues to grow. In Fiscal Year (FY) 2015 more families with children entered shelter than at any point since FY 2010. The system is stretched beyond capacity by the over 12,000 families living in its Tier II facilities, hotels, and cluster sites nightly. These families include over 23,000 children whose lives and educations have been impacted by housing instability, many of whom are entering shelter for a second or third time, despite their young age.
Return to shelter is a critical factor contributing to the growth of family homelessness in New York City. Among families living in shelter at any point during the last half of 2014, 84% had entered shelter for the first time prior to 2014. This trend is reflective of the focus on moving families out of the shelter system as quickly as possible, with limited attention directed towards addressing the underlying reason that each family entered shelter in the first place.
Contributing to families cycling back through the shelter system is the fact that homelessness in New York City is not only experienced by families living in the shelter system, but also by those living doubled up with other families throughout the city’s many neighborhoods and communities. Over 84,000 children attending New York City Public Schools were homeless in SY 2013–14 and for every one child living in shelter, two children were homeless living in some other temporary setting. This means that families exiting shelter often find themselves returning to communities destabilized by poverty and homelessness—and that for every family with children that exits shelter, there are likely two more homeless families with children at risk for entering the system. Until return to shelter rates are reduced, and communities receive the resources and assistance they need to foster economic and social stability for children and their parents, it is unlikely that trends in family homelessness and shelter entry will be reversed.
In order to further the conversation about the dynamics that drive family homelessness in New York City’s communities, On the Map: The Dynamics of Family Homelessness in New York City provides a geographic analysis of demographic patterns and newly-available data on family homelessness. On the Map is an easy-to-use resource for policymakers, budget analysts, service providers, and community leaders and organizations.
1 New York City Mayor’s Office of Operations, Mayor’s Management Report, FY 2015.
2 New York City Department of Homeless Services, unpublished data tabulated by the Institute for Children, Poverty, and Homelessness, FY 2015.
3 The Institute for Children, Poverty, and Homelessness, The Atlas of Student Homelessness in New York City, August 2015.
xxx
User’s Guide
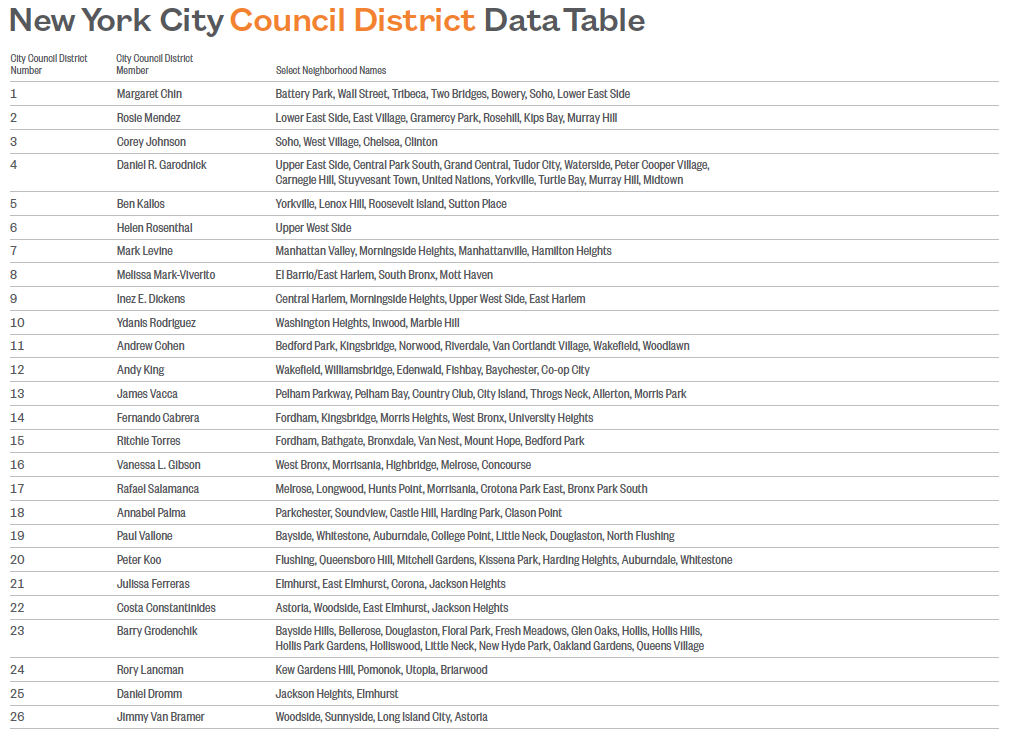
The goal of On the Map is to help users better understand the issue and context of family homelessness in their neighborhoods and in New York City. It can be used independently, or in conjunction with the 2014 On The Map: Atlas of Family Homelessness, which provides individual City Council district maps with shelter locations and Homebase sites.
- Why is this information needed? This information is assembled to help the user accomplish a variety of goals, including:
- To identify ways to improve family shelter services through providing a more detailed picture of the parents and children living in shelter.
- To learn more about why families from different communities apply for and enter shelter.
- To examine the educational, economic, and community characteristics in a City Council district that influence family homelessness.
- To use as a tool for planning and advocacy.
- To raise questions and determine what additional data are required to make effective public policy.
What information does On the Map provide? On the Map is divided into four sections.
Section 1 provides charts and tables that describe the extent of family homelessness in New York City: its growth over time, the type of shelter where families stay, the number of families in shelter who entered during a previous year, the rate at which families
are returning to shelter, the neighborhoods where families live before they enter shelter, and homeless- ness among students as a proxy for community-wide housing instability.
Section 2 looks at the reasons why families apply for and enter shelter citywide, and then explores differences by community district.
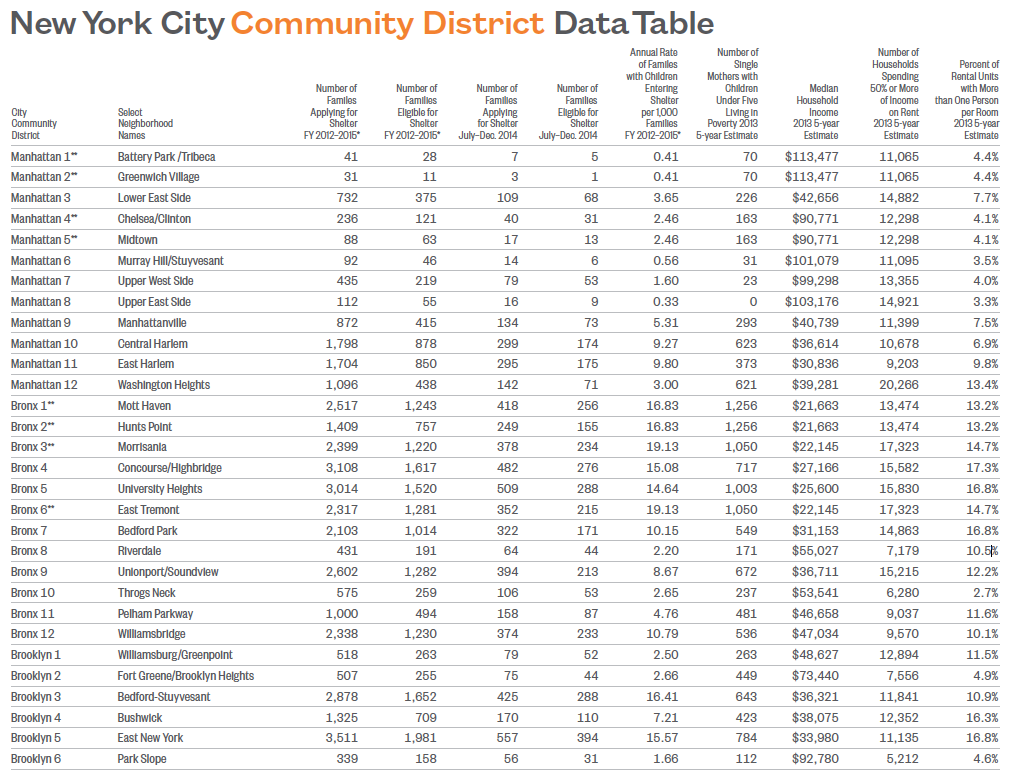
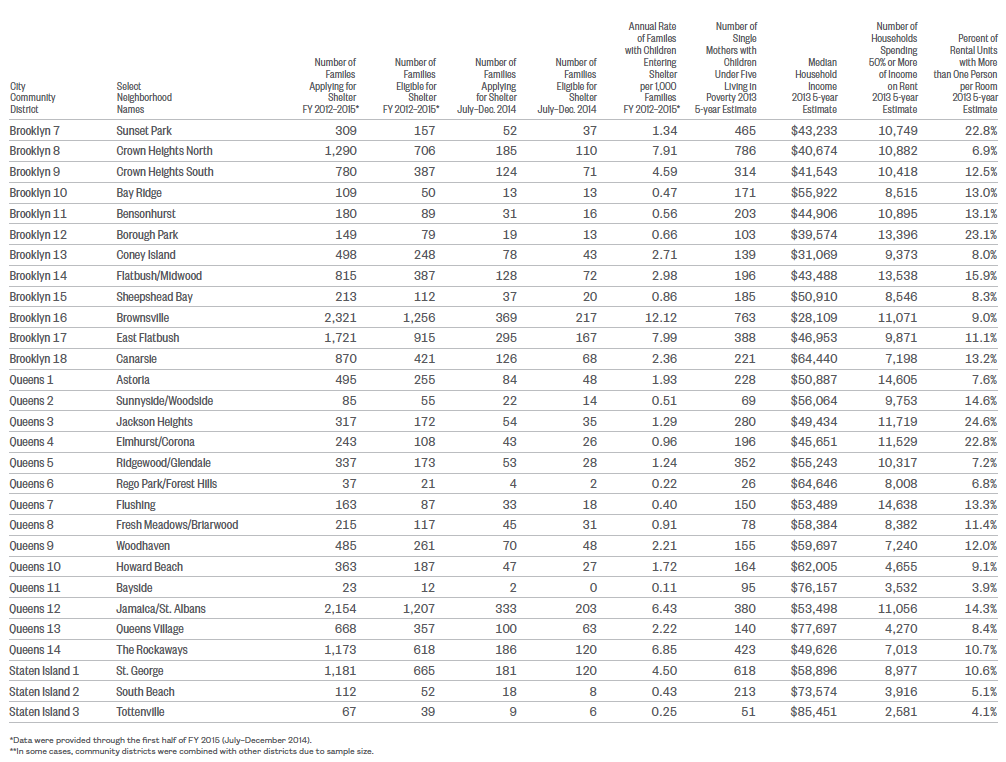
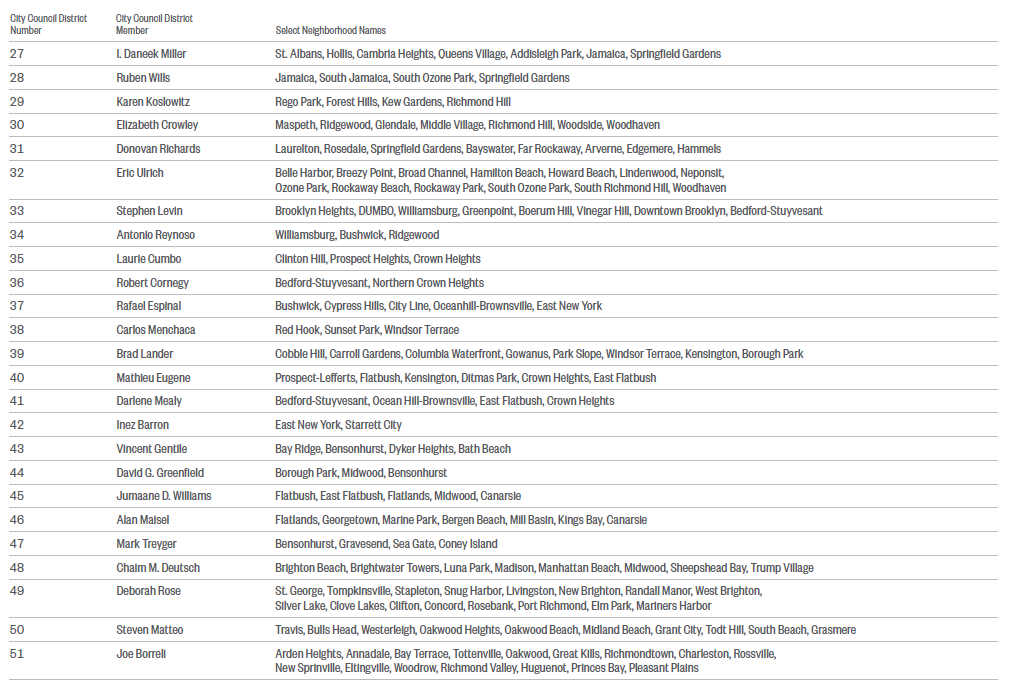
Section 3 is a series of New York City maps and tables that shows factors such as: children living in poverty, single mothers in poverty with children under five, severe rent burden, and overcrowding. The maps provide an opportunity to compare neighborhoods to one another as well as the city as a whole, and the tables provide context for where each community ranks in comparison to other districts. Wherever possible, maps and tables are shown at the City Council district level, however in cases where that is not possible, data are displayed by community district.
The Appendix provides a glossary defining the important terms used in On the Map, as well as overarching tables for City Council and community district data.
What are the limitations of the information provided here? Some of the challenges of exploring family homelessness in New York City are the many different ways in which data are collected. Information might be collected at the level of the city as a whole, the community district, or City Council district. The other barrier to a better understanding of the issue is the timeliness and availability of the data. Government officials and community leaders often make decisions affecting today’s homeless families based on dated information, though more current administrative data could be made publicly available.
xxx
Overview: Family Homelessness in New York City
Family homelessness continues to rise across New York City, adversely affecting the poorest children and often destabilizing entire neighborhoods. In just three and a half years, from July 2011 through December 2014, roughly 70,000 families with children applied for shelter, and over 36,000 entered the system. While families from every New York City community become homeless, those living in some areas of the city face a much greater risk. The information in this section provides an overview of the growth in the number of families with children living in New York City shelters, the communities where families lived prior to entering shelter, factors within the shelter system contributing to growth, the type of shelter where families are being housed while they are homeless, and how student homelessness can serve as a proxy for community-wide housing instability.
Key Findings
-
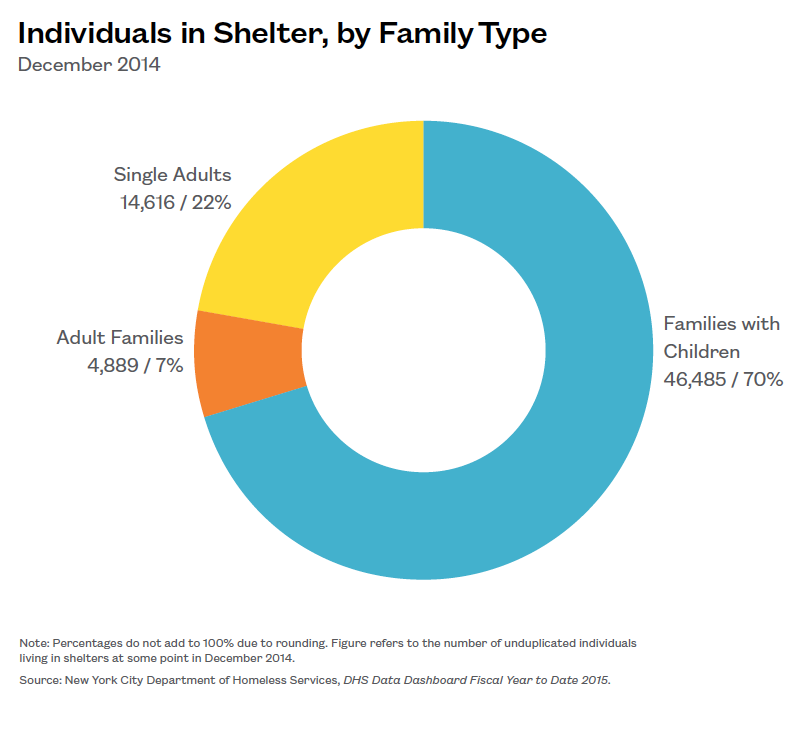
Over 70% of all homeless people living in the New York City shelter system in December of 2014 were parents and their children.
-
One out of every five (18%) homeless people in shelter was a child age five or under in December 2014.
-
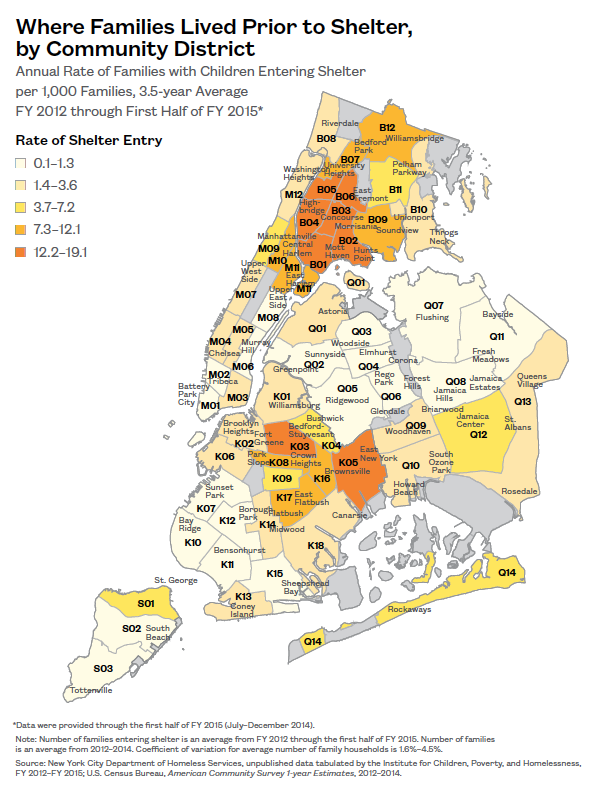
Five community districts accounted for one out of every five (22%) families entering shelter during the three and a half years from July 2011 through December 2014. These districts included East New York, Bedford-Stuyvesant, Concourse/Highbridge, University Heights, and Unionport/Soundview (K05, K03, B04, B05, and B09).
-
Close to half (46%) of homeless parents and children in shelter lived in either cluster site apartments or hotels in December 2014.
-
The majority of families with children in shelter between July 2014 and December 2014 entered shelter for the first time in 2005.
-
The percentage of families returning to shelter within one year of their exit to permanent housing increased sharply between FY 2005 and FY 2015 from less than 1% to 17%.
-
The full extent of family homelessness is not represented by the shelter census. Student homelessness serves as a proxy for the larger number of families in the city experiencing housing instability.
Family Homelessness Continues to Grow
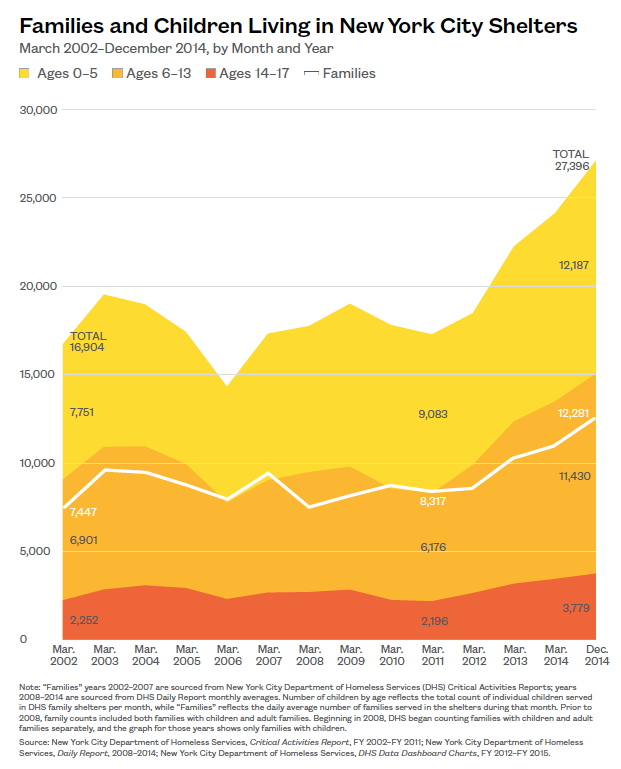
- From March 2002 to December 2014, the number of families with children living in New York City shelters increased by roughly 4,800, while the number of children increased by over twice that, or by close to 10,500 (62%).
- Young children age five and under continue to make up the largest age group of people living in City shelters. Over 12,000 children aged five or younger stayed in shelter in December 2014.
- Since March 2011, family shelters have seen a rapid increase in the number of children aged 6 through 13. This group increased by 85% in less than four years (March 2011–December 2014).
Both community factors and shelter policies contribute to the reasons why many families enter shelter more than once.
Parents and Children Are the Majority of Shelter Residents
-
In December 2014, one out of every five people living in a New York City homeless shelter was a child age five or under.1
-
Over two-thirds (70%) of all people living in shelter at the end of 2014 were parents and their children.
The large number and rapid growth of children living in shelter is a crisis; however, while in shelter the opportunity exists to address their developmental needs in order to promote their educational and emotional growth.
Communities Where Families Lived Prior to Entering Shelter
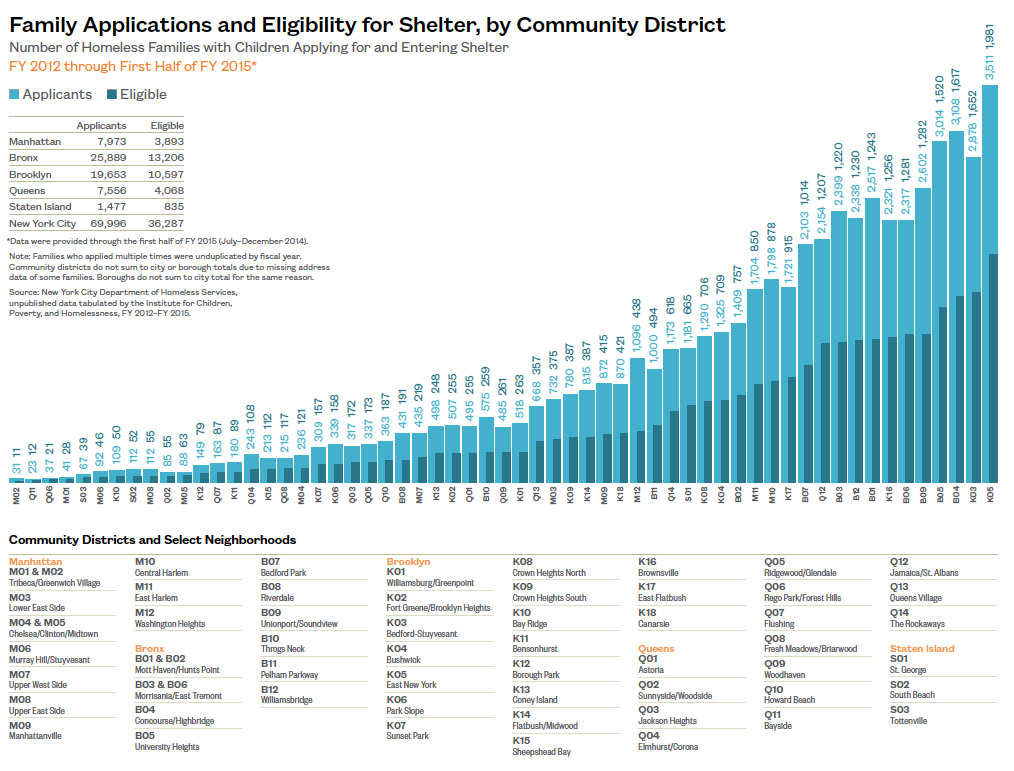
- In just three and a half years, from July 2011 through December 2014, over 36,000 families with children were found eligible for shelter; close to 70,000 applied.
- The citywide shelter eligibility rate was 52%. This rate varied from 35% in Greenwich Village (M02) to 72% in Midtown (M05) from July 2011–December 2014.
- The number of families with children entering shelter by community district during the three-and-a-half year period ranged from 11 in Greenwich Village (M02) to close to 2,000 in East New York (K05).
- 8,000 families from five community districts made up one out of every five (22%) families found eligible for shelter in New York City between July 2011 and December 2014. These communities were: East New York, Bedford-Stuyvesant, Concourse/Highbridge, University Heights, and Unionport/Soundview (K05, K03, B04, B05, and B09), which had an overall eligibility rate of 53%.
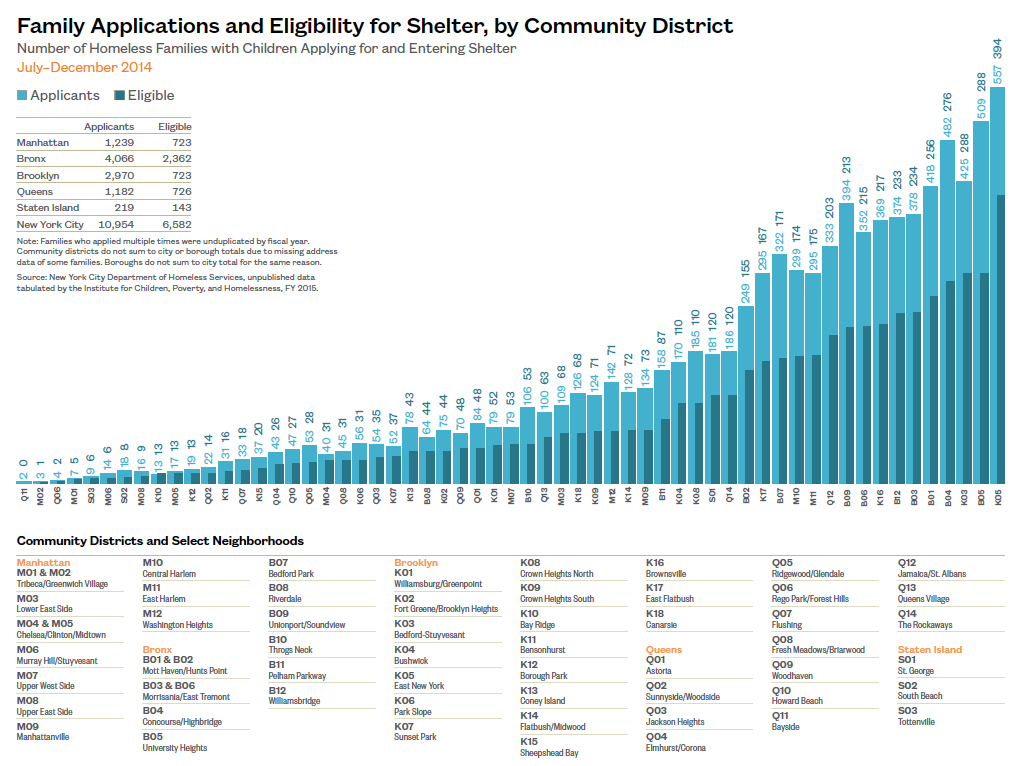
- Seven of the top ten community districts for shelter entry in the first half of FY 2015 were located in the Bronx (University Heights, Concourse/Highbridge, Mott Haven, Williamsbridge, Morrisania, Unionport/Soundview, and East Tremont, Districts B01, B03, B04, B05, B06, B09, and B12) and three in Brooklyn (East New York, Bedford-Stuyvesant, and Brownsville, Districts K03, K05, and K16).
- The ten neighborhoods listed above accounted for 2,614 families entering shelter in just six months representing 40% of family shelter entrants and 39% of applicants from July–December 2014.
Public policy that expects to effectively curtail shelter entry must be based on a comprehensive understanding of local dynamics.
Extent of Housing Instability and Homelessness in New York City Neighborhoods
-
Taking the total population of each community district into account and calculating the shelter entry rate per 1,000 families allows for a more accurate comparison across communities. It also highlights communities whose shelter entry numbers are lower but are significantly affected by homelessness.
-
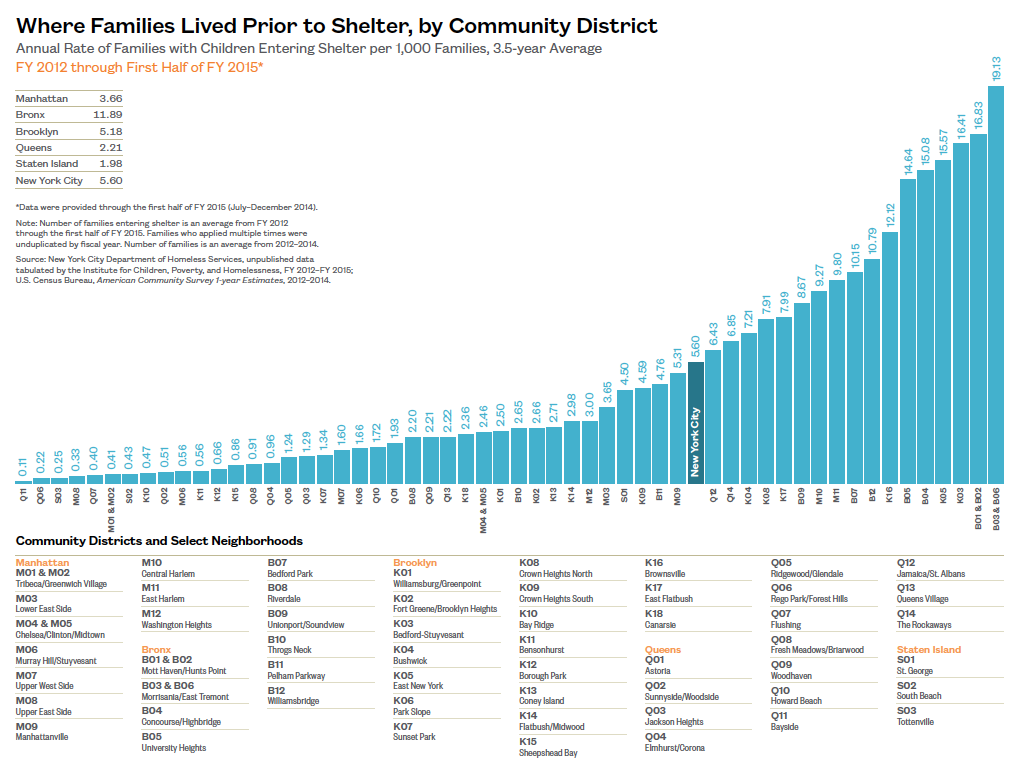
The average annual rate of family shelter entry in New York City was 5.6 per 1,000 families between FY 2012 and the first half of FY 2015. However, the rate varied greatly by community district ranging from a low of 0.1 per 1,000 families in Bayside, Queens (Q11), to a high of 19.1 per 1,000 families in the Morrisania/East Tremont area of the Bronx (B03/B06).
-
The five community districts with the highest rate of family shelter entry were: Morrisania/East Tremont, Mott Haven/ Hunts Point, and Concourse/Highbridge in the Bronx, and Bedford-Stuyvesant and East New York in Brooklyn (B01/B02, B03/B06, B04, K03, and K05).
First-Time Homeless Are the Smallest Proportion of Families in Shelter
- Over 17,000 families lived in shelter at some point between July 2014 and December 2014. Fewer than 3,000 (16%) entered shelter for the first time in the 2014 calendar year.
- The majority (56%) of families with children in shelter between July 2014 and December 2014 entered shelter for the first time during the Bloomberg administration.
- Growth in the shelter system is not due to new homeless families with children entering shelter, but to long-term stayers—families who have remained in shelter longer than one year or returned to shelter repeatedly. Eighty-four percent of families had entered shelter for the first time prior to the 2014 calendar year.
In order to reduce family homelessness, the reasons families return to shelter must be addressed. A policy focus on long-term family stability is key.
Rise in Rapid Return to Shelter
-
In FY 2015 the rate for families with children returning to shelter within one year was 17%. In FY 2005, the rate was less than 1%.
-
The most rapid increase in the one-year return to shelter rate took place between FY 2011 and FY 2015 when there was a 14 percentage-point increase in just four years.
The one-year return to shelter rate is an indicator of the level of housing instability families face after exiting shelter into permanent housing.
When a family returns to shelter—particularly within such a short period of time—it is it both extremely destabilizing for their children’s educational and social development and costly to the city taxpayer.
Cluster Sites and Hotels Continue to House Large Numbers of Homeless Families
- Over 43,500 parents and children lived in a family shelter in December 2014. Close to half (46%) lived in cluster site apartments and hotels.
- Cluster site apartments continue to represent a significant portion (30%) of total family shelter capacity.
- Cluster site apartments and hotels often lack the needed services for parents and their children that are available through contracted Tier II shelters. With close to half of all families with children living in these settings, thousands of families are not receiving the assistance they need to end their homelessness.
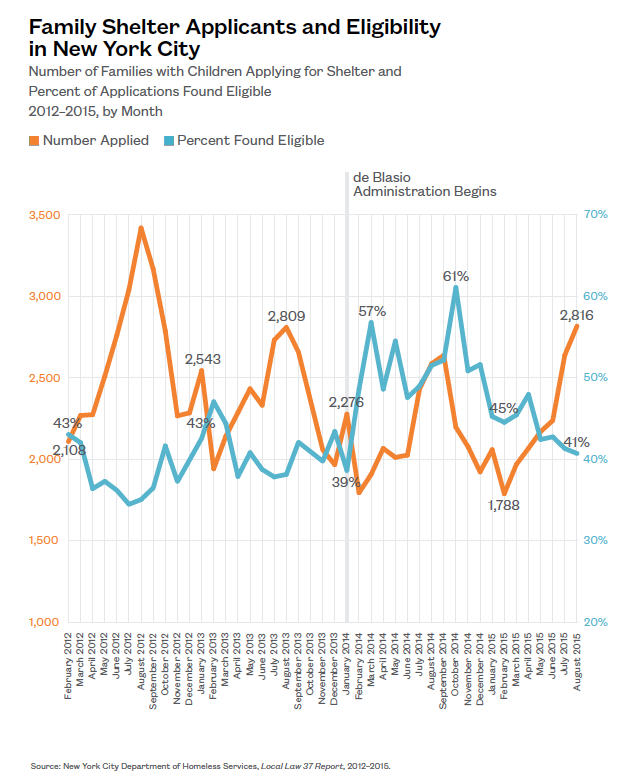
Tightening the Front Door: Shelter Application and Eligibility
- Within three months of de Blasio’s entry into office, the percentage of families found eligible for shelter rose from 39% to 57%. This brief rise in eligibility during de Blasio’s first year in office as mayor, however, dropped back down to an eligibility rate that was similar to that of the last two years of his predecessor, Mayor Bloomberg.
- As of August 2015, the monthly eligibility rate for family shelter was 41%. This is much lower than the six-month rate of 60% from July–December 2014 (page 25).
- In August 2015 over 2,800 families applied for shelter in New York City. This is the largest number of applicants since September 2012, when over 3,100 families applied.
The more than 20 percentage-point fluctuation in eligibility rate that is seen between January 2014 and August 2015 highlights how eligibility criteria can significantly affect the number of families entering shelter.
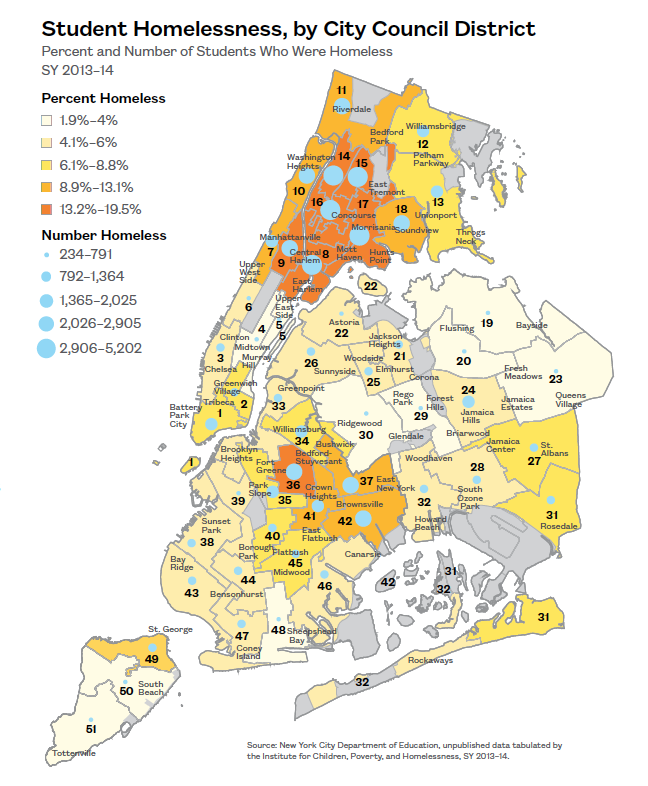
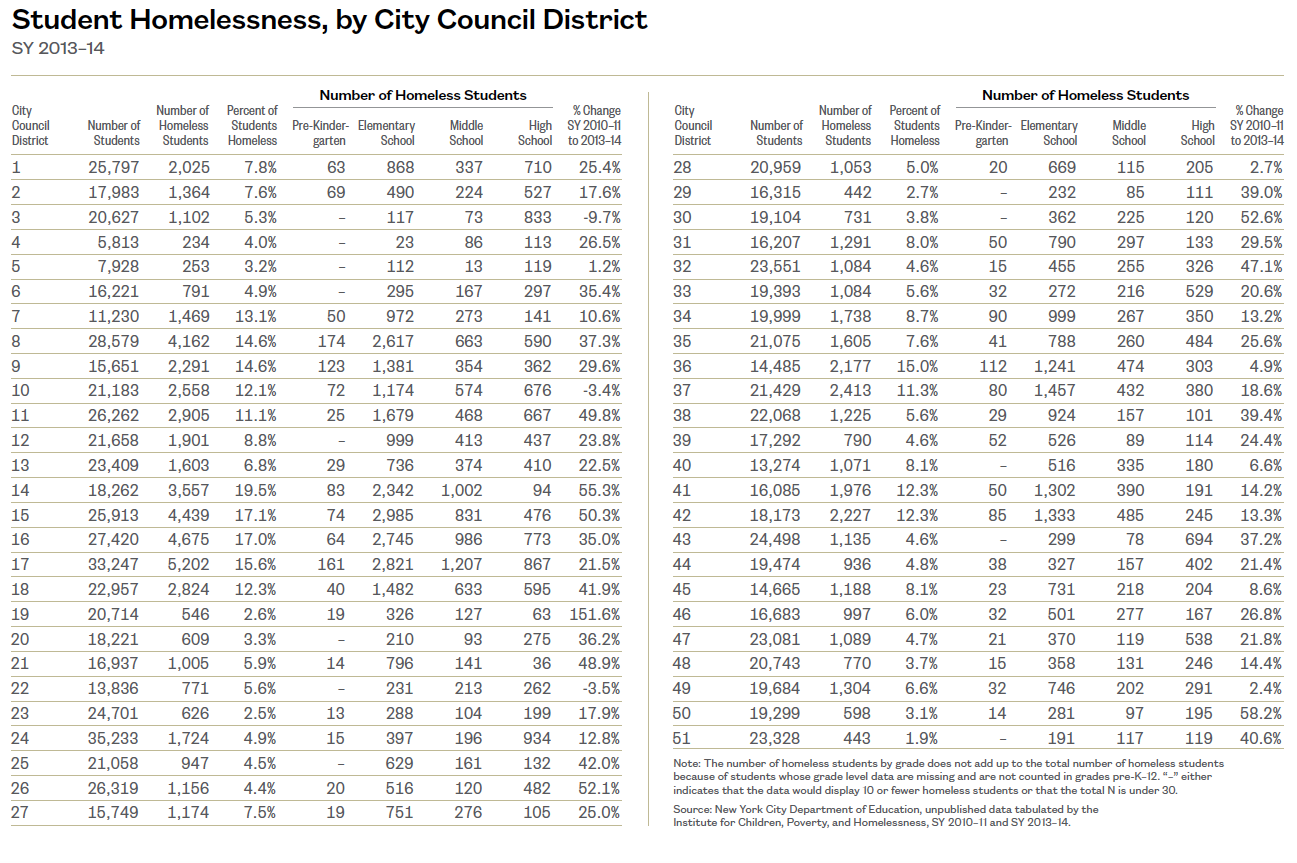
Student Data Reveal the Extent of Homelessness in City Council Districts
-
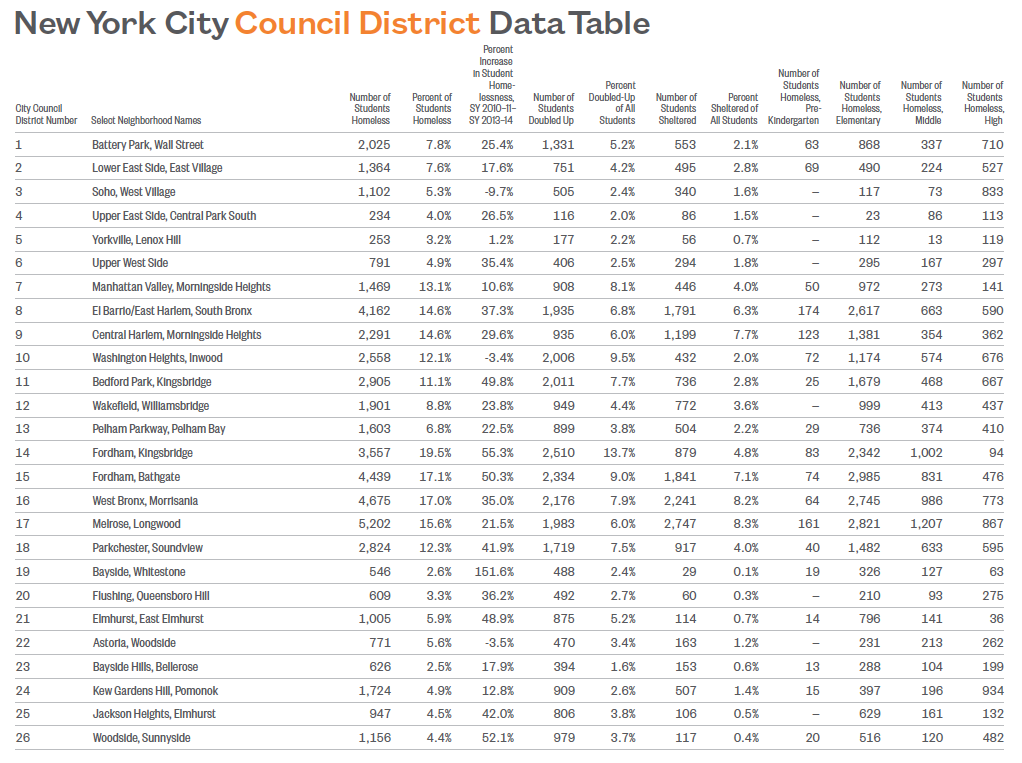
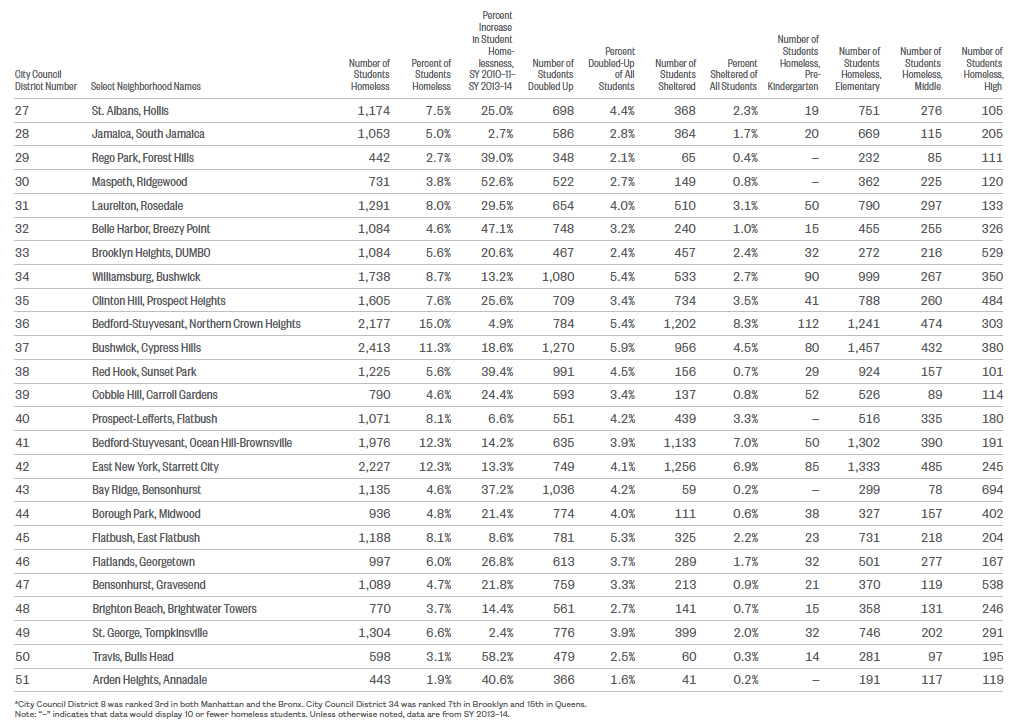
The proportion of students who were homeless in SY 2013–14 varied greatly by City Council district ranging from 2% in District 51 in the Arden Heights and Tottenville area of Staten Island to 20% in District 14 encompassing the Fordham and Kingsbridge area of the west Bronx. The average rate of student homelessness in New York City was 8% in SY 2013–14.
-
City Council District 17 in the Melrose and Hunts Point area of the Bronx had the largest number of homeless students attending school out of all 51 City Council districts. In SY 2013–14 over 5,000 homeless students were enrolled in schools in District 17 and 16% of all students attending school there were homeless.
-
The full extent of family homelessness is not represented by the shelter census. Student homelessness serves as a proxy for the larger number of families in the city experiencing housing instability.
xxx
Differences in the Path to Shelter by Community
Family homelessness exists in every community in New York City, but the reasons why a family becomes homeless can differ greatly from one family to another, and from one community to the next. In order to increase understanding of what drives families into shelter, this section looks at the primary reasons listed on both application and shelter entry documents at the City’s Prevention Assistance and Temporary Housing (PATH) center, the centralized point of entry into the family shelter system. It then examines differences in the reasons why families enter shelter by community district.
Key Findings
-
Over the six-month period from July–December 2014, 60% of families with children who applied for shelter were deemed eligible. This is higher than the typical monthly shelter eligibility rate during the same period, indicating that many families are forced to apply for shelter more than once before gaining entry.
-
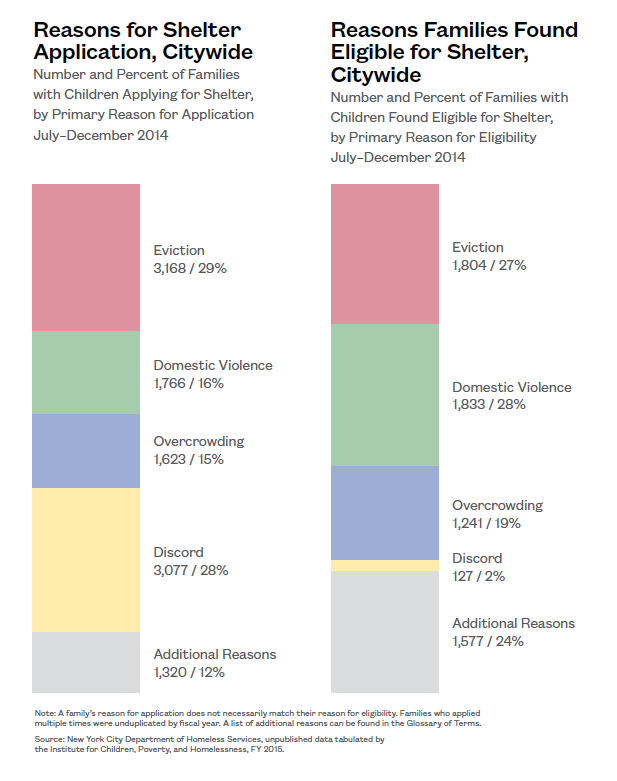
The most frequent reason that families were found eligible for shelter was domestic violence (28%). By community district, the leading cause for shelter entry was split fairly evenly between eviction (30 community districts) and domestic violence (27 community districts).
-
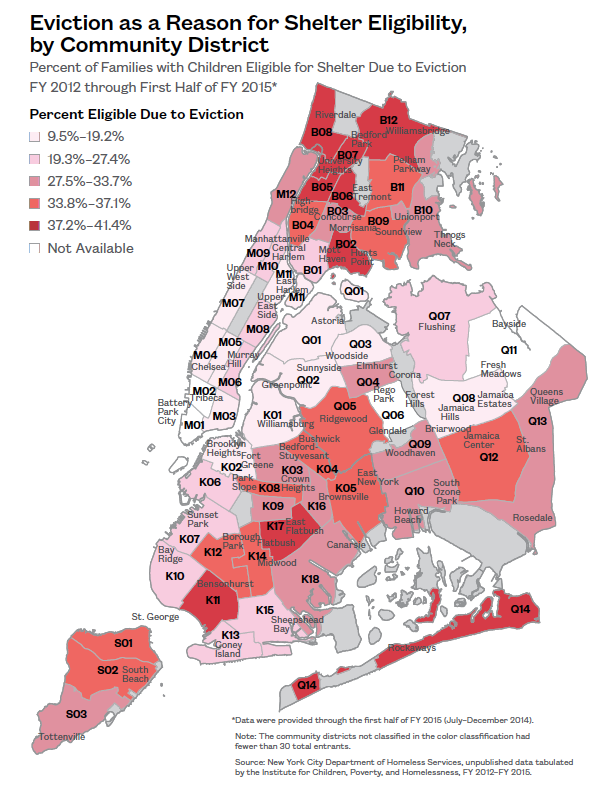
While eviction accounted for 27% of all families entering shelter citywide, its importance as a driving factor for family shelter entry varied from just 9.5% of entrants in Midtown in Manhattan (M05) to 41.4% in the Bedford Park area of the Bronx (B07).
Why Families Apply for and Are Deemed Eligible for Shelter
-
The top three reasons for families to apply for shelter during the first half of FY 2015 were: eviction (29%), discord (28%), and domestic violence (16%).
-
The three primary reasons that families were determined to be eligible for shelter were: domestic violence (28%), eviction (27%), and overcrowding (19%).
-
Over the six-month period from July–December 2014, 60% of families with children who applied for shelter were found eligible.
The six-month eligibility rate is the proportion of families who applied for shelter over a six-month period who were deemed eligible for shelter. That the six-month eligibility rate is higher than the typical monthly eligibility rate highlights how many families who are ultimately found eligible for shelter applied more than once.
xxx
Geographic Differences in Reason for Shelter Application and Entry
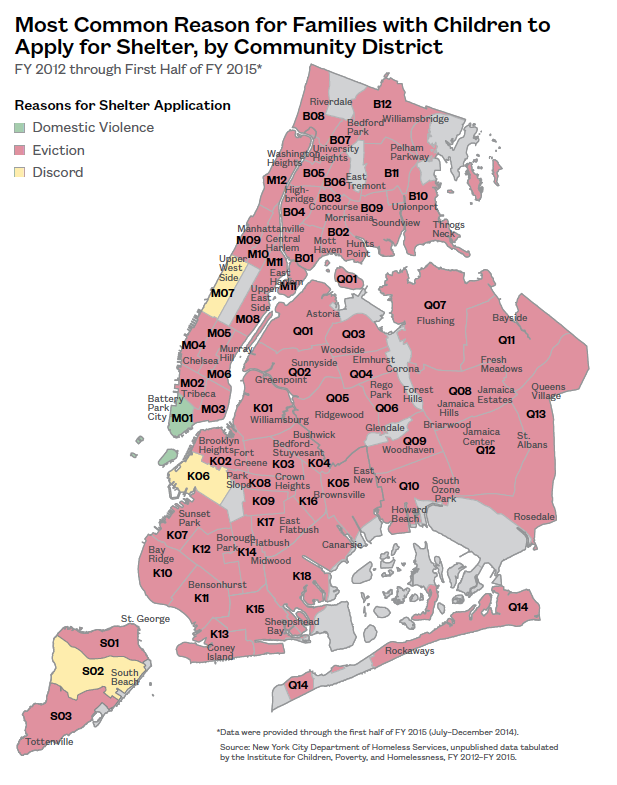
- In all but four of the 59 New York City community districts, eviction was the leading reason families listed for applying to shelter.
While New York City homeless prevention policy focuses on eviction, this issue may be only a symptom of the underlying problem. The factors driving homelessness are more complex.
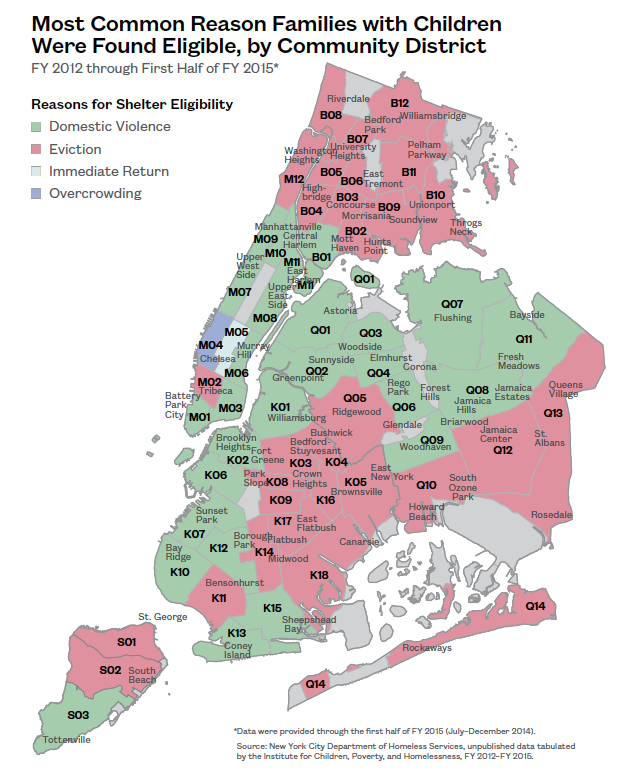
- The most frequent reason that families were found eligible to enter shelter by community district was split fairly evenly between eviction (30 community districts) and domestic violence (27 community districts).
Policies focused solely on housing are clearly limited. At the community level, domestic violence plays an equally important role as eviction in shelter entry.
Reason for Shelter Eligibility by Community Is Not the Same
-
Eviction accounted for 27% of all families found eligible for shelter citywide, but its significance varied greatly by community district. At the low end, only 9.5% of families entered shelter due to eviction in Midtown in Manhattan (M05). At the high end, 41.4% of families entered shelter due to eviction in the Bedford Park area of the Bronx (B07).
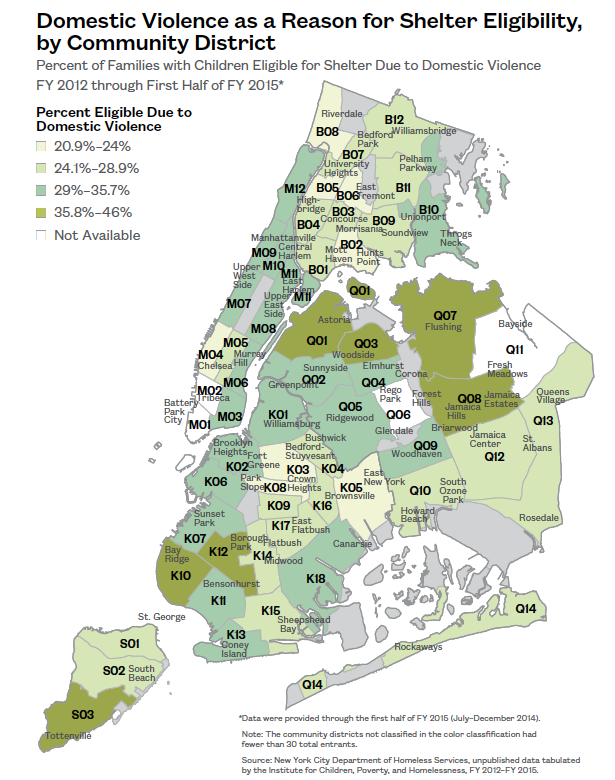
- While domestic violence was the reason that 28% of all families with children were found eligible for shelter by community district, the proportion of families varied ranging from 20.9% in the Riverdale area of the Bronx (B08) to 46% in the Flushing neighborhood of Queens (Q07).
The top three citywide reasons families were found eligible to enter shelter varied greatly by community district. Understanding the local factors driving family homelessness is key to reducing shelter entry.
-
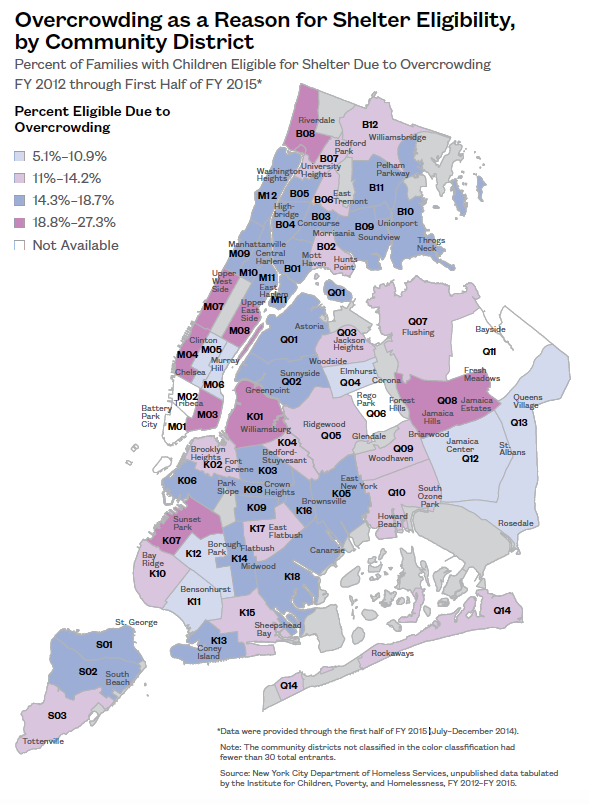
Citywide, overcrowding accounted for 19% of families with children who were found eligible to enter shelter. Overcrowding is defined as more than one occupant per room; however, in many cases much more severe overcrowding takes place.
-
By community district, the proportion of families entering shelter due to overcrowding ranged from 5.1% in Borough Park, Brooklyn (K12), to 27.3% on the Upper East Side of Manhattan (M08).
The adverse effects of overcrowding can be mitigated with public supports to address unemployment, hunger, and poor living conditions.
xxx
Factors Driving Housing Instability and Homelessness
Homelessness is the most extreme form of poverty, and those who are at the greatest risk of experiencing poverty are children. In New York City, one out of every four children (24%) lives in poverty—a fact that reflects the numerous economic and educational challenges faced in neighborhoods across the city.
While section 2 focuses on the community-level differences in the primary reason for shelter entry, section 3 uses 2013 U.S. Census Bureau data to explore the many underlying factors that contribute to a family’s risk for homelessness and lead to chronic housing instability, pressuring families into the shelter system repeatedly. It begins by looking at the geographic concentration of severe rent burden in the city and then moves on to explore other community-level indicators of risk such as unemployment and low-wage employment, low educational attainment, severe rent burden, and overcrowding.
Key Findings
-
The ten City Council districts with the largest number of children living in poverty were: Districts 8, 14, 15, 16, 17, and 18, encompassing East Harlem and all of the south and central Bronx, and Districts 36, 37, 38, and 42, including areas of Bushwick, Brownsville, Sunset Park, Red Hook, Bedford-Stuyvesant, and East New York. Over 70,000 children lived in poverty in these districts combined.
-
Mott Haven/Hunts Point, Morrisania/ East Tremont, University Heights, Concourse/Highbridge, East New York, Brownsville, and Bedford-Stuyvesant (B01/B02, B03/B06, B04, B05, K03, K05, and K16) ranked in the top ten community districts for both shelter entry rate and the number of single mothers in poverty with children under the age of five.
-
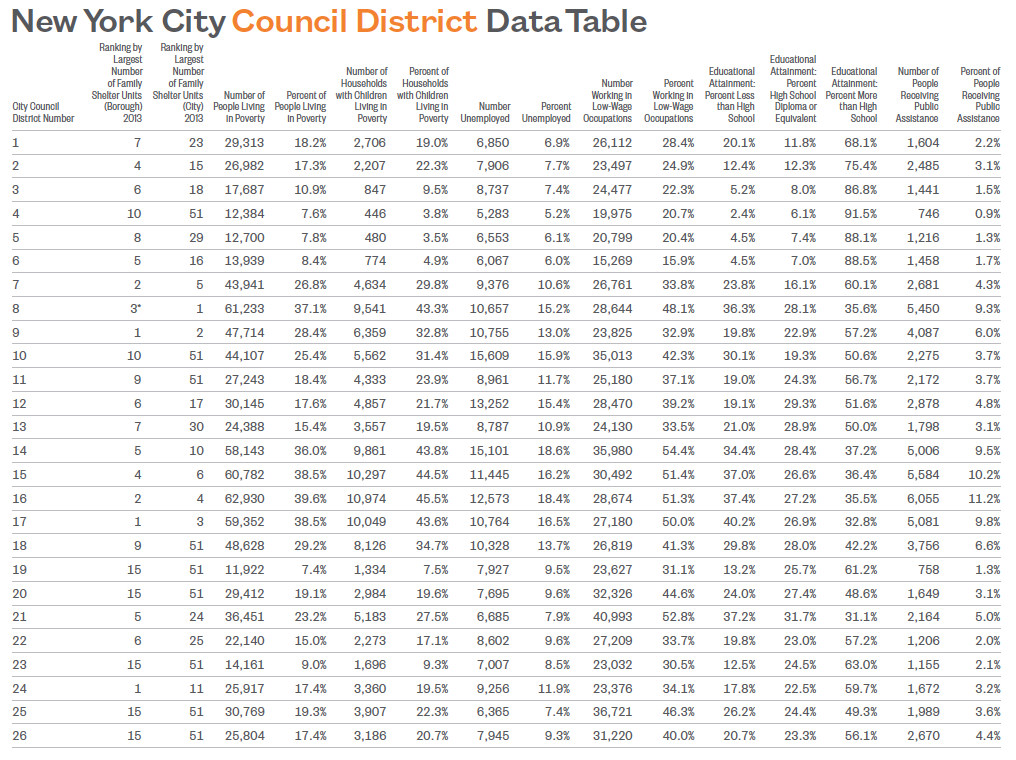
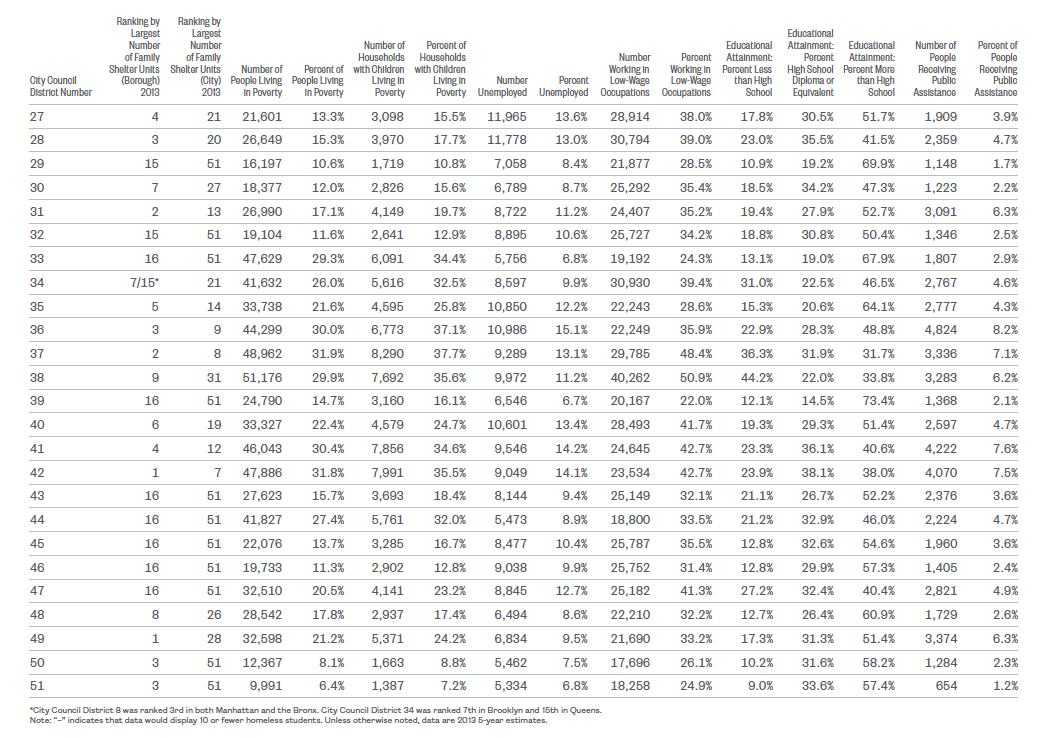
In roughly two-thirds of all City Council districts, the most common level of educational attainment was a high school diploma or less.
-
In 39 out of 51 City Council districts, 30% or more of residents were working in a low-wage occupation earning a median income of less than $28,000 a year.
-
In the seven poorest community districts, families earning the median income while severely rent burdened, paying 50% or more of their income in rent, were left with only $1,250 each month to pay for all other expenses including food, transportation, child care, healthcare, and clothing. These community districts included: Mott Haven/Hunts Point, Concourse/ Highbridge, Morrisania/East Tremont, and University Heights in the south Bronx, and Brownsville in Brooklyn (B01/B02, B03/B06, B04, B05, and K16).
While the factors that drive homelessness are present in every community, a small number of communities in the Bronx and Brooklyn are predominantly affected. Solutions should be locally tailored.
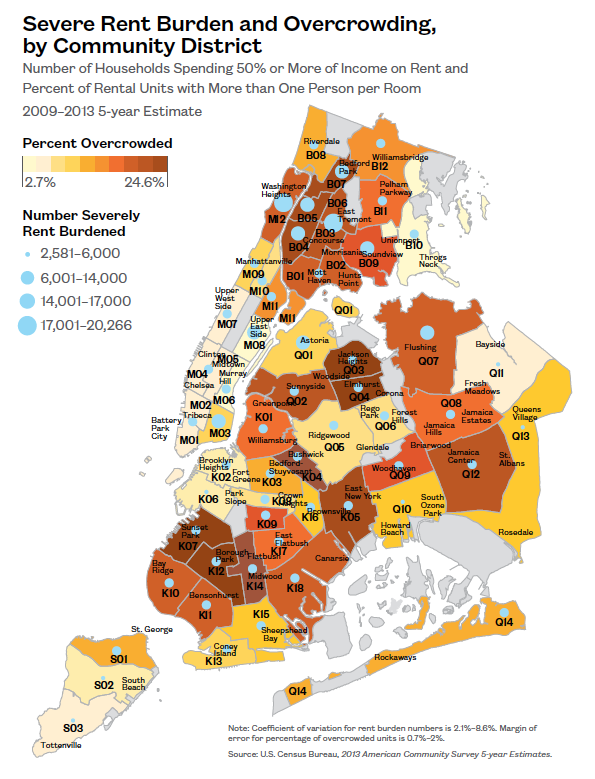
Severe Rent Burden and Income in New York City Community Districts
-
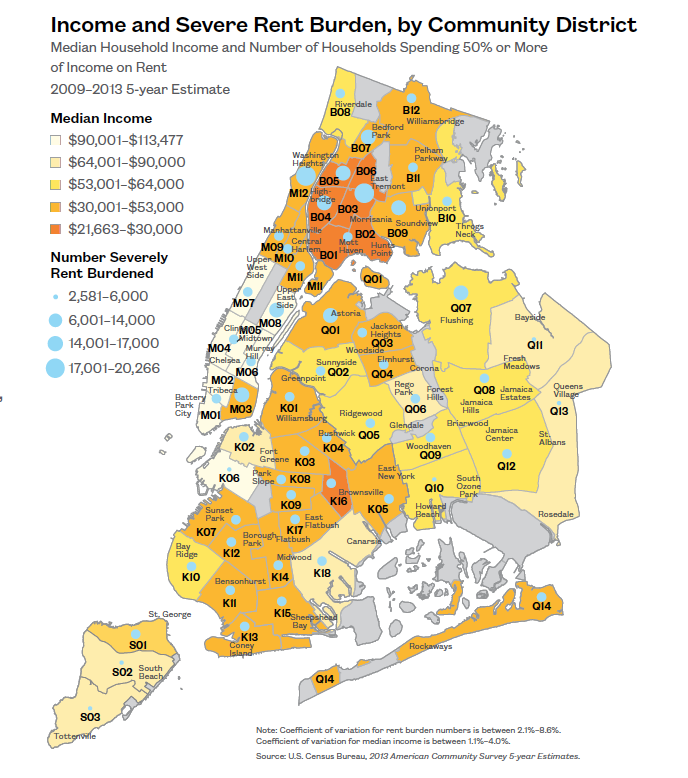
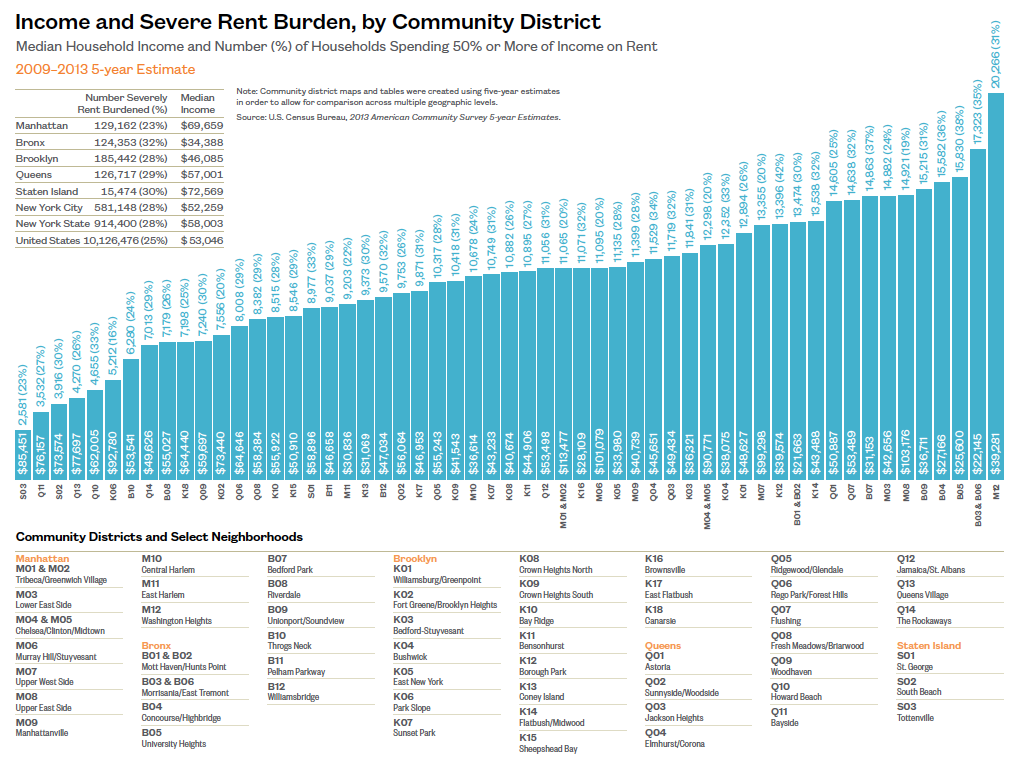
Across New York City, the median income was $52,259. Among renters, 28% were severely rent burdened, paying 50% of their income or more in rent.
- In the seven community districts with the lowest median incomes, including Mott Haven/Hunts Point, Concourse/ Highbridge, Morrisania/East Tremont, and University Heights in the Bronx and Brownsville in Brooklyn (B01/B02, B03/B06, B04, B05, and K16), families who were earning the median income and severely rent burdened only had $1,250 per month left over to pay for all other expenses including food, healthcare, transportation, child care, and clothing.
Severe rent burden places families in some communities at a greater risk for homelessness than others because the amount of money a family has to live on each month once the rent is paid varies widely due to income.
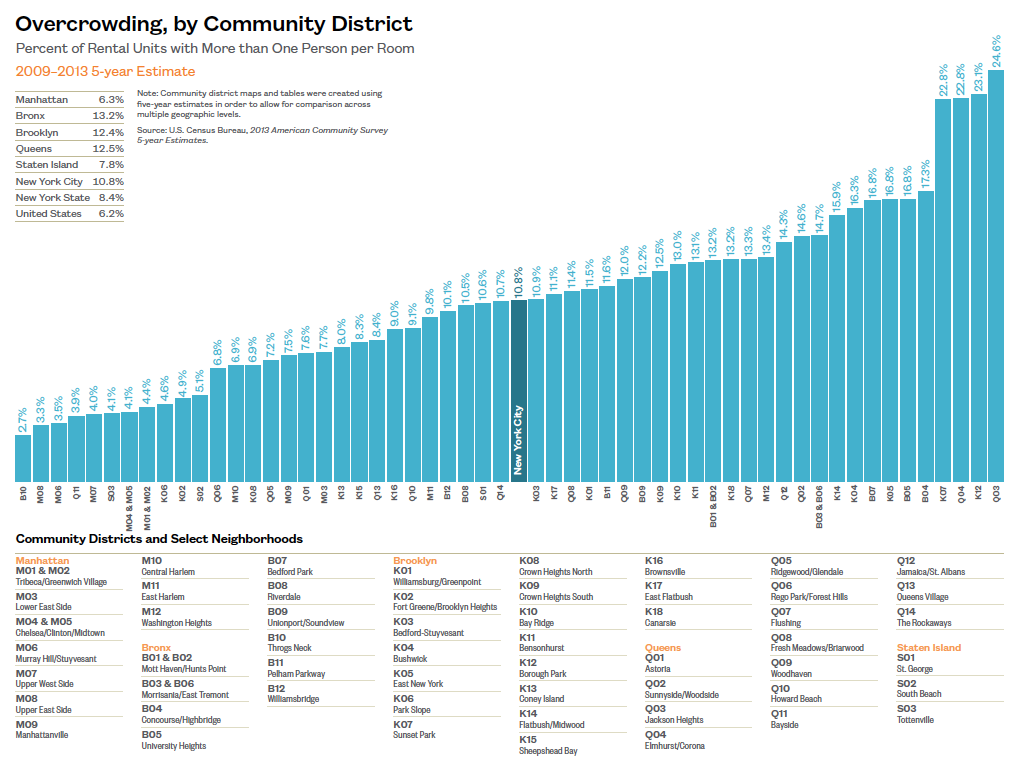
Overcrowding in New York City Community Districts
-
More than one occupant per living space constitutes overcrowding (not including bathrooms or most kitchens). However, in many cases much more severe overcrowding takes place. Across New York City the average rate of overcrowding was 11%. By community district, overcrowding ranged from a low of 3% in the Throgs Neck neighborhood of the Bronx (B10) to a high of 25% in Jackson Heights, Queens (Q03).
-
Four community districts had overcrowding rates that were 22% or higher. These Districts included Sunset Park and Borough Park in Brooklyn (K07 and K12), and Elmhurst/Corona and Jackson Heights in Queens (Q03 and Q04).
Overcrowding could indicate that families are living doubled up, which is the most frequently reported situation for families with children prior to entering shelter.1
1 National Alliance to End Homelessness, State of Homelessness 2012— Chapter Three: Demographics of Homelessness, January 17, 2012.
xxx
xxx
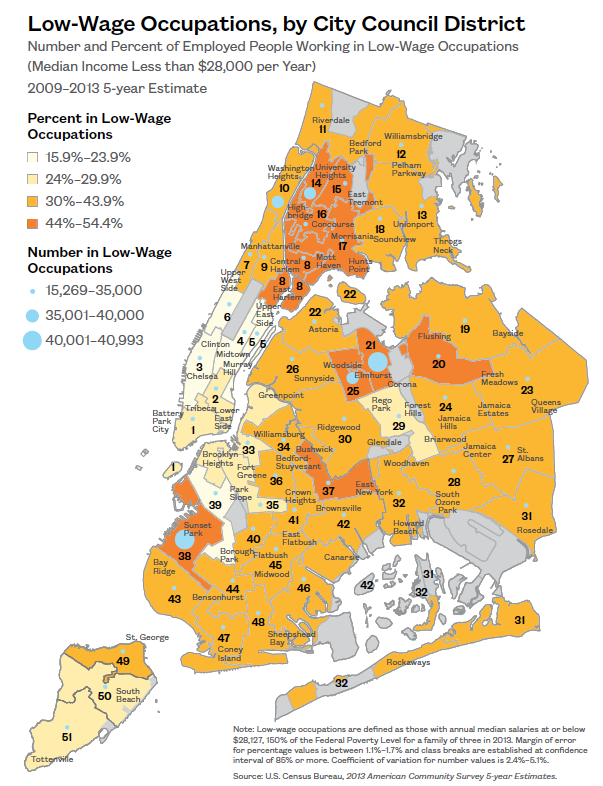
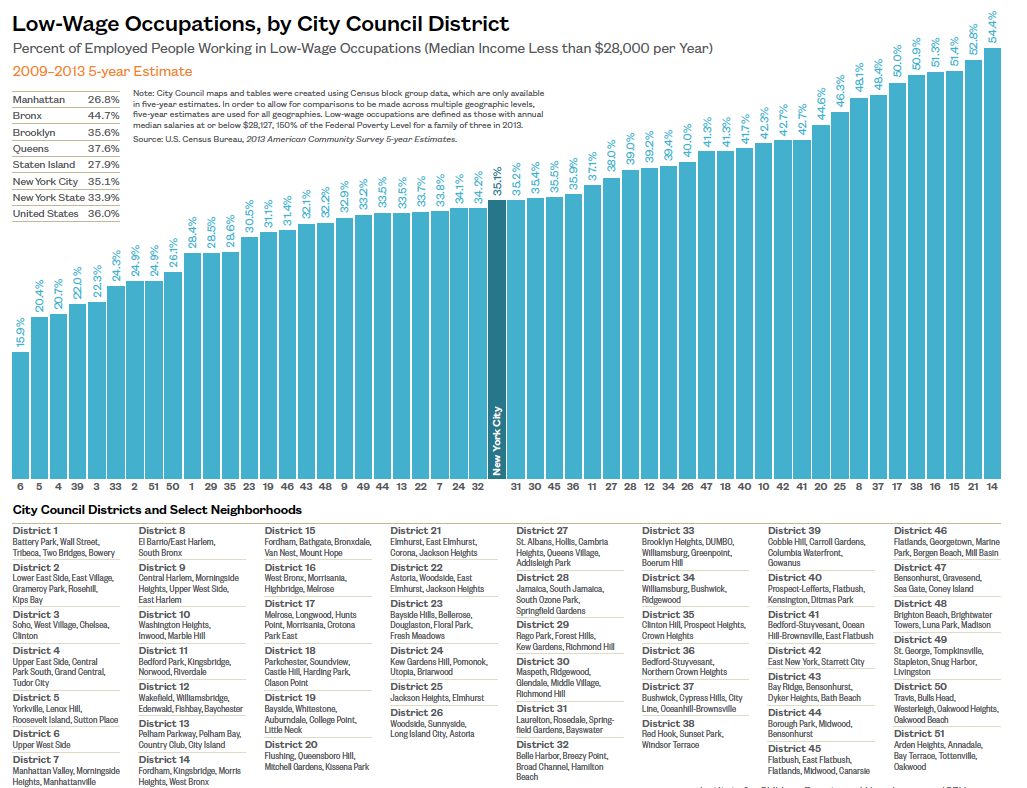
Low-Wage Employment in New York City Council Districts
-
Over one-third of employed New Yorkers were in low-wage occupations earning below $28,000 per year. This ranged from 16% on the Upper West Side of Manhattan (District 6) to 54% in the Fordham/Morris Heights area of the Bronx (District 14).
-
In 39 out of 51 City Council districts, 30% or more of residents were working in low-wage occupations.
-
In the top ten City Council districts, between 44% and 54% of all people working were employed in low-wage occupations. These City Council districts included East Harlem; all of the south and central West Bronx; Flushing, Corona, Jackson Heights, and Elmhurst in Queens; and Sunset Park, Bushwick, and Red Hook in Brooklyn (Districts 8, 14, 15, 16, 17, 20, 21, 25, 37, and 38).
Low-wage employment is a significant contributor to housing instability and homelessness, particularly in areas such as the south and central West Bronx that also struggle with high rates of unemployment.
xxx
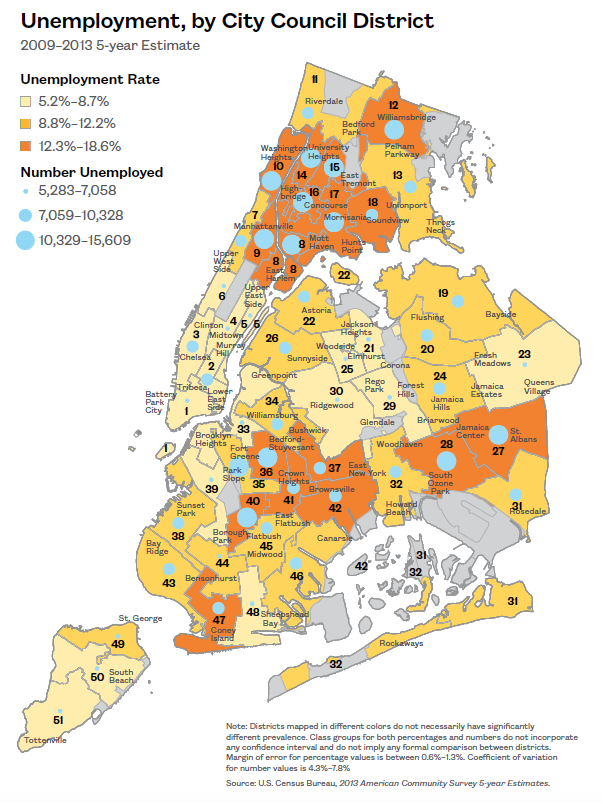
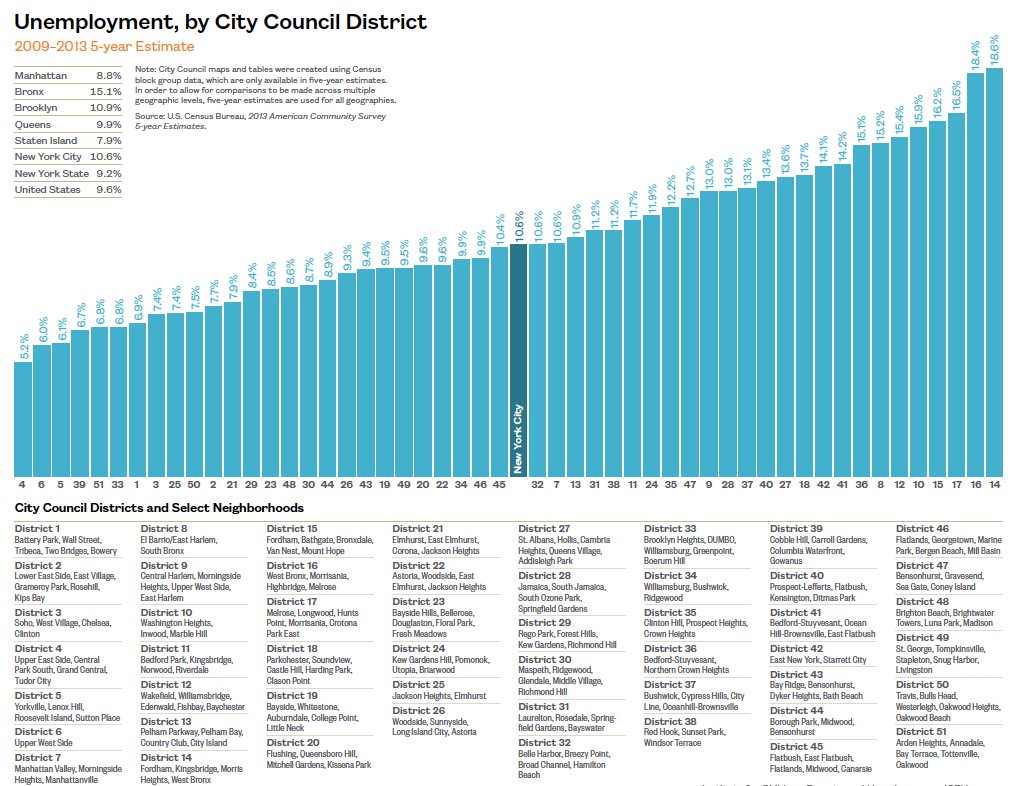
Unemployment in New York City Council Districts
-
The unemployment rate ranged by City Council district from 5% on the Upper East Side of Manhattan (District 4) to 19% in the Fordham/Morris Heights area of the Bronx (District 14) in 2013. During the same period the rate was 11% citywide.
-
The top five City Council districts for highest unemployment were Districts 14, 15, 16, and 17 in the south and central West Bronx, and District 10 in north Manhattan.
-
City Council Districts 14, 15, 16, and 17 also were among the top five districts with the greatest number of homeless students, a proxy for those living doubled up in unstable housing situations.
Shelters in districts with high unemployment could serve as locations for City-funded employment programs serving both the shelter population and the surrounding community.
xxx
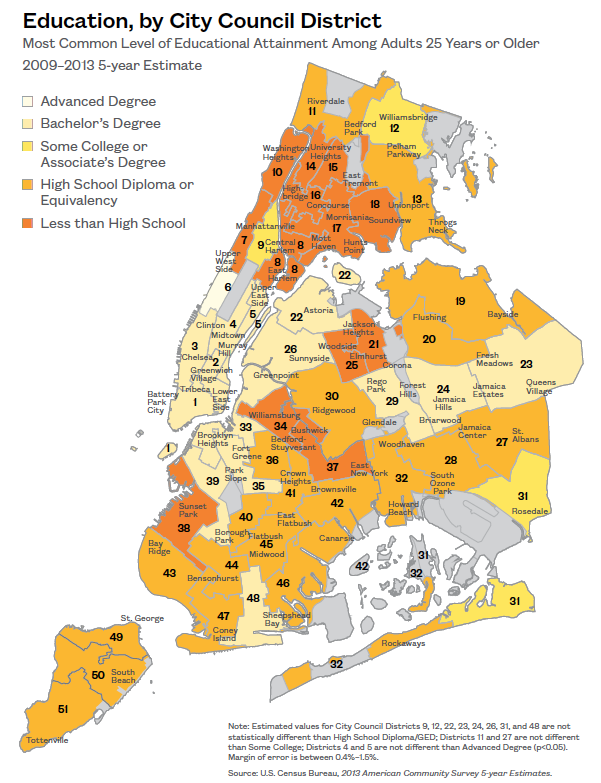
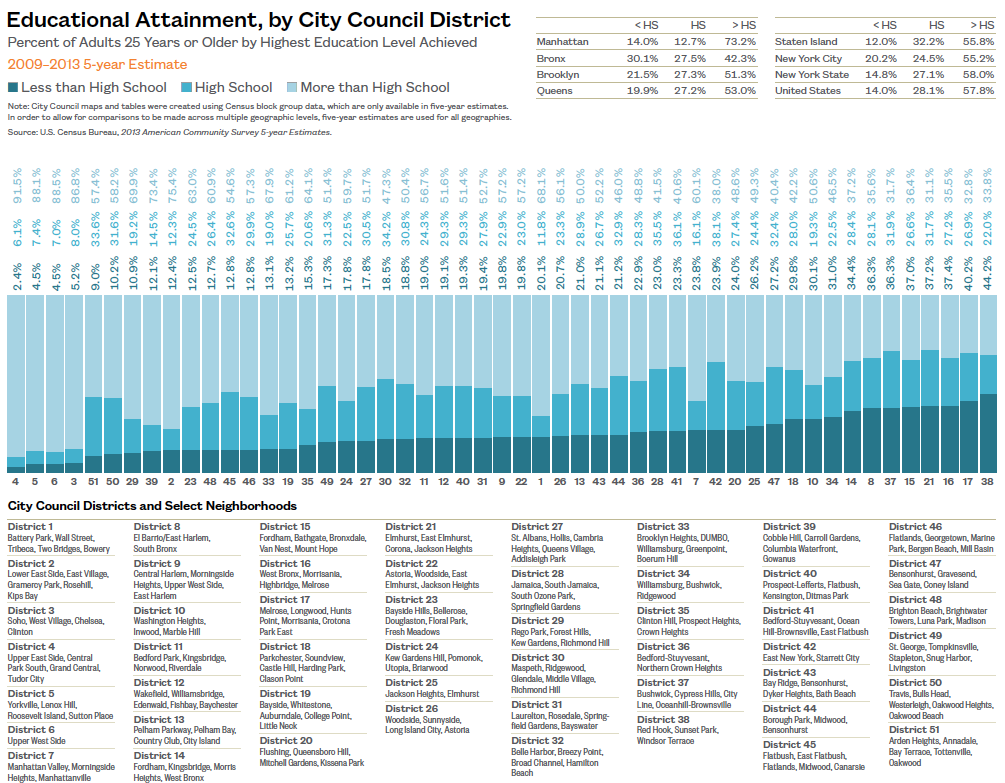
Educational Attainment in New York City Council Districts
- In New York City 45% of people 25 years and older had attained only their high school diploma or less. Specifically, one in five (20%) residents had not finished high school.
- For roughly two-thirds of City Council districts, the most common level of education was a high school diploma or less. In 13 out of 51 City Council districts, the most common level of education was less than a high school diploma.
- In nine out of thirteen City Council districts whose most common level of educational attainment was less than high school, there was also higher than average (8%) student homelessness. These included northern Manhattan, East Harlem, all of the central and south Bronx, and the Bushwick/Brownsville area of Brooklyn (Districts 7, 8, 10, 14, 15, 16, 17, 18, and 37).
Adult basic education along with job training must be included in any strategy aiming to prevent homelessness or reduce the return to shelter rate.
xxx
xxx
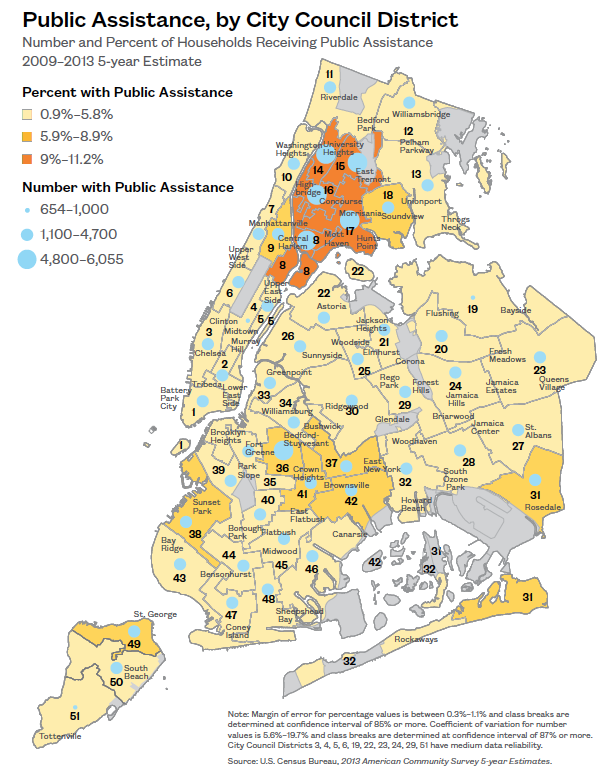
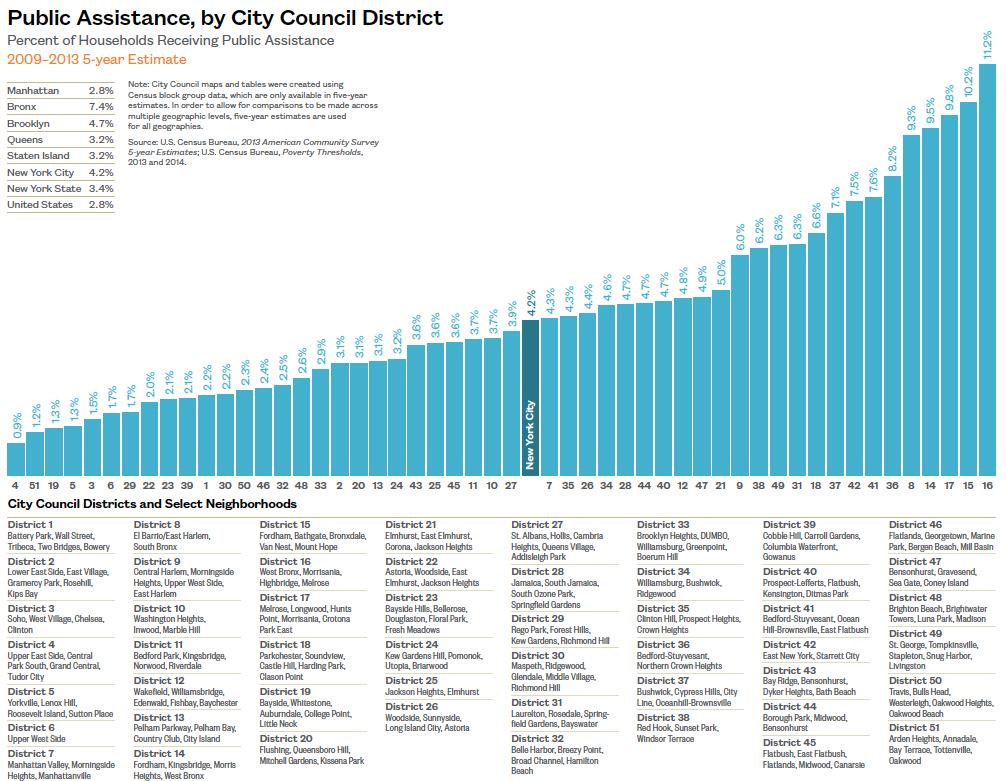
Households Receiving Public Assistance
-
Roughly 129,000 (4%) households in New York City received public assistance in 2013. These families were most heavily concentrated in the south and central Bronx, central Brooklyn, and Harlem (Districts 8, 14, 15, 16, 17, and 36), areas that all struggle with high rates of family shelter entry.
Public assistance is an important safety net for struggling families but it can add to their housing instability if they unexpectedly lose benefits. In 2013, 23% of children and adults applying for shelter were part of cases that had been sanctioned or closed due to alleged non-compliance within the prior 12 months.1
1 New York City Human Resources Administration/Department of Social Services, Testimony of Steven Banks, Commissioner of the New York City Human Resources Administration, At the New York State Senate—Task Force on Social Service Delivery in New York City, October 7, 2015.
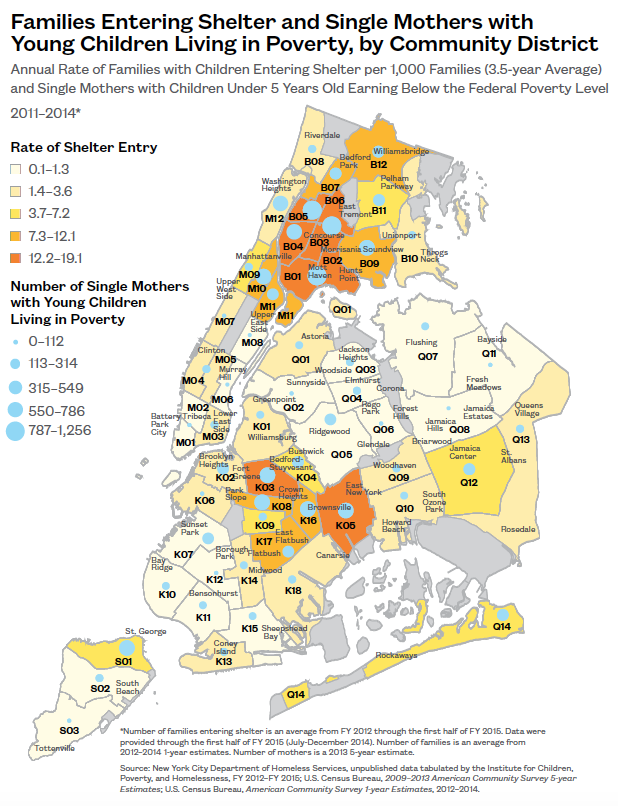
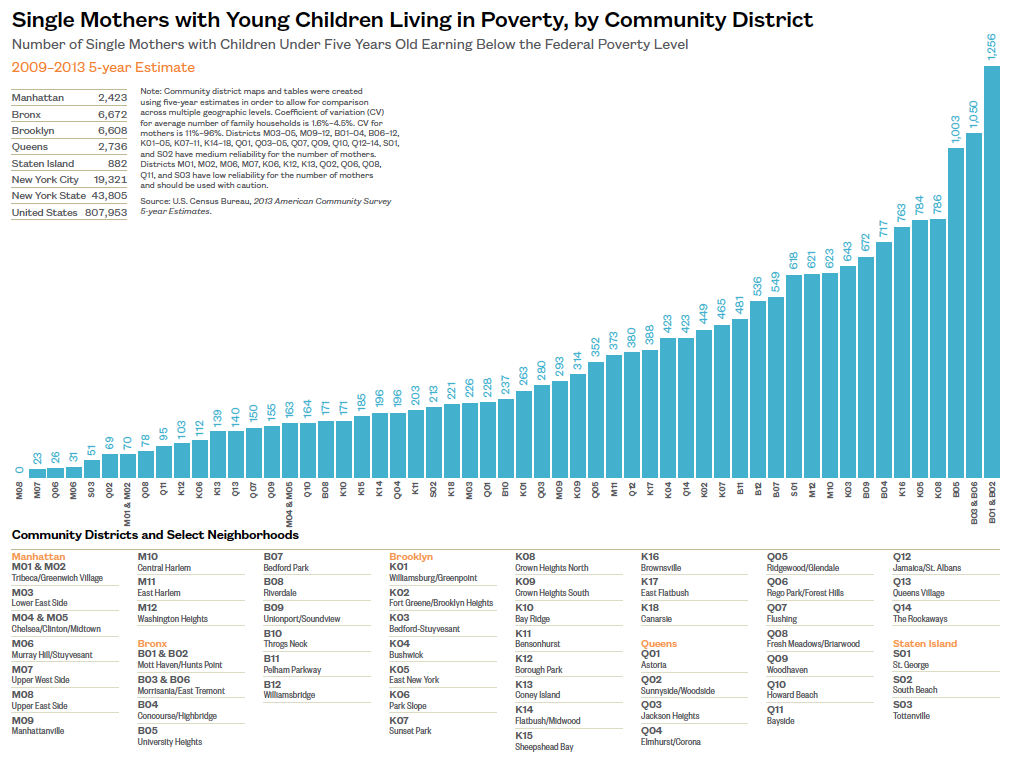
Single Mothers with Young Children Living in Poverty
- Over 19,000 single mothers with children under five live in poverty in New York City, but by community district, the number ranged from zero on the Upper East Side of Manhattan (M08) to over 1,200 in Mott Haven/Hunts Point (B01/B02).
- Seven out of the ten community districts with the largest number of single mothers with children under five living in poverty were also among the top ten community districts for the rate of family shelter entry. These districts included all of the south and central West Bronx, East New York, Brownsville, and Bedford-Stuyvesant (B01/B02, B03/B06, B04, B05, K03, K05, and K16).
Single mothers with children under five living in poverty experience high rates of severe rent burden, often inflexible work schedules in low-wage occupations, and a lack of quality affordable child care. Addressing these issues is key to reducing family homelessness.
xxx
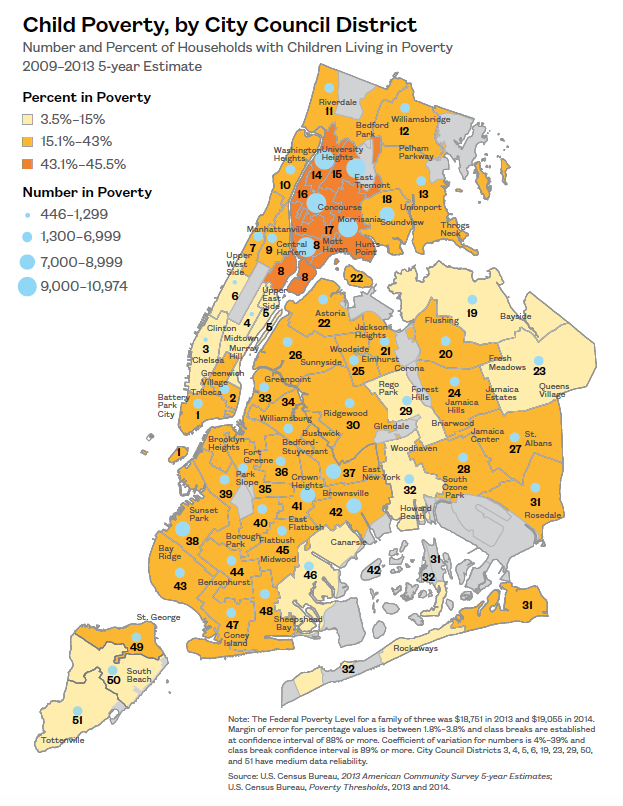
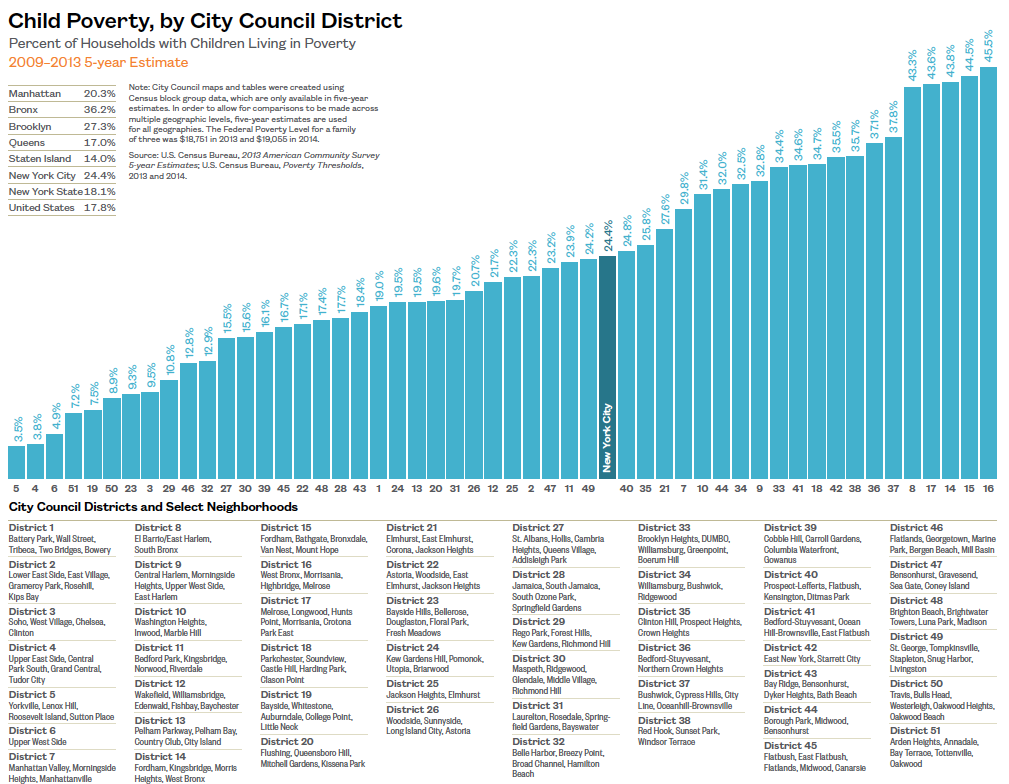
Children Living in Poverty
- The rate of children living in poverty ranged by City Council district from 4% in the Lenox Hill/Roosevelt Island area of Manhattan (District 5) to 46% in the West Bronx/Highbridge area of the Bronx (District 16). Citywide, the average was 24%.
- The top ten City Council districts with the largest number of children living in poverty were: districts encompassing East Harlem and all of the south and central Bronx (Districts 8, 14, 15, 16, 17, and 18), and districts including areas of Bushwick, Brownsville, Sunset Park, Red Hook, Bedford-Stuyvesant, and East New York (Districts 37, 38, 41, and 42). Each of these City Council districts had over 7,000 children living in poverty.
- Districts 8, 14, 16, 37, and 42 all include neighborhoods with high rates of family shelter entry.
It is important to ensure access to services in districts with both high levels of childhood poverty and shelter entry.
xxx
xxx
xxx
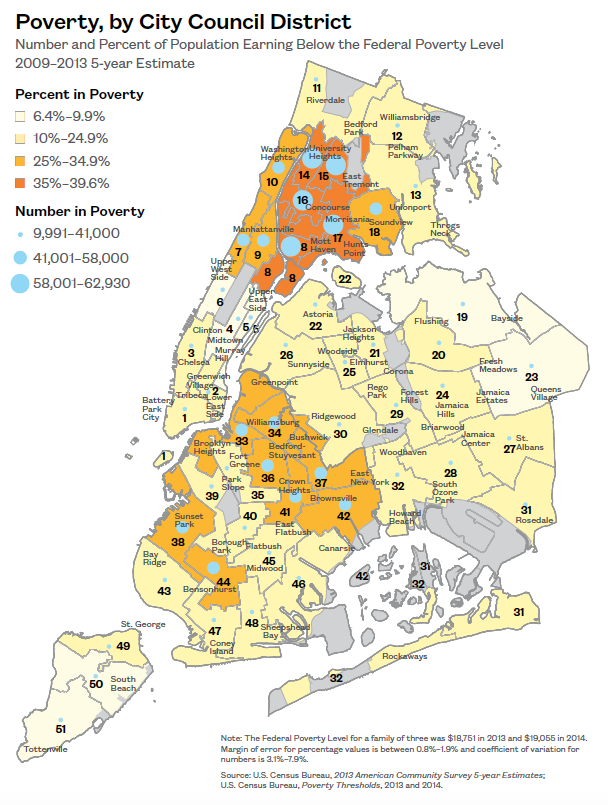
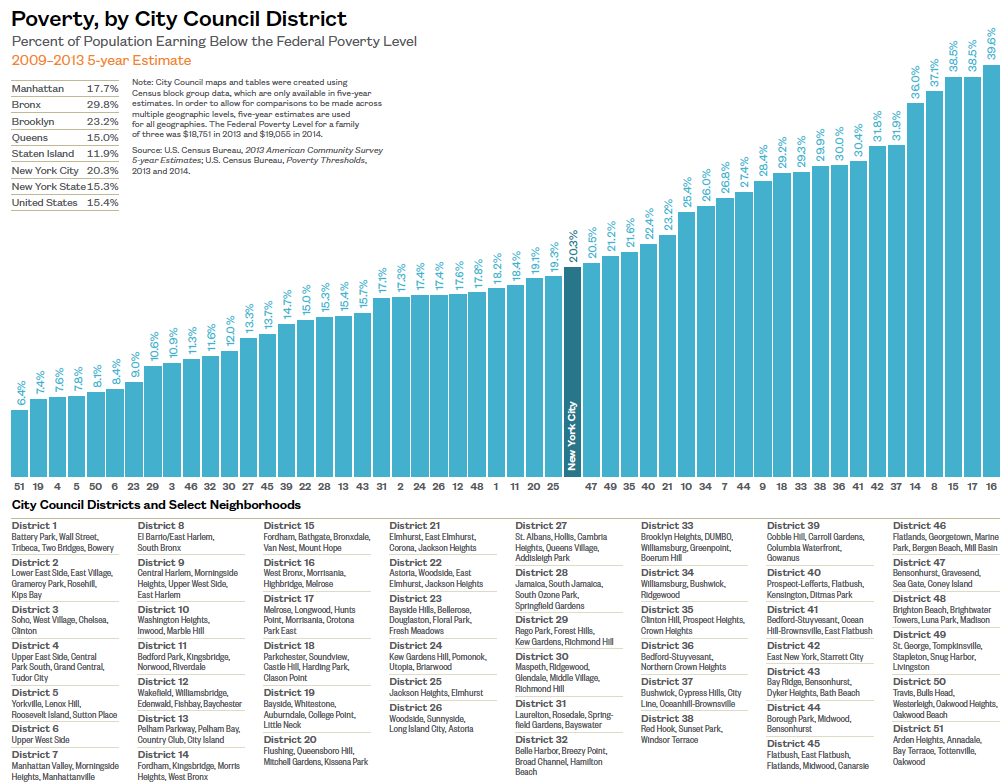
Poverty in New York City Council Districts
- The percentage of residents who lived below the Federal Poverty Level ranged from a low of 6% in Tottenville (District 51) to a high of 40% in Morrisania (District 17); citywide, the rate was 20%.
- Five City Council districts (8, 14, 15, 16, and 17) encompassing East Harlem and the south and central West Bronx had poverty rates of 35%–40%.
- In one-third of City Council districts, more than one out of every four people lived in poverty (25%).
To effectively reduce the homeless family census, the factors which keep families poor, such as low educational attainment and limited job skills, must be directly addressed.
xxx
xxx
xxx
Appendix
Glossary of Terms
Additional Reasons for Shelter Application and Eligibility
Additional reasons families were found eligible for shelter included ACS-Related, Crime Situation, Immediate Return, Financial Strain, Lockout, Other, and Unlivable Conditions. Additional reasons for shelter application included Add-On Child, Crime Situation, Discharge from Medical Hospital, Discharge from Non-Hospital Facility/Program, DV from HRA Shelter, Fire/Flood/Other Disaster, Foreclosure, Hurricane Sandy, Left Facility/Program on Own Accord, Left Facility Against Medical Advice, Medical Reason, Newborn, Other, Prior Application Closed in Error, Recently Aged Out of Foster Care, Referred by Agency, Released from Jail/Rikers, Released from Prison, Returning Veteran, Sanctioned, Street Homeless, Unlivable Conditions, and Vacate Order.
Child Poverty
Children under the age of 18 living in households that are earning below the Federal Poverty Level (see “Poverty”).1
Educational Attainment
The highest level of education that a person has received. Educational attainment in this On the Map is limited to people aged 25 or older and is divided into the following categories: Less than High School, High School Diploma or High School Equivalency, and More than High School (includes Some College or Associate’s Degree, Bachelor’s Degree, and Advanced Degree).
Elementary School
Kindergarten through 5th grade.
Family Homelessness
Homeless families are defined by two separate categories: “families with children” are one- or two- parent households with children under 21, while “adult families” consist of couples or related family members without children under 21. Families with children and adult families have separate shelter systems and must be screened for eligibility upon applying for shelter, although the law requires that they be temporarily housed during this process. Prior to 2008, data that separate families with children and adult families are not available.2
1 U.S. Census Bureau, American Community Survey and Puerto Rico Community Survey 2014 Subject Definitions.
2 New York City Department of Homeless Services, Data Dashboard Category Definitions, FY 2012.
Family Homeless Shelter
There are three different categories of family shelters serving New York City Department of Homeless Services (DHS) clients with children: Tier II shelters, cluster site apartments, and hotels. The level and availability of social services, including child care and case management, at each shelter location varies greatly.1
Cluster Site Apartments: DHS utilizes space in privately-owned residential buildings that house both rent-paying tenants and DHS clients or exclusively DHS clients. Cluster site apartments were found by the New York City Department of Investigations to be the worst maintained and most poorly monitored of all three types of family shelters, as well as offering the least adequate social services to families. Many cluster site apartments do not have contracts with the City.2
Hotels: DHS utilizes private hotel capacity to shelter homeless families. These hotels are for-profit institutions that do not operate under City contracts. Hotel operators provide private rooms with kitchenettes and generally limited services. In some instances, individual rooms are rented in hotels and motels on a per diem basis.3
Tier II Shelters: Typically the best maintained of all types of family shelters with the most social services to occupants. Most Tier II shelters are run by nonprofit organizations in privately-owned buildings, operate under contracts with the City, and are regulated by both the city and state. Shelter operators provide private rooms for homeless families, along with kitchen facilities or food service.4
Family Educational Rights and Privacy Act (FERPA)
A federal law that protects the privacy of student education records for schools that receive applicable program funds from the U.S. Department of Education.5
Family Shelter Eligibility Rate
The number of families with children found eligible to enter NYC Department of Homeless Services (DHS) shelters per the number of families with children that submitted an application. The rate was calculated by the ICPH using unpublished data from DHS.
Family Shelter Entry Rate
This rate is the number of families with children entering NYC Department of Homeless Services (DHS) shelters per 1,000 families living in the community.
Family Shelter Unit
A self-contained, furnished room in a family shelter. Family shelter capacity is counted in units, which usually serve two to four people, rather than being counted as beds, as is done in the single individual homeless population.6
High School
9th through 12th grade.
1 New York City Department of Investigation, DOI Investigation of 25 City-Run Homeless Shelters for Families Finds Serious Deficiencies, March 12, 2015.
2 Ibid.
3 Ibid.
4 Ibid.
5 U.S. Department of Education, Laws & Guidance: Family Educational Rights and Privacy Act (FERPA), http://www2.ed.gov/policy/gen/guid/fpco/ferpa/index.html (accessed July 15, 2015).
6 New York City Department of Investigation, DOI Investigation of 25 City-run Homeless Shelters for Families Finds Serious Deficiencies, March 12, 2015.
Homebase
A program introduced citywide in 2004 by the New York City Department of Homeless Services to offer homelessness prevention services in individual communities. Offices are operated by contracted social services providers and staffed with caseworkers offering services such as landlord mediation, emergency rental assistance, and benefits enrollment.1
Long-Term Stayers
Individuals and families who have been continuously homeless for at least one year or have had at least 4 episodes of homelessness in the past three years.
Low-Cost Housing Units
Housing units renting for less than $1,500 per month. This threshold was determined by the total maximum rent allowed for a homeless family exiting shelter if they are using a typical subsidy such as a Living in Communities (LINC) program voucher.
Low-Wage Occupations
Occupations with annual median salaries at or below $28,127 in 2013, 150% of the Federal Poverty Level for a family of three.2
Middle School
6th through 8th grade.
Mothers in Poverty with Children Under Five Years Old
A measure of community vulnerability to homelessness, as mothers in poverty with young children are among those most likely to enter shelter.
Overcrowding
Housing is considered overcrowded when there is an average of more than one person per room in the unit, not including bathrooms or most kitchens.3
Poverty (Federal Poverty Level)
The Federal Poverty Level was first calculated to repre- sent the minimum income an average family needed to afford food and other basic expenses. The 2013 Federal Poverty Level for a family of three was $19,530. For a family of four it was $23,550.4
Pre-Kindergarten (pre-K)
All children who turn four before January 1st of a given school year are eligible to apply for New York City’s Pre-Kindergarten Program. Programs are operated by both the New York City Department of Education and community-based organizations.5
Public Assistance
Public assistance is a monthly cash payment adminis- tered through the New York City Human Resources Ad- ministration/Department of Social Services (HRA/DSS). Families found eligible can receive assistance for up to five years through the federal Temporary Assistance to Needy Families (TANF) Program, after which aid can be converted to New York State’s Safety Net Program.6
1 New York City Department of Homeless Services, “Homebase,” http://www1.nyc.gov/site/ dhs/prevention/homebase.page, accessed March 18, 2016.
2 U.S. Census Bureau, Poverty Thresholds, 2013.
3 U.S. Census Bureau, American Community Survey and Puerto Rico Community Survey 2014 Subject Definitions.
4 U.S. Census Bureau, Poverty Thresholds, 2013.
5 New York City Department of Education, “Pre-Kindergarten,” http://schools.nyc.gov/ChoicesEnrollment/PreK/default.htm, accessed March 18, 2016.
6 New York City Human Resources Administration/Department of Social Services, “Cash Assistance,” http://www1.nyc.gov/site/hra/help/cash-assistance.page, accessed March 18, 2016
Reason for Shelter Application
The primary reason that a family lists on their application to enter a New York City Department of Homeless Services (DHS) shelter. DHS investigates this reason by examining documents, visiting former homes, and/ or interviewing the applicant’s family and friends. If no other housing is deemed viable, then the family is found eligible to enter a shelter.1
Discord: Physical harm inflicted among family members that is not judged to be domestic violence.
Domestic Violence: Physical harm inflicted between intimate partners. In New York City, almost half (47%) of all homeless heads of households had experienced domestic violence during their adult lives.2
Eviction: Forcing a tenant out by legal process.
Reason for Shelter Eligibility/Entry
The primary reason that a family is found eligible to enter a New York City Department of Homeless Services (DHS) shelter, based on the DHS investigation. A family’s reason for shelter entry does not necessarily match their initial reason for applying to shelter.
Domestic Violence: See “Reason for Shelter Application.”
Eviction: See “Reason for Shelter Application.”
Immediate Return: Families who left a shelter, usually due to eligibility reasons like missing documentation, and reapplied within a very short time.
Overcrowding: See “Overcrowding.”
Rent Burden
Rent burden generally describes the situation in which renters pay such a high percentage of their monthly income for housing that paying for other basic living expenses becomes difficult. When renters pay 30% or more of their income to rent, they are considered “rent burdened,” and at 50% or more, they are “severely rent burdened.”3
Repeat Entrant
Individuals and families who are entering a New York City Department of Homeless Services shelter for the second, third, or more time.
Single Adult Homeless Shelter
Like family shelters, most single adult homeless shelters contract with the City but are privately owned. There is a wider variety in the types of facilities available to singles, including shelters that specialize in adults within specific age groups, adults dealing with substance abuse or mental illness, or veterans.4
1 New York City Independent Budget Office, The Rising Number of Homeless Families in NYC, 2002 -2012: A Look at Why Families Were Granted Shelter, the Housing They Had Lived in & Where They Came From, November 2014.
2 The Institute for Children, Poverty, and Homelessness, The Hidden Migration: Why New York City Shelters Are Overflowing With Families, April 2002.
3 U.S. Census Bureau, American Community Survey and Puerto Rico Community Survey 2014 Subject Definitions.
4 New York City Department of Investigation, DOI Investigation of 25 City-Run Homeless Shelters for Families Finds Serious Deficiencies, March 12, 2015.
Student Homelessness
The New York City Department of Education defines a student as homeless who lacks a fixed, regular, and adequate nighttime residence. Homeless students include, but are not limited to, the two main categories used in On the Map: The Dynamics of Family Homelessness in New York City.1
Doubled up: Students living with another family or other person due to loss of housing or economic hardship.
Sheltered: Students living in City-funded or City-operated emergency or transitional shelter.
Unemployment
Civilians 16 years or older who are not working, despite actively searching for work and being able to start a job.2